Embed Size (px)
Citation preview
Proficiency Test Report AQA 18-01 Methamphetamine May 2018

i
ACKNOWLEDGMENTS
This study was conducted by the National Measurement Institute (NMI). Support funding was provided by the Australian Government Department of Industry, Innovation and Science.
I would like to thank the management and staff of the participating laboratories for supporting the study. It is only through widespread participation that we can provide an effective service to laboratories. The assistance of the following NMI staff members in the planning, conduct and reporting of the study is acknowledged. Raluca Iavetz
Lesley Johnston Alexander Sadler
Paul Armishaw
Manager, Chemical Reference Values 105 Delhi Rd, Riverside Corporate Park, North Ryde NSW 2113 Phone: 61-2-9449 0149 [email protected]
Accredited for compliance with ISO/IEC 17043
ii
TABLE OF CONTENTS
SUMMARY 1 1 INTRODUCTION 2
1.1 NMI Proficiency Testing Program 2 1.2 Study Aims 2 1.3 Study Conduct 2
2 STUDY INFORMATION 3 2.1 Study Timetable 3 2.2 Participation 3 2.3 Test Material Specification 3 2.4 Laboratory Code 3 2.5 Test Sample Homogeneity 3 2.6 Sample Dispatch and Receipt 3 2.7 Instructions to Participants 4 2.8 Interim Report 4
3 PARTICIPANT LABORATORY INFORMATION 5 3.1 Test Method Summaries 5 3.2 Reported Basis of Participants’ Measurement Uncertainty Estimates 7 3.3 Details of Participant Calibration Standard 10 3.4 Participants’ Comments 11
4 PRESENTATION OF RESULTS AND STATISTICAL ANALYSIS 12 4.1 Results Summary 12 4.2 Assigned Value 12 4.3 Between-Laboratory Coefficient of Variation 12 4.4 Target Standard Deviation 13 4.5 z-Score 13 4.6 En-Score 13 4.7 Traceability and Measurement Uncertainty 13
5 TABLES AND FIGURES 14 6 DISCUSSION OF RESULTS 22
6.1 Assigned Value 22 6.2 Measurement Uncertainty Reported by Participants 22 6.3 z-Score 22 6.4 En-Score 24 6.5 Identification of Cutting Agent 24 6.6 Participants’ Analytical Methods 25 6.7 Summary of participation and performance in Methamphetamine Studies 28
7 REFERENCES 29 APPENDIX 1 - PARTICIPANT LABORATORIES 30 APPENDIX 2 - MEASUREMENT UNCERTAINTY OF THE ASSIGNED VALUE 31 APPENDIX 3 - ACRONYMS AND ABBREVIATIONS 32
AQA 18-01 Methamphetamine 1
SUMMARY
AQA 18-01 was conducted in March/April 2018. Three test samples of methamphetamine hydrochloride were sent to forty laboratories. Two laboratories requested two sets of the test samples. Forty-two sets of results were submitted by the due date.
Test samples were prepared at the NMI laboratory in Sydney using methamphetamine hydrochloride synthesised by NMI.
The assigned values were the reference values determined by quantitative nuclear magnetic resonance spectrometry (QNMR) with maleic acid (NMI certified reference material QNMR010) as internal standard. Traceability: The reference values are traceable to the SI through Australian Standards for mass via balance calibration certificates and the purity of the NMI maleic acid certified reference material QNMR010.2018.01.
The outcomes of the study were assessed against the aims as follows: assess the proficiency of laboratories measuring methamphetamine in samples
typical of a routine seizure; Laboratory performance was assessed by z-score and En-score. Laboratories 1, 6, 7, 9 (reported two results only), 12, 13, 14, 15, 16, 17, 18, 19, 20, 21, 22, 25, 26, 27, 28, 29, 30, 31, 32, 33, 35, 36, 37, 38, 39, 40, 41 and 42 returned satisfactory z and En-scores for all results. Laboratories 4, 23 and 24 returned questionable or unsatisfactory z-scores and En-scores for all samples. Laboratory 2 did not report any quantitative results. Of the 122 results for which z-scores were calculated, 105 (86%) returned |z| 2 indicating a satisfactory performance. Of the 122 results for which |En|-scores were calculated, 108 (89%) returned |En| 1 indicating agreement of the participants’ results with the assigned value within their respective expanded uncertainties.
develop a practical application of traceability and measurement uncertainty and provide participants with information that will assist uncertainty estimates; and
119 results (94%) were reported with an associated expanded uncertainty. Laboratory 4 did not report an uncertainty. This laboratory was not accredited.
Laboratories 1, 3, 13, 27 and 41 reported an identical uncertainty for samples which were of significantly different concentrations.
The magnitude of reported uncertainties was within the range 0.13% to 15% relative.
test the ability of participants to identify a cutting agent commonly found in controlled drug preparation
Samples were prepared from methamphetamine hydrochloride approximately 79.5% base (m/m) (sample S1), and from methamphetamine hydrochloride approximately 78.5% base (m/m) (samples S2 and S3), both supplied by the NMI Chemical Reference Materials Laboratory. The study coordinator left Sample S1 uncut, added glucodin in Sample S2 and nicotinamide (niacinamide) in Sample S3. Only six participants correctly reported both glucodin in Sample S2 and nicotinamide in Sample S3.
AQA 18-01 Methamphetamine 2
1 INTRODUCTION 1.1 NMI Proficiency Testing Program
The National Measurement Institute (NMI) is responsible for Australia’s national measurement infrastructure, providing a range of services including a chemical proficiency testing program. Proficiency testing (PT) is: ‘evaluation of participant performance against pre-established criteria by means of interlaboratory comparison.’1 NMI PT studies target chemical testing in areas of high public significance such as trade, environment, law enforcement and food safety. NMI offers studies in:
pesticide residues in fruit and vegetables, soil and water; petroleum hydrocarbons in soil and water; PFAS in water, soil and biota; metals in soil, water, food and pharmaceuticals; controlled drug assay and clandestine laboratory; allergens in food; and folic acid in flour. 1.2 Study Aims
The aims of the study were to:
assess the proficiency of laboratories measuring methamphetamine in samples typical of a routine seizure;
develop a practical application of traceability and measurement uncertainty and provide participants with information that will assist uncertainty estimates; and
test the ability of participants to identify a cutting agent commonly found in controlled drug preparation.
The choice of the test method was left to the participating laboratories. 1.3 Study Conduct
NMI is accredited by the National Association of Testing Authorities, Australia (NATA) to ISO 170431 as a provider of proficiency testing schemes. This controlled drug proficiency test is within the scope of NMI’s accreditation.
The conduct of NMI proficiency tests is described in the NMI Chemical Proficiency Testing Study Protocol.2 The statistical methods used are described in the NMI Chemical Proficiency Testing Statistical Manual.3 These documents have been prepared with reference to ISO 17043 and The International Harmonized Protocol for the Proficiency Testing of Analytical Chemistry Laboratories.4
AQA 18-01 Methamphetamine 3
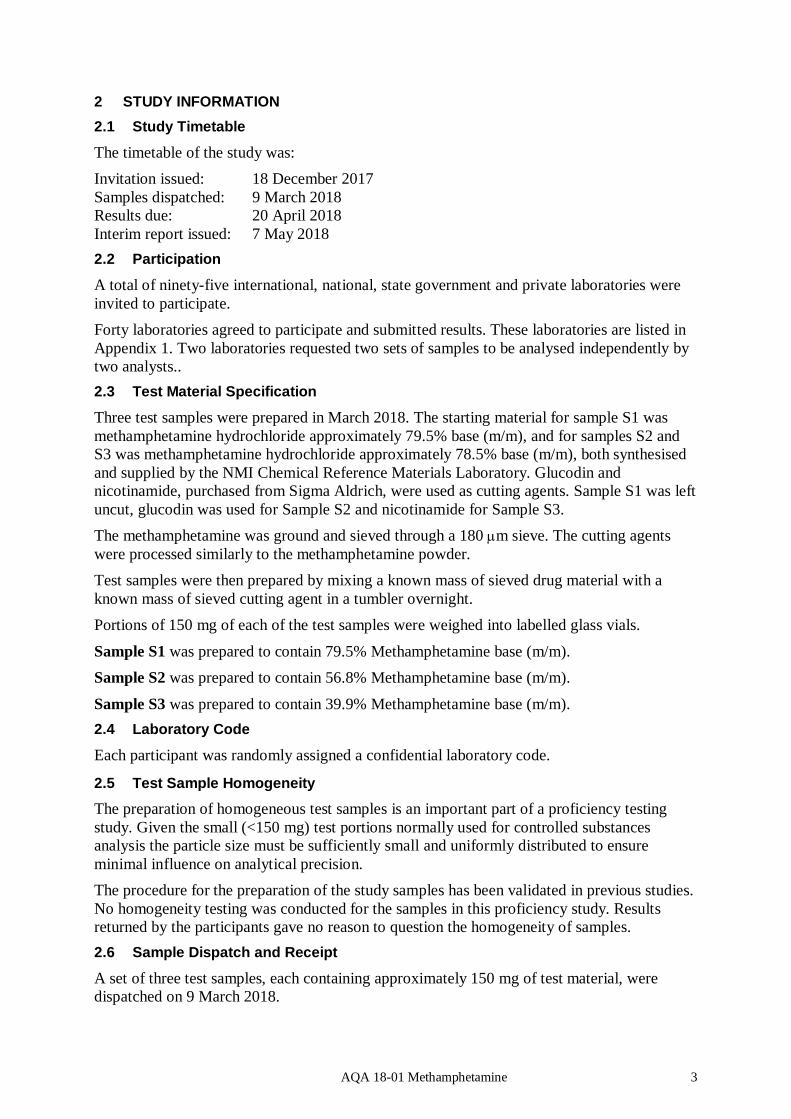
2 STUDY INFORMATION 2.1 Study Timetable
The timetable of the study was: Invitation issued: 18 December 2017 Samples dispatched: 9 March 2018 Results due: 20 April 2018 Interim report issued: 7 May 2018 2.2 Participation
A total of ninety-five international, national, state government and private laboratories were invited to participate. Forty laboratories agreed to participate and submitted results. These laboratories are listed in Appendix 1. Two laboratories requested two sets of samples to be analysed independently by two analysts.. 2.3 Test Material Specification
Three test samples were prepared in March 2018. The starting material for sample S1 was methamphetamine hydrochloride approximately 79.5% base (m/m), and for samples S2 and S3 was methamphetamine hydrochloride approximately 78.5% base (m/m), both synthesised and supplied by the NMI Chemical Reference Materials Laboratory. Glucodin and nicotinamide, purchased from Sigma Aldrich, were used as cutting agents. Sample S1 was left uncut, glucodin was used for Sample S2 and nicotinamide for Sample S3. The methamphetamine was ground and sieved through a 180 m sieve. The cutting agents were processed similarly to the methamphetamine powder. Test samples were then prepared by mixing a known mass of sieved drug material with a known mass of sieved cutting agent in a tumbler overnight. Portions of 150 mg of each of the test samples were weighed into labelled glass vials.
Sample S1 was prepared to contain 79.5% Methamphetamine base (m/m). Sample S2 was prepared to contain 56.8% Methamphetamine base (m/m).
Sample S3 was prepared to contain 39.9% Methamphetamine base (m/m). 2.4 Laboratory Code
Each participant was randomly assigned a confidential laboratory code.
2.5 Test Sample Homogeneity
The preparation of homogeneous test samples is an important part of a proficiency testing study. Given the small (<150 mg) test portions normally used for controlled substances analysis the particle size must be sufficiently small and uniformly distributed to ensure minimal influence on analytical precision. The procedure for the preparation of the study samples has been validated in previous studies. No homogeneity testing was conducted for the samples in this proficiency study. Results returned by the participants gave no reason to question the homogeneity of samples. 2.6 Sample Dispatch and Receipt
A set of three test samples, each containing approximately 150 mg of test material, were dispatched on 9 March 2018.

AQA 18-01 Methamphetamine 4
The following items were packaged with the samples:
a covering letter with instructions for participants; and
a form for participants to confirm the receipt of the test samples. An Excel spreadsheet for the electronic reporting of results was e-mailed to participants. 2.7 Instructions to Participants
Participants were asked to analyse the samples using their routine quantitative method and return the following information:
one result for each sample as % m/m methamphetamine base;
an estimate of the expanded uncertainty associated with the result as % m/m methamphetamine base at the 95% confidence level;
brief detail on how the uncertainty was calculated e.g. uncertainty budget method;
the identity of the cutting agents in all three samples, if part of routine analysis;
origin and stated purity of the analytical reference standard used;
brief summary of the quantitative method used;
the completed results sheet by 20 April 2018, as late results cannot be included in the report; and
any other comments. 2.8 Interim Report
An interim report was emailed to all participants on 7 May 2018.

AQA 18-01 Methamphetamine 5
3 PARTICIPANT LABORATORY INFORMATION 3.1 Test Method Summaries
Reported participant method summary is presented for information in Table 1. Table 1 Participant Summary of Test Methods
Lab. Code
Extraction solvent
Internal standard
Calib. points Technique Detector Column
1 Chloroform Nortriptyline 1 GC FID HP5 2 3 Chloroform Nortriptyline 1 GC FID DB5 4 Ethanol Propyl paraben 7 UPLC DAD BEH Shield RP18
5 ACN/MeOH/H2O Analog off metamphetamine 7 UPLC MSMS C-18 coloumn
6 methanol Propylparaben 3 UPLC PDA ACQUITY C-18 7 D2O Maleic Acid QNMR
8 Methanol Prazepam 3 UPLC DAD Acquity UPLC BEH C18 1,7µ 2,1x150 mm
9 Dissolution in acetonitrile/water Methoxyphenamine HCl 3 HPLC DAD Alltima C-18
10 Methanol 5 HPLC DAD Phenomenex C-18-XB
11 Methanol 6 HPLC UV, 225nm
Phenomenex Luna C18, 0.5% DEA pH 8.5/CH3OH
40:60, 1mL/min
12 Isooctane + Ammonium Hydroxide
Dodecane 3 GC FID HP-1MS
13 Methanol Diazepam 6 GC FID J&W 128-5512 14 Chloroform Nortriptyline GC FID HP5 15 Chloroform Nortriptyline 1 GC FID HP5 16 Water None 4 HPLC PDA C18 17 Chloroform Nortriptyline Single GC FID HP5 18 Purified Water Phentermine 1 LC DAD Agilent Zorbax SB-C8
19 D2O maleic acid 1H QNMR
Bruker AVIII
600 with QNP probe
20 Methanol Strychnine 6 UPLC PDA Acquity UPLC BEH Phenyl 1.8 um, 2.1 x 100mm
21 Chloroform Nortriptyline 1 GC FID HP5 22 Chloroform Nortriptyline 1 GC FID DB-5MS
23 water/acetonitrile/n10 sulphuric acid
90:10:1 3 HPLC Diode
Array Shimpack XR-ODS
24 Methanol 1 HPLC DAD Zorbax XDB-C18 (4,6x150 mm)
25 Water 6 UPLC DAD Acquity UPLC® BEH C18 1.7µm 2.1 x 100mm Column
26 Chloroform Nortriptyline 1 GC FID HP5 27 Chloroform Nortriptyline 1 GC FID HP5 28 water 3 LC UV DAD Silica
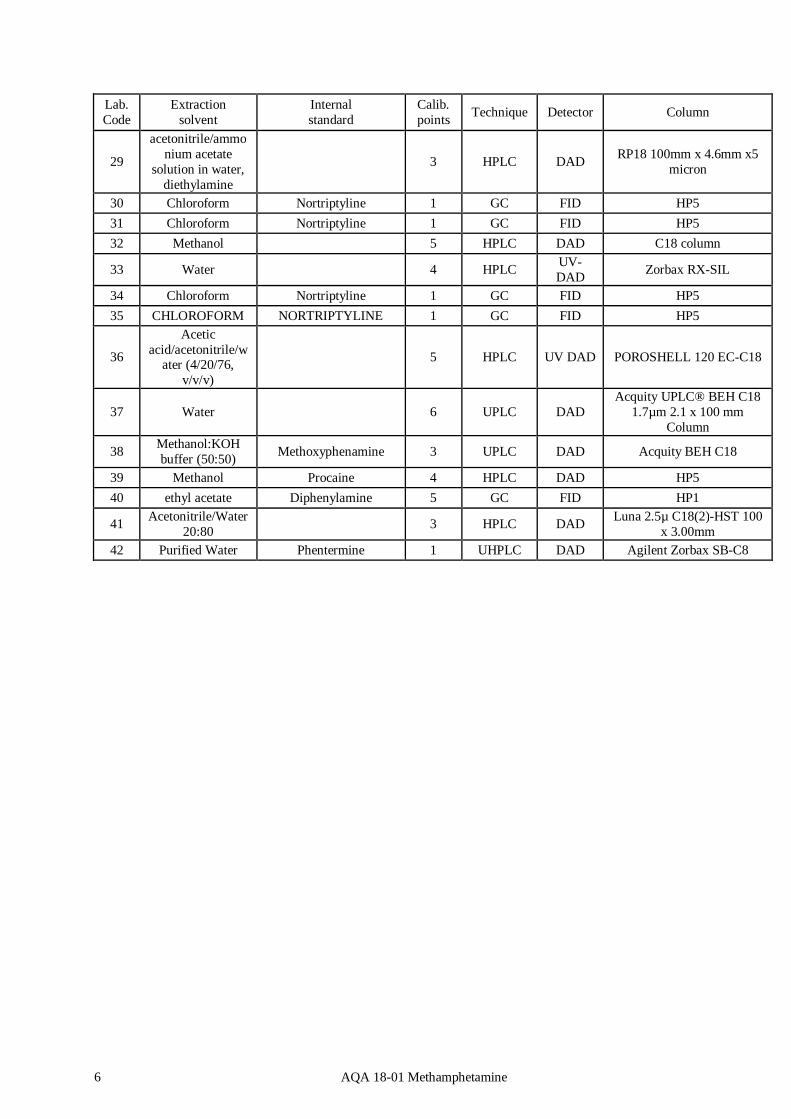
AQA 18-01 Methamphetamine 6
Lab. Code
Extraction solvent
Internal standard
Calib. points Technique Detector Column
29
acetonitrile/ammonium acetate
solution in water, diethylamine
3 HPLC DAD RP18 100mm x 4.6mm x5 micron
30 Chloroform Nortriptyline 1 GC FID HP5 31 Chloroform Nortriptyline 1 GC FID HP5 32 Methanol 5 HPLC DAD C18 column
33 Water 4 HPLC UV-DAD Zorbax RX-SIL
34 Chloroform Nortriptyline 1 GC FID HP5 35 CHLOROFORM NORTRIPTYLINE 1 GC FID HP5
36
Acetic acid/acetonitrile/w
ater (4/20/76, v/v/v)
5 HPLC UV DAD POROSHELL 120 EC-C18
37 Water 6 UPLC DAD Acquity UPLC® BEH C18
1.7µm 2.1 x 100 mm Column
38 Methanol:KOH buffer (50:50) Methoxyphenamine 3 UPLC DAD Acquity BEH C18
39 Methanol Procaine 4 HPLC DAD HP5 40 ethyl acetate Diphenylamine 5 GC FID HP1
41 Acetonitrile/Water 20:80 3 HPLC DAD Luna 2.5µ C18(2)-HST 100
x 3.00mm 42 Purified Water Phentermine 1 UHPLC DAD Agilent Zorbax SB-C8
AQA 18-01 Methamphetamine 7
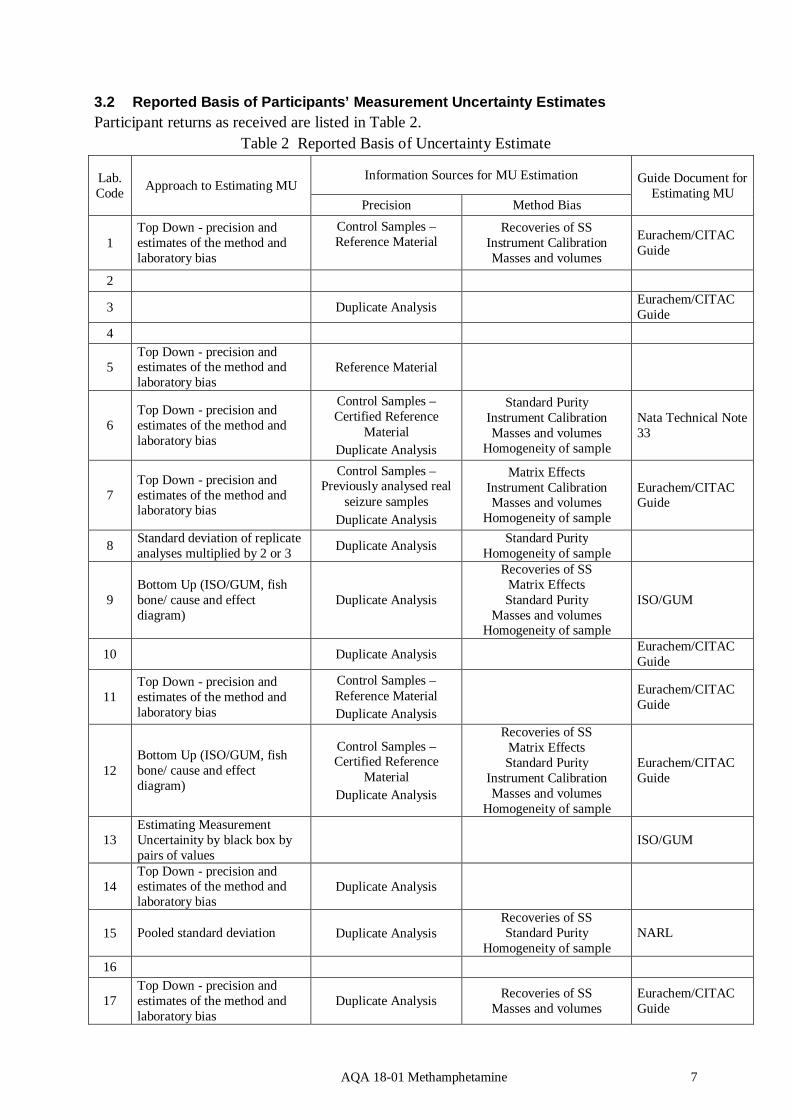
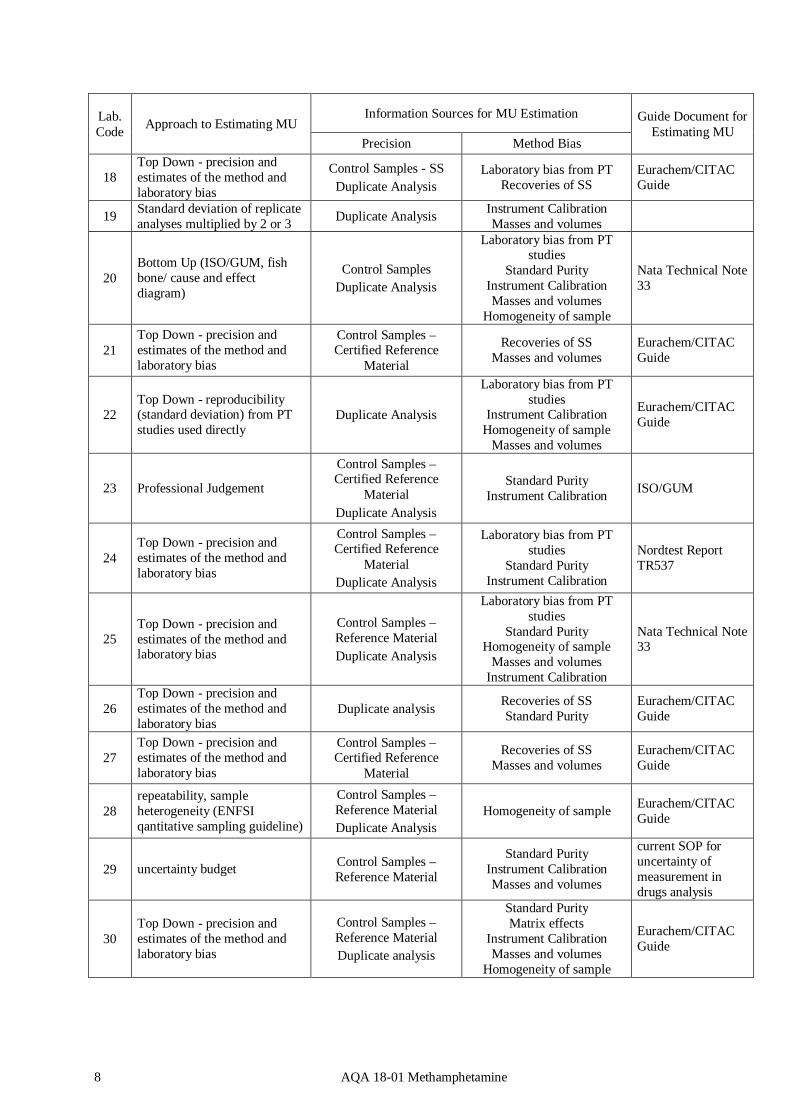
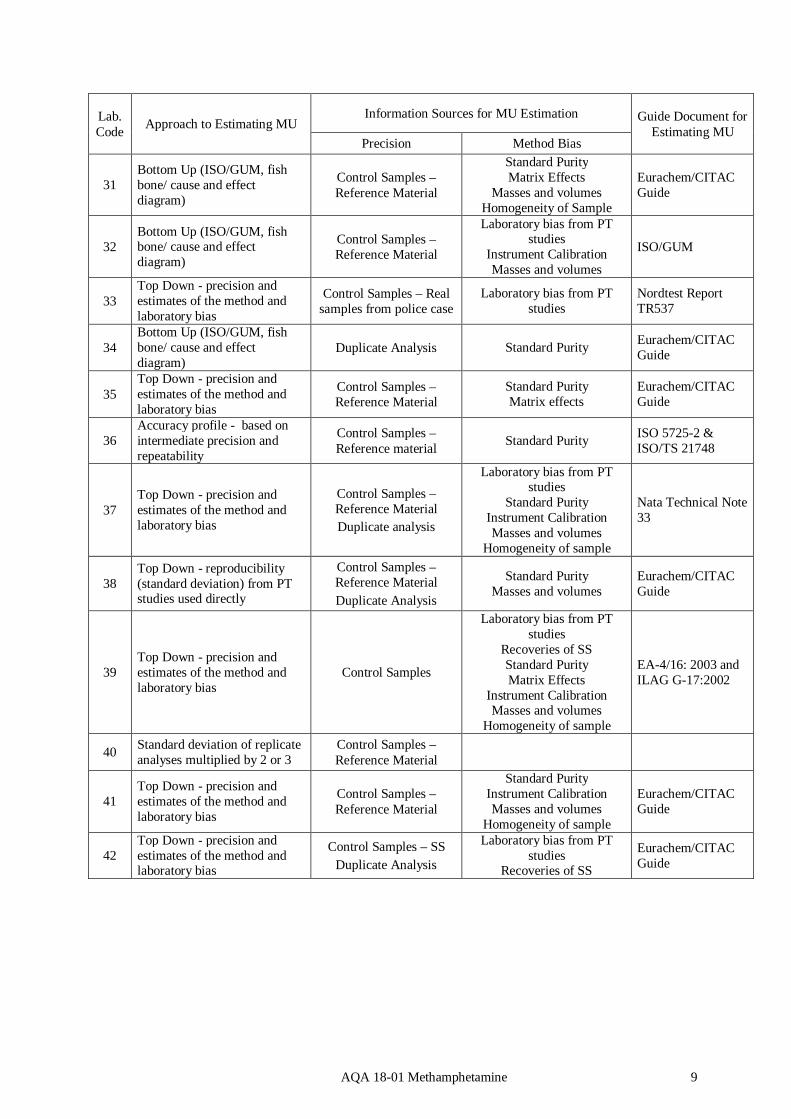
3.2 Reported Basis of Participants’ Measurement Uncertainty Estimates Participant returns as received are listed in Table 2.
Table 2 Reported Basis of Uncertainty Estimate
Lab. Code Approach to Estimating MU
Information Sources for MU Estimation Guide Document for Estimating MU
Precision Method Bias
1 Top Down - precision and estimates of the method and laboratory bias
Control Samples – Reference Material
Recoveries of SS Instrument Calibration Masses and volumes
Eurachem/CITAC Guide
2
3 Duplicate Analysis Eurachem/CITAC Guide
4
5 Top Down - precision and estimates of the method and laboratory bias
Reference Material
6 Top Down - precision and estimates of the method and laboratory bias
Control Samples – Certified Reference
Material Duplicate Analysis
Standard Purity Instrument Calibration Masses and volumes
Homogeneity of sample
Nata Technical Note 33
7 Top Down - precision and estimates of the method and laboratory bias
Control Samples – Previously analysed real
seizure samples Duplicate Analysis
Matrix Effects Instrument Calibration Masses and volumes
Homogeneity of sample
Eurachem/CITAC Guide
8 Standard deviation of replicate analyses multiplied by 2 or 3 Duplicate Analysis Standard Purity
Homogeneity of sample
9 Bottom Up (ISO/GUM, fish bone/ cause and effect diagram)
Duplicate Analysis
Recoveries of SS Matrix Effects Standard Purity
Masses and volumes Homogeneity of sample
ISO/GUM
10 Duplicate Analysis Eurachem/CITAC Guide
11 Top Down - precision and estimates of the method and laboratory bias
Control Samples – Reference Material Duplicate Analysis
Eurachem/CITAC Guide
12 Bottom Up (ISO/GUM, fish bone/ cause and effect diagram)
Control Samples – Certified Reference
Material Duplicate Analysis
Recoveries of SS Matrix Effects Standard Purity
Instrument Calibration Masses and volumes
Homogeneity of sample
Eurachem/CITAC Guide
13 Estimating Measurement Uncertainity by black box by pairs of values
ISO/GUM
14 Top Down - precision and estimates of the method and laboratory bias
Duplicate Analysis
15 Pooled standard deviation Duplicate Analysis Recoveries of SS Standard Purity
Homogeneity of sample NARL
16
17 Top Down - precision and estimates of the method and laboratory bias
Duplicate Analysis Recoveries of SS Masses and volumes
Eurachem/CITAC Guide
AQA 18-01 Methamphetamine 8
Lab. Code Approach to Estimating MU
Information Sources for MU Estimation Guide Document for Estimating MU
Precision Method Bias
18 Top Down - precision and estimates of the method and laboratory bias
Control Samples - SS Duplicate Analysis
Laboratory bias from PT Recoveries of SS
Eurachem/CITAC Guide
19 Standard deviation of replicate analyses multiplied by 2 or 3 Duplicate Analysis Instrument Calibration
Masses and volumes
20 Bottom Up (ISO/GUM, fish bone/ cause and effect diagram)
Control Samples Duplicate Analysis
Laboratory bias from PT studies
Standard Purity Instrument Calibration Masses and volumes
Homogeneity of sample
Nata Technical Note 33
21 Top Down - precision and estimates of the method and laboratory bias
Control Samples – Certified Reference
Material
Recoveries of SS Masses and volumes
Eurachem/CITAC Guide
22 Top Down - reproducibility (standard deviation) from PT studies used directly
Duplicate Analysis
Laboratory bias from PT studies
Instrument Calibration Homogeneity of sample
Masses and volumes
Eurachem/CITAC Guide
23 Professional Judgement
Control Samples – Certified Reference
Material Duplicate Analysis
Standard Purity Instrument Calibration ISO/GUM
24 Top Down - precision and estimates of the method and laboratory bias
Control Samples – Certified Reference
Material Duplicate Analysis
Laboratory bias from PT studies
Standard Purity Instrument Calibration
Nordtest Report TR537
25 Top Down - precision and estimates of the method and laboratory bias
Control Samples – Reference Material Duplicate Analysis
Laboratory bias from PT studies
Standard Purity Homogeneity of sample
Masses and volumes Instrument Calibration
Nata Technical Note 33
26 Top Down - precision and estimates of the method and laboratory bias
Duplicate analysis Recoveries of SS Standard Purity
Eurachem/CITAC Guide
27 Top Down - precision and estimates of the method and laboratory bias
Control Samples – Certified Reference
Material
Recoveries of SS Masses and volumes
Eurachem/CITAC Guide
28 repeatability, sample heterogeneity (ENFSI qantitative sampling guideline)
Control Samples – Reference Material Duplicate Analysis
Homogeneity of sample Eurachem/CITAC Guide
29 uncertainty budget Control Samples – Reference Material
Standard Purity Instrument Calibration Masses and volumes
current SOP for uncertainty of measurement in drugs analysis
30 Top Down - precision and estimates of the method and laboratory bias
Control Samples – Reference Material Duplicate analysis
Standard Purity Matrix effects
Instrument Calibration Masses and volumes
Homogeneity of sample
Eurachem/CITAC Guide
AQA 18-01 Methamphetamine 9
Lab. Code Approach to Estimating MU
Information Sources for MU Estimation Guide Document for Estimating MU
Precision Method Bias
31 Bottom Up (ISO/GUM, fish bone/ cause and effect diagram)
Control Samples – Reference Material
Standard Purity Matrix Effects
Masses and volumes Homogeneity of Sample
Eurachem/CITAC Guide
32 Bottom Up (ISO/GUM, fish bone/ cause and effect diagram)
Control Samples – Reference Material
Laboratory bias from PT studies
Instrument Calibration Masses and volumes
ISO/GUM
33 Top Down - precision and estimates of the method and laboratory bias
Control Samples – Real samples from police case
Laboratory bias from PT studies
Nordtest Report TR537
34 Bottom Up (ISO/GUM, fish bone/ cause and effect diagram)
Duplicate Analysis Standard Purity Eurachem/CITAC Guide
35 Top Down - precision and estimates of the method and laboratory bias
Control Samples – Reference Material
Standard Purity Matrix effects
Eurachem/CITAC Guide
36 Accuracy profile - based on intermediate precision and repeatability
Control Samples – Reference material Standard Purity ISO 5725-2 &
ISO/TS 21748
37 Top Down - precision and estimates of the method and laboratory bias
Control Samples – Reference Material Duplicate analysis
Laboratory bias from PT studies
Standard Purity Instrument Calibration Masses and volumes
Homogeneity of sample
Nata Technical Note 33
38 Top Down - reproducibility (standard deviation) from PT studies used directly
Control Samples – Reference Material Duplicate Analysis
Standard Purity Masses and volumes
Eurachem/CITAC Guide
39 Top Down - precision and estimates of the method and laboratory bias
Control Samples
Laboratory bias from PT studies
Recoveries of SS Standard Purity Matrix Effects
Instrument Calibration Masses and volumes
Homogeneity of sample
EA-4/16: 2003 and ILAG G-17:2002
40 Standard deviation of replicate analyses multiplied by 2 or 3
Control Samples – Reference Material
41 Top Down - precision and estimates of the method and laboratory bias
Control Samples – Reference Material
Standard Purity Instrument Calibration Masses and volumes
Homogeneity of sample
Eurachem/CITAC Guide
42 Top Down - precision and estimates of the method and laboratory bias
Control Samples – SS Duplicate Analysis
Laboratory bias from PT studies
Recoveries of SS
Eurachem/CITAC Guide
AQA 18-01 Methamphetamine 10
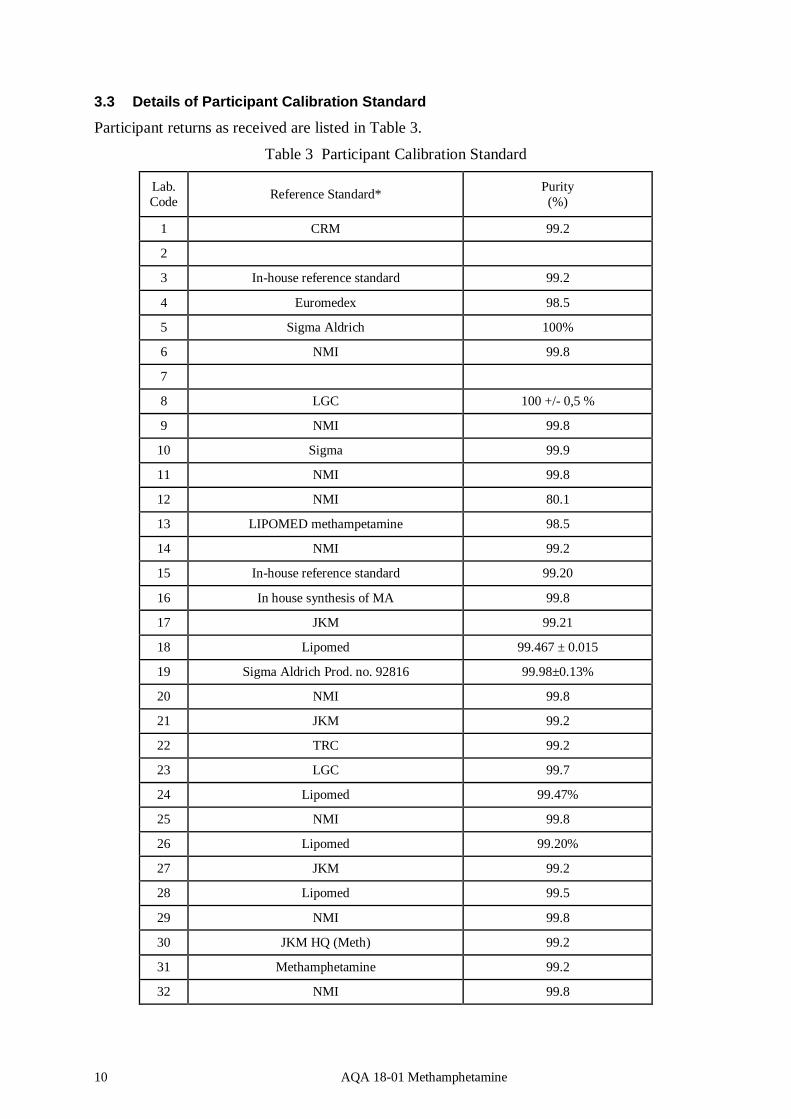
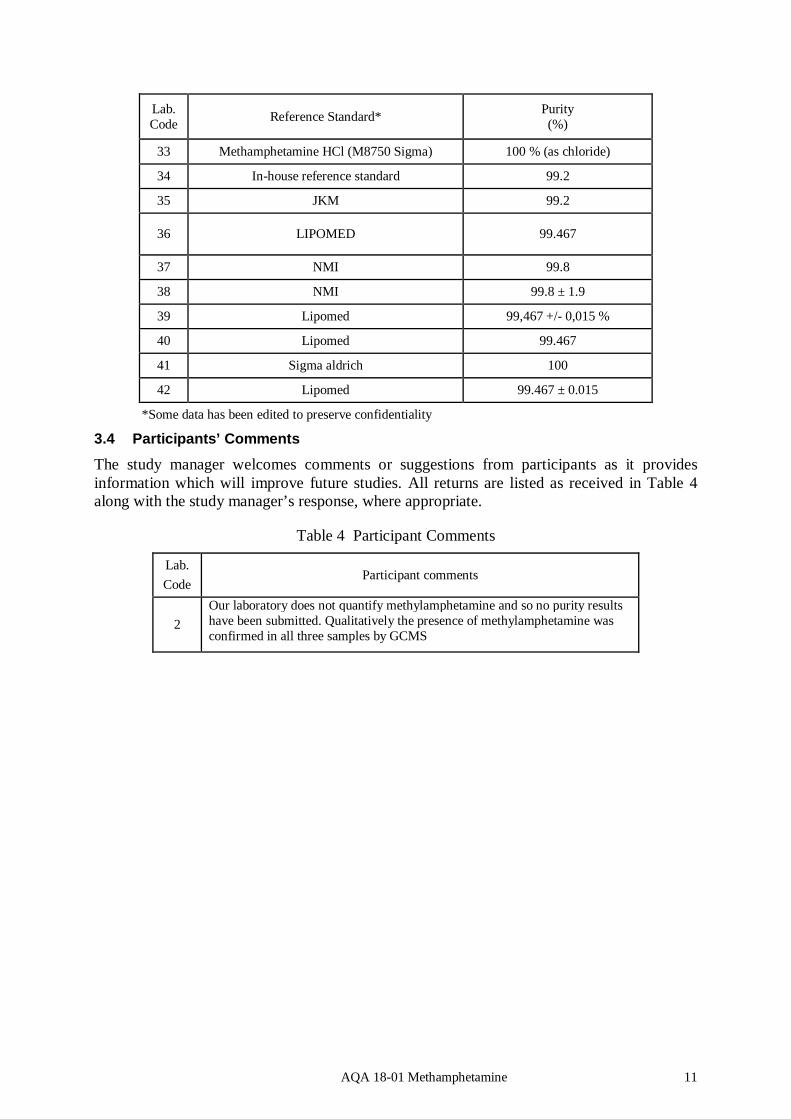
3.3 Details of Participant Calibration Standard
Participant returns as received are listed in Table 3.
Table 3 Participant Calibration Standard
Lab. Code Reference Standard* Purity
(%)
1 CRM 99.2
2
3 In-house reference standard 99.2
4 Euromedex 98.5
5 Sigma Aldrich 100%
6 NMI 99.8
7
8 LGC 100 +/- 0,5 %
9 NMI 99.8
10 Sigma 99.9
11 NMI 99.8
12 NMI 80.1
13 LIPOMED methampetamine 98.5
14 NMI 99.2
15 In-house reference standard 99.20
16 In house synthesis of MA 99.8
17 JKM 99.21
18 Lipomed 99.467 ± 0.015
19 Sigma Aldrich Prod. no. 92816 99.98±0.13%
20 NMI 99.8
21 JKM 99.2
22 TRC 99.2
23 LGC 99.7
24 Lipomed 99.47%
25 NMI 99.8
26 Lipomed 99.20%
27 JKM 99.2
28 Lipomed 99.5
29 NMI 99.8
30 JKM HQ (Meth) 99.2
31 Methamphetamine 99.2
32 NMI 99.8
AQA 18-01 Methamphetamine 11
Lab. Code Reference Standard* Purity
(%)
33 Methamphetamine HCl (M8750 Sigma) 100 % (as chloride)
34 In-house reference standard 99.2
35 JKM 99.2
36 LIPOMED 99.467
37 NMI 99.8
38 NMI 99.8 ± 1.9
39 Lipomed 99,467 +/- 0,015 %
40 Lipomed 99.467
41 Sigma aldrich 100
42 Lipomed 99.467 ± 0.015
*Some data has been edited to preserve confidentiality
3.4 Participants’ Comments
The study manager welcomes comments or suggestions from participants as it provides information which will improve future studies. All returns are listed as received in Table 4 along with the study manager’s response, where appropriate.
Table 4 Participant Comments
Lab. Code
Participant comments
2 Our laboratory does not quantify methylamphetamine and so no purity results have been submitted. Qualitatively the presence of methylamphetamine was confirmed in all three samples by GCMS
AQA 18-01 Methamphetamine 12
4 PRESENTATION OF RESULTS AND STATISTICAL ANALYSIS 4.1 Results Summary
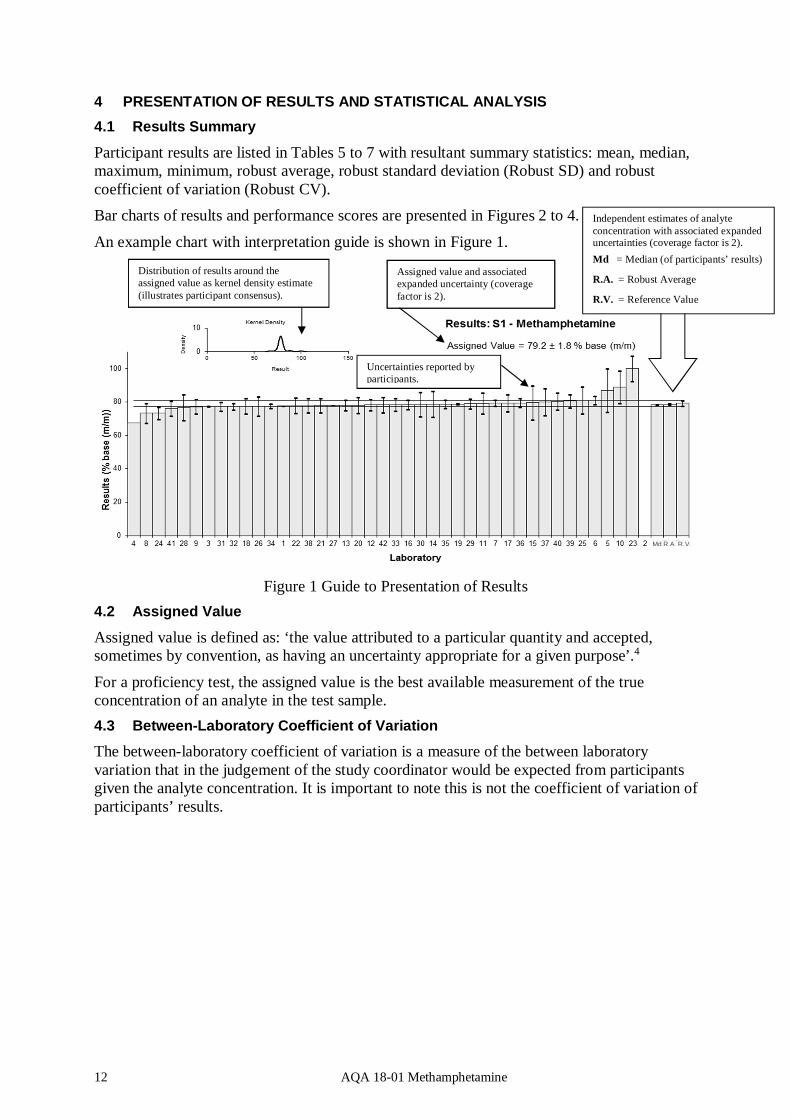
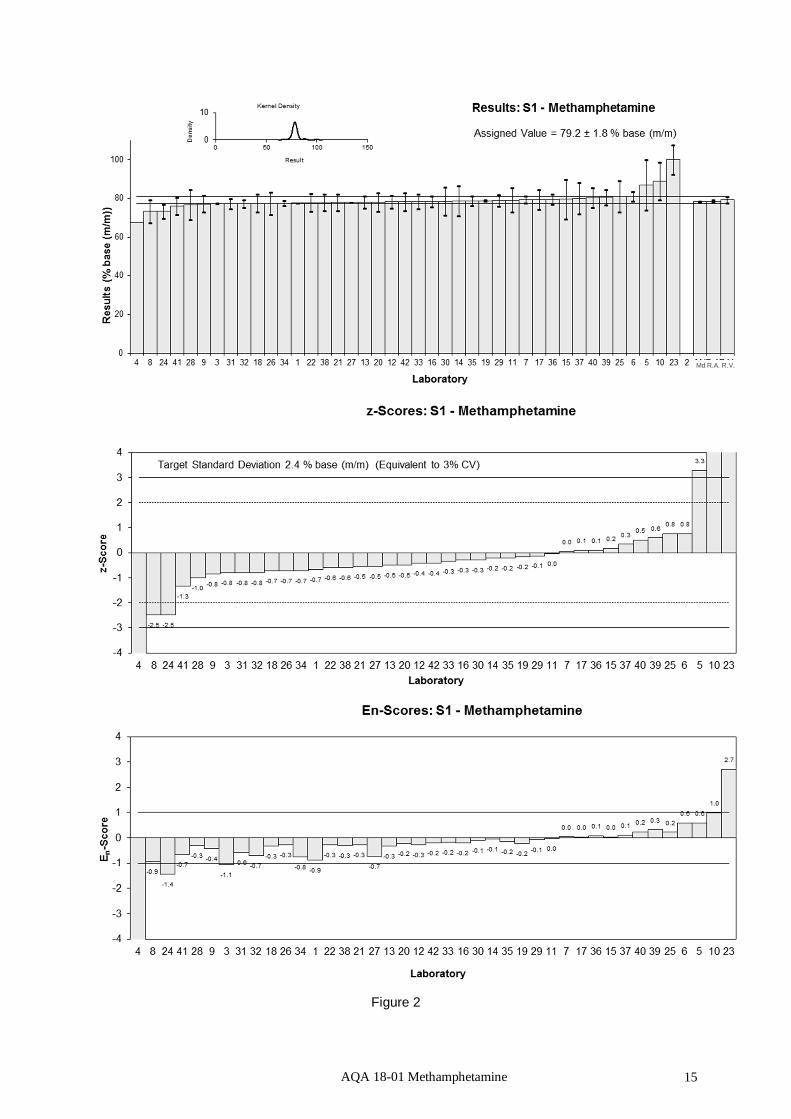
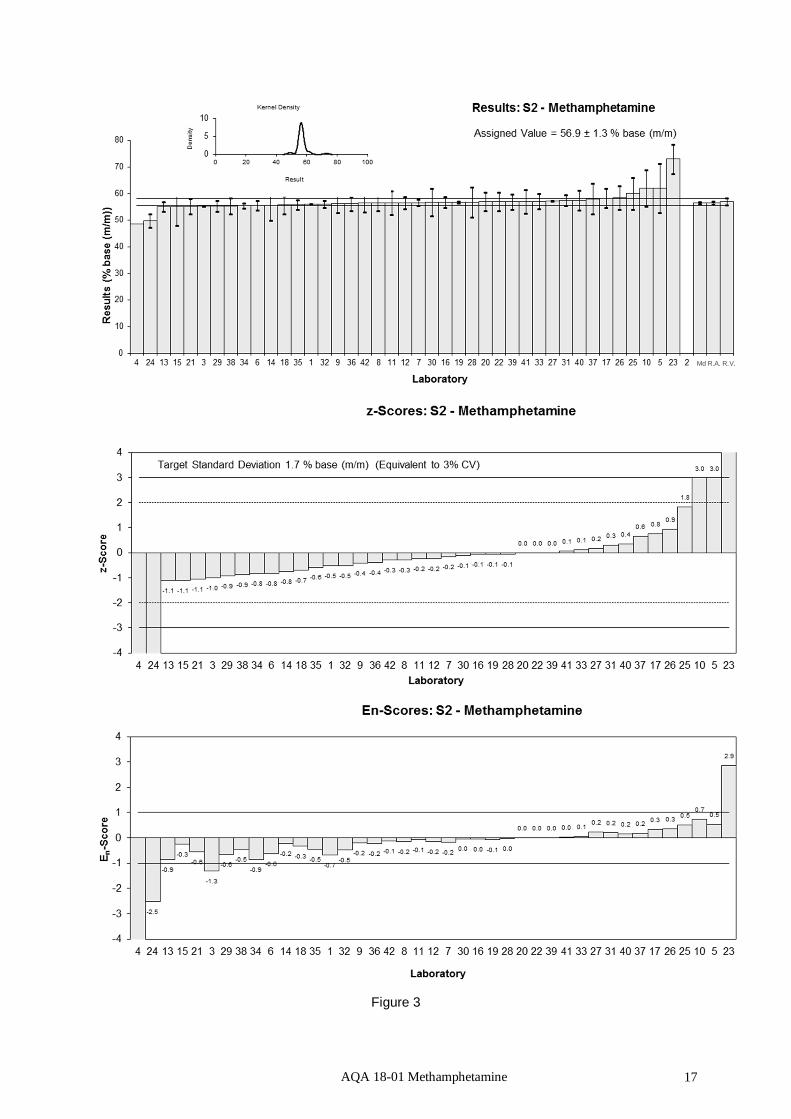
Participant results are listed in Tables 5 to 7 with resultant summary statistics: mean, median, maximum, minimum, robust average, robust standard deviation (Robust SD) and robust coefficient of variation (Robust CV). Bar charts of results and performance scores are presented in Figures 2 to 4.
An example chart with interpretation guide is shown in Figure 1.
Figure 1 Guide to Presentation of Results
4.2 Assigned Value
Assigned value is defined as: ‘the value attributed to a particular quantity and accepted, sometimes by convention, as having an uncertainty appropriate for a given purpose’.4
For a proficiency test, the assigned value is the best available measurement of the true concentration of an analyte in the test sample. 4.3 Between-Laboratory Coefficient of Variation
The between-laboratory coefficient of variation is a measure of the between laboratory variation that in the judgement of the study coordinator would be expected from participants given the analyte concentration. It is important to note this is not the coefficient of variation of participants’ results.
Independent estimates of analyte concentration with associated expanded uncertainties (coverage factor is 2). Md = Median (of participants’ results)
R.A. = Robust Average
R.V. = Reference Value
Assigned value and associated expanded uncertainty (coverage factor is 2).
Uncertainties reported by participants.
Distribution of results around the assigned value as kernel density estimate (illustrates participant consensus).
Md R.A. R.V.
AQA 18-01 Methamphetamine 13
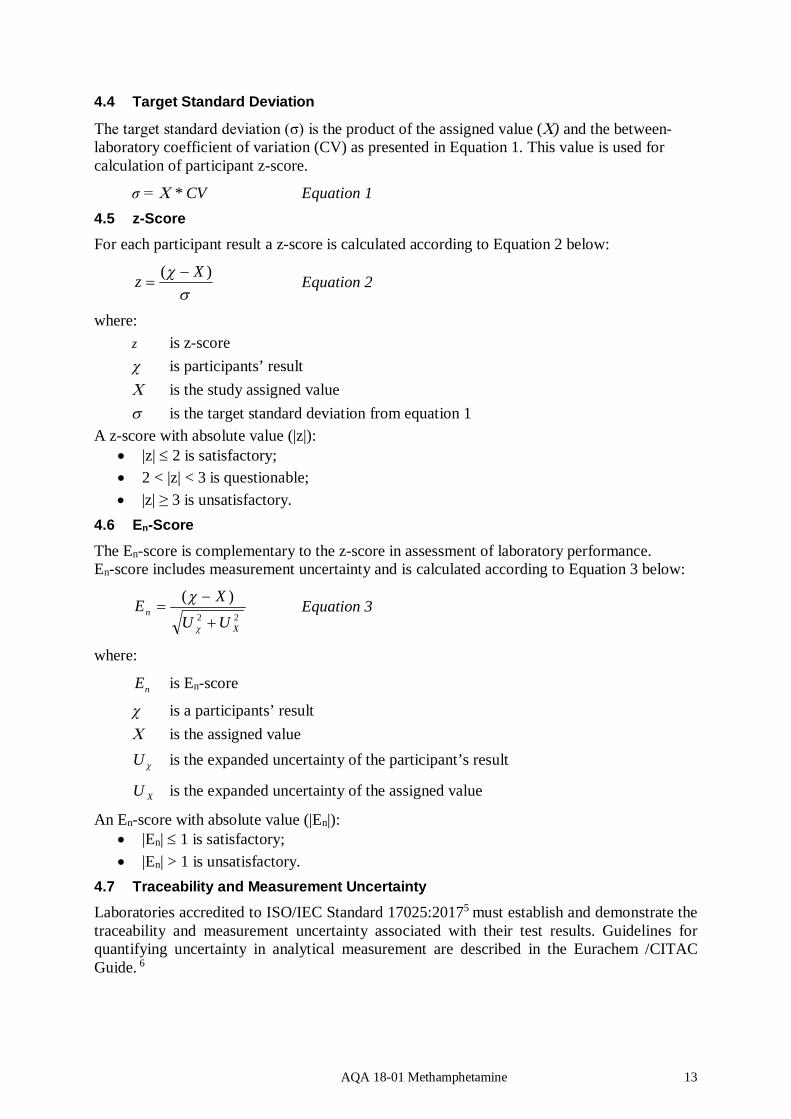
4.4 Target Standard Deviation
The target standard deviation (σ) is the product of the assigned value () and the between-laboratory coefficient of variation (CV) as presented in Equation 1. This value is used for calculation of participant z-score.
σ = * CV Equation 1 4.5 z-Score
For each participant result a z-score is calculated according to Equation 2 below:
)( Xz Equation 2
where: z is z-score is participants’ result is the study assigned value is the target standard deviation from equation 1 A z-score with absolute value (|z|):
|z| 2 is satisfactory; 2 < |z| < 3 is questionable; |z| ≥ 3 is unsatisfactory.
4.6 En-Score
The En-score is complementary to the z-score in assessment of laboratory performance. En-score includes measurement uncertainty and is calculated according to Equation 3 below:
22
)(
X
nUUXE
Equation 3
where:
nE is En-score
is a participants’ result is the assigned value U is the expanded uncertainty of the participant’s result
XU is the expanded uncertainty of the assigned value
An En-score with absolute value (|En|): |En| 1 is satisfactory; |En| > 1 is unsatisfactory.
4.7 Traceability and Measurement Uncertainty
Laboratories accredited to ISO/IEC Standard 17025:20175 must establish and demonstrate the traceability and measurement uncertainty associated with their test results. Guidelines for quantifying uncertainty in analytical measurement are described in the Eurachem /CITAC Guide. 6

AQA 18-01 Methamphetamine 14
5 TABLES AND FIGURES Table 5
Sample Details Sample No. S1 Matrix. Powder Analyte. Methamphetamine Units % base (m/m) Participant Results
Lab Code Result Uncertainty z-Score En-Score 1 77.6 0.1 -0.67 -0.89 2 NT NT 3 77.3 0.1 -0.80 -1.05 4 67.5 NR -4.92 -6.50 5 87 13.1 3.28 0.59 6 81.0 2.5 0.76 0.58 7 79.3 1.74 0.04 0.04 8 73.3 6 -2.48 -0.94 9 77.2 4.4 -0.84 -0.42 10 89 9.79 4.12 0.98 11 79.1 6.3 -0.04 -0.02 12 78.2 3.2 -0.42 -0.27 13 78 3.1 -0.51 -0.33 14 78.7 7.9 -0.21 -0.06 15 79.6 10.3 0.17 0.04 16 78.5 2.8 -0.29 -0.21 17 79.4 5.0 0.08 0.04 18 77.5 4.7 -0.72 -0.34 19 78.8 0.4 -0.17 -0.22 20 78.0 4.9 -0.51 -0.23 21 77.9 4.2 -0.55 -0.28 22 77.8 4.7 -0.59 -0.28 23* 100 7.50 8.75 2.70 24 73.32 3.67 -2.47 -1.44 25 81 8.1 0.76 0.22 26 77.5 5.8 -0.72 -0.28 27 77.9 0.1 -0.55 -0.72 28 76.8 7.7 -1.01 -0.30 29 78.9 3.0 -0.13 -0.09 30 78.5 7.2 -0.29 -0.09 31 77.3 2.7 -0.80 -0.59 32 77.3 2.0 -0.80 -0.71 33 78.4 3.9 -0.34 -0.19 34 77.5 1.36 -0.72 -0.75 35 78.7 2.6 -0.21 -0.16 36 79.43 2.6 0.10 0.07 37 80 8.0 0.34 0.10 38 77.8 4.2 -0.59 -0.31 39 80.6 4 0.59 0.32 40 80.4 5.1 0.51 0.22 41 76 4.5 -1.35 -0.66 42 78.2 4.7 -0.42 -0.20 *After the release of the interim report, laboratory 23 indicated that their results are reported as HCl instead of free base. Statistics Assigned Value 79.2 1.8 Reference Value 79.2 1.8 Robust Average 78.5 0.6 Median 78.2 0.4 Mean 78.9 N 41 Max. 100 Min. 67.5 Robust SD 1.6 Robust CV 2.0%
AQA 18-01 Methamphetamine 15
Figure 2
Md R.A. R.V.
AQA 18-01 Methamphetamine 16
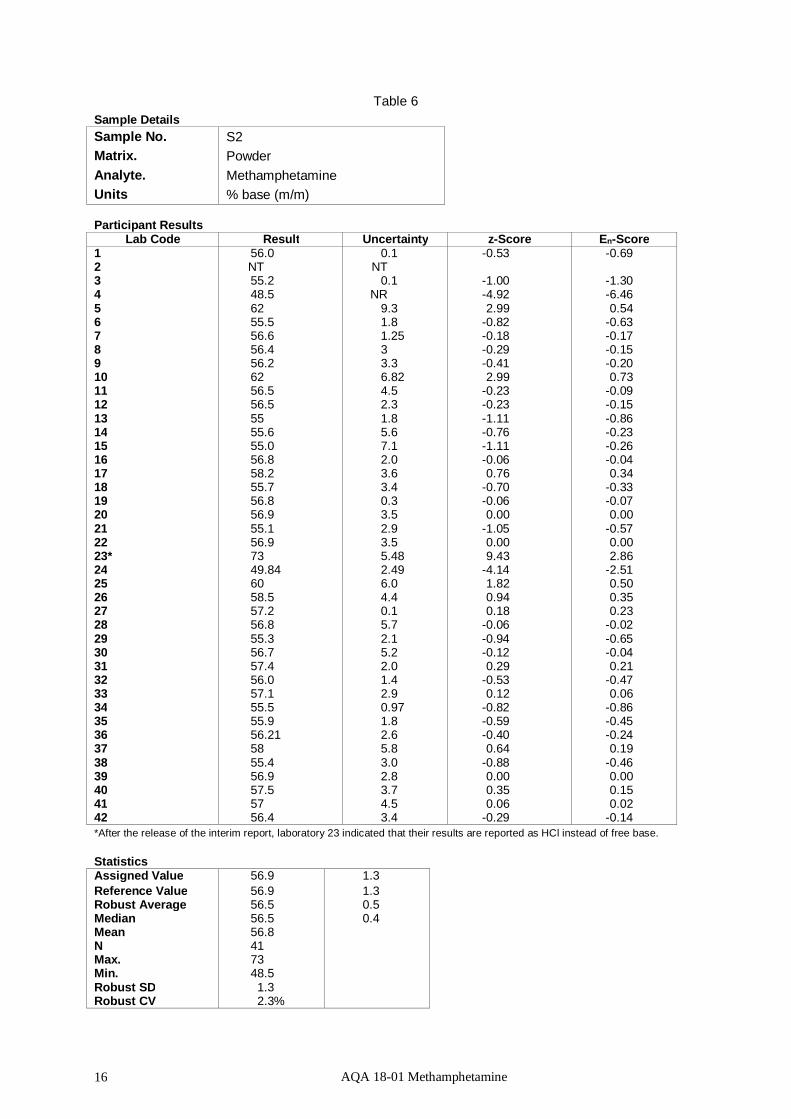
Table 6 Sample Details Sample No. S2 Matrix. Powder Analyte. Methamphetamine Units % base (m/m) Participant Results
Lab Code Result Uncertainty z-Score En-Score 1 56.0 0.1 -0.53 -0.69 2 NT NT 3 55.2 0.1 -1.00 -1.30 4 48.5 NR -4.92 -6.46 5 62 9.3 2.99 0.54 6 55.5 1.8 -0.82 -0.63 7 56.6 1.25 -0.18 -0.17 8 56.4 3 -0.29 -0.15 9 56.2 3.3 -0.41 -0.20 10 62 6.82 2.99 0.73 11 56.5 4.5 -0.23 -0.09 12 56.5 2.3 -0.23 -0.15 13 55 1.8 -1.11 -0.86 14 55.6 5.6 -0.76 -0.23 15 55.0 7.1 -1.11 -0.26 16 56.8 2.0 -0.06 -0.04 17 58.2 3.6 0.76 0.34 18 55.7 3.4 -0.70 -0.33 19 56.8 0.3 -0.06 -0.07 20 56.9 3.5 0.00 0.00 21 55.1 2.9 -1.05 -0.57 22 56.9 3.5 0.00 0.00 23* 73 5.48 9.43 2.86 24 49.84 2.49 -4.14 -2.51 25 60 6.0 1.82 0.50 26 58.5 4.4 0.94 0.35 27 57.2 0.1 0.18 0.23 28 56.8 5.7 -0.06 -0.02 29 55.3 2.1 -0.94 -0.65 30 56.7 5.2 -0.12 -0.04 31 57.4 2.0 0.29 0.21 32 56.0 1.4 -0.53 -0.47 33 57.1 2.9 0.12 0.06 34 55.5 0.97 -0.82 -0.86 35 55.9 1.8 -0.59 -0.45 36 56.21 2.6 -0.40 -0.24 37 58 5.8 0.64 0.19 38 55.4 3.0 -0.88 -0.46 39 56.9 2.8 0.00 0.00 40 57.5 3.7 0.35 0.15 41 57 4.5 0.06 0.02 42 56.4 3.4 -0.29 -0.14 *After the release of the interim report, laboratory 23 indicated that their results are reported as HCl instead of free base. Statistics Assigned Value 56.9 1.3 Reference Value 56.9 1.3 Robust Average 56.5 0.5 Median 56.5 0.4 Mean 56.8 N 41 Max. 73 Min. 48.5 Robust SD 1.3 Robust CV 2.3%
AQA 18-01 Methamphetamine 17
Figure 3
Md R.A. R.V.
AQA 18-01 Methamphetamine 18
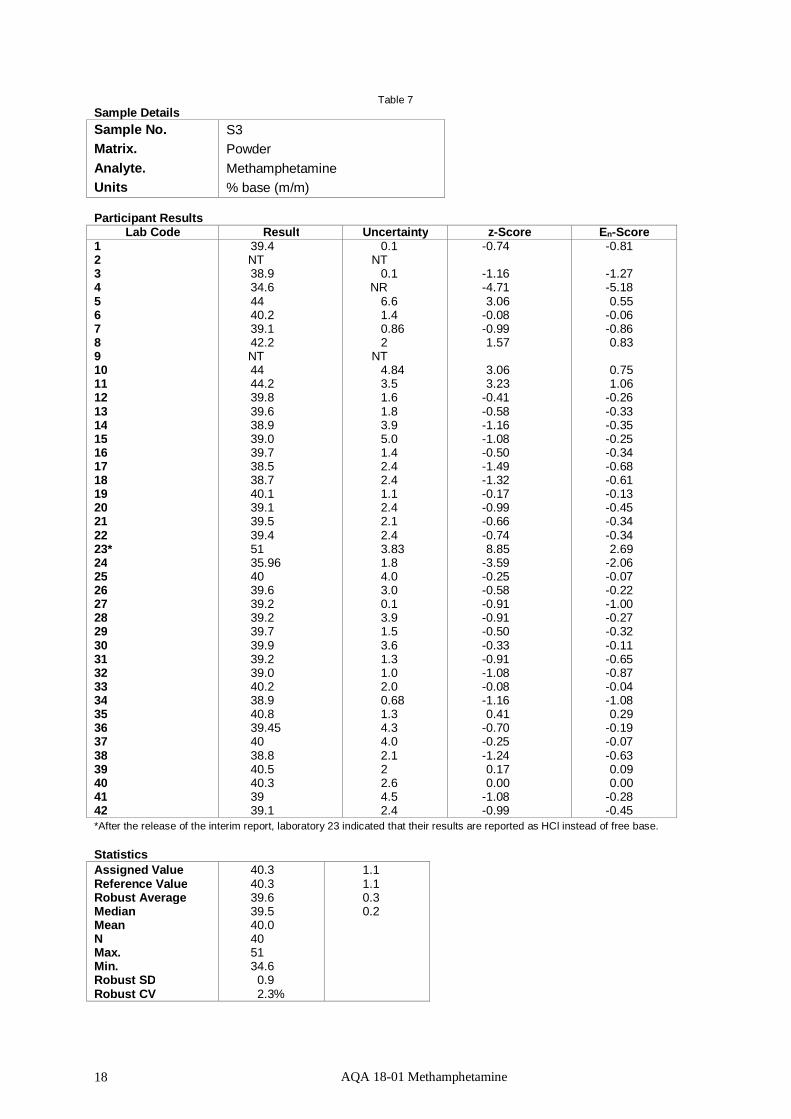
Table 7 Sample Details Sample No. S3 Matrix. Powder Analyte. Methamphetamine Units % base (m/m) Participant Results
Lab Code Result Uncertainty z-Score En-Score 1 39.4 0.1 -0.74 -0.81 2 NT NT 3 38.9 0.1 -1.16 -1.27 4 34.6 NR -4.71 -5.18 5 44 6.6 3.06 0.55 6 40.2 1.4 -0.08 -0.06 7 39.1 0.86 -0.99 -0.86 8 42.2 2 1.57 0.83 9 NT NT 10 44 4.84 3.06 0.75 11 44.2 3.5 3.23 1.06 12 39.8 1.6 -0.41 -0.26 13 39.6 1.8 -0.58 -0.33 14 38.9 3.9 -1.16 -0.35 15 39.0 5.0 -1.08 -0.25 16 39.7 1.4 -0.50 -0.34 17 38.5 2.4 -1.49 -0.68 18 38.7 2.4 -1.32 -0.61 19 40.1 1.1 -0.17 -0.13 20 39.1 2.4 -0.99 -0.45 21 39.5 2.1 -0.66 -0.34 22 39.4 2.4 -0.74 -0.34 23* 51 3.83 8.85 2.69 24 35.96 1.8 -3.59 -2.06 25 40 4.0 -0.25 -0.07 26 39.6 3.0 -0.58 -0.22 27 39.2 0.1 -0.91 -1.00 28 39.2 3.9 -0.91 -0.27 29 39.7 1.5 -0.50 -0.32 30 39.9 3.6 -0.33 -0.11 31 39.2 1.3 -0.91 -0.65 32 39.0 1.0 -1.08 -0.87 33 40.2 2.0 -0.08 -0.04 34 38.9 0.68 -1.16 -1.08 35 40.8 1.3 0.41 0.29 36 39.45 4.3 -0.70 -0.19 37 40 4.0 -0.25 -0.07 38 38.8 2.1 -1.24 -0.63 39 40.5 2 0.17 0.09 40 40.3 2.6 0.00 0.00 41 39 4.5 -1.08 -0.28 42 39.1 2.4 -0.99 -0.45 *After the release of the interim report, laboratory 23 indicated that their results are reported as HCl instead of free base. Statistics Assigned Value 40.3 1.1 Reference Value 40.3 1.1 Robust Average 39.6 0.3 Median 39.5 0.2 Mean 40.0 N 40 Max. 51 Min. 34.6 Robust SD 0.9 Robust CV 2.3%
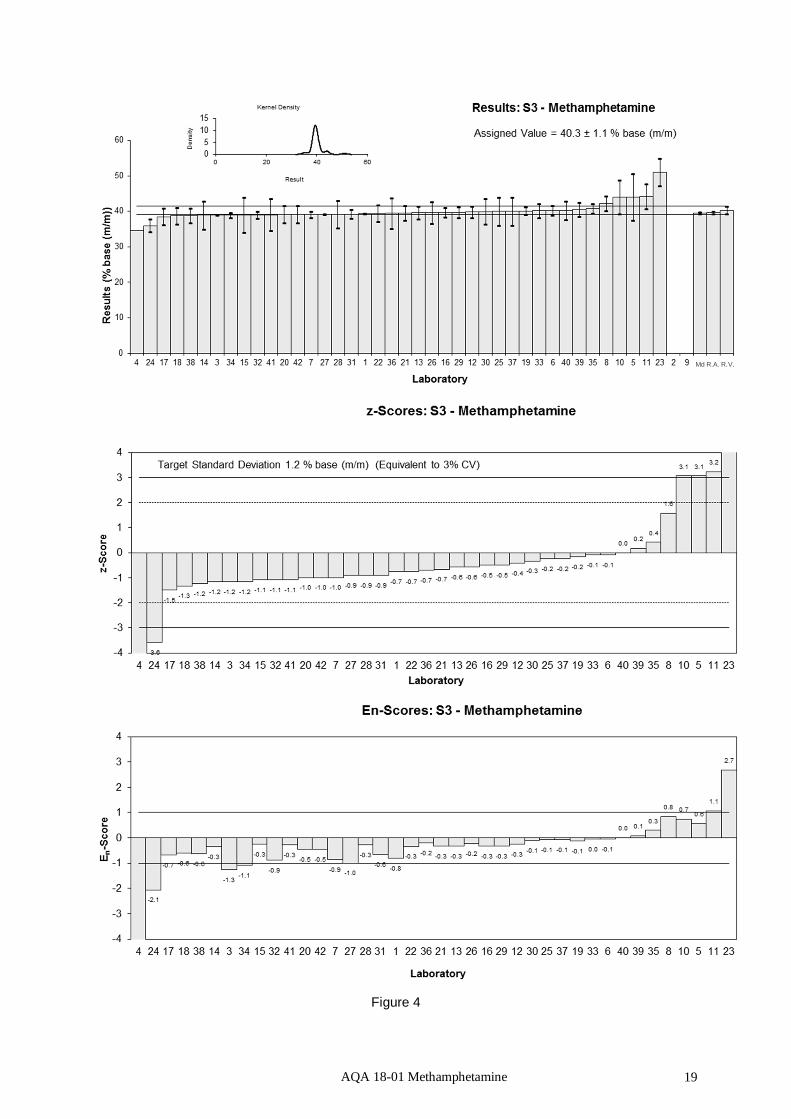
AQA 18-01 Methamphetamine 19
Figure 4
Md R.A. R.V.
AQA 18-01 Methamphetamine 20
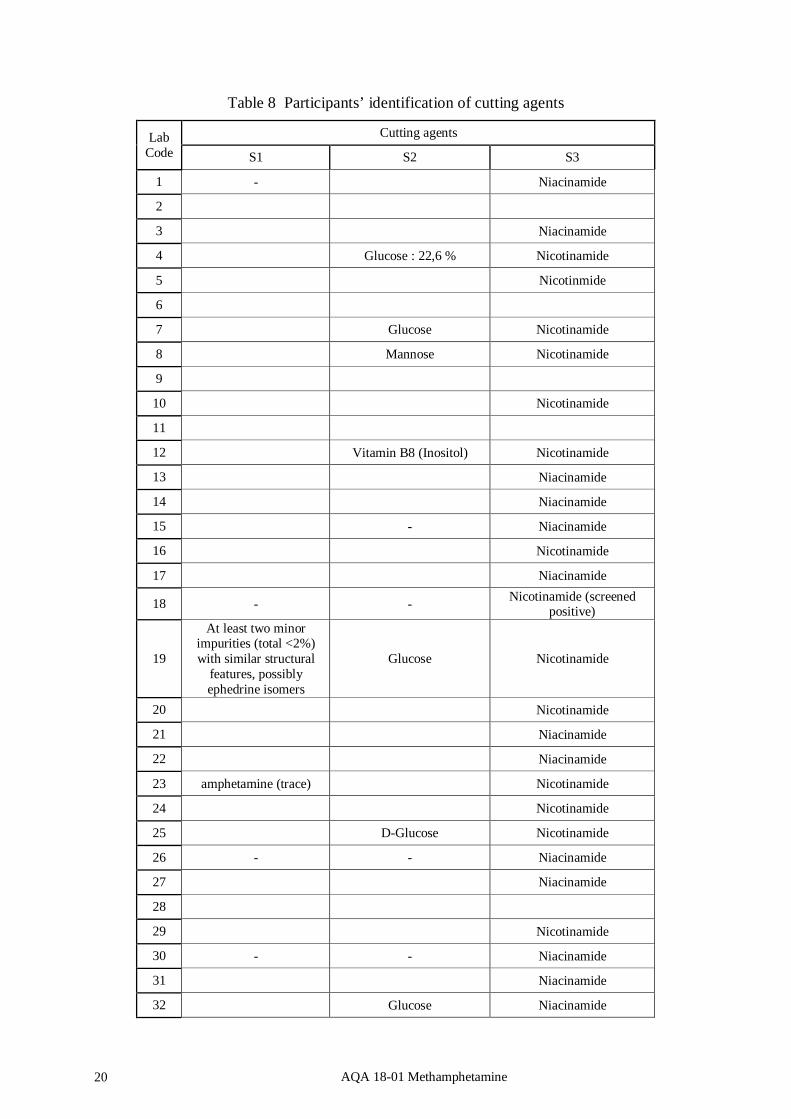
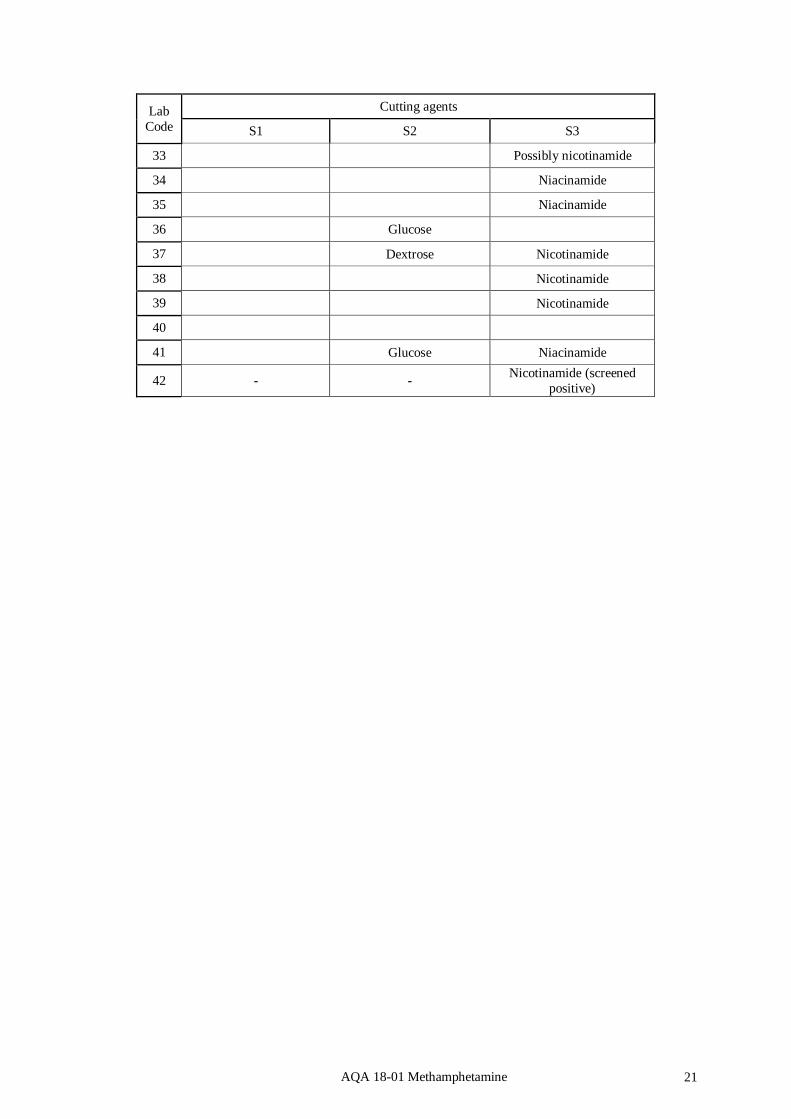
Table 8 Participants’ identification of cutting agents
Lab Code
Cutting agents
S1 S2 S3
1 - Niacinamide
2
3 Niacinamide
4 Glucose : 22,6 % Nicotinamide
5 Nicotinmide
6
7 Glucose Nicotinamide
8 Mannose Nicotinamide
9
10 Nicotinamide
11
12 Vitamin B8 (Inositol) Nicotinamide
13 Niacinamide
14 Niacinamide
15 - Niacinamide
16 Nicotinamide
17 Niacinamide
18 - - Nicotinamide (screened positive)
19
At least two minor impurities (total <2%) with similar structural
features, possibly ephedrine isomers
Glucose Nicotinamide
20 Nicotinamide
21 Niacinamide
22 Niacinamide
23 amphetamine (trace) Nicotinamide
24 Nicotinamide
25 D-Glucose Nicotinamide
26 - - Niacinamide
27 Niacinamide
28
29 Nicotinamide
30 - - Niacinamide
31 Niacinamide
32 Glucose Niacinamide
AQA 18-01 Methamphetamine 21
Lab Code
Cutting agents
S1 S2 S3
33 Possibly nicotinamide
34 Niacinamide
35 Niacinamide
36 Glucose
37 Dextrose Nicotinamide
38 Nicotinamide
39 Nicotinamide
40
41 Glucose Niacinamide
42 - - Nicotinamide (screened positive)
AQA 18-01 Methamphetamine 22
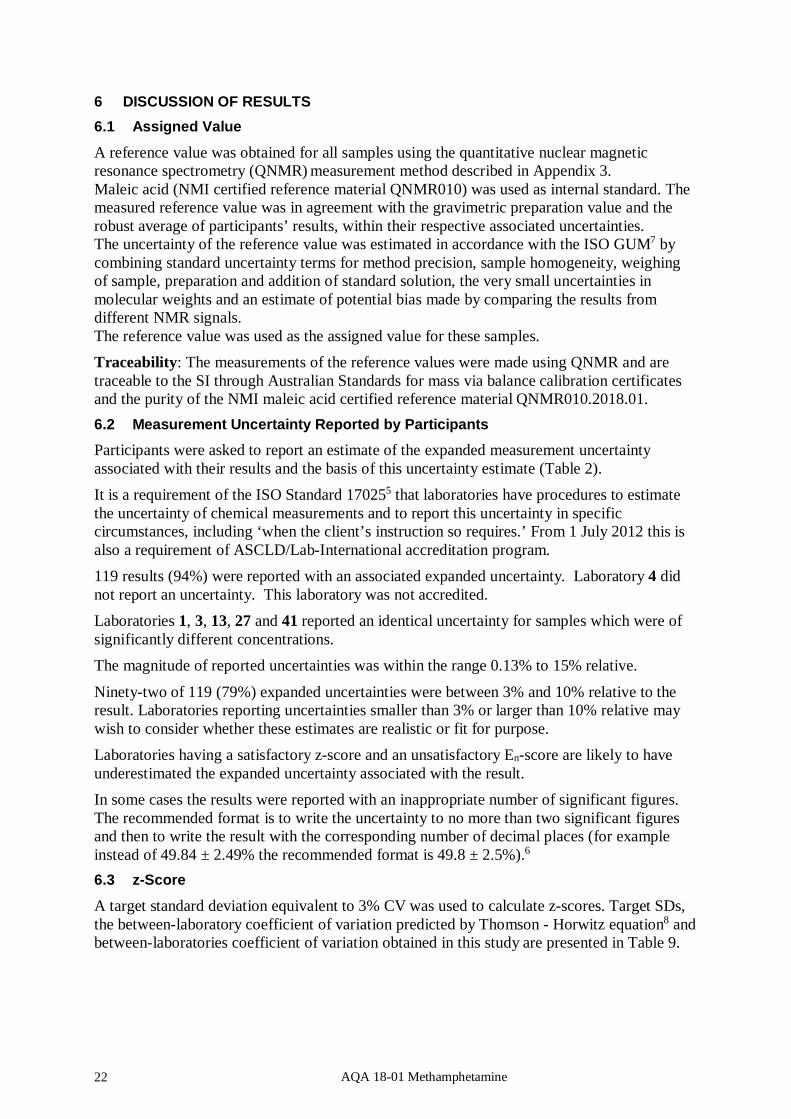
6 DISCUSSION OF RESULTS 6.1 Assigned Value
A reference value was obtained for all samples using the quantitative nuclear magnetic resonance spectrometry (QNMR) measurement method described in Appendix 3. Maleic acid (NMI certified reference material QNMR010) was used as internal standard. The measured reference value was in agreement with the gravimetric preparation value and the robust average of participants’ results, within their respective associated uncertainties. The uncertainty of the reference value was estimated in accordance with the ISO GUM7 by combining standard uncertainty terms for method precision, sample homogeneity, weighing of sample, preparation and addition of standard solution, the very small uncertainties in molecular weights and an estimate of potential bias made by comparing the results from different NMR signals. The reference value was used as the assigned value for these samples. Traceability: The measurements of the reference values were made using QNMR and are traceable to the SI through Australian Standards for mass via balance calibration certificates and the purity of the NMI maleic acid certified reference material QNMR010.2018.01. 6.2 Measurement Uncertainty Reported by Participants
Participants were asked to report an estimate of the expanded measurement uncertainty associated with their results and the basis of this uncertainty estimate (Table 2). It is a requirement of the ISO Standard 170255 that laboratories have procedures to estimate the uncertainty of chemical measurements and to report this uncertainty in specific circumstances, including ‘when the client’s instruction so requires.’ From 1 July 2012 this is also a requirement of ASCLD/Lab-International accreditation program. 119 results (94%) were reported with an associated expanded uncertainty. Laboratory 4 did not report an uncertainty. This laboratory was not accredited. Laboratories 1, 3, 13, 27 and 41 reported an identical uncertainty for samples which were of significantly different concentrations. The magnitude of reported uncertainties was within the range 0.13% to 15% relative.
Ninety-two of 119 (79%) expanded uncertainties were between 3% and 10% relative to the result. Laboratories reporting uncertainties smaller than 3% or larger than 10% relative may wish to consider whether these estimates are realistic or fit for purpose. Laboratories having a satisfactory z-score and an unsatisfactory En-score are likely to have underestimated the expanded uncertainty associated with the result. In some cases the results were reported with an inappropriate number of significant figures. The recommended format is to write the uncertainty to no more than two significant figures and then to write the result with the corresponding number of decimal places (for example instead of 49.84 ± 2.49% the recommended format is 49.8 ± 2.5%).6 6.3 z-Score
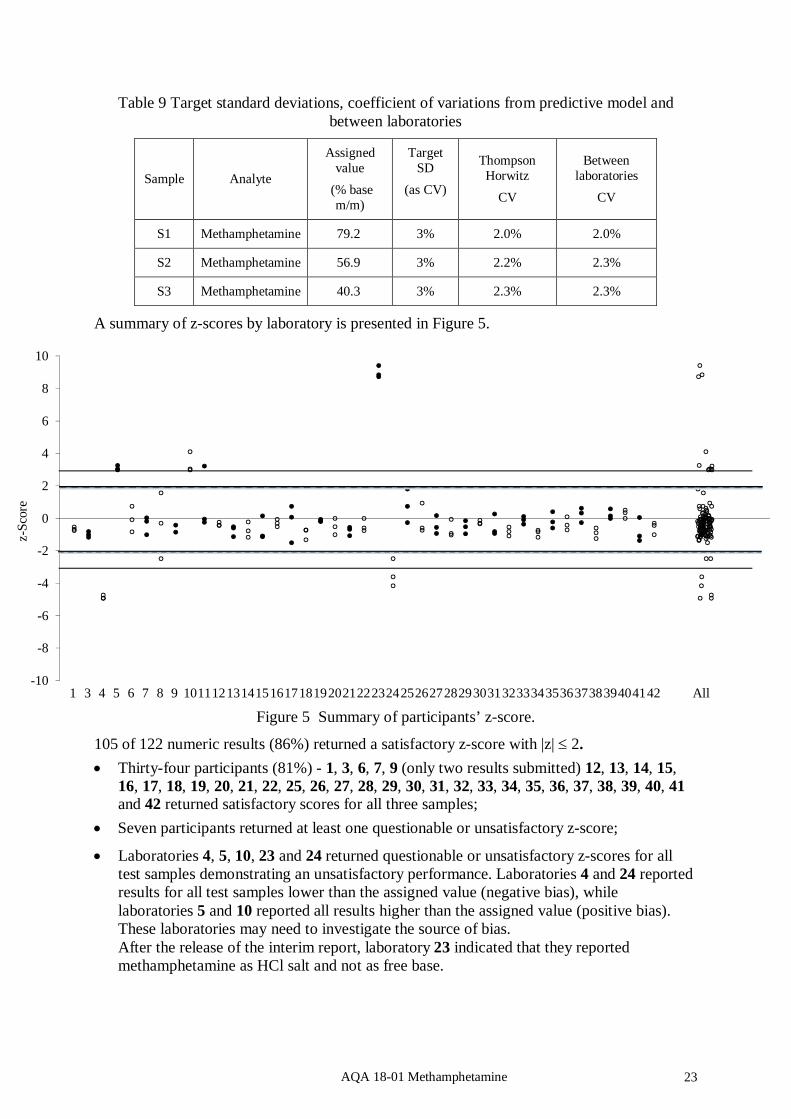
A target standard deviation equivalent to 3% CV was used to calculate z-scores. Target SDs, the between-laboratory coefficient of variation predicted by Thomson - Horwitz equation8 and between-laboratories coefficient of variation obtained in this study are presented in Table 9.
AQA 18-01 Methamphetamine 23
1 3 4 5 6 7 8 9 101112131415161718192021222324252627282930313233343536373839404142 All-10
-8
-6
-4
-2
0
2
4
6
8
10
z-Sc
ore
Table 9 Target standard deviations, coefficient of variations from predictive model and between laboratories
Sample Analyte
Assigned value
(% base m/m)
Target SD
(as CV)
Thompson Horwitz
CV
Between laboratories
CV
S1 Methamphetamine 79.2 3% 2.0% 2.0%
S2 Methamphetamine 56.9 3% 2.2% 2.3%
S3 Methamphetamine 40.3 3% 2.3% 2.3%
A summary of z-scores by laboratory is presented in Figure 5.
Figure 5 Summary of participants’ z-score.
105 of 122 numeric results (86%) returned a satisfactory z-score with |z| 2. Thirty-four participants (81%) - 1, 3, 6, 7, 9 (only two results submitted) 12, 13, 14, 15,
16, 17, 18, 19, 20, 21, 22, 25, 26, 27, 28, 29, 30, 31, 32, 33, 34, 35, 36, 37, 38, 39, 40, 41 and 42 returned satisfactory scores for all three samples;
Seven participants returned at least one questionable or unsatisfactory z-score;
Laboratories 4, 5, 10, 23 and 24 returned questionable or unsatisfactory z-scores for all test samples demonstrating an unsatisfactory performance. Laboratories 4 and 24 reported results for all test samples lower than the assigned value (negative bias), while laboratories 5 and 10 reported all results higher than the assigned value (positive bias). These laboratories may need to investigate the source of bias. After the release of the interim report, laboratory 23 indicated that they reported methamphetamine as HCl salt and not as free base.
AQA 18-01 Methamphetamine 24
1 3 4 5 6 7 8 9 101112 13 1415 16 1718 19 2021 22 2324 25 26 2728 29 3031 32 3334 35 3637 38 3940 41 42 All-10-9-8-7-6-5-4-3-2-10123456789
10
En-S
core
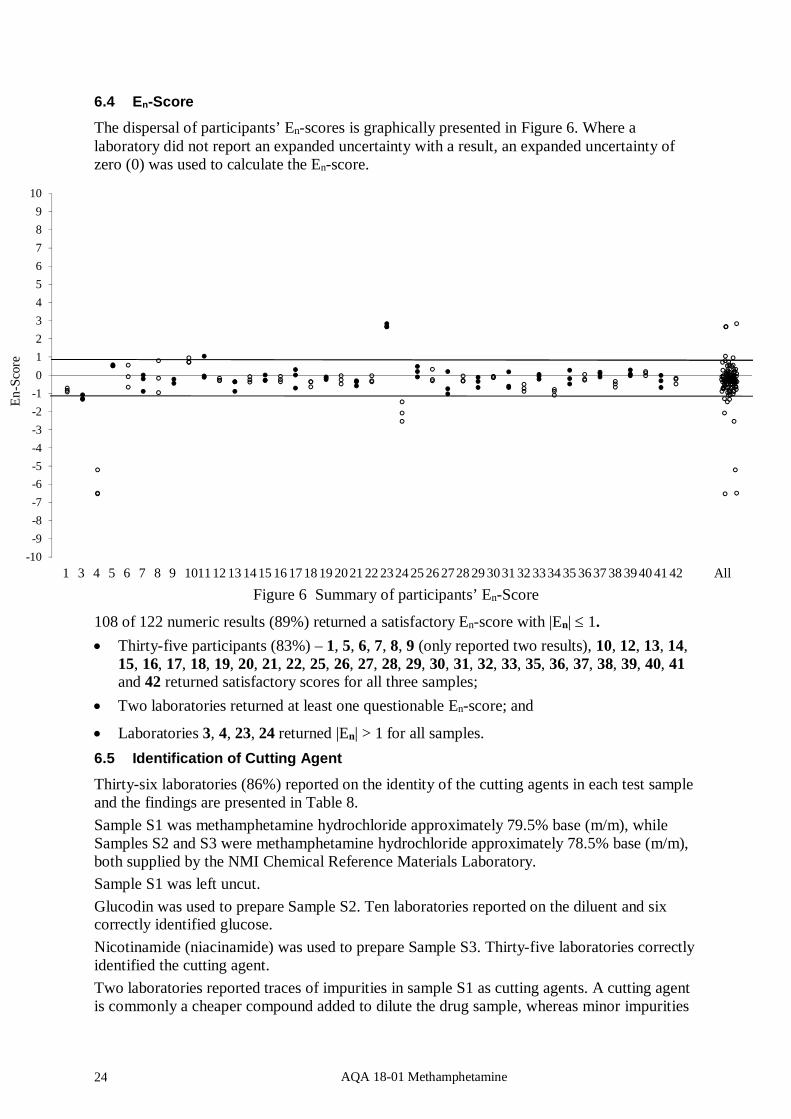
6.4 En-Score
The dispersal of participants’ En-scores is graphically presented in Figure 6. Where a laboratory did not report an expanded uncertainty with a result, an expanded uncertainty of zero (0) was used to calculate the En-score.
Figure 6 Summary of participants’ En-Score
108 of 122 numeric results (89%) returned a satisfactory En-score with |En| 1. Thirty-five participants (83%) – 1, 5, 6, 7, 8, 9 (only reported two results), 10, 12, 13, 14,
15, 16, 17, 18, 19, 20, 21, 22, 25, 26, 27, 28, 29, 30, 31, 32, 33, 35, 36, 37, 38, 39, 40, 41 and 42 returned satisfactory scores for all three samples;
Two laboratories returned at least one questionable En-score; and
Laboratories 3, 4, 23, 24 returned |En| > 1 for all samples. 6.5 Identification of Cutting Agent
Thirty-six laboratories (86%) reported on the identity of the cutting agents in each test sample and the findings are presented in Table 8. Sample S1 was methamphetamine hydrochloride approximately 79.5% base (m/m), while Samples S2 and S3 were methamphetamine hydrochloride approximately 78.5% base (m/m), both supplied by the NMI Chemical Reference Materials Laboratory. Sample S1 was left uncut. Glucodin was used to prepare Sample S2. Ten laboratories reported on the diluent and six correctly identified glucose. Nicotinamide (niacinamide) was used to prepare Sample S3. Thirty-five laboratories correctly identified the cutting agent. Two laboratories reported traces of impurities in sample S1 as cutting agents. A cutting agent is commonly a cheaper compound added to dilute the drug sample, whereas minor impurities
AQA 18-01 Methamphetamine 25
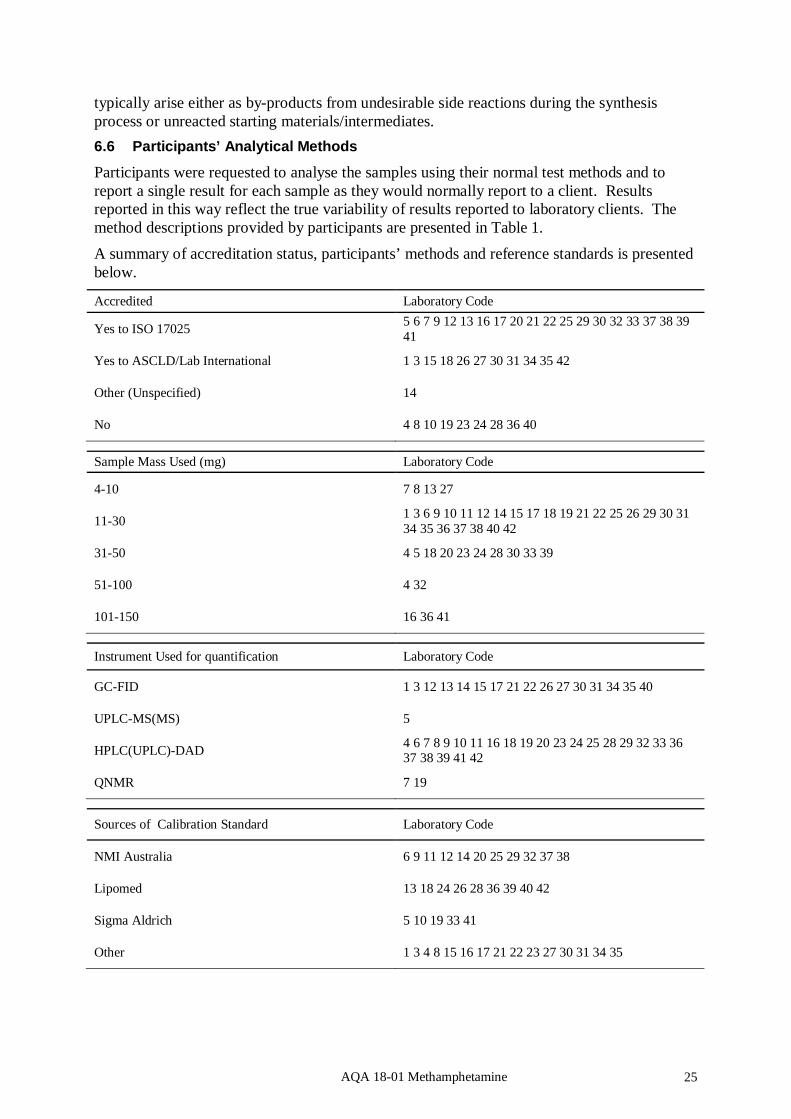
typically arise either as by-products from undesirable side reactions during the synthesis process or unreacted starting materials/intermediates. 6.6 Participants’ Analytical Methods
Participants were requested to analyse the samples using their normal test methods and to report a single result for each sample as they would normally report to a client. Results reported in this way reflect the true variability of results reported to laboratory clients. The method descriptions provided by participants are presented in Table 1. A summary of accreditation status, participants’ methods and reference standards is presented below.
Accredited Laboratory Code
Yes to ISO 17025 5 6 7 9 12 13 16 17 20 21 22 25 29 30 32 33 37 38 39 41
Yes to ASCLD/Lab International 1 3 15 18 26 27 30 31 34 35 42
Other (Unspecified) 14
No 4 8 10 19 23 24 28 36 40
Sample Mass Used (mg) Laboratory Code
4-10 7 8 13 27
11-30 1 3 6 9 10 11 12 14 15 17 18 19 21 22 25 26 29 30 31 34 35 36 37 38 40 42
31-50 4 5 18 20 23 24 28 30 33 39
51-100 4 32
101-150 16 36 41
Instrument Used for quantification Laboratory Code
GC-FID 1 3 12 13 14 15 17 21 22 26 27 30 31 34 35 40
UPLC-MS(MS) 5
HPLC(UPLC)-DAD 4 6 7 8 9 10 11 16 18 19 20 23 24 25 28 29 32 33 36 37 38 39 41 42
QNMR 7 19
Sources of Calibration Standard Laboratory Code
NMI Australia 6 9 11 12 14 20 25 29 32 37 38
Lipomed 13 18 24 26 28 36 39 40 42
Sigma Aldrich 5 10 19 33 41
Other 1 3 4 8 15 16 17 21 22 23 27 30 31 34 35
AQA 18-01 Methamphetamine 26
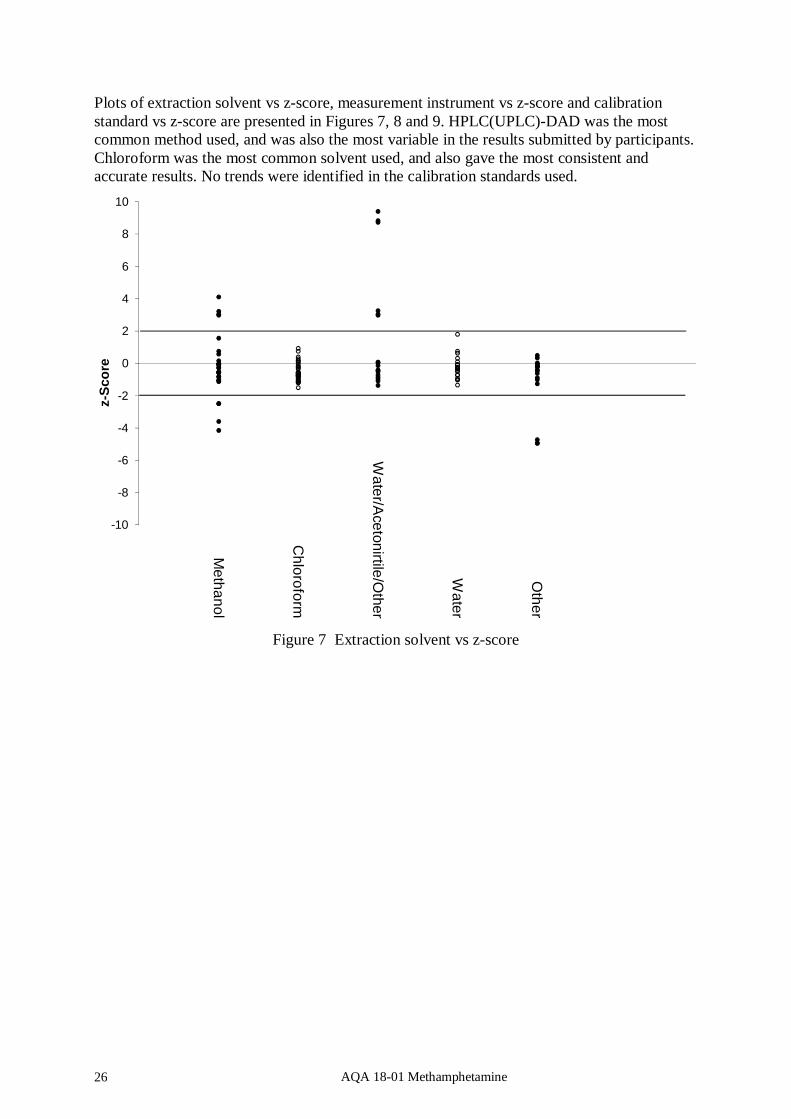
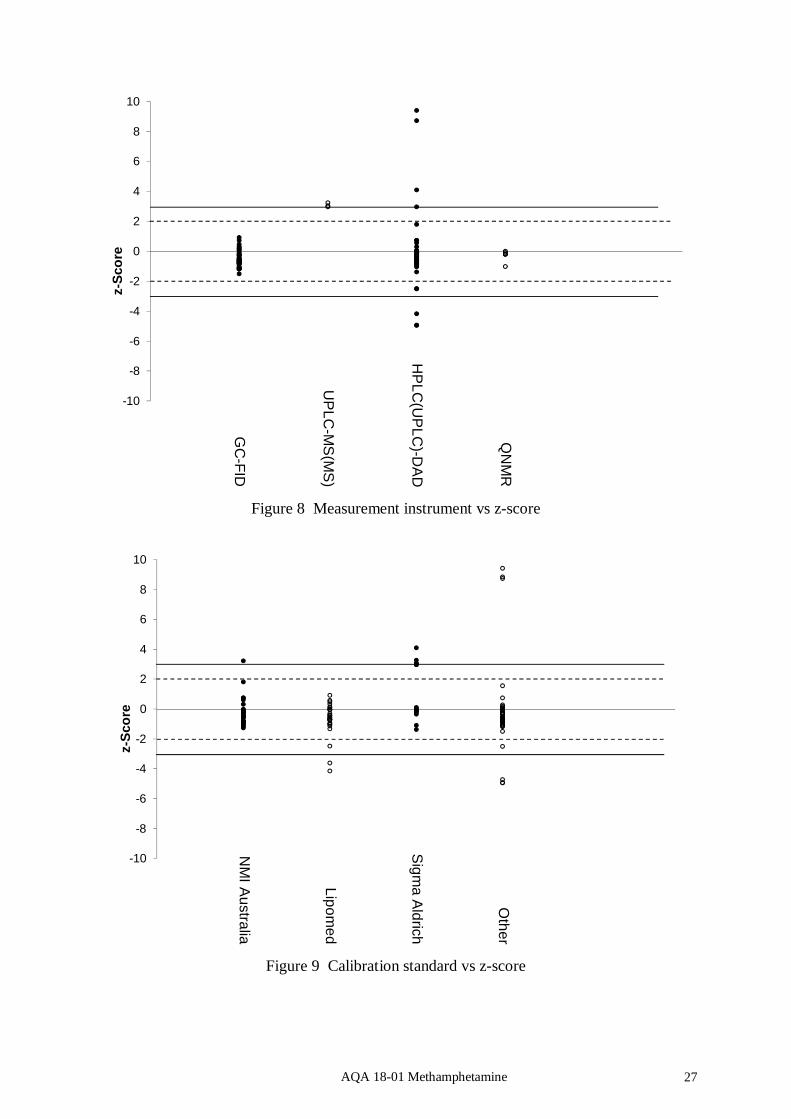
Plots of extraction solvent vs z-score, measurement instrument vs z-score and calibration standard vs z-score are presented in Figures 7, 8 and 9. HPLC(UPLC)-DAD was the most common method used, and was also the most variable in the results submitted by participants. Chloroform was the most common solvent used, and also gave the most consistent and accurate results. No trends were identified in the calibration standards used.
Figure 7 Extraction solvent vs z-score
Methanol
Chloroform
Water/A
cetonirtile/Other
Water
Other
-10
-8
-6
-4
-2
0
2
4
6
8
10
z-Sc
ore
AQA 18-01 Methamphetamine 27
Figure 8 Measurement instrument vs z-score
Figure 9 Calibration standard vs z-score
GC
-FID
UP
LC-M
S(M
S)
HP
LC(U
PLC
)-DA
D
QN
MR
-10
-8
-6
-4
-2
0
2
4
6
8
10z-
Scor
e
NM
I Australia
Lipomed
Sigm
a Aldrich
Other
-10
-8
-6
-4
-2
0
2
4
6
8
10
z-Sc
ore
AQA 18-01 Methamphetamine 28
70%
84%76%
89% 88%84%
74%
86%
61%
80%74%
56%
88%84%
73%
89%
35
23 22
37
25
17
41 42
0
10
20
30
40
50
60
70
0%
10%
20%
30%
40%
50%
60%
70%
80%
90%
100%
AQA 09-20 AQA 10-18 AQA 12-21 AQA 14-01 AQA 15-01 AQA 16-01 AQA 17-01 AQA 18-01
Satisfactory z-score Satisfactory En-score Participants
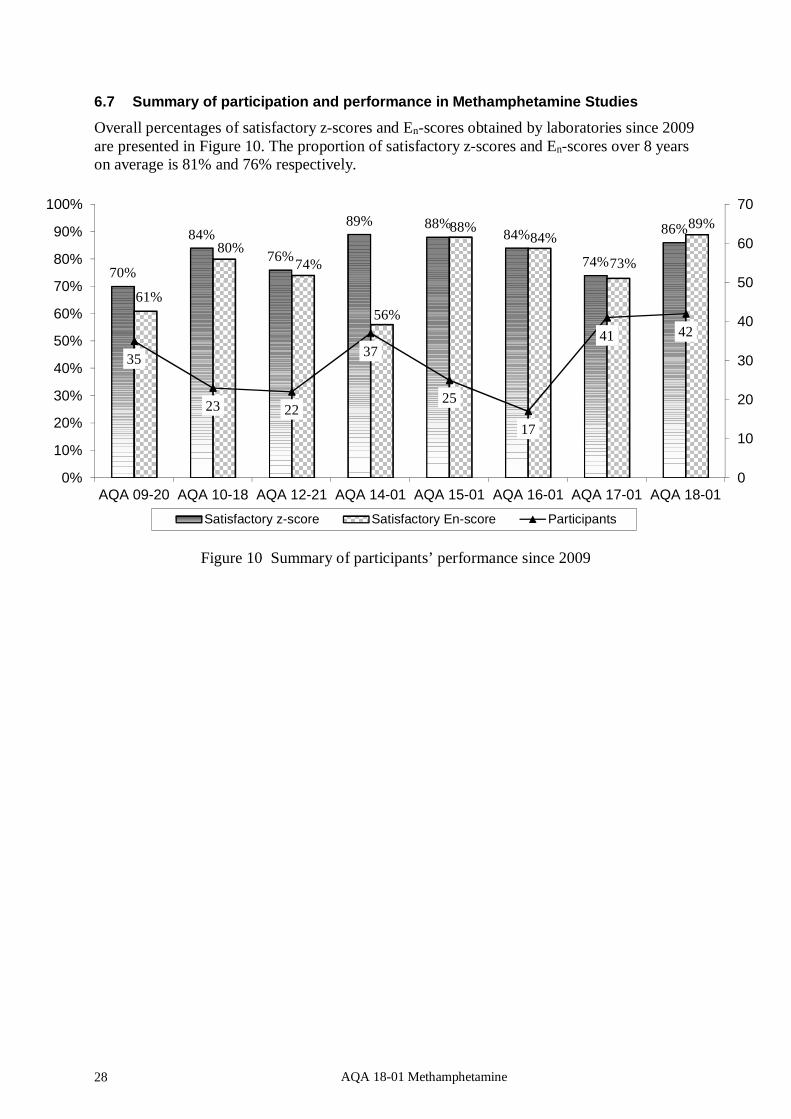
6.7 Summary of participation and performance in Methamphetamine Studies
Overall percentages of satisfactory z-scores and En-scores obtained by laboratories since 2009 are presented in Figure 10. The proportion of satisfactory z-scores and En-scores over 8 years on average is 81% and 76% respectively.
Figure 10 Summary of participants’ performance since 2009
AQA 18-01 Methamphetamine 29
7 REFERENCES
[1] ISO/IEC 17043 2010, Conformity assessment – General requirements for proficiency testing. [2] NMI 2016, Chemical Proficiency Testing Study Protocol, viewed 3 May 2018, http://www.measurement.gov.au. [3] NMI 2016, Chemical Proficiency Testing Statistical Manual, viewed 3 May 2018, <http://www.measurement.gov.au >. [4] Thompson, M., Ellison, SLR. & Wood, R. 2006. ‘The international harmonized protocol for proficiency testing of (chemical) analytical laboratories’, Pure Appl. Chem, vol 78, pp 145-196.
[5] ISO/IEC 17025 2017, General requirements for the competence of testing and calibration laboratories.
[6] Eurachem 2012, Quantifying Uncertainty in Analytical Measurement, 3rd edition, viewed 10 May 2017, <http://www.eurachem.org/images/stories/Guides/pdf/QUAM2012_P1.pdf>. [7] ISO/IEC 98-3 2008, Uncertainty of measurement – Part 3 Guide to the expression of uncertainty in measurement. [8] ISO/IEC 13528 2015, Statistical methods for use in proficiency testing by interlaboratory comparisons. [9] Thompson M. and Lowthian, P.J. 1995. ‘A Horwitz-like function describes precision in a proficiency test’, Analyst, vol 120, pp 271-272 [10] Thompson, M. and Lowthian, P.J., A Horwitz-like function describes precision in a proficiency test, Analyst, 120, 271-272, 1995.
AQA 18-01 Methamphetamine 30
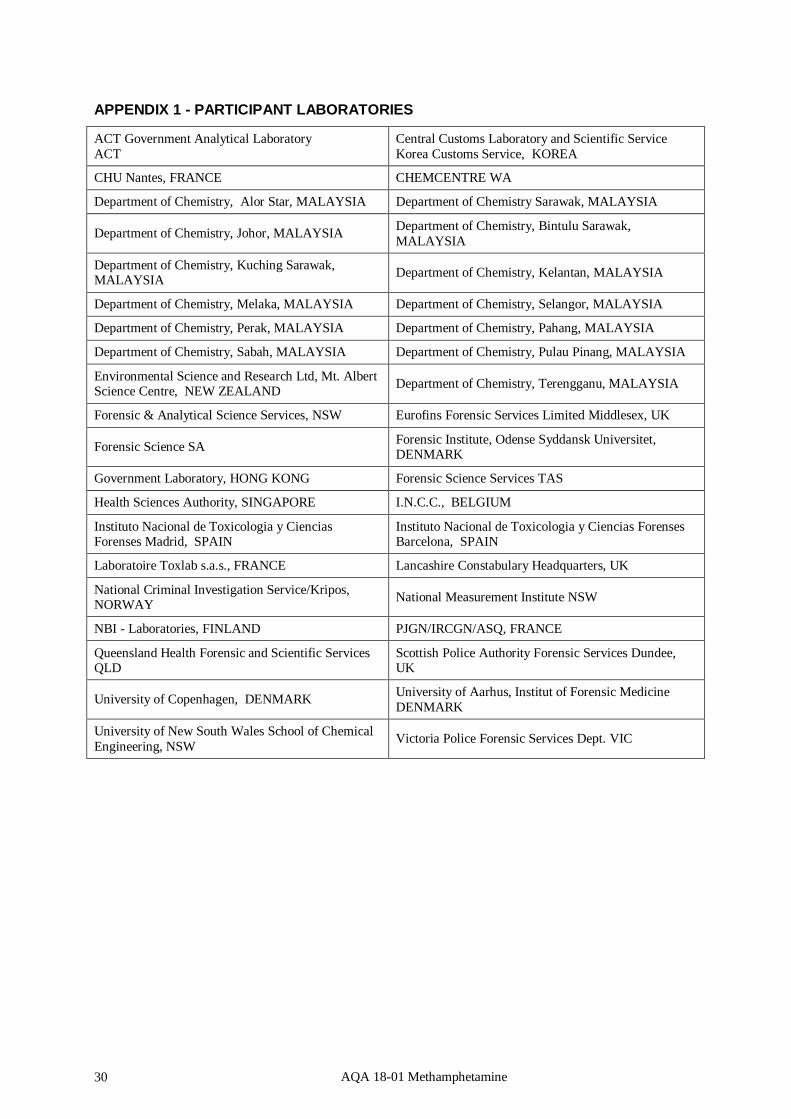
APPENDIX 1 - PARTICIPANT LABORATORIES
ACT Government Analytical Laboratory ACT
Central Customs Laboratory and Scientific Service Korea Customs Service, KOREA
CHU Nantes, FRANCE CHEMCENTRE WA
Department of Chemistry, Alor Star, MALAYSIA Department of Chemistry Sarawak, MALAYSIA
Department of Chemistry, Johor, MALAYSIA Department of Chemistry, Bintulu Sarawak, MALAYSIA
Department of Chemistry, Kuching Sarawak, MALAYSIA Department of Chemistry, Kelantan, MALAYSIA
Department of Chemistry, Melaka, MALAYSIA Department of Chemistry, Selangor, MALAYSIA
Department of Chemistry, Perak, MALAYSIA Department of Chemistry, Pahang, MALAYSIA
Department of Chemistry, Sabah, MALAYSIA Department of Chemistry, Pulau Pinang, MALAYSIA
Environmental Science and Research Ltd, Mt. Albert Science Centre, NEW ZEALAND Department of Chemistry, Terengganu, MALAYSIA
Forensic & Analytical Science Services, NSW Eurofins Forensic Services Limited Middlesex, UK
Forensic Science SA Forensic Institute, Odense Syddansk Universitet, DENMARK
Government Laboratory, HONG KONG Forensic Science Services TAS
Health Sciences Authority, SINGAPORE I.N.C.C., BELGIUM
Instituto Nacional de Toxicologia y Ciencias Forenses Madrid, SPAIN
Instituto Nacional de Toxicologia y Ciencias Forenses Barcelona, SPAIN
Laboratoire Toxlab s.a.s., FRANCE Lancashire Constabulary Headquarters, UK
National Criminal Investigation Service/Kripos, NORWAY National Measurement Institute NSW
NBI - Laboratories, FINLAND PJGN/IRCGN/ASQ, FRANCE
Queensland Health Forensic and Scientific Services QLD
Scottish Police Authority Forensic Services Dundee, UK
University of Copenhagen, DENMARK University of Aarhus, Institut of Forensic Medicine DENMARK
University of New South Wales School of Chemical Engineering, NSW Victoria Police Forensic Services Dept. VIC
AQA 18-01 Methamphetamine 31
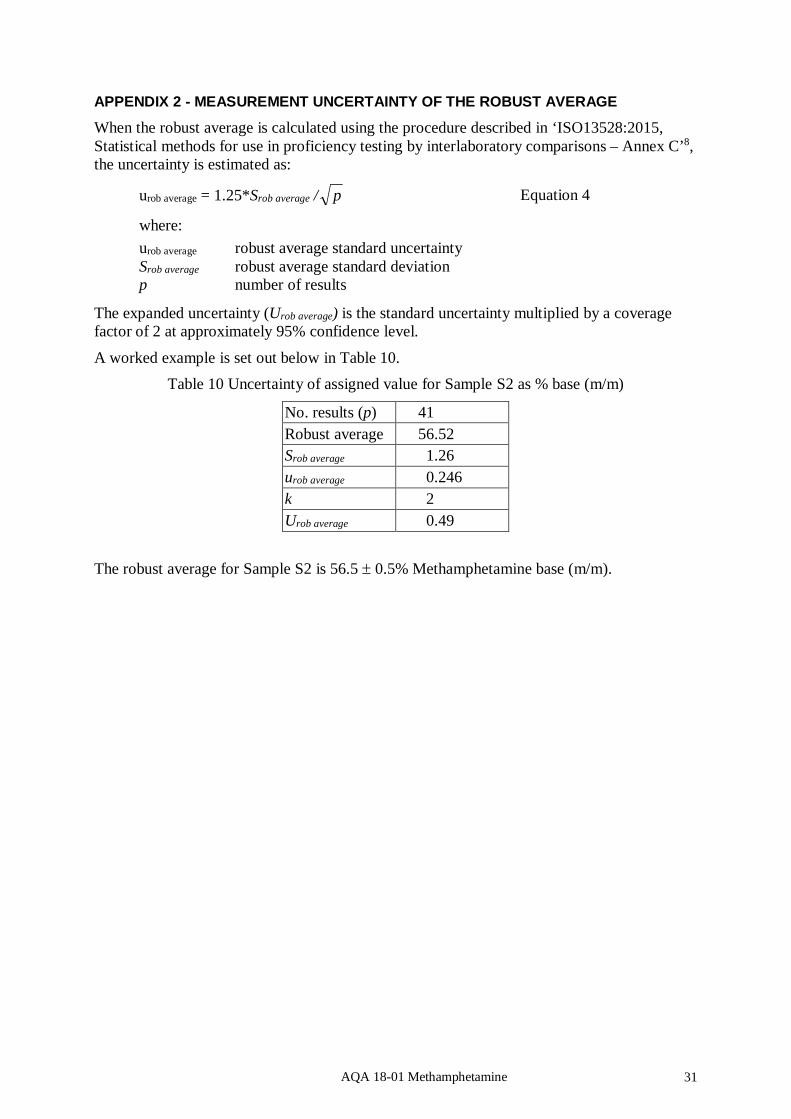
APPENDIX 2 - MEASUREMENT UNCERTAINTY OF THE ROBUST AVERAGE
When the robust average is calculated using the procedure described in ‘ISO13528:2015, Statistical methods for use in proficiency testing by interlaboratory comparisons – Annex C’8, the uncertainty is estimated as:
urob average = 1.25*Srob average / p Equation 4
where: urob average robust average standard uncertainty Srob average robust average standard deviation p number of results
The expanded uncertainty (Urob average) is the standard uncertainty multiplied by a coverage factor of 2 at approximately 95% confidence level.
A worked example is set out below in Table 10. Table 10 Uncertainty of assigned value for Sample S2 as % base (m/m)
No. results (p) 41 Robust average 56.52 Srob average 1.26 urob average 0.246 k 2 Urob average 0.49
The robust average for Sample S2 is 56.5 0.5% Methamphetamine base (m/m).
AQA 18-01 Methamphetamine 32
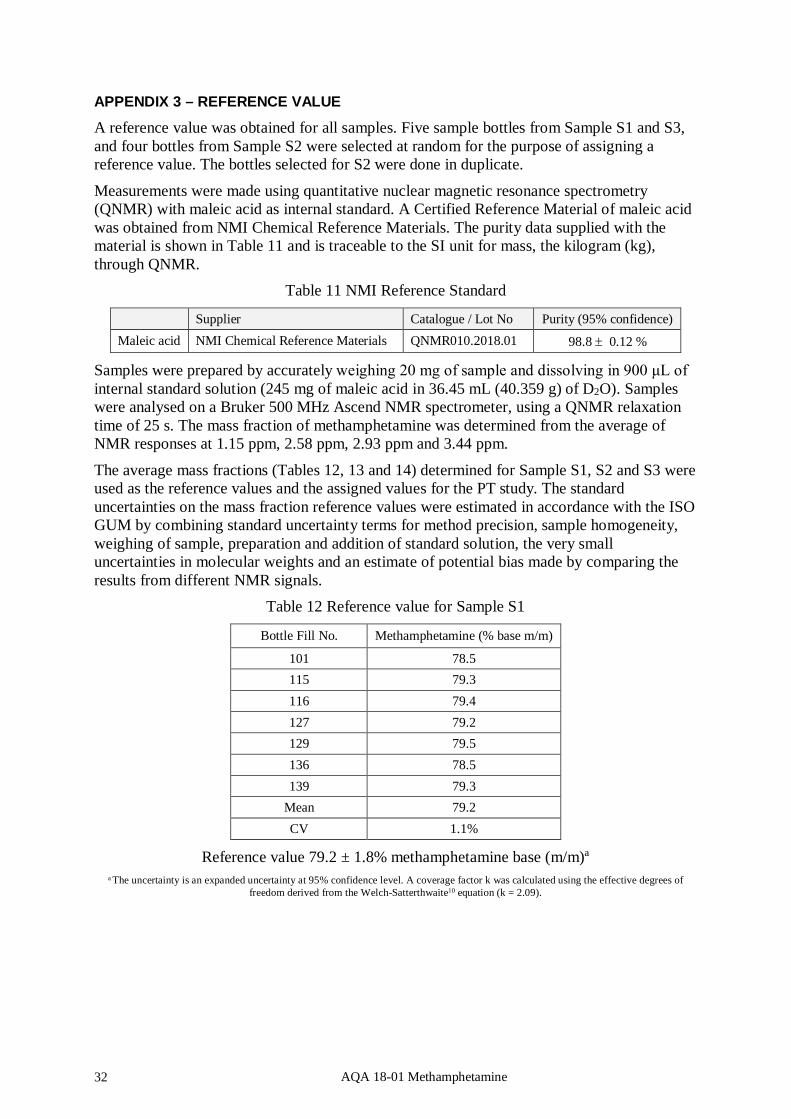
APPENDIX 3 – REFERENCE VALUE
A reference value was obtained for all samples. Five sample bottles from Sample S1 and S3, and four bottles from Sample S2 were selected at random for the purpose of assigning a reference value. The bottles selected for S2 were done in duplicate.
Measurements were made using quantitative nuclear magnetic resonance spectrometry (QNMR) with maleic acid as internal standard. A Certified Reference Material of maleic acid was obtained from NMI Chemical Reference Materials. The purity data supplied with the material is shown in Table 11 and is traceable to the SI unit for mass, the kilogram (kg), through QNMR.
Table 11 NMI Reference Standard
Supplier Catalogue / Lot No Purity (95% confidence) Maleic acid NMI Chemical Reference Materials QNMR010.2018.01 98.8 0.12 %
Samples were prepared by accurately weighing 20 mg of sample and dissolving in 900 μL of internal standard solution (245 mg of maleic acid in 36.45 mL (40.359 g) of D2O). Samples were analysed on a Bruker 500 MHz Ascend NMR spectrometer, using a QNMR relaxation time of 25 s. The mass fraction of methamphetamine was determined from the average of NMR responses at 1.15 ppm, 2.58 ppm, 2.93 ppm and 3.44 ppm.
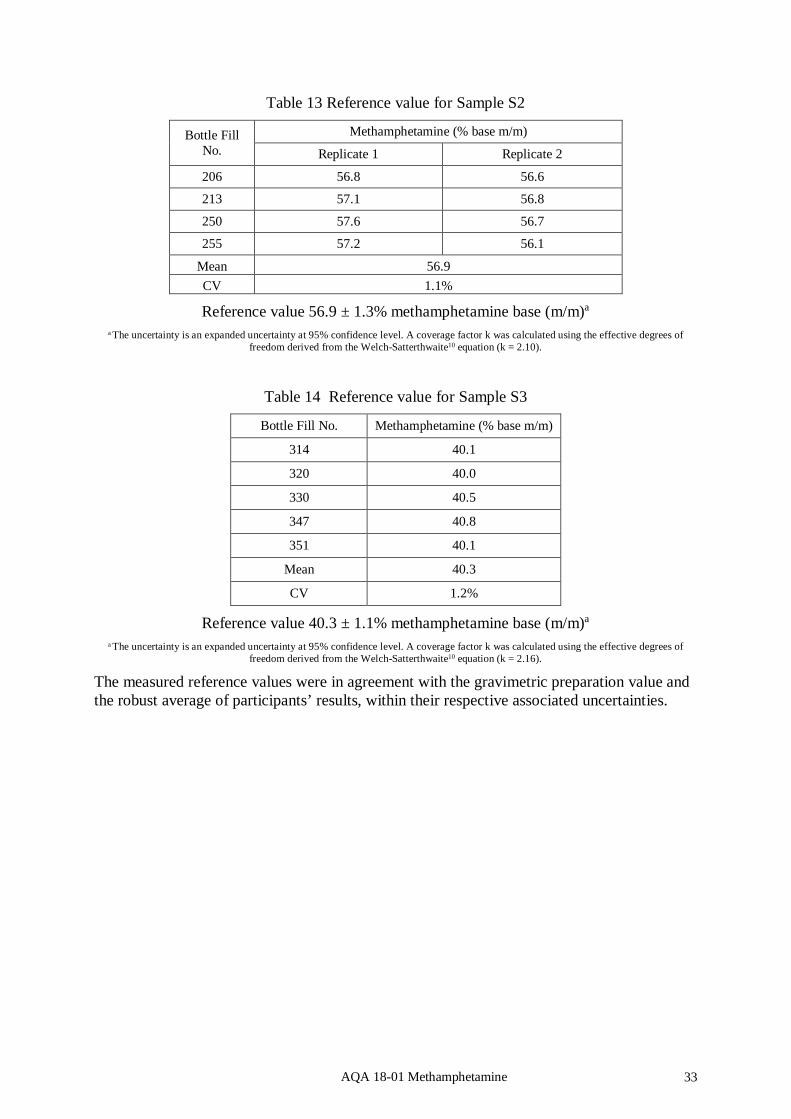
The average mass fractions (Tables 12, 13 and 14) determined for Sample S1, S2 and S3 were used as the reference values and the assigned values for the PT study. The standard uncertainties on the mass fraction reference values were estimated in accordance with the ISO GUM by combining standard uncertainty terms for method precision, sample homogeneity, weighing of sample, preparation and addition of standard solution, the very small uncertainties in molecular weights and an estimate of potential bias made by comparing the results from different NMR signals.
Table 12 Reference value for Sample S1
Bottle Fill No. Methamphetamine (% base m/m)
101 78.5 115 79.3 116 79.4 127 79.2 129 79.5 136 78.5 139 79.3
Mean 79.2 CV 1.1%
Reference value 79.2 ± 1.8% methamphetamine base (m/m)a a The uncertainty is an expanded uncertainty at 95% confidence level. A coverage factor k was calculated using the effective degrees of
freedom derived from the Welch-Satterthwaite10 equation (k = 2.09).
AQA 18-01 Methamphetamine 33
Table 13 Reference value for Sample S2
Bottle Fill No.
Methamphetamine (% base m/m)
Replicate 1 Replicate 2
206 56.8 56.6
213 57.1 56.8
250 57.6 56.7
255 57.2 56.1
Mean 56.9 CV 1.1%
Reference value 56.9 ± 1.3% methamphetamine base (m/m)a a The uncertainty is an expanded uncertainty at 95% confidence level. A coverage factor k was calculated using the effective degrees of
freedom derived from the Welch-Satterthwaite10 equation (k = 2.10).
Table 14 Reference value for Sample S3
Bottle Fill No. Methamphetamine (% base m/m)
314 40.1
320 40.0
330 40.5
347 40.8
351 40.1
Mean 40.3
CV 1.2%
Reference value 40.3 ± 1.1% methamphetamine base (m/m)a a The uncertainty is an expanded uncertainty at 95% confidence level. A coverage factor k was calculated using the effective degrees of
freedom derived from the Welch-Satterthwaite10 equation (k = 2.16). The measured reference values were in agreement with the gravimetric preparation value and the robust average of participants’ results, within their respective associated uncertainties.

AQA 18-01 Methamphetamine 34
APPENDIX 4 - ACRONYMS AND ABBREVIATIONS
ASCLD CITAC
CRM
American Society of Crime Laboratory Directors Cooperation on International Traceability in Analytical Chemistry
Certified Reference Material CV Coefficient of Variation
DAD Diode Array Detector |En| Absolute value of an En-score
FID Flame Ionization Detector GC Gas Chromatography
GC-MS GUM
Gas Chromatography Mass Spectrometry Guide to the expression of uncertainty in measurement
HPLC High Performance Liquid Chromatography ISO International Standards Organisation
LC Liquid Chromatography Max Maximum value in a set of results
Md Median Min Minimum value in a set of results
NATA National Association of Testing Authorities NMI National Measurement Institute Australia
NR Not Reported NT Not Tested
PDA Photodiode array PT Proficiency Test
QNMR Quantitative Nuclear Magnetic Resonance Robust CV Robust Coefficient of Variation
Robust SD Robust Standard Deviation SI International System of Units Target SD (σ) Target standard deviation
UPLC Ultra Performance Liquid Chromatography
UV Ultraviolet |z| Absolute value of a z-score
END OF REPORT