Embed Size (px)
Citation preview

PROFESSORS’ TEACHING EFFECTIVENESS IN RELATION
TO SELF-EFFICACY BELIEFS AND PERCEPTIONS OF
STUDENT RATING MYTHS
Except where reference is made to the work of others, the work described in this dissertation is my own or was done in the collaboration with my advisory
committee. This dissertation does not include proprietary or classified information.
___________________________ Esenc Meric Balam
Certificate of Approval: ___________________________ ___________________________ Sean A. Forbes David M. Shannon, Chair Associate Professor Professor Educational Foundations, Educational Foundations, Leadership, and Technology Leadership, and Technology ___________________________ ___________________________ Margaret E. Ross Stephen L. McFarland Associate Professor Dean Educational Foundations, Graduate School Leadership, and Technology

PROFESSORS’ TEACHING EFFECTIVENESS IN RELATION
TO SELF-EFFICACY BELIEFS AND PERCEPTIONS OF
STUDENT RATING MYTHS
Esenc Meric Balam
A Dissertation
Submitted to
the Graduate Faculty of
Auburn University
in Partial Fulfillment of the
Requirement for the
Degree of
Doctor of Philosophy
Auburn, AL August, 7, 2006

iii
PROFESSORS’ TEACHING EFFECTIVENESS IN RELATION
TO SELF-EFFICACY BELIEFS AND PERCEPTIONS OF
STUDENT RATING MYTHS
Esenc Meric Balam
Permission is granted to Auburn University to make copies of this dissertation at its discretion, upon request of individuals or institutions at their expense. The
author reserves all publication rights. __________________________ Signature of Author __________________________ Date of Graduation

iv
VITA
Esenc Meric Balam, daughter of Adnan Azmi Balam and Muserref Balam, was
born on October 22, 1973, in Mersin, Turkey. She graduated from Mersin Egitim Vakfi
Ozel Toros Lisesi in 1991. She attended Middle East Technical University in Ankara,
Turkey and graduated with a Bachelor of Arts degree in Foreign Language Education in
May 1996. She earned the degree of Master of Education in Instructional Technology
from Georgia College and State University in May 2002.

v
DISSERTATION ABSTRACT
PROFESSORS’ TEACHING EFFECTIVENESS IN RELATION
TO SELF-EFFICACY BELIEFS AND PERCEPTIONS OF
STUDENT RATING MYTHS
Esenc Meric Balam
Doctor of Philosophy, August 7, 2006 (M. Ed., Georgia College and State University, May 2002)
(B.A., Middle East Technical University, May 1996)
157 Typed Pages
Directed by David M. Shannon
One of the purposes of the current study was to develop an instrument capturing
different dimensions of college professor’s sense of efficacy so as to investigate the
relation between professors’ efficacy beliefs and professors’ teaching effectiveness. The
differences between students’ and professors’ perceptions of student rating myths as well
between female and male students; and professor characteristics as predictors of teacher
self-efficacy

vi
and overall effectiveness were also examined.
Participants of the study were a total of 968 students, 97 graduate and 871
undergraduate; and 34 faculty members, 9 graduate teaching assistants (GTA), 3 full
professors, 11 associate professors, 8 assistant professors, 3 instructors, in a southeastern
university. All the students completed the survey, Student Evaluation of Educational
Quality (SEEQ) (Marsh, 1982) to provide a measure of their professors’ teaching
effectiveness. Faculty, on the other hand, completed the survey, Teacher Appraisal
Inventory (TAI). Both students and faculty completed a section consisting of 16 student
rating myths.
Statistically significant relation was found between professor self-efficacy in
enthusiasm, breadth and teaching effectiveness regarding enthusiasm and breadth,
respectively. It was reported that the academic rank of the professor has a major influence
on professors’ overall efficacy beliefs in teaching as well as students’ learning, class
organization, rapport, exam/evaluation, and assignment. That is, the greater the rank, the
higher the efficacy beliefs in these domains. The statistical analyses indicated statistically
significant differences between professors’ and students’ perceptions of student rating
myths as well as between male and female students’ perceptions. Full professors, female
professors tended to receive higher ratings than their counterparts, and compared to
undergraduate students, postgraduate students gave higher ratings to professors. Also,
expected grade had an effect on student ratings of professors’ teaching effectiveness.
Discussion and recommendations for further research are provided.

vii
ACKNOWLEDGEMENTS
The author would like to thank Dr. David M. Shannon and Dr. Margaret E. Ross
for their guidance and valuable feedback throughout the research. My special thanks are
due to Dr. Sean A. Forbes and Dr. Anthony J. Guarino, who have been true mentors for
my professional and personal growth towards being a researcher and a scholar. Your
encouragement, support, and faith in my abilities will always be major strength. Thanks
are also due to Dr. Maria Witte and Dr. James Witte for providing support, care, and
unending sympathy.
I would also like to thank my father, Adnan Azmi Balam, my mother, Muserref
Balam, and my brother, Ersin Balam, who have been my generous advocates, source of
inspiration, and motivation in this academic endeavor. Your love and faith have always
helped me to remain dedicated and focused throughout my study and research. Special
thanks to my sister-like friends, Mehtap Akyurekli, Birgul Ascioglu, Sibel Ozkan, Prithi
Rao-Ainapure, and Arnita France; and my brother-like friends, Ashish Ainapure and
Asim Ali, for their friendship, support, patience, and sympathy.

viii
Style manual used: Publication Manual of the American Psychological Association, 5th Edition
Computer software used: SPSS 13.0 for data analysis, Microsoft Word 2003

ix
TABLE OF CONTENTS
LIST OF TABLES ....................................................................................................... xii I. INTRODUCTION........................................................................................................1 Introduction.....................................................................................................................1 Statement of Purpose .......................................................................................................3 Research Questions .........................................................................................................4 Significance of the Study.................................................................................................4 Limitations of the Study ..................................................................................................5 Assumptions....................................................................................................................6 Definitions of Terms........................................................................................................6 Organizational Overview.................................................................................................7 II. LITERATURE REVIEW............................................................................................9 Teaching Effectiveness in Higher Education....................................................................9 Assessing Teaching Effectiveness..................................................................................18 Self-Assessment ............................................................................................................18 Peer/Colleague Ratings..................................................................................................22
x
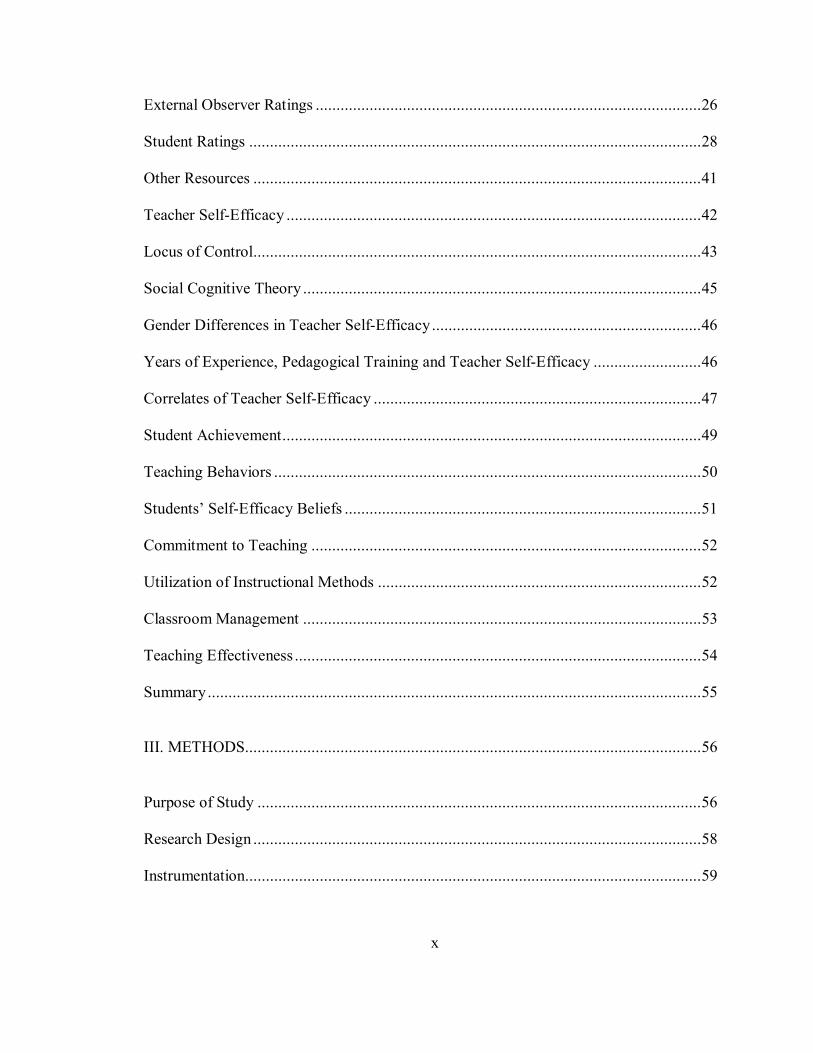
External Observer Ratings .............................................................................................26 Student Ratings .............................................................................................................28 Other Resources ............................................................................................................41 Teacher Self-Efficacy ....................................................................................................42 Locus of Control............................................................................................................43 Social Cognitive Theory ................................................................................................45 Gender Differences in Teacher Self-Efficacy.................................................................46 Years of Experience, Pedagogical Training and Teacher Self-Efficacy ..........................46 Correlates of Teacher Self-Efficacy ...............................................................................47 Student Achievement.....................................................................................................49 Teaching Behaviors .......................................................................................................50 Students’ Self-Efficacy Beliefs ......................................................................................51 Commitment to Teaching ..............................................................................................52 Utilization of Instructional Methods ..............................................................................52 Classroom Management ................................................................................................53 Teaching Effectiveness ..................................................................................................54 Summary.......................................................................................................................55 III. METHODS..............................................................................................................56 Purpose of Study ...........................................................................................................56 Research Design ............................................................................................................58 Instrumentation..............................................................................................................59

xi
Teaching Appraisal Inventory........................................................................................59 Student Evaluation of Educational Quality (SEEQ) .......................................................61 Validity and Reliability..................................................................................................62 Participants....................................................................................................................64 Statistical Method..........................................................................................................77 Summary of Methodology .............................................................................................79 IV. RESULTS ...............................................................................................................81 Introduction...................................................................................................................81 Data Analysis ................................................................................................................81 Summary.....................................................................................................................115 V. SUMMARY, DISCUSSION OF FINDINGS, CONCLUSIONS, AND...................116 Discussion of Findings ................................................................................................116 Conclusions .................................................................................................................120 Recommendations .......................................................................................................122 REFERENCES............................................................................................................125 APPENDICES.............................................................................................................137 APPENDIX A .............................................................................................................138 APPENDIX B .............................................................................................................142

xii
LIST OF TABLES Table 1 ..........................................................................................................................15 Table 2 ..........................................................................................................................38 Table 3 ..........................................................................................................................48 Table 4 ..........................................................................................................................66 Table 5 ..........................................................................................................................69 Table 6 ..........................................................................................................................71 Table 7 ..........................................................................................................................75 Table 8 ..........................................................................................................................83 Table 9 ..........................................................................................................................85 Table 10 ........................................................................................................................86 Table 11 ........................................................................................................................86 Table 12 ........................................................................................................................87 Table 13 ........................................................................................................................89 Table 14 ........................................................................................................................90 Table 15 ........................................................................................................................91 Table 16 ........................................................................................................................92 Table 17 ........................................................................................................................93

xiii
Table 18 ........................................................................................................................94 Table 19 ........................................................................................................................95 Table 20 ........................................................................................................................96 Table 21 ........................................................................................................................97 Table 22 ........................................................................................................................98 Table 23 ........................................................................................................................99 Table 24 ......................................................................................................................100 Table 25 ......................................................................................................................101 Table 26 ......................................................................................................................102 Table 27 ......................................................................................................................103 Table 28 ......................................................................................................................104 Table 29 ......................................................................................................................105 Table 30 ......................................................................................................................106 Table 31 ......................................................................................................................109 Table 32 ......................................................................................................................110 Table 33 ......................................................................................................................112 Table 34 ......................................................................................................................113

1
I. INTRODUCTION
Introduction
One of the most common concepts that comprise debates in teaching literature
has revolved around the definition of effective teaching and the measures that capture
it. Researchers have argued over how it is and should be defined in addition to the
most efficient methods to measure how effective teachers are in terms of instruction
both in K-12 and higher education settings. Existing literature has defined effective
teaching as “all the instructor behaviors that help students learn” (Cashin, 1989, p.4);
“teaching that fosters student learning” (Wankat, 2002, p.4); and various other ways.
Despite the fact that effective teaching has never possessed a sole definition,
numerous assessment procedures have been introduced by the researchers so as to
measure the quality of teaching in educational settings such as classroom observation,
student learning and achievement, peer evaluation, and student ratings. With the
advent of a comprehensive instrument named Student Evaluation of Educational
Quality (SEEQ), Marsh (1982) drew research focus on the multidimensional nature of
teaching while trying to establish some sound ground for the definition of teaching
effectiveness. This instrument (SEEQ) was designed to gather student feedback
(ratings) of teaching effectiveness in nine different dimensions: value of learning,

2
enthusiasm, organization, group interaction, individual rapport, breadth of coverage,
workload, grading, and assignments. Fortunately, the instrument yielded reliable and
valid scores and seemed promising to clarify the muddy water of measuring teaching
effectiveness. It has offered a wide spectrum of teaching.
While the nature of higher education lends itself to relying on student ratings
to get a measure of this construct, researchers have debated on the validity and
reliability of these ratings and attempted to provide evidence for either case. Some
researchers and many faculty members regarded student ratings as nothing more than
a matter of whether the professor gives good grades or not, or whether the professor is
easy or popular, creating a potential threat for validity. Based on this controversy,
myths about student ratings have emerged, questioning factors such as gender,
expected grades, time of class, and the like, on whether they have influence on how
the professors are evaluated above and beyond their teaching (see Basow & Silberg,
1987; Basow, 1995; Adamson, O’kane, & Shevlin, 2005; and Safer, Farmer, Segalla,
& Elhoubi, 2005).
Besides student ratings, peer review, classroom observation, self-assessment,
and student learning and achievement have been utilized to get a sense of effective
instruction. In K-12 settings, teacher self-efficacy has gained a reputation as a factor
related to effective teaching. Teacher self-efficacy has been defined variously. To
begin with, it is “the extent to which the teacher believes he or she has the capacity to
affect student performance” (Berman, McLaughlin, Bass, Pauly, & Zellman, 1977,
p.137). Some researchers defined teacher efficacy as “teachers’ belief or conviction

3
that they can influence how well students learn, even those who may be difficult or
unmotivated” (Guskey & Passaro, 1994, p.628). This supposedly-powerful construct
was documented as an attribute of teaching effectiveness by research studies (See
Henson, Kogan,& Vacha-Haase, 2001), and its association with student achievement
was supported by assorted research studies (Ross, 1992; Gibson & Dembo, 1984). In
addition, it has been documented that teacher self-efficacy correlates with teacher
behaviors such as classroom management, rapport with their students, and monitoring
students’ on-task behavior (e. g. Ashton & Others, 1983); special education referrals
(Brownell & Pajares, 1999); classroom management (Chambers, 2001); students’
self-efficacy beliefs (Tschannen-Moran & Hoy, 2001); and commitment to teaching
(Coladarci, 1992). Surveys to measure teacher self-efficacy, however, have been
primarily limited to K-12 teaching settings. Judging by the findings research studies
have generated, teacher self-efficacy calls for being discovered in higher education
settings as an alternative method to allow us to learn more about effective college
teaching.
Statement of Purpose
The purpose of this study is threefold: (1) to develop an instrument that
measures university and college professors’ self-efficacy in teaching, which would
demonstrate statistically and practically appropriate dimensions, validity, and
reliability; (2) to shed light on students’ and professors’ perceptions towards student
ratings and the myths related to them, and (3) to investigate professor characteristics
4
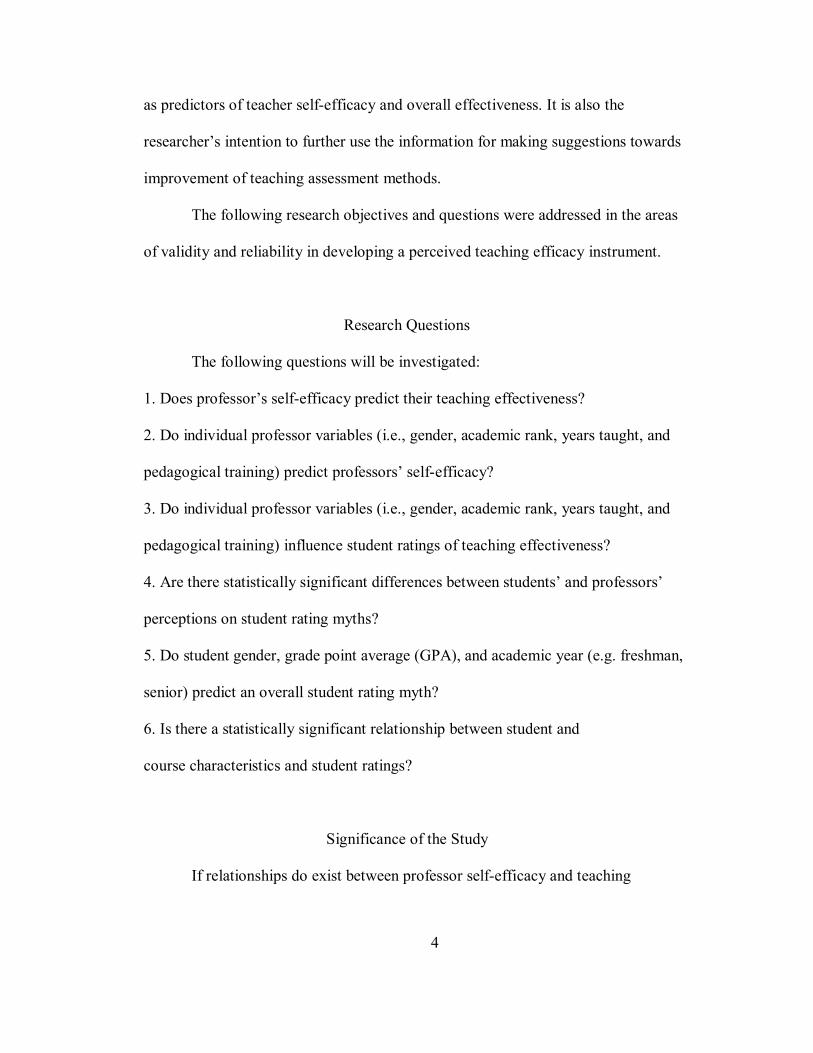
as predictors of teacher self-efficacy and overall effectiveness. It is also the
researcher’s intention to further use the information for making suggestions towards
improvement of teaching assessment methods.
The following research objectives and questions were addressed in the areas
of validity and reliability in developing a perceived teaching efficacy instrument.
Research Questions
The following questions will be investigated:
1. Does professor’s self-efficacy predict their teaching effectiveness?
2. Do individual professor variables (i.e., gender, academic rank, years taught, and
pedagogical training) predict professors’ self-efficacy?
3. Do individual professor variables (i.e., gender, academic rank, years taught, and
pedagogical training) influence student ratings of teaching effectiveness?
4. Are there statistically significant differences between students’ and professors’
perceptions on student rating myths?
5. Do student gender, grade point average (GPA), and academic year (e.g. freshman,
senior) predict an overall student rating myth?
6. Is there a statistically significant relationship between student and
course characteristics and student ratings?
Significance of the Study
If relationships do exist between professor self-efficacy and teaching

5
effectiveness, then sense of teacher efficacy could be used as one of the measures of
teaching effectiveness. While the higher education settings could still continue
implementing student rating instruments, using complementary methods to capture
factors related to teaching effectiveness might help clarify the issues with regard to
how reliable and valid the student ratings are used. Moreover, strategies to improve
perceived sense of efficacy in teaching could be developed to help professors improve
their teaching practices. In addition, if students and/or professors agree with the
student ratings myths, then research focusing on those specific myths could be
offered to further examine the underling reasons behind the attitudes and the beliefs.
Limitations of the Study
1- Since the research was conducted using a non-experimental design, neither random
assignment nor sampling took place. Therefore, caution should be taken while
making generalizations to the population.
2- The professor self-efficacy instrument named as teaching appraisal inventory
(TAI) is a self-report measure. There is always a possibility that individuals
underestimate or overestimate their abilities.
3- Marsh (1984) states “University faculty have little or no formal training in
teaching, yet find themselves in a position where their salary or even their job may
depend on their classroom teaching skills. Any procedure used to evaluate teaching
effectiveness would prove to be threatening and highly criticized” (p. 749). As such,
not many faculty members were willing to share how effectively they teach as

6
measured by student ratings, so the participation in this research was limited.
Assumptions
1- An assumption was made that both the students and the professors completed the
surveys as accurately and honestly as possible.
2- An assumption was made that while responding to the survey questions regarding
teacher efficacy, the professors focused on their teaching the relevant class, from
which their students were recruited.
Definitions of Terms
Terms that are used in the study are defined as follows:
1- Teaching effectiveness is defined as “teaching that fosters student learning”
(Wankat, 2002, p.4). It is regarded as a multidimensional construct suggested by
Marsh (1982) with the dimensions of learning/value, enthusiasm, organization, group
interaction, individual rapport, breadth of coverage, workload, exams/grading, and
assignments.
2- Teacher efficacy is defined as “the teacher’s belief in his or her capability to
organize and execute courses of action required to successfully accomplish a specific
teaching task in a particular context” (Tschannen-Moran et al., 1998, p.233). Due to
the fact that this research employs professors in higher education rather than K-12
teachers, the phrase professor self-efficacy was used instead of teacher self-efficacy
beliefs. In concert with the multidimensionality of the construct it was built on, the

7
professor self-efficacy was expected to yield several factors as well as an overall
scale.
3- Participant was used for those who completed the surveys of interest.
4- College professor refers to professors who earned their doctorate degree and who
teach either undergraduate or graduate level classes. In this study, it also includes
graduate teaching assistants and instructors.
5- Graduate Teaching Assistant (GTA) refers to doctoral students who are teaching an
undergraduate level class on their own.
6- Pedagogical training refers to any educational training or experience received with
the aim to improve instruction.
7- Undergraduate students are those enrolled in an undergraduate level course.
8- Graduate students are those enrolled in a graduate level course.
Organizational Overview
This research was organized into five chapters. Chapter I describes the content
of the research study in terms of introduction, statement of purpose, research
questions and hypotheses, significance of the study, limitations, assumptions,
definitions, and the overall organization.
Relevant literature on teaching effectiveness and teacher self-efficacy, which
provide the foundation to the research study, is presented in Chapter II.
Chapter III encompasses the research design, which includes survey
instrument, methodology, sampling, and the statistical analyses conducted.

8
The results of the statistical analyses that shed light upon the research
questions are discussed in Chapter IV.
Finally, Chapter V captures discussions related to the research study and
provides implications, recommendations, and suggestions for further research in this
area.

9
II. LITERATURE REVIEW
Teaching Effectiveness in Higher Education
Most higher education institutions pursue a mission of teaching, research and
extension, and service, while their major focus varies according to the nature of the
higher education institution. To illustrate, in liberal arts colleges, teaching
undergraduates constitutes the main interest, whereas at research universities,
research and publications are the major expectations (Boyer, 1990). In comprehensive
universities, on the other hand, the focus of interest is equated between teaching and
research, different than most graduate institutions. Hence, depending on the
individual school, the balance might change from more focus on teaching than
research or vice versa.
Despite the fact that the performance in each of these domains contributes to
the decision to be made with regard to tenure, promotion, and salary increases,
controversy still exists among faculty in terms of whether research or teaching should
be granted more time, effort, and value.
In Scholarship Reconsidered (1990), Boyer called for moving beyond this old
teaching versus research controversy and suggested redefining it in broader terms,
within the full scope of academic work (p.16). Boyer stated that scholarship

10
encompasses not only conducting research, but also making connections between
theory and practice as well as communicating knowledge effectively to students.
Accordingly, Boyer defined the work of the professoriate in four dimensions: the
scholarship of discovery, the scholarship of integration, the scholarship of
application, and the scholarship of teaching. Through depicting a fuller picture of
scholarly performance, Boyer laid emphasis on both teaching and service in higher
education institutions in addition to research asserting “to bring teaching and research
into better balance, we urge the nation’s ranking universities to extend special status
and salary incentives to those professors who devote most of their time to teaching
and are particularly effective in the classroom” (p.58).
Even though Boyer (1990) recommended that research and teaching should
have a better balance and that teaching should be viewed as a core requirement in
higher education institutions, inadequate assessments of teaching quality still leaves
room for further discussion and resolution. In addition to arguing on the validity and
reliability of scores obtained from various measures of teaching effectiveness,
researchers demonstrate different perspectives with regard to the definition of
teaching effectiveness while sometimes finding criteria on similar ground.
Literature encompasses numerous definitions and criteria regarding effective
teaching and effective teachers; nevertheless, a single definition has not been firmly
established on what teaching effectiveness means. Brophy (1986) stated that teaching
effectiveness is mostly defined with regard to fostering students’ affective and
personal development as well as curriculum mastery. In terms of the components of

11
effective teaching, Brophy underscored time management, active teaching through
discussions, follow-up assignments, and effective classroom management skills as
major components of teaching effectiveness. According to Cashin (1989) “all the
instructor behaviors that help students learn” constitute effective teaching (p. 4), and
college teaching encompasses several areas as follows: subject matter mastery,
curriculum development, course design, delivery of instruction, assessment of
instruction, availability to students, and administrative requirements, and as a matter
of course, these aspects should be addressed while assessing teaching effectiveness.
In 1987, Sherman, Armistead, Fowler, Barksdale, & Reif investigated
literature on college teaching to generate a conception of teaching excellence in
higher education and found that the most common five characteristics related to
effective teaching are “enthusiasm, clarity, preparation/organization, stimulation, and
love of knowledge” (p. 67). In this research (Sherman et al., 1987), it was concluded
that experience might be a crucial ingredient for excellence in teaching provided that
it is supplemented with the aforementioned features. Sherman et al. (1987) argued
“experience appears to contribute gradually to more sophisticated and effective ways
to manifest the five characteristics of excellence” (p.71).
In 1982, Marsh introduced The Student Evaluation of Education Quality (SEEQ),
which not only indicated criteria of teaching effectiveness, but also lent support to the
multidimensionality (see Marsh, 1984, 1991) of this construct. According to Marsh,
teaching effectiveness consists of nine dimensions: learning/value, enthusiasm,
organization, group interaction, individual rapport, breadth of coverage, workload,

12
exams/grading, and assignments. The factor analyses of responses provided to the
items supported the factor structure of the construct and demonstrated the distinct
components of teaching effectiveness and the measure (Marsh, 1982, 1991).
With regard to the multidimensionality of teaching effectiveness, Marsh
(1984) asserted the following:
The debate about which specific components of teaching effectiveness can and should be measured has not been resolved, though there seems to be consistency in those that are measured by the most carefully designed surveys. Students’ evaluations cannot be adequately understood if this multidimensionality is ignored. (p. 716)
Another perspective was added by Wankat (2002) with his definition of
effective teaching as “teaching that fosters student learning” (p.4). Wankat argued
that “efficiency without effectiveness such as efficiently teaching a class in which
students do not learn- is hollow. Effectiveness without efficiency means the
profession and often the students waste time” (p. 4). In his argument, Wankat
emphasized the codependence of efficiency and effectiveness in good teaching. In
another study, Hativa, Barak, and Simhi (2001) depicted effective and exemplary
teachers with a synthesis of previous research as the following:
Exemplary teachers are highly organized, plan their lessons carefully, set unambiguous goals, and have high expectations of their students. They give students regular feedback regarding their progress in the course, make specific remediation recommendations, and assume a major responsibility for student outcomes. (p.701)

13
Consistent with the aforementioned definitions of teaching effectiveness,
Hativa et al. (2001) emphasized clarity, organization, stimulating students’ interest,
engaging and motivating students, enthusiasm, establishing rapport with students, and
maintaining positive classroom environment as effective practices of teaching.
Young and Shaw (1999) conducted a study consisting of 912 college students
of both undergraduate and graduate levels of 152 different areas to investigate
multiple dimensions of teaching effectiveness. Their results revealed that “value of
interest, motivating students to do their best, comfortable learning atmosphere, course
organization, effective communication, concern for student learning, and genuine
respect for students were highly related to the criterion of teacher effectiveness”
(p.682). The most significant finding of this research was that the value of the course
for the university students was regarded as the most important predictor of teacher
effectiveness.
Similarly, upon examining pre-service teachers’ perceptions of effective
teachers, Minor, Onwuegbuzie, Witcher, and James (2002) proposed seven
characteristics such as being student-centered, competent, enthusiastic about teaching,
ethical, knowledgeable on the subject matter, professional, and effective in terms of
classroom and behavior management, which reflect effectiveness in teaching.
Witcher, Onwuegbuzie, Collins, Filer, Wiedmaier, and Moore (2003)
conducted research on college students consisting of both undergraduate and graduate
levels, to examine the characteristics of effective college teaching. According to the
analysis, students considered nine characteristics such as being student-centered,
14
knowledgeable about subject matter, professional, enthusiastic about teaching,
effective at communication, accessible, competent at instruction, fair and respectful,
and provider of adequate performance feedback.
A similar analysis was performed by Fiedler, Balam, Edwards, Dyer, Wang,
& Ross (2004) on college students’ perceptions of effective teaching in college,
which comprised of business, education, and engineering students of all academic
levels with the exception of graduate level. The study yielded similar characteristics
of effective teaching as the other studies suggested. The themes that emerged from
this relevant research are availability and accessibility during office hours and
through emails; organization in terms of course objectives and the course content;
methodology such as incorporating classroom discussions, encouraging questions
from students, and using examples; rapport and enthusiasm; and learning that
promotes a challenging and stimulating context.
For a summary of definitions of teaching effectiveness and criteria indicated
by various researchers, see Table 1.

15
Table 1
Definitions and Criteria of Teaching Effectiveness _____________________________________________________________________
Researcher, Date Definition/Criteria _____________________________________________________________________
Sherman et al., 1987 Enthusiasm, clarity, preparation, organization,
stimulating, and love of knowledge
Cashin, 1989 All the instructor behaviors that help students learn, the
components of which include subject matter mastery,
curriculum development, course design, delivery of
instruction, assessment of instruction, availability to
students, and administrative requirements
Brophy, 1986 Time management, active teaching through discussions,
follow-up assignments, and effective classroom
management skills
Marsh, 1982 Value of learning, enthusiasm, organization, group
interaction, individual rapport, breadth of coverage,
workload, grading, and assignments
Minor et al., 2002 Student-centered, competent, enthusiastic about
teaching, knowledgeable on the subject matter,
professional, and effective in terms of classroom and
behavior management
_____________________________________________________________________

16
Table 1(continued)
Definitions and Criteria of Teaching Effectiveness _____________________________________________________________________ Researcher, Date Definition/Criteria _____________________________________________________________________ Hativa et al., 2001 Clarity, organization, stimulating students’ interest,
engaging and motivating students, enthusiasm,
establishing rapport with students, and maintaining
positive classroom environment
Young & Shaw, 1999 Value of interest, motivating students to do their best,
course organization, effective communication, concern
for student learning, and genuine respect for students
Witcher et al., 2003 Student-centered, knowledgeable about subject
matter, professional, enthusiastic about teaching,
effective at communication, accessible, competent at
instruction, fair, respectful, and providing adequate
feedback enthusiasm, and learning that promotes a
challenging and stimulating context
Wankat, 2002 Teaching that fosters student learning _____________________________________________________________________

17
Table 1(continued)
Definitions and Criteria of Teaching Effectiveness _____________________________________________________________________ Researcher, Date Definition/Criteria _____________________________________________________________________ Fiedler et al., 2004 Availability and accessibility during office hours and
through emails, organization in terms of course objectives
and the course content, methodology such as
incorporating classroom discussions, encouraging
questions from students, and using examples, rapport and
____________________________________________________________________
The never-ending controversy in teaching effectiveness does not only dwell
on the definitions or the criteria of this construct, but also on how to assess it. Judging
by the failure to agree on a single definition, it seems plausible that researchers
cannot even agree on how to assess teaching effectiveness most effectively. Do
student ratings produce reliable and valid outcomes, or are they nothing more than a
popularity contest as some researchers claim? Can we rely on our colleagues’
judgment of how effectively we teach, or does our relationship with them determine it
regardless of our teaching? Are there any other assessment techniques that are
ignored or not yet been implemented? The following section will detail various
assessment methods used in teaching effectiveness.

18
Assessing Teaching Effectiveness
There is no single source to indicate teaching effectiveness (Marsh, 1984,
1991; Marsh & Roche, 1987; Cashin, 1988, 1995), nor is there a single indicator of
effective teaching (Marsh & Roche, 1997). Greenwald and Gillmore (1997) claim
that there is no readily available alternative method of evaluating instruction and state
“although expert appraisals and standardized achievement tests might provide more
valid assessments, regrettably both of those alternatives greatly exceed student ratings
in cost” (p.1215).
The current practices for measuring teaching effectiveness in K-12 and higher
education consist of student ratings, self-assessment, peer review, external
observation, and student learning as measured by standardized examinations.
Researchers list various sources for assessing teacher performance and effectiveness
such as current students’ ratings, former students’ ratings, self-ratings, colleague
ratings, administrator’s ratings, and external/trained observer ratings (Feldman, 1989;
Marsh & Roche, 1997). As Boyer (1990) emphasizes, traditional college and
university evaluation system incorporates student ratings of instruction, peer
evaluation, and self-evaluations as methods for assessing teaching effectiveness (Ory,
1991).
Self-Assessment
Self-assessment involves teachers’ evaluation of their own teaching. Cashin
(1989) advocated self-assessment in evaluating teaching as there might be aspects of

19
teaching that only the instructor might know, while urging that it should be compared
with other data obtained from other measures to get a better picture of how effective
the teaching is. Cashin claims that teachers themselves could provide useful
information in domains that constitute effective teaching such as subject matter
mastery, curriculum development, course design, delivery of instruction, assessment
of instruction, availability to students, and administrative requirements.
Airasan and Gullickson (1994) explained that teacher self-assessment is both
self-referent and controlled. There are numerous procedures to obtain a measure of
self-assessment, which is self-controlled and referent, such as personal reflection,
analyses of lecture recordings and lesson plans, considering students’ opinions,
observation by others, and the results of teaching (Airasan & Gullickson, 1994). With
regard to self-assessment, Boyer (1990) stated:
As to self-evaluation, it seems appropriate to ask faculty, periodically, to prepare a statement about the courses taught-one that includes a discussion of class goals and procedures, course outlines, descriptions of teaching materials and assignments, and copies of examinations or other evaluation tasks. (p.37)
Several researchers are in favor of using self-reports in assessing teaching
effectiveness (e.g. Arbizu et al., 1998; Cashin, 1989; Marsh & Roche, 1997; Chism,
1999; Feldman, 1989, to name a few). To begin with, Arbizu et al. (1998) argued that
teachers’ views on their own effectiveness should be taken into consideration as they
are a part of the teaching and learning process. They explained that self-assessment
can be complemented with other sources, it aims to train rather than punish teaching
20
behaviors, and it leads to personal efforts for self-improvement, while it also creates
opportunities for collective reflection with exchanges of information among teachers.
Similarly, Marsh and Roche (1997) asserted that self-assessments can be
beneficial as they can be collected in all educational settings, provide insights with
regard to teachers’ view about their own teaching, and be utilized during
interventions for improvements in teaching as teachers evaluate themselves. (p.1189).
Chism (1999) also drew attention to the role teachers play in their measure of
teaching effectiveness by stating the following:
Instructors being evaluated are the primary sources of descriptive data in that they are the generators of course materials, the teaching philosophy statement and information on number and kind of courses taught, participation in classroom research, leadership in the department or discipline in the area of teaching, thesis and dissertation supervision, mentoring of graduate teachers, and other pertinent descriptions. (p. 4).
Although there is tendency of any individual to have a higher self-concept
than actual, self-assessment measures could provide evidence of teaching
effectiveness provided that it is complemented with other measures such as peer
review, students ratings, and the like. It should be valued as important source of
information and personal motivation as a part of teaching effectiveness assessment
devices (Arbizu et al., 1998).
Feldman (1989) synthesized research comparing various ratings of
instructional effectiveness of college instructors and found similarity between the
ratings teachers gave themselves and those given by their current students, while
suggesting that some teachers rate themselves higher and some lower than their
21
current students in their classes.
Feldman also examined the profile similarity consisting of weaknesses and
strengths of teachers and their current students on their assessment of teaching
effectiveness by correlating their average ratings on specific evaluation items. The
results indicated that as a group, teachers’ perceptions of their strengths and
weaknesses are quite similar to their current students.
While another benefit of using self-assessment as a measure of teaching
effectiveness is to use it in validity studies, Feldman (1989) warned researchers to be
cautious as the ratings might not demonstrate independence.
Feldman (1989) contended the following:
Considering another comparison pair of rating sources, it can also be argued that faculty judgments of themselves as teachers, too, are not independent of their students’ evaluations. Not only are students’ impressions often visible to teachers in the classroom (and therefore students’ ratings anticipated) but students’ actual prior ratings over the years are known to the faculty members who have been evaluated, at least at those colleges and universities where student ratings are regularly determined and made known to the faculty. (p. 165)
The credibility of self-assessment has been questioned due to the lack of
systematic procedures used in this approach to assess teaching effectiveness (Arbizu
et al., 1998). However, through using the procedures mentioned earlier such as
personal reflection, analysis of recordings of one’s lectures, analyses of class plans
and other documents, consideration of the opinions of students, observations made by
other teachers and supervisors, and the results of micro-teaching, self-assessment
could potentially contribute to assessing teaching performance through independent

22
ratings and another complementary source.
Peer/Colleague Ratings
Peers are defined as “faculty members knowledgeable in the subject matter”
(Cashin, 1989, p. 2). According to Feldman (1989), however, peer/colleague ratings
are those conducted by the teacher’s peers at the school regardless of whether they are
in the same department or not. According to these two different definitions, peers
might be faculty of the same or different expertise area and from the same or a
different institution. Peer reviews can be conducted through reviewing course
materials, personal contact, or classroom observation, and are believed to be useful
source of information in domains such as: subject matter mastery, curriculum
development, course design, delivery of instruction, and assessment of instruction
(Cashin, 1989).
Chism (1999) stated that colleagues fit in the judgmental role quite well in
evaluating teachers on their “subject matter expertise, the currency and
appropriateness of their teaching materials, their assessment approaches, professional
and ethical behavior, and the like” (p.4-5). Compared to self-assessment, peer review
is more commonly used in higher education institutions for formative and summative
evaluation. Formative evaluation is for personal use and used for feedback to improve
teaching, so it should be confidential and private. It should be detailed so as to
provide the teacher with insights about their weaknesses and strengths. Summative
evaluation, on the other hand, focuses on information needed to make a personnel

23
decision such as tenure, promotion, merit pay, hiring. Information is for public
inspection so it is not confidential to the teacher. It is not detailed as it is not for
improvement purposes, so it is general and comparative in nature.
No matter whether for formative or summative purposes, Medley and Mitzel
(1963) highlighted the benefit of peer observation of teaching and promoted a
systematic observation of peers while assessing teaching effectiveness. Medley and
Mitzel claimed:
If an investigator visits a group of classrooms, he can be sure that, regardless of his presence, he will see teachers teaching, pupils learning; he will see better and poorer teachers, effective and ineffective methods, skillful and unskillful use of theory. If he does not see these things, and measure them, it will not be because of these things are not there to see, record, and measure. It will be because he does not know what to look for, how to record it, or how to score the records; in short, he does not know how to measure behavior by systematic observation. (p. 248)
In cases where peer judgment is conducted through course materials and the
syllabus of that particular class, faculty members have the tendency to complain that
the judges of their teaching never see them teach but refer to only the materials
related to class. This complaint can be avoided through use of classroom observations
(Cashin, 1989). These observations do not serve the faculty only as feedback for
improving teaching, but also to the observers so that they can foster their own
development through the ideas obtained watching a colleague (Chism, 1999, p. 75).
Although observing an instructor teaching makes promising contributions to
the assessment of effective teaching, it also leads one into questioning the accuracy of
the results because the observed are quite likely to demonstrate different behaviors

24
than usual due to the existence of an observer. This idea could be supported by the
German scientist Heinsenberg’s ‘quantum theory’, in which “he articulates an
‘uncertainty principle’[,] which well and truly calls into question positivist science’s
claim to certitude and objectivity” (Crotty, 1998, p. 29).
Crotty (1998) explains this principle as follows:
According to Heinsenberg’s principle, it is impossible to determine both the position and momentum of a subatomic particle (an electron, for instance) with any real accuracy. Not only does this preclude the ability to predict a future state with certainty but it suggests that the observed particle is altered in the very act of its being observed, thus challenging the notion that observer and observed are independent. This principle has the effect of turning the laws of physics into relative statements and to some degree into subjective perceptions rather than an expression of objective certainties. (p. 30)
Aforementioned argument should not be taken as a necessity to avoid
observations to assess teaching effectiveness. Researchers, however, should be
cautious in interpreting their observations because the teaching and learning context
and the observed are likely to demonstrate different behavior patterns than usual.
After all, it is better to have an insight about how teachers and students behave than
not to know anything at all (Medley & Mitzel, 1963, p.248). Accordingly, Chism
(1999) called for more than one rater and several observation sessions for reliable
ratings in peer review and provides several guidelines in utilizing peer review through
classroom observation as: (1) “faculty should be prepared to do observations, (2)
observer should be provided with preobservation information such as the instructor,
students, and the course, (3) the observer should be as unobtrusive as possible, (4)

25
observing should take substantial time to suffice for observing representative
behaviors, (5) the information about the observation should be completed when fresh”
(p.76). Cashin (1989) also pointed out three serious problems with regard to
classroom observation for the purpose of personnel decisions in terms of the context
to use in evaluation, variability among raters, and the representativeness of the classes
observed. Therefore, it was recommended that three or more people observe three or
more classes to resolve these issues. A negative view is asserted by Marsh (1984)
regarding peer ratings based on classroom observations. Marsh asserted “peer ratings,
based on classroom visitation, and research productivity were shown to have little
correlation with student evaluations, and because they are also relatively uncorrelated
with other indicators of effective teaching, their validity as measures of effective
teaching is problematic” (p. 729). Accordingly, he advocated a systematic approach
to observations by trained observers, which are reported to be positively correlated
with students’ evaluations and student achievement.
While peer review encompasses methods such as narrative documents from
students, administrators, colleagues, and teacher to be evaluated; inspection of
materials such as syllabus or tests; rating or ranking forms such as student ratings or
classroom observation checklists; observations of teaching or committee work
performance; counts such as number of student theses supervised, and telephone or
in-person interviews, the most widely used method is classroom observation (Chism,
1999). Classroom observations are conducted using several approaches such as
videotaping, narrative log/report, checklists, rating form, or teacher behavior coding
26
instruments such as Flanders, 1960 (Medley and Mitzel, 1963), which is mostly used
in K-12 settings. These observations, however, are prone to produce unreliable ratings
due to untrained or unprepared observers, brief observation sessions, personal biases,
using single rater, and making conclusions based on one session. Morehead and
Shedd (1997), for instance, asserted that “the problem with using peer review for
summative evaluation in this context is exacerbated by such human factors as the
internal politics of senior faculty reviewing junior faculty or a history of personal
conflict between the teacher and the reviewer” (p.39). Therefore, it is essential to use
multiple reviewers; continuous cycles of review; and technology in a way that the
distance reviewers can contribute through observing televised class period; choose
appropriate peers to make observations of teaching. External observer is highly
recommended especially in summative evaluation procedures.
External Observer Ratings
Feldman (1989) defined external observer ratings as “ratings made by
‘neutral’ or outside observers of the teacher (either from observation in the classroom
or from viewing videotapes of the teacher in the classroom) who generally have been
trained in some way as raters” (p. 138). Morehead and Shedd (1997) contended that
external peer review can be utilized through “video-conferencing, examining teaching
portfolios, observing a videotape of faculty member teaching their classes” (p.41). As
mentioned earlier, external observers take the burden off the shoulders of the internal
peers as they are challenged with time to be devoted, openness, constraints on
27
academic freedom, and undesirable after effects (Chism, 1999, p.10).
Morehead and Shedd (1997) listed the benefits of external peer review as
follows: “(1)It permits faculty members to collaborate across geographical boundaries
and avoid internal institutional biases that could inhibit effective evaluation of
teaching; (2)It allows the faculty to be exposed to teaching and learning processes
that are not utilized on their own campuses; (3) It allows for the creation of vital
documentation that can be used for summative purposes by promotion and tenure
committees” (p. 42).
Feldman (1989) asserted the ratings given by external, neutral, or trained
observers are likely to be independent of students’ judgments as they are not aware of
the reputation of the teachers, nor do they know the students’ ratings of the relevant
teacher. However, if the observations are conducted in the classroom rather than
through watching videotaped class sessions, their assessment would not be totally
independent of students’ ratings because they are quite likely to be influenced by
students’ reactions to teacher in the classroom.
As it has been already mentioned, providing adequate feedback; availability
and accessibility during office hours and through emails; and effective
communication constitute some criteria of effective teaching. Due to time constraints,
external observers are limited to their classroom observations in the classroom while
making judgments about the quality of teaching. As a matter of course, “they are
unaware of the teachers’ attitudes and behaviors evidenced primarily outside the
classroom-such as the quality of the teacher’s feedback to students on their written

28
work, the teacher’s impartiality in grading students, his or her availability to students
outside of class, and the like” (Feldman, 1989, p.166). Thus, the judgments made by
the external observers are subject to questions in terms of their validity.
Student Ratings
The most controversial issue in teaching effectiveness measures is revolve
around student ratings. Student ratings have been used in a systematic way for a long
period of time at universities and colleges in Northern America. Marsh (1984)
explained that although they are reasonably supported by research findings, student
ratings are controversial for several faculty, who usually lack formal training in
teaching and are supposed to demonstrate teaching skills so as to get tenure,
promotion, or merit increase. Consequently, they will be threatened by any procedure
used to evaluate teaching effectiveness and criticize it. These ratings of controversy
were initially used for the purpose of helping students select courses and professors
while inadvertently attracting administrators in making personnel and program
decisions (Ory, 1991). Started on voluntary basis on instructor’s part, students’
ratings of instructors turned out to be a required participation due to student demands
for faculty accountability and improving courses in the 1960’s. Consequently,
administrators agreed on considering very low rating results when reviewing teaching
assignments as well as tenure and promotion to some extent. In the 1970’s, myriad
research was conducted to investigate the reliability and validity of student ratings,
some of which were factor analytic studies.

29
The 1980’s ushered in the administrative use of student ratings. Ory (1991)
stated “…many administrators who were satisfied with the research supporting the
validity and reliability of ratings began to view student ratings as a useful and
necessary indicator of a professor’s teaching ability” (p. 32). While the controversy
still continues with regard to their validity and reliability, student ratings constitute
the primary portion in evaluating teaching. Today, almost every higher education
institution incorporates student ratings in assessing teaching effectiveness.
Marsh and Roche (1997) affirmed that the reason why student ratings are used
as the primary measure of teaching effectiveness is due to lack of support for the
validity of other indicators of effective teaching. However, this does not suggest that
students cannot provide accurate judgment of teaching quality. As a matter of fact,
students are believed to serve as source of data in delivery of instruction (e.g.
methods, skills, aids), assessment of instruction (e.g. tests, papers and projects,
practicums, grading practices), availability to students (e.g. office hours, other, and
informal contacts), and administrative requirements (e. g. book orders, library
reserve, syllabi on file, comes to class, grade reports) (Cashin, 1989); and in judging
instructor’s approach, fairness, and clarity of explanations (Chism, 1999).
Marsh (1984) explains that student ratings are “multidimensional; reliable and
stable; primarily function of the instructor who teaches a course rather than the course
that is taught, relatively valid against a variety of indicators of effective
teaching; relatively unaffected by a variety of variables hypothesized as potential
biases; seen to be useful by faculty as feedback about their teaching, by students for

30
use in course selection, and by administrators for use in personnel decisions” (p. 707)
In concert with Marsh’s statements, student ratings are regarded as valid and
reliable source of data of teaching effectiveness and are argued to be supplemented
with other evidence with regard to teaching effectiveness by several researchers
(Marsh, 1982; Obenchain et. Al, 2001; d’Apollonia, S., & Abrami, P. C. , 1997;
Cashin, 1988, 1995; Greenwald, A. G., 1997; Greenwald, A. G., & Gillmore, G. M. ,
1997; McKeachie, W. J., 1997; , H. W., & Roche, L. A., 1997; Alsmadi, 2005).
Cashin (1995) reviewed literature related to research on assessing teaching
effectiveness in multiple section courses, in which the different sections were
instructed by different instructor but employed the same syllabus, textbook, and
external exam. Based on his review, Cashin concluded that the classes in which
students gave high ratings tended to be the classes where the students learned more,
measured by the external exam; the correlation between students’ and instructor’s
ratings yielded coefficients of .29 and .49, whereas it yielded coefficients of .47 to
.62, .48 to .69, .40 to .75, and .50 between student ratings and administrators’,
colleagues’, and alumni’s, and trained observers’ ratings, respectively. This review
contributes to supporting the validity and hence the reliability of student ratings.
Students are considered to provide the most essential judgmental data about
the quality of teaching strategies applied by the teachers as well as the personal
impact of the teachers on their learning (Chism, 1999). Their feedback can be used to
confirm and supplement teachers’ self-assessment of their teaching. Nevertheless,
they should not be considered as accurate judges in determining the competency of

31
teachers in that particular area or the currency of their teaching strategies (Chism,
1999). In those domains, peer judgments seem to provide more accurate and, hence,
useful information.
Involving students in the assessment of teaching quality seems to be a simple
procedure as long as the measure is clearly defined, and it also possesses credibility
for several reasons: Since the input is from a number of raters, reliability estimates
tend to be usually quite high, and ratings are made by students who have continually
observed the teaching behaviors in considerable amount, suggesting they are based on
representative behavior. Also, as students are the observers who have been personally
affected, these ratings demonstrate high face validity (Hoyt and Pallett, 1999).
Marsh (1984) stated that there are various purposes of student evaluation
ranging from diagnostic feedback to improve teaching to measure of evidence for
tenure and promotion. They also provide useful information for students to choose
from different sections, when publicized, and they can also be used in research on
teaching.
While plethora of research has shown evidence that support the reliability and
validity of student ratings, several researchers and academicians have been concerned
regarding these issues due to potential biases such as gender of the student, gender of
the professor, major of the student, and the expected grades, to name a few.
Numerous studies have been conducted to shed light upon these issues.
To illustrate, Basow and Silberg’s research (1987) indicated gender bias in
their investigation of the influence of students’ and professors’ gender in the

32
assessment of their teaching effectiveness. They found a significant teacher sex and
student sex interaction on students’ evaluation of college professors. The results
implied that male students rated male professors higher than female professors in
dimensions such as scholarship, organization/clarity, dynamism/enthusiasm, and
overall teaching ability, while female students rated female professors more
negatively than they rated male professors on instructor/individual student interaction,
dynamism/ enthusiasm, and overall teaching ability. Student major was also found to
have an effect on the evaluations of professors. That is, on all measures, scholarship,
organization/clarity, instructor-group interaction, instructor-individual student
interaction, dynamism-enthusiasm, and overall teaching effectiveness, engineering
students provided the most negative ratings of teaching effectiveness, while
humanities students the most positive.
In another study, Basow (1995) analyzed the effects of professor gender,
student gender, and discipline of the course on student evaluations of professors
within four semesters, while controlling for professor rank, teaching experience,
student year, student grade point average, expected grade, and the hour the class
meet. The research results indicated that overall student gender did not have a
significant effect on the ratings of male professors, whereas it did on the ratings of
female professors as the highest ratings were provided by the female students and the
lowest were by the male students. The male and female students perceived and
evaluated male professors similarly, whereas female professors were evaluated
differently depending on the divisional affiliation of the student.

33
In the same study (Basow, 1995), female professors were rated higher by
female students especially those in humanities, but received lower ratings by male
students, especially those in social sciences. There were also differences between the
ratings of the male and female professors in different dimensions of teaching
effectiveness. For example, male faculty tended to received higher ratings than
female faculty in terms of knowledge, and the female faculty received higher ratings
in respect, sensitivity, and student freedom to express ideas.
Professor characteristics such as attractiveness, trustworthiness, and
expertness were also found to influence teaching effectiveness (Freeman, 1988),
suggesting a relationship between perceptions of teacher characteristics and teaching
effectiveness. Another nonteaching factor, the perceptions of how funny the professor
is, was also reported to be positively correlated with the student ratings of teaching
effectiveness (Adamson, O’kane, & Shevlin, 2005) In addition, the proximity to the
teacher in the classroom was found to be a factor in how professors are rated by their
students (Safer, Farmer, Segalla, & Elhoubi, 2005). That is, the closer students were
to the professor, the higher did they rate them. In the same study, it was found that
higher grades were positively correlated with higher ratings, while the time of the
class indicated no statistical significance in student ratings.
In 1970’s grading leniency was a prime concern for researchers who were
skeptical of the validity of student ratings (Greenwald & Gillmore, 1997). “Grading
leniency hypothesis proposes that instructors who give higher-than-deserved grades
will receive higher-than-deserved student ratings, and this constitutes a serious bias to

34
student ratings” (Marsh, 1984, p. 737). This suggests that professors who are after
high ratings although they are not effective in teaching will resort to giving higher
grades to their students, which becomes a threat to the validity of these ratings. Marsh
(1984) argued that when there is correlation between course grades and students
ratings as well as course grades and performance on the final exam, higher ratings
might be due to more effective teaching resulting in greater learning, satisfaction with
the grades bring about students’ rewarding the teacher, or initial differences in student
characteristics such as motivation, subject interest, and ability.
In his review of research, Marsh reported grading leniency effect in
experimental studies. Marsh concluded the following:
Consequently, it is possible that a grading leniency effect may produce some bias in student ratings, support for this suggestion is weak and the size of such an effect is likely to be insubstantial in the actual use of student ratings. (p. 741)
While stating that the grading leniency may account for little influence on
student ratings if any, Greenwald and Gillmore (1997) pointed out that understanding
the third variable that contributes to the correlation between expected grades and
student ratings prevents drawing causational conclusions between these two variables.
Greenwald and Gillmore introduced instructional quality, student’s motivation, and
student’s course-specific motivation, as possible third variables, which explains the
correlation between these two variables, suggesting no concern about grades having
improper influence on ratings. They also suggested that the students tend to attribute
their unfavorable grades to poor instruction, and hence give low ratings to professors.

35
Greenwald and Gillmore’s research indicated that “giving higher grades, by itself,
might not be sufficient to ensure high ratings. Nevertheless, if an instructor varied
nothing between two course offerings other than grading policy, higher ratings would
be expected in the more leniently graded course” (p. 1214).
Freeman (1988) asserted that professors’ attractiveness, trustworthiness, and
expertness influence teaching effectiveness. Likewise, students’ perceptions of
professors’ sense of humor was also reported to be positively correlated with the
student ratings of teaching effectiveness (Adamson, O’kane, & Shevlin, 2005).
Another nonteaching factor influencing teaching effectiveness was found to be the
proximity to the teacher in the classroom (Safer, Farmer, Segalla, & Elhoubi, 2005).
Accordingly, the closer students were to the professor, the higher ratings they gave to
their professors. In the relevant research study, it was reported that higher grades
were positively correlated with higher ratings; however, the time the class was
offered had no statistical significance relation to the student ratings.
Cashin (1995) asserted that although they seem to show little or no correlation
at all, instructor characteristics such as gender, age, teaching experience, personality,
ethnicity and research productivity, students’ age, gender, GPA, or personality does
not cloud the measure of teachers’ effectiveness. However, faculty rank,
expressiveness, expected grades, student motivation, level of course, academic field,
workload are prone to correlate with student ratings. Cashin suggested that student
motivation and academic field should be controlled, the students should be informed
about the purpose of the evaluation, and the instructor should not be present during

36
the student evaluations so as to receive valid scores.
Besides potential biases as mentioned earlier, researchers also raised concerns
with regard to whether the student evaluations should provide single score or multiple
scores of different dimensions. For example, Marsh (1984) provided an overview of
research findings in the area of student evaluation of teaching in terms of
methodological issues and weaknesses trying to provide guidance in designing
instruments that would effectively measure teaching and their implications for use.
Marsh pointed out that, despite the fact that student ratings should be undeniably
multidimensional as the construct it builds on is that way, most evaluation
instruments fail to reflect this multidimensionality. With regard to instrumentation,
Marsh (1984) contended the following:
If a survey instrument contains an ill-defined hodgepodge of items, and student ratings are summarized by an average of these items, then there is no basis for knowing what is being measured, no basis for differentially weighting different components in the way most appropriate to the particular purpose they are to serve, nor any basis for comparing the results with other findings. If a survey contains separate groups of related items derived from a logical analysis of the content of effective teaching and the purposes the ratings are to serve, or a carefully constructed theory of teaching and learning, and if empirical procedures such as factor analysis and multi-trait-multimethod analyses demonstrate that items within the same group do measure separate and distinguishable traits, then it is possible to interpret what is being measured. (p. 709)
Marsh (1984) stated that “there is no single criterion of effective teaching” (p.
709); therefore, a construct validation of student ratings is required, which would
show that student ratings are related to a variety of indicators of teaching
effectiveness. Under this procedure, it is expected that different dimensions of

37
teaching effectiveness will correlate highly with different indicators of it.
Similarly, Marsh and Roche (1997) advocated the multidimensionality of
student ratings both conceptually and empirically, just like the construct they are built
on. They believed that if this is ignored, the validity of these ratings will be
undermined as well. Student ratings of effective teaching are also believed to be
better understood by multiple dimensions instead of a single summary of score
(Marsh & Hocevar, 1984), while some researchers argue in favor of the opposite. For
example, Cashin and Downey (1992) investigated the usefulness of global items in
the prediction of weighted-composite evaluations of teaching and reported that the
global items explained a substantial amount of the variance (more than 50%) in the
weighted-composite criterion measure. This view is also supported D’Apollonia and
Abrami (1997), who declared that even though effective teaching might be
multidimensional, student ratings of instruction measure general instructional skills
such as delivery, facilitation of interactions, and evaluation of student learning, and
they state that these ratings have a large global factor.
There are several limitations of student ratings. For example, Hoyt and Pallett
(1999) insisted that some of the instruments are poorly constructed due to unrelated
items, unclear wording, ambiguous questions, and response alternatives which fail to
exhaust the possibilities; unstandardized results, which inhibit comparisons among
faculty members; and the fact that while interpreting the results, extraneous variables
such as class size, student motivation, and course difficulty, which are beyond
instructor’s control, are not taken into account.

38
Despite the evidence to support their validity and reliability; and their
prevalence in higher education, student ratings are to be treated with caution. Due to
these concerns, some myths were even generated by researchers regarding student
ratings in higher education (see Hativa, 1996; Melland, 1996; Benz & Blatt, 1995;
Freeman, 1994). Aleamoni (1987, 1999), for instance, cited research from 1924 to
1998, examining whether these myths are in fact myths after all. While his research
yielded mixed findings, he suggested that student rating myths are myths and could
be utilized as feedback to enhance and improve instruction. Table 2 displays these
common myths about student ratings.
Table 2
Student Rating Myths _____________________________________________________________________
Myths
_____________________________________________________________________
1. In general, students are qualified to make accurate judgments of college professors’ teaching effectiveness. 2. Professors’ colleagues with excellent publication records and expertise are better qualified to evaluate their peers’ teaching effectiveness. 3. Most student ratings are nothing more than a popularity contest with the warm, friendly, humorous instructor emerging as the winner every time. 4. Students are not able to make accurate judgments until they have been away from the course and possibly away from the university for several years. 5. Student ratings forms are both unreliable and invalid. 6. The size of the class affects student ratings. _____________________________________________________________________

39
Table 2 (continued)
Student Rating Myths _____________________________________________________________________
Myths
_____________________________________________________________________ 7. The gender of the student and the gender of the instructor affect student ratings. 8. The time of the day the course is offered affects student ratings. 9. Whether students take the course as a requirement or as an elective affects their ratings. 10. Whether students are majors or nonmajors affects their ratings. 11. The level of the course (freshman, sophomore, junior, senior, graduate) affects student ratings. 12. The rank of the instructor (instructor, assistant professor, associate professor, professor) affects student ratings. 13. The grades or marks students receive in the course are highly correlated with their ratings of the course and the instructor. 14. There are no disciplinary differences in student ratings. 15. Student ratings on single general items are accurate measures of instructional effectiveness. 16. Student ratings cannot meaningfully be used to improve instruction. _____________________________________________________________________

40
Research has shown differences between students’ and professors’ perception
of teaching effectiveness. Research by Sojka, Ashok, and Down (2002) indicated that
while faculty believed that professors of less demanding courses tend to received
better grades and student ratings are influenced by the entertaining characteristic of
faculty, students were less likely to agree with these arguments. Compared to faculty
members, students were less likely to believe that student evaluations of teaching
encourage faculty to grade more leniently, have an influence on professors’ academic
career, or that their ratings lead to changes in courses and/or teaching styles. Faculty
members, on the other hand, believed that students do not take ratings seriously and
hence rate easy and entertaining instructors more highly, while students disagreed
with this contention.
Factor analyses used in several studies (Marsh & Hocevar, 1984; 1997;
Marsh, Hau, & Chung, 1997) and validity and reliability studies demonstrated the
multidimensionality of student ratings and supported the validity and reliability of
student ratings. While some researchers still remain skeptical about their accuracy,
student ratings are widely used in almost every higher education institution.
McKeachie (1997) calls for research with regard to ways to teaching students to
become more sophisticated raters and find ways to make this experience beneficial
for them. Accordingly, once the faculty is educated about the evaluation and
encouraged to explain the importance of the ratings, the students’ input might be
valued highly as they could most probably demonstrate their credibility in evaluation.

41
Other Resources
While self-evaluation, peer review, and student ratings are the most common
ways to assess teaching quality, Cashin (1989) listed other resources that could
contribute to this enterprise such as teaching portfolios or dossiers, colleagues,
administrators, chair/dean, administrators, and instructional consultant. Teaching
portfolios or dossiers include various information from degrees and certificates
obtained by the teacher to the course materials such as syllabus, materials, and the
like. Colleagues, whom Cashin defined as “all faculty who are/not familiar with the
relevant teacher’s content area” (p.2) could provide input in terms of curriculum
development, delivery of instruction, and assessment of instruction.
Chair/dean, who are faculty member’s immediate supervisor, could provide
information regarding faculty member’s fulfillment of administrative requirements.
Administrators consist of those that do not necessarily have supervisory relationship
to the faculty member but could contribute to the evaluation of teaching in terms of to
what extent the faculty member fulfills teaching responsibilities. Librarian, bookstore
manager could be categorized under this title.
Instructional consultants are not very common in most of the universities but
are certainly helpful in teachers’ improving their teaching. These consultants, Cashin
(1989) believed should offer judgments to the faculty member for their improvement
and hence should be excluded in supplying data for personnel decision unless under
the request of the faculty member.
Judging by the benefits and limitations of each measure mentioned above,

42
supplementing one measure with some others would provide a broader and clearer
picture of teaching effectiveness as is advocated by most researchers. As Chism
(1999) asserted “for evaluations of teaching to be fair, valid, and reliable, multiple
sources of information must be engaged, multiple methods must be used to gather
data, and must be gathered over multiple points in time” (p.4).
Teacher Self-Efficacy
Teacher self-efficacy is defined in various ways with similar navigations such
as “the extent to which the teacher believes he or she has the capacity to affect student
performance” (Berman, McLaughlin, Bass, Pauly, & Zellman, 1977, p.137);
“teachers’ belief or conviction that they can influence how well students learn, even
those who may be difficult or unmotivated (Guskey & Passaro, 1994, p.4); “an
individual teacher’s expectation that he or she will be able to bring about student
learning” (Ross, Cousins, & Gadalla, 1996, p.386); “teachers’ belief in their ability to
have a positive effect on student learning”; and “personal beliefs about one’s
capabilities to help students learn” (Pintrich & Schunk, 2002, p.331); and “the
teacher’s belief in his or her capability to organize and execute courses of action
required to successfully accomplish a specific teaching task in a particular context
(Tshannen-Moran, Woolfolk-Hoy, & Hoy, 1998, p.233). Teacher’s sense of efficacy
has been investiated through two separate conceptual theories: Rotter’s social
learning theory (1966) and Bandura’s social cognitive and self-efficacy theory
(1977).

43
Locus of Control (Rotter, 1966)
The initial research was conducted by the RAND researchers (cf. Tschannen-
Moran, Woolfolk-Hoy, & Hoy, 1998) and was based on Rotter’s (1966) theory with
an emphasis on “casual beliefs about the relationship between actions and outcomes”
(Bandura, 1997, p. 20). Two items related to whether the control of reinforcement
such as student learning and motivation, is contingent on the teacher or external
factors were interspersed into an extensive questionnaire. This initiated the construct
‘teacher efficacy’ as a field of research. Accordingly, teacher self-efficacy was
initially perceived as whether teachers believed that they could control the
reinforcement of their actions, that is, whether “the control of reinforcement lay
within themselves or in the environment” (Tschannen-Moran, Woolfolk-Hoy, & Hoy,
1998, p.202). This definition postulated that teachers with high teacher self-efficacy
believe that they can control or influence achievement and motivation, while their
low efficacious counterparts believe that their control is overwhelmed with external
factors. The two items used are cited below:
Item 1. “When it comes down to it, a teacher really can’t do much because
most of a student’s motivation and performance depends on his or her home
environment.” This aspect of teaching was labeled as ‘general teaching efficacy’
(GTE) (cf Tschannen-Moran & Hoy, 2001), which indicated teachers’ judgment of
whether education at home, race, gender, environmental factors, and the like
influence students’ motivation and performance.
Item 2. “If I really try hard, I can get through to even the most difficult or

44
unmotivated students.” This aspect of teaching that focuses on whether the teacher
assumes self confidence in making a difference in students’ performance was defined
as personal teaching efficacy (PTE). The sum of the both items was labeled as teacher
self-efficacy.
Following the RAND research on teacher self-efficacy, several researchers
concerned with the reliability and validity of these two items stepped into the realm of
teacher self-efficacy in K-12 settings and very few in college settings. Teacher Locus
of Control (Rose & Medway, 1981), Responsibility for Student Achievement
(Guskey, 1982), and Web Efficacy Scale (Ashton, Olejnik, Crocker, & McAuliffe,
1982), which are grounded on Rotter’s (1966) theory of internal versus external
control, are to name several instruments designed to measure teacher self-efficacy in
K-12 settings.
To begin with, Rose and Medway (1981) developed 28-item Teacher Locus of
Control (TLC) with a forced-response format, in which teachers assigned
responsibility for student success and failures by choosing between two given
explanations related to the situation. This research yielded a weak relationship with
GTE and PTE of RAND items, and Rose and Medway proposed that TLC was a
better predictor of teacher behaviors such as teachers’ willingness to implement new
instructional techniques than Rotter’s (1966) internal-external scale.
In the Responsibility for Student Achievement (RSA), consisting of 30 items,
Guskey (1982) presented two subscales, responsibility for student success and
responsibility for student failure. His research findings indicated positive relationship

45
between teacher self-efficacy by RAND researchers and responsibility for student
success and failure.
The Webb Efficacy Scale was (Ashton et al., 1982) was another attempt to
extend the two items of teacher self-efficacy by RAND researchers and increase
reliability. To this end, Ashton et al. developed a 7-item forced-choice survey, in
which teachers determined if they strongly agree with either the first or the second
item provided related to teaching behaviors.
Social Cognitive Theory (Bandura, 1977)
The second perspective of teacher self-efficacy was derived from Bandura’s
social cognitive theory and self-efficacy (1977). The teacher self-efficacy instruments
that were founded in social cognitive theory are the Teacher Self-efficacy Scale
(Gibson & Dembo, 1984). Science Teaching Efficacy Belief Instrument (Riggs &
Enochs, 1990), and Ashton Vignettes (Ashton, Olejnik, Crocker, & McAuliffe, 1982).
Social cognitive theory proposes that instead of being autonomous agents or passive
conveyers of environmental influences, individuals are interactive agents who
contribute to their motivation and behavior within a system of triadic reciprocal
causation (Bandura, 1986). In this model, personal factors and environmental events
determine human action. Accordingly, people are likely to engage in tasks they
believe they are capable of performing, while having little incentive to engage in
those they believe they cannot produce desired outcomes (Bandura, 1986). Since
these beliefs contribute to determining how people feel, think, motivate themselves,

46
and behave, they are regarded as relatively powerful determinants of behavior
compared to actual capability of accomplishing. As such, these beliefs are powerful in
predicting how people behave than what they are actually capable of accomplishing.
Gender Differences in Teacher Self-Efficacy
Research has indicated gender differences in teacher self-efficacy. To begin
with, Evans and Tribble (1986) found statistical difference between female and male
preservice teachers’ self-efficacy with the female teachers having higher teacher self-
efficacy than their male counterparts. Shadid and Thompson (2001) found a positive
relationship between being female and teacher self-efficacy. This association was also
supported by the findings of Ross (1994). Raudenbush, Rowan, and Cheong (1992)
also reported that female high school teachers had higher self-efficacy beliefs than
male high school teachers. Coladarci’s (1992) findings of female teachers’ higher
commitment to teaching due to higher self-efficacy than those of male teachers’ also
lends support to the gender differences in teachers’ self-efficacy.
Years of Experience, Pedagogical Training and Teacher Self-Efficacy
Benz, Bradley, Alderman, and Flowers, (1992) examined differences across
different levels of teaching experience ranging from preservice teachers to college
professors and indicated that more experienced teachers reported higher self-efficacy
than their peers in some instances such as planning and evaluation. Preservice
teachers’ low self-efficacy was suggested to be due to lack of knowledge in these

47
areas.
Research findings by Prieto and Altmaier (1994) indicated a significant
positive relationship between prior training and previous teaching experience with
teacher self-efficacy. In this study, graduate teaching assistants with prior training and
teaching experience reported higher self-efficacy than their counterparts who did not.
Also, Woolfolk-Hoy and Spero (2005) conducted a research investigating changes in
teacher self-efficacy during the early years of teaching and found significant increases
in teacher self-efficacy during student teaching, but a significant decrease the first
year of teaching. They related this decline to the fact that novice teachers realized that
teaching was beyond method and strategy.
Correlates of Teacher Self-Efficacy
Researchers argue that teacher self-efficacy is strongly related to student
achievement (Woolfolk, A.E., Rosoff, B., & Hoy, W.K., 1990; Ashton & Webb,
1986; & Gibson and Dembo, 1984; Schaller, K. A., & DeWine, S., 1993; Tracz, S.
M., & Gibson, S., 1986; Brownell and Pajares, 1999; Ashton & Others, 1983);
teaching behaviors (Ashton & Webb, 1986; Ghaith & Shaaban, 1999; Ghaith &
Yaghi, 1997; Woolfolk, Rosoff, & Hoy, 1990; Ashton & Others, 1983); students’
self-efficacy beliefs (Ross et al., 2001; Tschannen-Moran & Hoy, 2001; Midgley,
Feldlaufer, & Eccles, 1989); commitment to teaching (Coladarci, 1992; Evans &
Tribble, 1986); utilization of instructional methods (Burton, 1996; Ghaith & Yaghi,
1997); classroom management (Chambers, 2001); special education referrals (Meijer

48
& Foster, 1988; Brownell & Pajares, 1999); and teaching effectiveness (Henson,
Kogan, & Vacha-Haase, 2001; Ashton & Others, 1983; Tracz & Gibson, 1986;
Guskey, T. R., 1987) (see Table 3).
Table 3
Correlates of Teacher Self-Efficacy _____________________________________________________________________
Correlates Researcher, Date _____________________________________________________________________
student achievement Woolfolk et al., 1990; Ashton & Webb,
1986; & Gibson & Dembo, 1984; Schaller,
K. A., & DeWine, S., 1993; Tracz, S. M., &
Gibson, S., 1986; Brownell & Pajares, 1999;
Ashton & Others, 1983
teaching behaviors Ashton & Webb, 1986; Ghaith & Shaaban,
1999; Ghaith &Yaghi, 1997; Woolfolk et
al., 1990; Ashton & Others, 1983
students’ self-efficacy beliefs Ross et al., 2001; Tschannen-Moran & Hoy,
2001; Midgley et al., 1989
commitment to teaching Coladarci, 1992; Evans & Tribble, 1986 utilization of instructional methods Burton, 1996; Ghaith & Yaghi, 1997; _____________________________________________________________________

49
Table 3 (continued)
Correlates of Teacher Self-Efficacy _____________________________________________________________________
Correlates Researcher, Date _____________________________________________________________________
classroom management Chambers, 2001 special education referrals Meijer & Foster, 1988; Brownell & Pajares,
1999
teaching effectiveness Henson et al., 2001; Ashton & Others, 1983;
Tracz & Gibson, 1986; Guskey, T. R., 1987
_____________________________________________________________________
Student Achievement
Ashton and Others (1983) investigated the relationship between teachers’ self-
efficacy and student learning and reported significant relationship between efficacy
beliefs and student achievement as well as student-teacher interaction. Teachers with
high self-efficacy beliefs were more inclined to maintain high academic standards for
their students than those with lower self-efficacy, and their students had higher scores
in achievement tests than those students of lower self-efficacy beliefs. Likewise,
Woolfolk and Hoy’s (1990) research with prospective teachers indicated that
prospective teachers with high self-efficacy beliefs believed that they had the ability
to make a difference in student achievement. Also Woolfolk et al. (1990) stated that

50
teachers with high sense of self-efficacy beliefs tended to trust their students’ abilities
more and shared responsibility for solving problems. Besides, Tracz and Gibson
(1986) suggested that teachers’ self-efficacy beliefs had an impact on the reading
achievement of elementary school students.
Teaching Behaviors
Teachers with different levels of teacher self-efficacy demonstrate different
teaching behaviors. To illustrate, Ashton and Webb’s (1986) investigation indicated
that compared to their low self-efficacy counterparts, high self-efficacy teachers
regard low achievers as “reachable, teachable, and worthy of teacher attention and
effort” (p. 72), while building warm relationships with their students. Low self-
efficacy teachers, on the other hand, were threatened by these relationships as they
perceived that they challenge their authorities and found security in the positional
authority they receive from the teaching role.
Not surprisingly, high self-efficacy teachers were more willing to show to
their students that they care about them and were concerned about their problems and
achievement. Considering the possibility of correcting misbehavior, they did not
resort to embarrassing students that misbehaved or gave incorrect responses like most
of the low self-efficacious teachers, and they tended to make less negative comments
and no embarrassing statements to manage their classroom.
Teachers with high self-efficacy beliefs monitor students’ on-task
behavior and concentrate on academic achievement (Ashton & Others, 1983); spend

51
more time in preparation or paperwork than their low self-efficacy counterparts, do
not resort to criticism when students give incorrect response, and lead their students
to correct responses more effectively (Gibson & Dembo, 1984); and place greater
emphasis on higher order instructional objectives and outcomes (Davies, 2004).
Students’ Self-Efficacy Beliefs
Ross (2001) suggested that teacher self-efficacy is related to student
efficacy beliefs by stating the following:
There are several reasons why achievement and self-efficacy increased when students were taught by teachers with greater confidence in their ability to accomplish goals requiring computer skills or in their ability to teach students how to use computers…First, teachers with high self-efficacy beliefs are more willing to learn about and implement instructional technologies and take more responsibility for training students in computer uses rather than delegating the responsibility of student experts. They are also more likely to provide additional support for the difficult-to-teach students and less worried that students might raise issues they cannot deal with. They are also more likely to persist through obstacles seeing them as temporary impediments. (p.150)
Midgley et al. (1989) investigated the relation between students; beliefs in
their mathematics performance and their teachers’ self-efficacy beliefs. The
longitudinal study resulted in the findings that teacher self-efficacy had a strong effect
on students’ beliefs especially the low-achievers. It was also documented that
students who moved from high efficacious teachers to lower efficacious teachers
ended up in having lower expectations of their performance and expectancies in
mathematics.

52
Commitment to Teaching
Evans and Tribble (1986) emphasized high self-efficacy beliefs in
commitment to teaching as did Coladarci (1992), who reported general and personal
teacher self-efficacy to be the strongest predictors of commitment to teaching.
Accordingly, the higher the self-efficacy beliefs of teachers, the greater was their
commitment to teaching. In the relevant study, female teachers’ commitment to
teaching was also found to be higher than that of male teachers. Besides, research
conducted by Caprara et al. (2003) investigating the relation between self-efficacy
beliefs and teachers’ job satisfaction substantiated that personal and collective-
efficacy beliefs determined distal and and proximal job satisfaction of teachers,
respectively.
Utilization of Instructional Methods
Burton (1996) explored association of the use of instructional practices and
teacher self-efficacy of 7th and 8th grade science teachers and reported a positive
relationship between the use of constructivist instructional methods and teacher self-
efficacy. That is, the teachers with high self-efficacy beliefs tended to utilize more
constructivist methods in their instruction than low-self-efficacy teachers. Another
research by Ghaith and Yaghi (1997), which investigated the relationships between
self-efficacy and implementation of instructional innovation also yielded similar
results suggesting that personal teacher self-efficacy was positively correlated with
teachers’ attitudes towards implementing new instructional practices.

53
Classroom Management
Chambers et al. (2001) scrutinized personality types and teacher self-efficacy
of beginning teachers as predictors of classroom control orientation and identified
teacher self-efficacy as a stronger predictor of instructional classroom management
than personality types. In a similar study, Woolfolk et al. (1990) found that the
prospective teachers’ high level of efficacy beliefs tended to develop a warm and
supportive classroom environment. Woolfolk and Hoy’s (1990) research indicated
that prospective teachers with high self-efficacy beliefs believed they had the ability
to implement more humanistic control strategy of their students. Ashton and Webb
(1986) reported that low-sense-of-self-efficacy teachers not only attributed classroom
problems to the shortcomings of students, but they also claimed that low student
achievement was due to “lack of ability, insufficient motivation, character
deficiencies, or poor home environments” (p. 67-68).
Special Education Referrals
Podell and Soodak (1993) examined teachers’ self-efficacy and their decisions
to refer their students to special education and found that teachers with low self-
efficacy beliefs were more likely to refer children even with mild academic problems
to special education. Similar results were reported by Meijer and Foster (1988), who
stated that high efficacious teachers were less likely to refer a difficult student to
special education unlike the low efficacious teachers. Similarly, Brownell and
Pajares’s research (1999) findings indicated that teachers’ self-efficacy beliefs had a

54
direct impact on their perceived success in instructing mainstreamed special
education students.
Teaching Effectiveness
Henson, Kogan, and Vacha-Haase (2001) state that strong sense of efficacy is
one of the best documented attributes of effectiveness as it is strongly related to
student achievement as supported by research studies (Ashton & Webb, 1986; Ross,
1992; Gibson & Dembo, 1984; Guskey & Passaro, 1994). In a research by Swars
(2005), which included elementary preservice teachers, it was indicated that teachers’
perceptions of teaching effectiveness were associated with teacher self-efficacy.
According to Bandura (1997), teachers’ effectiveness is partially determined by their
self-efficacy in managing an orderly class contributing to learning and providing
students with a good influence that would invoke in them a sense of academic
pursuits.
Although teacher self-efficacy was reported to be related to teaching
effectiveness (e.g. Gibson & Dembo, 1984; Bandura, 1997; Henson et al., 2001), it is
not used as widely as other methods of teaching effectiveness such as student ratings
and peer ratings. Several applications have been conducted mostly in K-12 settings,
and the teaching effectiveness literature on higher education level offers room for
research to assess college professors’ self-efficacy beliefs in relation to teaching
effectiveness. One of the purposes of this study was to design an instrument that
captures teachers’ sense of efficacy in higher education settings to contribute further
55
research in the realm of teaching effectiveness. It was proposed that teacher self-
efficacy of professors would predict teaching effectiveness.
Summary
In higher education, student ratings, self-assessment, peer review, external
observation, student learning, and administrator’s ratings (Feldman, 1989; Marsh &
Roche, 1997) provide evidence of how effectively the professors teach. Since there is
no single measure to capture teaching effectiveness (Marsh, 1984),and that every
method to capture teaching effectiveness bear validity concerns to some extent, for
summative evaluation especially, most higher education institutions resort to more
than one of these sources. Research on teaching efficacy beliefs, which has been
documented to be related to student achievement, teaching behaviors, students’
efficacy beliefs, commitment to teaching, application of instructional methods,
classroom management, special education referrals, and teaching effectiveness
(Woolfolk et al., 1990; Ashton & Webb, 1986; Ross et al., 2001; Coladarci, 1992;
Burton, 1996; Chambers, 2001; Brownell & Pajares, 1999; Guskey, T. R., 1987),
calls for its application in higher education settings to get a measure of teaching
effectiveness.

56
III. METHODS
Purpose of Study
Teaching Effectiveness in Higher Education
While one of the purpose of the study was to develop an instrument to
measure university and college professors’ perceived efficacy beliefs in teaching, the
influence of the factors such as gender, academic rank, years taught, and pedagogical
training on the development of teacher self-efficacy, the relationship between teacher
self-efficacy and teaching effectiveness on higher education, and the influence of
course and student characteristics on student ratings were also examined. In addition,
it was the researcher’s intention to shed light on students’ and professors’ perceptions
towards student ratings and the myths to further use the information for making
suggestions to improve teaching assessment methods.
As cited by Tschannen-Moran, Woolfolk-Hoy, and Hoy (1998), teacher self-
efficacy was initially defined as “the extent to which the teacher believes he or she
has the capacity to affect student performance” (Berman, McLaughlin, Bass, Pauly, &
Zellman, 1977, p.137); or as “teachers’ belief or conviction that they can influence
how well students learn, even those who may be difficult or unmotivated” (Guskey &
Passaro, 1994, p. 4). Researchers argue that teacher self-efficacy is strongly related to

57
student achievement (see Ashton & Webb, 1986; & Gibson and Dembo, 1984) and
that teachers with different levels of teacher self-efficacy demonstrate different levels
of teaching behaviors.
Teaching effectiveness, on the other hand, has been defined in various ways
by researchers. To illustrate, Cashin (1989) states “all the instructor behaviors that
help students learn” constitute effective teaching (p. 4), whereas Wankat (2002)
defines effective teaching as “teaching that fosters student learning” (p.4). In 1982,
Marsh proposed a nine-dimension model of teaching effectiveness upon arguing
teaching, hence effective teaching, is a multidimensional construct. He specified his
proposed nine dimensions of effective teaching as: learning/value, enthusiasm,
organization, group interaction, individual rapport, breadth of coverage, workload,
exams/grading, and assignments. These dimensions have been supported by
numerous researchers (e.g. Sherman et al., 1987; . Hativa, Barak, & Simhi, 2001;
McKeachie, 2001; Young & Shaw, 1999; & Fiedler et al., 2004) and were used in the
current study.
The research problem addresses the need to utilize an alternative method to
assess teaching effectiveness as complementary to the current methods used in
university and college settings. In particular, the study investigated the following
questions:
1- Does professor’s self-efficacy predict their teaching effectiveness?
2- Do individual professor variables (i.e., gender, academic rank, years taught, and
pedagogical training) predict professors’ self-efficacy?

58
3- Do individual professor variables (i.e., gender, academic rank, years taught, and
pedagogical training) influence student ratings of overall teaching effectiveness?
4- Are there statistically significant differences between students’ and professors’
perceptions on student rating myths?
5- Do student gender, grade point average (GPA), and academic year (e.g. freshman,
senior) predict an overall student rating myth?
6- Is there a statistically significant relationship between student and course
characteristics and student ratings?
Research Design
Variables
This study employed non-experimental research and investigated the extent to
which the variables are related to each other. As it was designed to focus primarily on
the relation between teacher self-efficacy and teaching effectiveness of college
professors, these constructs were used as the dependent variables in concert with the
research questions to be discussed below. Professors’ self-efficacy was measured by
Teaching Appraisal Inventory (TAI), which was comprised of eight dimensions of
self-efficacy in teaching and an overall teacher self-efficacy. To obtain a measure of
teaching effectiveness of the professors, on the other hand, Student Evaluation of
Educational Quality (SEEQ) (Marsh, 1982), consisting of nine dimensions, was used.
In addition, perceptions of student rating myths were measured by a section of

59
Teaching Appraisal Inventory (TAI), comprised of 16 myths compiled by Aleamoni
(1999). The independent variables were gender, pedagogical training, college
affiliated with, teaching experience, rank, and tenure status, which were obtained
from descriptive questions in TAI.
Instrumentation
Teaching Appraisal Inventory (TAI) and SEEQ (Marsh, 1982) were
administered to faculty members to assess teacher self-efficacy beliefs and students to
assess professors’ teaching effectiveness, respectively.
Teaching Appraisal Inventory (TAI)
Teaching Appraisal Inventory (TAI) that aimed to capture teacher self-efficacy of
college professors was developed through review of existing surveys related to
teacher self-efficacy such as Teacher Locus of Control (Rose & Medway, 1981),
Responsibility for Student Achievement (Guskey, 1982), Web Efficacy Scale (Ashton
et al., 1982), Teacher Efficacy Scale (Gibson & Dembo, 1984), Science Teaching
Efficacy Belief Instrument (Riggs & Enochs, 1990), Ashton Vignettes (Ashton et al.,
1982), SEEQ (Marsh, 1982), and the existing literature on teacher self-efficacy. The
conceptualization of teacher self-efficacy in this research was based on Bandura’s
(1977) social cognitive theory.
In determining how to design self-efficacy scales to best capture the
measure, Bandura (2001) urged that perceived self-efficacy should be distinguished
60
from locus of control, self-esteem, and outcome expectancies. He explained that locus
of control is concerned with whether the agent’s actions or external forces outside of
agent’s control determine the outcome contingencies, and this is not concerned with
perceived capability, which defines self-efficacy beliefs. Accordingly, whether the
teacher has control over the student outcomes does not really provide a valid measure
for perceived self-efficacy.
Bandura (2001) also distinguished self-efficacy from outcome expectancies
through expounding that self-efficacy is a judgment of capability to execute
performances of interest, whereas outcome expectation is a judgment of what the
likely consequences might be given such performances. Self-judgment in terms of
how well the individual will be able to perform in a given situation plays a major role
in setting personal standards and regulating behavior, while determining the expected
outcomes to a large extent.
Teaching Appraisal Inventory (TAI) was designed in concert with Bandura’s
recommendations. It consists of four parts: Part A, B, C, and D. Part A includes 43
items, constructed to obtain information related to teacher self-efficacy beliefs,
whereas Part B consists of 12 items, which are based on items related to locus of
control related to students’ achievement. The faculty members are instructed to
respond to the items on a 7-point scale (1=not at all to 7=completely). Since the
teacher self-efficacy items were designed parallel to the dimensions of effective
teaching, it was expected that the teacher self-efficacy items would demonstrate
multidimensionality as well. Part C is composed of the 16 myths related to student

61
ratings, which were gathered through previous literature (See Aleamoni, 1999). The
myths section of both of the surveys was identical, and to establish content and face
validity, the items related to the myths were analyzed by the researchers and several
faculty members in based on related literature.
Part D consists of questions related to the college professors’ teach at, gender,
academic rank, tenure status, years of experience in teaching, allocation of their
academic time, and the approaches they have taken to improve their teaching.
The professors completed the assigned surveys focusing on a particular class
upon their agreement on participating in the study for teacher self-efficacy is domain
and context specific. Each class that participated in the study was coded so as to link
professors’ data to the students’. The survey results were expected to provide
information about college professors’ teacher self-efficacy beliefs, which is regarded
as an indicator of teaching effectiveness. Dimensions were established through
literature review and reliability analysis. Measure of each dimension was calculated
by taking averages, whereas the general self-efficacy in teaching was gathered by one
general item in the TAI survey.
Student Evaluation of Educational Quality (SEEQ)
SEEQ is an instrument designed and validated by Marsh in 1982. It comprises
nine dimensions: learning/value, enthusiasm, organization, group interaction,
individual rapport, breadth of coverage, workload, exams/grading, assignments, and
an overall teaching effectiveness measure. The survey consists of 31 items of the

62
aforementioned nine dimensions related to the effectiveness of the college professor
and items regarding demographic information (e.g. academic year in school, GPA,
gender, expected grade, etc.). Students are instructed to respond to the items on a 5-
point scale (1= very poor to 5=very good). The factor analyses of responses supported
the factor structure intended, demonstrating the distinct components of teaching
effectiveness and the measure (Marsh, 1982, 1991).Due to its multidimensional
nature, the survey instrument yields separate scores for each dimension rather than
only a total score of teaching effectiveness. To this end, the items of each dimension
are added together and divided into the number of items to get a measure of that
dimension and make comparisons among professors. Overall teaching effectiveness
measure was obtained through the average of two items in SEEQ.
Validity and Reliability
To assess the consistency across items of the survey instruments, Cronbach’s
Alpha was used for the items as a whole as well as for each subscale of SEEQ and
TAI. Huck (2002) stated that compared to Kuder-Richardson 20 Reliability,
Cronbach’s Alpha is “more versatile because it can be used with instruments made up
items that can be scored with three or more possible values” (p. 91-92).
In the original study of SEEQ, reliability estimates for the nine dimensions
were examined through Cronbach’s Alpha, yielding alpha coefficients that vary
between .88 and .97 (Marsh, 1982). The validity of the scores yielded was supported
through multitrait-multimethod analysis of relations between nine dimensions of
63
effective teaching.
In research studies, validity can be addressed through three approaches:
content, construct, and criterion validity (Huck, 2002). In the proposed study, content
and construct validity were addressed. To establish content and face validity, the
items of the Teaching Appraisal Inventory (TAI) were analyzed by the researcher and
the literature was used to ensure that they are in concert with those of SEEQ (Marsh,
1982), which encompasses nine dimensions of teaching. The scale items were then
reviewed by the researcher and the committee members, in terms of content and the
Likert-type scales incorporated. Some of the items were excluded from the survey,
whereas some were revised to be included in the instrument. After the first revision,
the survey was examined by two professors specializing in educational psychology to
finalize the instrument to be used in the research study.
Bandura (2001) suggested the following:
The ‘one-measure-fits-all’ approach usually has limited explanatory and predictive value because most of the items in an all-purpose measure may have little or no relevance to the selected domain of functioning. Moreover, in an effort to serve all purposes, items in a global measure are usually cast in a general, decontextualized form leaving much ambiguity about exactly what is being measured and the level of task and situational demands that must be managed. Scales of perceived self-efficacy must be tailored to the particular domains of accurately reflect the construct. Self-efficacy is concerned with perceived capability. The items should be phrased in terms of can do rather than will do. Can is a judgment of capability; will is a statement if intention. Perceived self-efficacy us a major determinant of intention, but the two constructs are conceptually and empirically separable. (p.1)
Accordingly, the items that composed the instrument were selected from

64
college teaching literature, designed and worded under Bandura’s (2001) guidance.
Participants
Due to the scope of the study, two populations were involved: students and the
faculty members.
Student Population
Student population consists of undergraduate and graduate students enrolled
in Auburn University, a southeastern land-grant university, which is regarded as the
largest university in Alabama. According to the Spring 2005 data from Institutional
Research and Assessment, the university has an enrollment of 18,485 undergraduate
and first professional students and 3,026 graduate students, with a total of 21,511
(10,894 male and 10,617 female) students. Out of eighteen thousand, four hundred
and eighty-four (18,484) undergraduate and first professional students (9,346 male
and 9,139 female), 823 study in College of Agriculture; 1153 in College of
Architecture, Design, and Construction; 3388 in College of Business; 1481 in College
of Education; 2504 in College of Engineering; 236 in School of Forestry and Wildlife
Sciences; 1004 in College of Human Science; 4448 in College of Liberal Arts as
undergraduate and 18 as first professional; 551 in School of Nursing; 476 in School
of Pharmacy as first professional; 1997 in College of Sciences and Mathematics; 395
in College of Veterinary Science; 13 transients and auditors, and 46 were categorized
under interdepartmental. Three thousand, six hundred and fifty-eight (3658) students

65
identified themselves as freshman, 3929 sophomore, 4259 junior, 5726 senior and
fifth year, 25 first professional, and 888 as non-degree students.
Out of three thousand and twenty-six (3,026) graduate students (1,548 male
and 1,478 female), 204 students study in College of Agriculture; 86 in College of
Architecture, Design, and Construction; 426 in College of Business; 701 in College of
Education; 618 in College of Engineering; 57 in School of Forestry and Wildlife
Sciences; 89 in College of Human Sciences; 390 in College of Liberal Arts; 23 in
School of Pharmacy; 276 in College of Sciences and Mathematics; 27 in College of
Veterinary Science; 7 transients and auditors; and 100 were enrolled under
interdepartmental. One thousand, six hundred and eighty-one (1,681) of the graduate
students were enrolled in a master’s program, 30 in specialist degree program, 1169
in doctoral degree program, while 103 students were in provisional status and 43 were
in non-degree status.
Table 4 displays the distribution of undergraduate and graduate students
across colleges and schools, gender, and class level.

66
Table 4
Distribution of Students across Colleges/ Schools, Gender, and Class Level _____________________________________________________________________ Variables Number of students
____________________________________ Undergraduate Graduate N=18,485 N=3,026
_____________________________________________________________________
Colleges
Agriculture 823 204 Architecture, Design, & Construction 1,153 86 Business 3,358 426 Education 1,481 701 Engineering 2,504 618 Forestry and Wildlife Sciences 236 57 Human Science 1,004 89 Liberal Arts 4,448 390 Nursing 551 --- Pharmacy 476 23 Sciences and Mathematics 1,997 27 Veterinary Science 395 47 Transients and Auditors 13 7 Interdepartmental 46 100
Gender Male 9,346 1,548 Female 9,139 1,478 Class Level Freshman 3,658 Sophomore 3,929 Junior 4,259 Senior 5,726 1st professional 25 Non-degree 888 43 _____________________________________________________________________

67
Table 4 (continued) _____________________________________________________________________ Variables Number of students ____________________________________ Undergraduate Graduate N=18,485 N=3,026 _____________________________________________________________________
Class Level
Master’s 1,681 Specialist 30 Doctoral 1,169 Provisional 103 _____________________________________________________________________
Student Sampling Procedure
Students were recruited from the classes of the faculty members who agreed
to participate in this research. Students of any ethnicity, gender, college, academic
year, and age were eligible to take part in the study as long as they were enrolled in
Auburn University during the time the surveys were provided, their professor was
involved in the study, and they were willing to participate.
It was expected that 500 to 2500 undergraduate and graduate students across
various colleges would participate in the study. Participants of the study were a total
of 968 students, 97 graduate and 871 undergraduate; and 34 faculty members, in a
southeastern university participated in this research study. 540 (55.8 %) students
were female and 409 (42.3%) were male. 19 (1.9%) students failed to indicate their
gender. Out of 968 students, 128 were freshman (13.22 %), 214 (22.11 %) were
sophomore, 272 (28.10 %) were junior, 246 (25.41 %) were senior and 97 (10.02 %)

68
were postgraduate students. 11 (1.14) students did not indicate their academic level.
One hundred and four (104) students (10.74 %) were enrolled in a class in
College of Architecture, Design, and Construction; 176 (18.18 %) in College of
Business; 425 (43.91 %) in College of Education; 78 (8.06 %) in College of
Engineering; 12 (1.24 %) in School of Forestry and Wildlife Sciences; 16 (1.65 %) in
College of Human Sciences; 78 (8.06 %) in College of Liberal Arts; 32 (3.31 %) in
School of Nursing; and 47 (4.86 %) in College of Sciences and Mathematics.
Six hundred and fifty-nine (659) (68.1 %) students indicated that they were
taking the particular course because it was a major requirement, 71 (7.3 %) indicated
because it was a major elective, 101 (10.4 %) indicated due to general education
requirement, 53 (5.5 %) were taking it because it was related to their minor degree,
and 73 (7.5 %) indicated they were taking that particular course because of general
interest only. Eleven (11) (1.1 %) students did not specify their reason for taking the
particular course. The GPA distribution of undergraduate students was as follows: 60
below 2.5, 302 between 2.5 and 3.0, 276 between 3 and 3.49, 133 between 3.5 and
3.7, and 185 above 3.7. 12 students did not specify their GPA.
Table 5 presents the demographics of the student sample across colleges,
gender, academic level, GPA, expected grade, and reasons for taking the class.
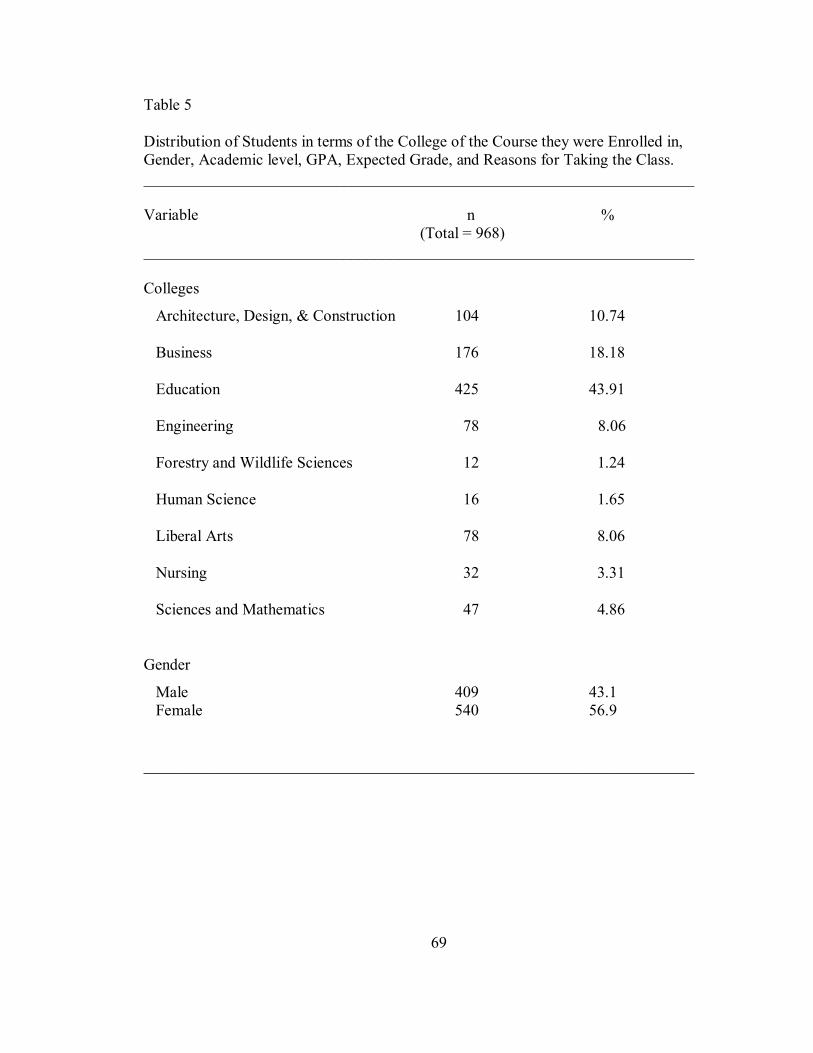
69
Table 5
Distribution of Students in terms of the College of the Course they were Enrolled in, Gender, Academic level, GPA, Expected Grade, and Reasons for Taking the Class. _____________________________________________________________________
Variable n %
(Total = 968) _____________________________________________________________________
Colleges
Architecture, Design, & Construction 104 10.74
Business 176 18.18
Education 425 43.91
Engineering 78 8.06
Forestry and Wildlife Sciences 12 1.24
Human Science 16 1.65
Liberal Arts 78 8.06
Nursing 32 3.31
Sciences and Mathematics 47 4.86
Gender
Male 409 43.1 Female 540 56.9
_____________________________________________________________________

70
Table 5 (continued)
_____________________________________________________________________
Variable n % (Total = 968) _____________________________________________________________________ Class Level
Freshman 128 13.2 Sophomore 214 22.1 Junior 272 28.1 Senior 246 25.4 Postgraduate 97 10.0 Expected grade
A 517 53.4 B 343 35.4 C 76 7.9 D 10 1.0 F 9 .9
Reasons for taking the class Major requirement 659 68.1
Major elective 71 7.3
General ed. requirement 101 10.4
Minor/related field 53 5.5
General interest 73 7.5
_____________________________________________________________________

71
The distribution of students in terms of gender and academic level with
comparison to those in population is presented in Table 6.
Table 6 Distribution of Students across Gender and Academic Level _____________________________________________________________________ Variables Sample Population Chi-Square n=968 N=21,511 _____________________________________________________________________
Gender 21.432***
Male 409 (43.1 %) 10,894 (50.64 %)
Female 540 (56.9 %) 10,617 (49.36 %)
Class Level 49.649 ***
Freshman 128 (13.2 %) 3,658 (17 %)
Sophomore 214 (22.1 %) 3,929 (18.26%)
Junior 272 (28.1 %) 4,259 (19.80 %)
Senior 246 (25.4 %) 5,726 (26.62 %)
Postgraduate 97 (10 %) 3,026 (14.07%)
_____________________________________________________________________ *p<.05, **p<.01, ***p<.001
As is shown in Table 6, the student sample of the current study
underrepresented male students as well as freshman, senior, and postgraduate

72
students. On the other hand, the sample overrepresented female students; sophomore,
and junior students.
Faculty Population
Faculty members employed by Auburn University constitute the second
population of the study. According to the 2004-2005 Data by Institutional Research
and Assessment, out of 1,177 faculty members (850 male and 327 female), 490 were
identified as full professor, 350 as associate professor, 244 as assistant professor, 68
as instructor, and 25 as visiting professor.
According to the Faculty Distribution Data of 2004-2005, the distribution of
faculty across colleges is as follows: 148 in College of Agriculture; 52 in College of
Architecture, Design, and Construction; 83 in College of Business; 86 in College of
Education; 147 in College of Engineering; 30 in School of Forestry and Wildlife
Sciences; 45 in College of Human Sciences; 278 in College of Liberal Arts; 10 in
School of Nursing; 42 in School of Pharmacy; 145 in College of Sciences and
Mathematics; and 102 in College of Veterinary Science. The remaining nine (9)
faculty members were employed in other units on campus. According to the tenure
data of 2003-2004, 142 faculty members in College of Agriculture; 34 in College of
Architecture, Design, and Construction; 63 in College of Business; 65 in College of
Education; 107 in College of Engineering; 26 in School of Forestry and Wildlife
Sciences; 39 in College of Human Sciences; 171 in College of Liberal Arts; 4 in
School of Nursing; 21 in School of Pharmacy; 126 in College of Sciences and

73
Mathematics; and 70 in College of Veterinary Science were tenured.
Faculty Sampling Procedure
Faculty members were recruited based on their willingness to participate
in the study. Faculty members of any ethnicity, gender, years of experience,
pedagogical training, research productivity, and college were eligible to participate in
the study. Marsh (1984) states “University faculty have little or no formal training in
teaching, yet find themselves in a position where their salary or even their job may
depend on their classroom teaching skills. Any procedure used to evaluate teaching
effectiveness would prove to be threatening and highly criticized” (p. 749). As such,
not many faculty members were willing to share how effective they teach measured
by student ratings. Thus, the response rate would not have been high enough to
validate the instrument designed for this study if random sampling had been utilized.
Although the aforementioned description of the population would allow for a
stratified sampling, convenience sampling and snowball sampling were used due to
potential low response rate by the faculty. Convenience samples are comprised of
participants who are available and willing to participate in the study (Huck, 2000).
The faculty members were contacted through emails asking their interest in
the pilot study. Once they demonstrated their willingness to participate, they were
provided with the Teaching Appraisal Inventory (TAI) to assess their own self-
efficacy in teaching and the Student Evaluation of Education Quality (SEEQ) (Marsh,
1982) to be given to their students in their relevant class to assess their teaching

74
effectiveness. They were also consulted for recruiting their colleagues. It was
expected that 25 to 100 professors and 500 to 2500 undergraduate and graduate
students across various colleges (e.g. education, business, engineering, nursing, and
human science) would participate in the study.
Thirty-four (34) professors, 16 (47.1 %) female and 18 (52.9 %) male,
participated in this research study. 1 (2.9 %) professor was from College of
Architecture, 3 (8.8 %) were from College of Business, 20 (58.8 %) were from
College of Education, 3 (8.8 %) were from College of Engineering, 1 (2.9 %) was
from School of Forestry, 1 (2.9 %) from College of Human Sciences, 2 (5.9 %) from
College of Liberal Arts, 1 (2.9 %) from School of Nursing, and 2 (5.9 %) were from
College of Sciences and Math.
Out of thirty-four participants, nine (9) (26.5 %) identified themselves as
graduate teaching assistant (GTA), 3 (8.8 %) as full professor, 11 (32.4 %) as
associate professor, 8 (23.5 %) as assistant professor, and three (3) (8.8. %) as
instructor. Fourteen (14) (41.2 %) professors were tenured and 14 (41.2 %) of them
were untenured. 6 professors did not specify their tenure status. In terms of
pedagogical training, 30 (88.2 %) professors gathered feedback from students using
the university course evaluation form, 13 (38.2 %) supplemented the university form
with questions tailored to their class, 22 (64.7 %) have had colleagues/peers observe
and review their teaching, 12 (35.3 %) have videotaped their teaching, 28 (82.4 %)
discussed their teaching with a colleague, 25 (73.5 %) have read about effective
teaching strategies, 15 (44.1 %) have attended workshops, 12 (35.3 %) professors

75
indicated that they have engaged in other ways to improve their teaching such as
reading research on effective teaching and learning.
Table 7 presents the demographics of the faculty sample in comparison to the
population.
Table 7
Demographics of Faculty across Colleges/Schools, Gender, Rank, and Tenure-Status _____________________________________________________________________ Variables Sample Population Chi-Square n=34 N=1177 _____________________________________________________________________ College/School Agriculture 0 148 (12.57 %)
Architecture, Design, & Const. 1 (2.9 %) 52 (4.4 %)
Business 3 (8.8 %) 83 (7 %)
Education 20 (58.8 %) 86 (7.3 %)
Engineering 3 (8.8 %) 147 (12.49 %)
Forestry and Wildlife Sciences 1 (2.9 %) 30 (2.5 %)
Human Science 1 (2.9 %) 45 (3.8 %)
Liberal Arts 2 (5.88%) 278 (23.62 %)
Nursing 1 (2.9 %) 10 (.8 %)
Pharmacy 0 42 (3.57%)
Sciences and Mathematics 2 (5.88 %) 145 (12.32 %)
Veterinary Science 0 102 (8.67 %)
___________________________________________________________________

76
Table 7 (Continued)
Demographics of Faculty across Colleges/Schools, Gender, Rank, and Tenure-Status _____________________________________________________________________
Variables Sample Population Chi-Square
n=34 N=1177 ____________________________________________________________________ Gender 10.742**
Male 16 (47.06 %) 850 (72.2 %)
Female 18 (52.94 %) 327 (27.78 %)
Rank 9.523*
Full Professor 3 (8.8 %) 490 (41.6 %)
Associate Professor 11 (32.35 %) 350 (29.74 %)
Assistant Professor 8 (23.53 %) 244 (20.73 %)
Instructor 3 (8.8 %) 68 (5.78 %)
Visiting Professor 0 25 (2.12 %)
GTA 9 (26.47 %)
Tenure 7.76**
Tenured 14 (41.18 %) 868 (73.75 %)
Non-tenured 14 (41.18 %) 309 (26.25 %)
_____________________________________________________________________ *p<.05, **p<.01, ***p<.001
As shown in Table 7, the faculty sample underrepresented the faculty in
College of Agriculture; Architecture, Design, and Construction; Engineering; Human
Science;
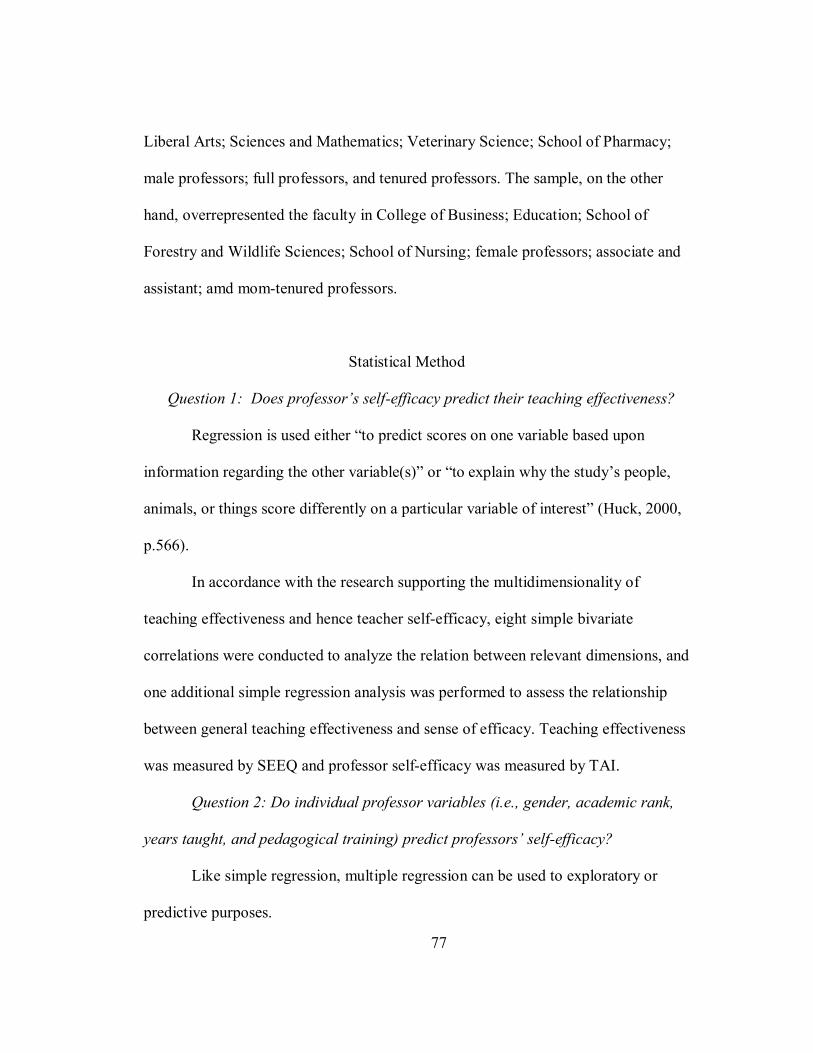
77
Liberal Arts; Sciences and Mathematics; Veterinary Science; School of Pharmacy;
male professors; full professors, and tenured professors. The sample, on the other
hand, overrepresented the faculty in College of Business; Education; School of
Forestry and Wildlife Sciences; School of Nursing; female professors; associate and
assistant; amd mom-tenured professors.
Statistical Method
Question 1: Does professor’s self-efficacy predict their teaching effectiveness?
Regression is used either “to predict scores on one variable based upon
information regarding the other variable(s)” or “to explain why the study’s people,
animals, or things score differently on a particular variable of interest” (Huck, 2000,
p.566).
In accordance with the research supporting the multidimensionality of
teaching effectiveness and hence teacher self-efficacy, eight simple bivariate
correlations were conducted to analyze the relation between relevant dimensions, and
one additional simple regression analysis was performed to assess the relationship
between general teaching effectiveness and sense of efficacy. Teaching effectiveness
was measured by SEEQ and professor self-efficacy was measured by TAI.
Question 2: Do individual professor variables (i.e., gender, academic rank,
years taught, and pedagogical training) predict professors’ self-efficacy?
Like simple regression, multiple regression can be used to exploratory or
predictive purposes.

78
Pedhazur (1997) asserts that multiple regression is superior to other statistical
analyses under the following conditions:
(1) when the independent variables are continuous; (2) when some of the independent variables are continuous and some are categorical, as in analysis of covariance, aptitude-treatment interactions, or treatments by level designs; (3) when cell frequencies in a factorial design are unequal and disproportionate, and (4) when studying trends in the data-linear, quadratic, and so on. (p. 406)
For the aforementioned research question, multiple regression was
performed to predict teaching efficacy by using the data regarding gender, academic
rank, teaching experience, and pedagogical training as the independent variables vary
from continuous and categorical and the dependent variable is continuous.
Categorical variable, academic rank, was coded using criterion-coding so as to
conduct regression analyses.
A total of nine (9) multiple regression analyses were used to examine whether
professor characteristics have an influence on general and each dimension of
perceived efficacy in teaching. Follow-up univariate analysis of variance (ANOVA)
was used to determine more specific differences among statistically significant
categorical predictors.
Question 3: Do individual professor variables (i.e., gender, academic rank,
tenure status, and teaching experience) influence student ratings of teaching
effectiveness?
Multiple regression analysis was used to assess to what extent professor
characteristics have an influence (if any) on the ratings they received in teaching.

79
Question 4: Are there statistically significant differences between students’
and professors’ perceptions on student rating myths?
Since there were 16 student rating myths, every one of these was used as a
measure. Consequently, multivariate analysis of variance (MANOVA) was used to
investigate differences between students and professors regarding their perceptions of
student rating myths.
Question 5: Do student gender, grade point average (GPA), and academic
year (e.g. freshman, senior) predict an overall student rating myth?
Multiple regression analysis was used to examine the extent to which student
characteristics have an impact on overall student rating myth. Appropriate follow-up
tests were performed to determine more specific differences among statistically
significant predictors.
Question 6: Is there a statistically significant relationship between student
and course characteristics and student ratings?
Multiple regression analysis was used to examine the extent to which student
and course characteristics have an impact on student ratings.
Summary of Methodology
The methodology of the current study focused on gathering data from
undergraduate and graduate students enrolled in a southeastern university and college
professors (graduate teaching assistant, instructor, assistant professor, associate
professor, and full professor) teaching at the same university. The students provided
80
data with regard to professors’ teaching effectiveness so that it would allow the
researcher to determine if relationship exists between teaching effectiveness and
professors’ efficacy beliefs, which was provided by the faculty. Data on perceptions
of student rating myths supplied both by the students and the faculty were included to
examine statistically significant differences between students and faculty as well as
male and female students. Demographics of students and faculty were also considered
for possible effects in overall teaching effectiveness and professors’ efficacy beliefs.

81
IV. RESULTS
Introduction
One of the purposes of the current study was to develop an instrument
capturing different dimensions of college professor’s sense of efficacy so as to
investigate the relation between professors’ efficacy beliefs and professors’ teaching
effectiveness. Also, the differences between students’ and professors’ perceptions of
student rating myths as well between female and male students were examined. It was
also the researcher’s intention to investigate professor characteristics as predictors of
teacher self-efficacy and overall effectiveness. It is also the researcher’s intention to
further use the information for making suggestions towards improvement of teaching
assessment methods. This chapter presents the results of the reliability analyses and
the research questions.
Data Analysis
Responses of 968 students and 34 faculty members were entered into an
SPSS data file. Analyses were performed by SPSS 13.0 version for Windows.
Research questions were:
1- Does professor’s self-efficacy predict their teaching effectiveness?
2- Do individual professor variables (i.e., gender, academic rank, years taught, and

82
pedagogical training) predict professors’ self-efficacy?
3- Do individual professor variables (i.e., gender, academic rank, years taught, and
pedagogical training) influence student ratings of overall teaching effectiveness?
4- Are there statistically significant differences between students’ and professors’
perceptions on student rating myths?
5- Do student gender, grade point average (GPA), and academic year (e.g. freshman,
senior) predict an overall student rating myth?
6- Is there a statistically significant relationship between student and course
characteristics and student ratings?
Initially, the nine dimensions measured by the Student Evaluation of
Educational Quality (SEEQ) and eight dimensions of Teacher Appraisal Inventory
(TAI) were considered for this study. Since one of the factors (workload) in SEEQ
did not correspond to any of the factors in TAI, it was discarded from data analyses.
The factors of SEEQ were learning/value, enthusiasm, organization, group
interaction, individual rapport, breadth of coverage, workload, exams/grading, and
assignments. Dimensions of TAI were efficacy in students’ learning, enthusiasm,
organization, group interaction, rapport with students, breadth of coverage,
exam/evaluation, and assignments.
Reliability Analysis of Teaching Effectiveness and Student Rating Myths
To assess internal consistency among items, reliability analysis was conducted
for each subscale in teaching effectiveness and an overall scale of student rating

83
myths. Table 8 provides a summary of the reliability analysis. Cronbach’s alpha
coefficients for student rating myths were .854 for students and .799 for professors.
Reliability analysis yielded high internal consistencies for each of these
dimensions, ranging from .662 for assignments to .886 for group interaction, with a
median reliability of .828, indicating acceptable internal consistency for each
subscale. In the original study of SEEQ, reliability estimates for the nine dimensions
were examined through Cronbach’s Alpha for the nine dimensions, yielding alpha
coefficients that vary between .88 and .97 (Marsh, 1982). All nine dimensions,
however, were also correlated with each other (Mdn correlation = .594). Therefore,
one overall dimension of teaching effectiveness was used in subsequent analysis. The
Cronbach’s alpha coefficient for this overall scale was .963. These correlations are
summarized in Table 9.
Table 8
Summary of Reliability Estimates for SEEQ _____________________________________________________________________ Instrumentation # items Cronbach’s α _____________________________________________________________________
Student Rating Myths
Professors 16 .799
Students 16 .854
SEEQ
Learning/Value 4 .833
_____________________________________________________________________
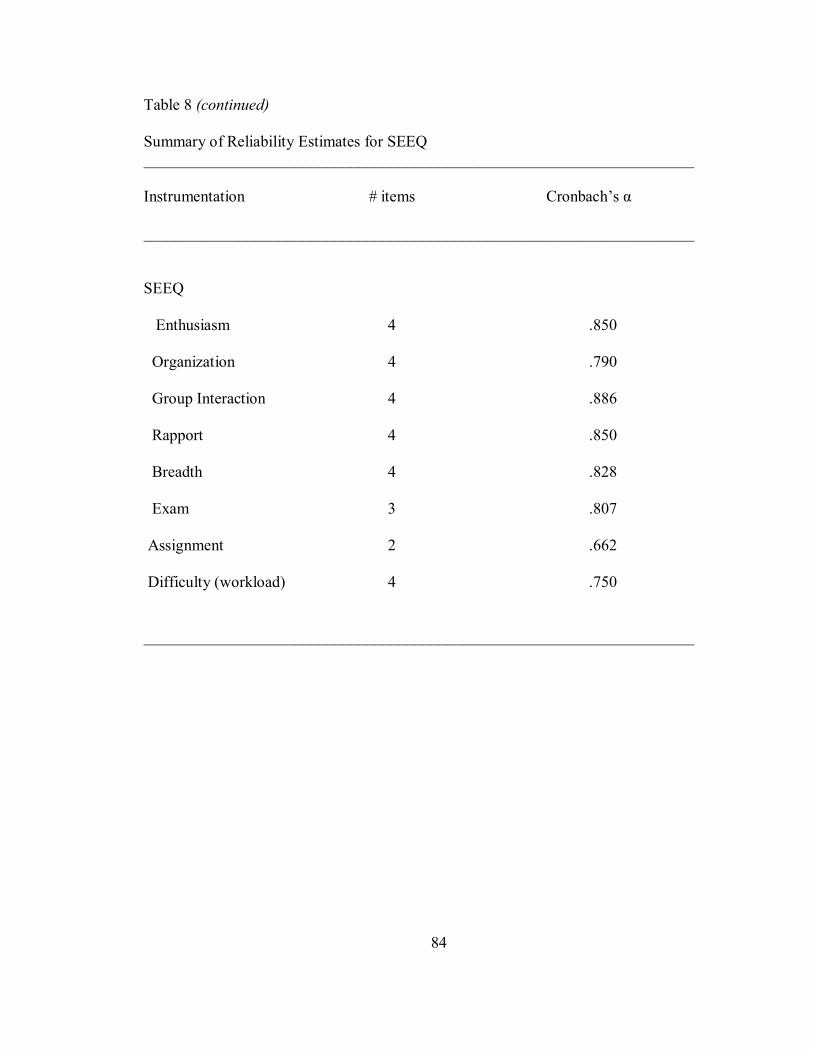
84
Table 8 (continued)
Summary of Reliability Estimates for SEEQ _____________________________________________________________________ Instrumentation # items Cronbach’s α _____________________________________________________________________
SEEQ
Enthusiasm 4 .850
Organization 4 .790
Group Interaction 4 .886
Rapport 4 .850
Breadth 4 .828
Exam 3 .807
Assignment 2 .662
Difficulty (workload) 4 .750
_____________________________________________________________________
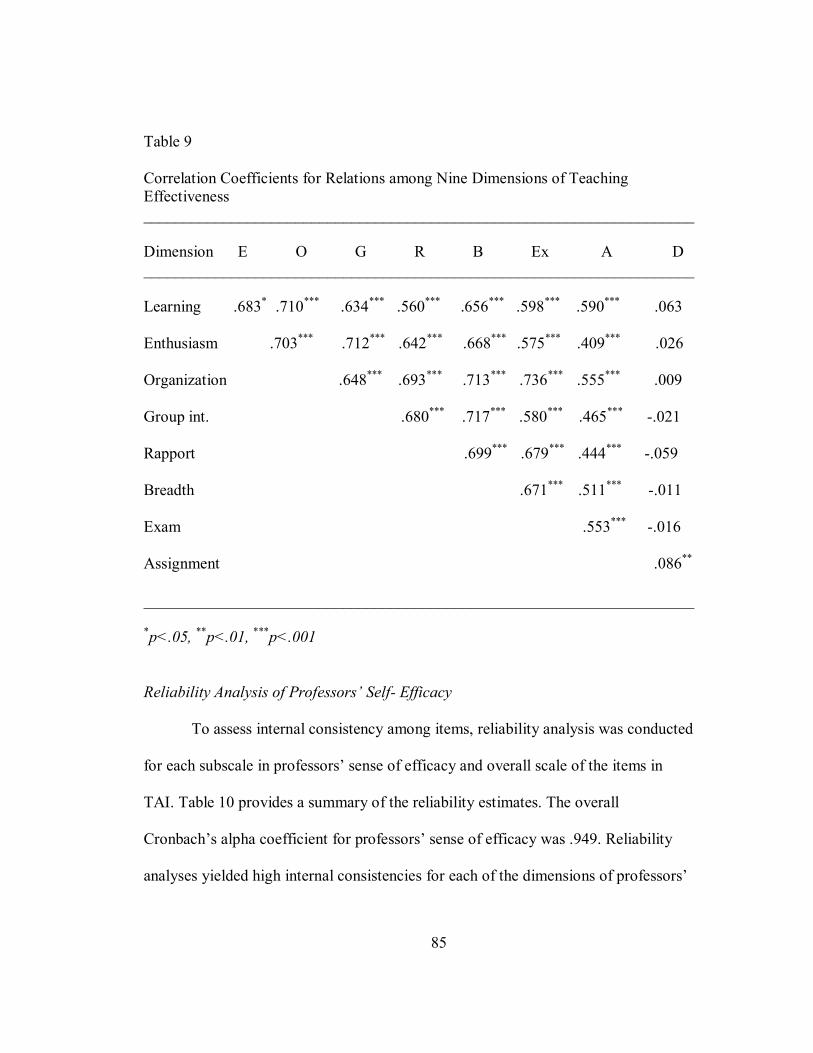
85
Table 9
Correlation Coefficients for Relations among Nine Dimensions of Teaching Effectiveness _____________________________________________________________________
Dimension E O G R B Ex A D _____________________________________________________________________
Learning .683* .710*** .634*** .560*** .656*** .598*** .590*** .063
Enthusiasm .703*** .712*** .642*** .668*** .575*** .409*** .026
Organization .648*** .693*** .713*** .736*** .555*** .009
Group int. .680*** .717*** .580*** .465*** -.021
Rapport .699*** .679*** .444*** -.059
Breadth .671*** .511*** -.011
Exam .553*** -.016
Assignment .086**
_____________________________________________________________________
*p<.05, **p<.01, ***p<.001
Reliability Analysis of Professors’ Self- Efficacy
To assess internal consistency among items, reliability analysis was conducted
for each subscale in professors’ sense of efficacy and overall scale of the items in
TAI. Table 10 provides a summary of the reliability estimates. The overall
Cronbach’s alpha coefficient for professors’ sense of efficacy was .949. Reliability
analyses yielded high internal consistencies for each of the dimensions of professors’

86
self-efficacy, ranging from .626 for breadth to .840 for learning, with a median
reliability of .816, indicating acceptable internal consistency for each subscale. All
eight dimensions, however, were also correlated with each other (Mdn correlation =
.567). These correlations are summarized in Table 11.
Table 10
Summary of Reliability Estimates of Professors’ Self-Efficacy Factors _____________________________________________________________________
Subscale # items Cronbach’s α ___________________________________________________________________ Learning 9 .840
Enthusiasm 6 .799 Organization 5 .823 Group Interaction 3 .764 Rapport 5 .823 Breadth 5 .626 Exam/Evaluation 2 .839 Assignment 2 .808
_____________________________________________________________________
Table 11
Correlation Coefficients for Relations among 8 Dimensions of Professors’ Self-Efficacy _____________________________________________________________________
Dimension E O G R B Ex A _____________________________________________________________________
Learning .799*** .684*** .686*** .724*** .700*** .570*** .526*** Enthusiasm .648*** .563** .639*** .524*** .534*** .341* Organization .479** .612*** .514*** .629*** .577*** Group int. .709*** .504*** .490*** .519*** Rapport .542** .694*** .592*** Breadth .438*** .449** Exam/Evaluation .388* _____________________________________________________________________ *p<.05, **p<.01, ***p<.001

87
Question #1: Does professor’s self-efficacy in teaching predict their teaching
effectiveness?
Simple correlation analyses were conducted to examine the relationship
between overall teaching effectiveness and professors’ overall self-efficacy. (See
Table 12 for the summary). However, the analysis failed to suggest any statistically
significant relationship (r= .322, F = 3.698, p > .05). In addition, to investigate the
relationship between the subscales of teaching effectiveness and professors’ self-
efficacy, eight (8) separate bivariate correlations were performed.
Table 12
Correlation Analyses Summary of Teaching Effectiveness and Professors’ Self-Efficacy _____________________________________________________________________
Measure r r2 t-value _____________________________________________________________________ Overall .322 .104 1.92
Learning .261 .068 1.53
Enthusiasm .484** .234 3.13
Organization .066 .004 .38
Group Interaction .305 .093 1.81
Rapport .205 .042 1.18
Breadth .469** .220 3.00
Exam/Evaluation .157 .025 .90
Assignment .223 .050 1.29 _____________________________________________________________________ *p<.05, **p<.01, ***p<.001

88
As presented in Table 12, the regression analyses indicated a statistically
significant relationship between teaching effectiveness in enthusiasm and professors’
self-efficacy in enthusiasm with an R2 of .234, (F = 9.796, p < .01). That is, self-
efficacy in enthusiasm accounted for 23.4 % of the variance in effectiveness in
enthusiasm. Similarly, teaching effectiveness in breadth accounted for 22 % of the
variance in self-efficacy in breadth with an R2 of .220 (F = 9.000, p < .01). The other
correlations failed to indicate statistical significance (p > .05).
Question #2: Do individual professor variables (i.e., gender, academic rank, years
taught, and pedagogical training) predict professors’ self-efficacy?
A backward regression analysis was performed to investigate the extent to
which individual professor characteristics were related to their overall sense of
efficacy and in eight dimensions of self-efficacy. Particularly, professor academic
rank (GTA, instructor, assistant professor, associate professor, or full professor),
gender, years taught, and number of pedagogical training they received were used as
predictors of an overall sense of efficacy and its eight dimensions, respectively.
The overall regression model (with all four predictors) resulted in an R2 of
.266 (F = 2.443, p > .05). A simpler model, however, comprised of just one predictor
(academic rank), yielded an R2 of .255 (F = 10.281, p < .05). In general, higher self-
efficacy in teaching was associated with the higher academic rank in that higher the
academic rank of the professor, higher the overall efficacy beliefs in teaching.

89
The regression summary of overall and restricted model is presented in Table 13.
Table 13
Regression Summary of Professors’ Overall Self-Efficacy in Teaching _____________________________________________________________________
Model Beta R2 Semi-partial Zero-order _____________________________________________________________________
Full Model .266
Professor gender .083 .076 .187 Years taught .051 .033 .406 Pedagogy -.016 -.016 -.034 Academic rank .453 .314 .505 Restricted Model .255 Academic rank .505** .505 .505 _____________________________________________________________________ *p<.05, **p<.01, ***p<.001 R2 difference of -.009 was not statistically significant (F=.361, p = .553)
To further investigate differences in professors’ overall efficacy beliefs in
teaching across academic rank, univariate analysis of variance (ANOVA) was
performed. Table 14 displays the means and standard deviations of professors’ overall
efficacy beliefs in teaching.

90
Table 14 Means and Standard Deviations for Professors’ Overall Efficacy Beliefs in Teaching _____________________________________________________________________ Variable M SD _____________________________________________________________________ Academic Rank Graduate Teaching Assistant 4.89 .782 Instructor 5.33 1.528 Assistant Professor 5.63 .744 Associate Professor 5.73 .905 Full Professor 6.67 .577 _____________________________________________________________________
The homogeneity of variance assumption was tested using Levene’s Test for
Equality of Variances with no violation being reported (p> .05). Although full
professors seemed to have the highest efficacy beliefs in overall teaching (M= 6.67,
SD=.577) and the graduate teaching assistants the lowest (M= 4.89, SD=.782), the
analysis yielded no statistically significant differences across academic rank (F 4, 29 =
2.666, p> .05). An observed power of .668 and (ε2) eta square of .269 were reported.
2a: Predicting Self-Efficacy in Students’ Learning
A backward regression analysis was used to investigate the extent to which
professor academic rank (GTA, instructor, assistant professor, associate professor, or
full professor), gender, years taught, and number of pedagogical training they
received were related to their self-efficacy in learning. The overall regression model
(with all four predictors) resulted in an R2 of .232 (F = 2.041, p > .05) (see Table 15).

91
A simpler model, however, comprised of just one predictor (academic rank), yielded
an R2 of .173 (F = 6.271, p = .018). Accordingly, higher self-efficacy in students’
learning was associated with higher academic rank.
Table 15
Regression Summary of Professors’ Self- Efficacy in Students’ Learning _____________________________________________________________________ Model Beta R2 Semi-partial Zero-order ____________________________________________________________________ Full Model .232 Professor gender .031 .029 .000 Years taught -.261 -.205 .044 Pedagogy .124 .124 .108 Academic rank .554* .467 .416 Restricted Model .173 Academic rank .416* .416 .416 _____________________________________________________________________ *p<.05, **p<.01, ***p<.001 R2 difference of -.043 was not statistically significant (F=1.602, p = .216)
To further investigate differences among professors’ efficacy beliefs in
students’ learning, univariate analysis of variance (ANOVA) was performed.
Table 16 displays the means and standard deviations of professors’ efficacy
beliefs in students’ learning.

92
Table 16 Means and Standard Deviations for Professors’ Efficacy Beliefs in Students’ Learning _____________________________________________________________________ Variable M SD _____________________________________________________________________ Academic Rank Graduate Teaching Assistant 4.95 .295 Instructor 4.81 1.027 Assistant Professor 5.53 .727 Associate Professor 5.26 .939 Full Professor 6.04 .295 _____________________________________________________________________
The homogeneity of variance assumption was tested using Levene’s Test for
Equality of Variances with violation being reported (p< .05). Although full professors
seemed to have the highest efficacy beliefs in students’ learning (M= 6.67, SD=.577)
and instructors the lowest, the analysis yielded no statistically significant differences
across academic rank (F 4, 29 = 1.747, p> .05). An observed power of .467 and (ε2) eta
square of .194 were reported.
2b: Predicting Self-Efficacy in Enthusiasm
A backward regression analysis was used to investigate the extent to which
professor academic rank (GTA, instructor, assistant professor, associate professor, or
full professor), gender, years taught, and number of pedagogical training they
received were related to their self-efficacy in enthusiasm. The analysis yielded no

93
statistical significance neither with the full (F = 1.173, p > .05) or restricted model (F
= 3.962, p > .05). The summary of the regression analysis is presented in Table 17.
Table 17 Regression Summary of Professors’ Self-Efficacy in Enthusiasm _____________________________________________________________________ Model Beta R2 Semi-partial Zero-order ____________________________________________________________________ Full Model .148 Professor gender -.081 -.074 -.070 Years taught -.040 -.031 .121 Pedagogy .146 .146 .118 Academic rank .381 .323 .342 _____________________________________________________________________ *p<.05, **p<.01, ***p<.001
2c: Predicting Self-Efficacy in Organization
A backward regression analysis was used to investigate the extent to which
professor academic rank (GTA, instructor, assistant professor, associate professor, or
full professor), gender, years taught, and number of pedagogical training they
received were related to their self-efficacy in organization. The overall regression
model (with all four predictors) resulted in an R2 of .242 (F = 2.161, p > .05). A
simpler model, however, comprised of just one predictor (academic rank), yielding R2
of .214 (F = 8.172, p = .008). Accordingly, higher self-efficacy in organization of the
class was associated with higher academic rank. The regression summary of overall
and restricted model is presented in Table 18.

94
Table 18
Regression Summary of Professors’ Self-Efficacy in Organization _____________________________________________________________________
Model Beta R2 Semi-partial Zero-order _____________________________________________________________________ Full Model .242
Professor gender .172 .157 .180 Years taught -.066 -.056 .191 Pedagogy .067 .066 .031
Academic rank .480* .438 .463
Restricted Model .214 Academic rank .463** .463 .463
_____________________________________________________________________ *p<.05, **p<.01, ***p<.001 R2 difference of -.021 was not statistically significant (F=.803, p = .377)
To further investigate differences among professors’ efficacy beliefs in
organization, univariate analysis of variance (ANOVA) was performed.
Table 19 displays the means and standard deviations of professors’ efficacy beliefs in
organization.

95
Table 19 Means and Standard Deviations for Professors’ Efficacy Beliefs in Organization _____________________________________________________________________ Variable M SD _____________________________________________________________________ Academic Rank Graduate Teaching Assistant 5.47 .707 Instructor 5.33 .902 Assistant Professor 5.98 .433 Associate Professor 5.60 .626 Full Professor 6.33 .643 _____________________________________________________________________
The homogeneity of variance assumption was tested using Levene’s Test for
Equality of Variances with violation being reported (p> .05). Although full professors
seemed to have the highest efficacy beliefs in organization (M = 6.33, SD = .643) and
the instructors the lowest (M = 5.33, SD = .902), the analysis yielded no statistically
significant differences across academic rank (F 4, 29 = 1.743, p> .05). An observed
power of .466 and (ε2) eta square of .194 were reported.
2d: Predicting Self-Efficacy in Breadth
A backward regression analysis was used to investigate the extent to which
professor academic rank (GTA, instructor, assistant professor, associate professor, or
full professor), gender, years taught, and number of pedagogical training they
received were related to their self-efficacy in breadth.

96
The analysis yielded no statistical significance neither with the full (F = .960, p > .05)
or restricted model (F = 1.828, p > .05).
The summary of the regression analysis is presented in Table 20.
Table 20 Regression Summary of Professors’ Self-Efficacy in Breadth _____________________________________________________________________ Model Beta R2 Semi-partial Zero-order _____________________________________________________________________ Full Model .125 Professor gender .154 .141 .065 Years taught -.244 -.219 -.069 Pedagogy .156 .163 .102 Academic rank .341 .318 .240 _____________________________________________________________________ *p<.05, **p<.01, ***p<.001
2e: Predicting Self-Efficacy in Rapport
A backward regression analysis was used to investigate the extent to which
professor academic rank (GTA, instructor, assistant professor, associate professor, or
full professor), gender, years taught, and number of pedagogical training they
received were related to their self-efficacy in rapport. The overall regression model
(with all four predictors) resulted in an R2 of .228 (F = 1.989, p > .05) (see Table 21).
A simpler model, however, comprised of just one predictor (academic rank), yielding
R2 of .186 (F = 6.871, p = .014). Accordingly, higher self-efficacy in rapport was
associated with higher academic rank.

97
Table 21 Regression Summary of Professors’ Self-Efficacy in Rapport _____________________________________________________________________ Model Beta R2 Semi-partial Zero-order _____________________________________________________________________ Full Model .228 Professor gender -.125 -.115 -.116 Years taught -.049 -.045 -.028 Pedagogy .131 .131 .158 Academic rank .442* .436 .432 Restricted Model .186 Academic rank .432* .432 .432 _____________________________________________________________________ *p<.05, **p<.01, ***p<.001 R2 difference of -.022 was not statistically significant (F=.808, p = .376)
To further investigate differences among professors’ efficacy beliefs in
rapport, univariate analysis of variance (ANOVA) was performed.
Table 22 displays the means and standard deviations of professors’ efficacy
beliefs in rapport.

98
Table 22
Means and Standard Deviations for Professors’ Efficacy Beliefs in Rapport _____________________________________________________________________ Variable M SD _____________________________________________________________________ Academic Rank Graduate Teaching Assistant 5.78 .815 Instructor 4.87 .987 Assistant Professor 6.23 .789 Associate Professor 5.73 .878 Full Professor 6.20 .721 _____________________________________________________________________
The homogeneity of variance assumption was tested using Levene’s Test for
Equality of Variances with violation being reported (p> .05). Assistant professors
seemed to have the highest (M = 6.23, SD = .789), while the instructors the lowest
efficacy beliefs in rapport with their students (M = 4.87, SD = .987); however, the
analysis yielded no statistically significant differences across academic rank (F 4, 29 =
1.632, p> .05). An observed power of .438 and (ε2) eta square of .184 were reported.
2f: Predicting Self-Efficacy in Group Interaction
A backward regression analysis was used to investigate the extent to which
professor academic rank (GTA, instructor, assistant professor, associate professor, or
full professor), gender, years taught, and number of pedagogical training they
received were related to their self-efficacy in group interaction. The overall regression
model (with all four predictors) resulted in an R2 of .203 (F = 1.724, p> .05). A
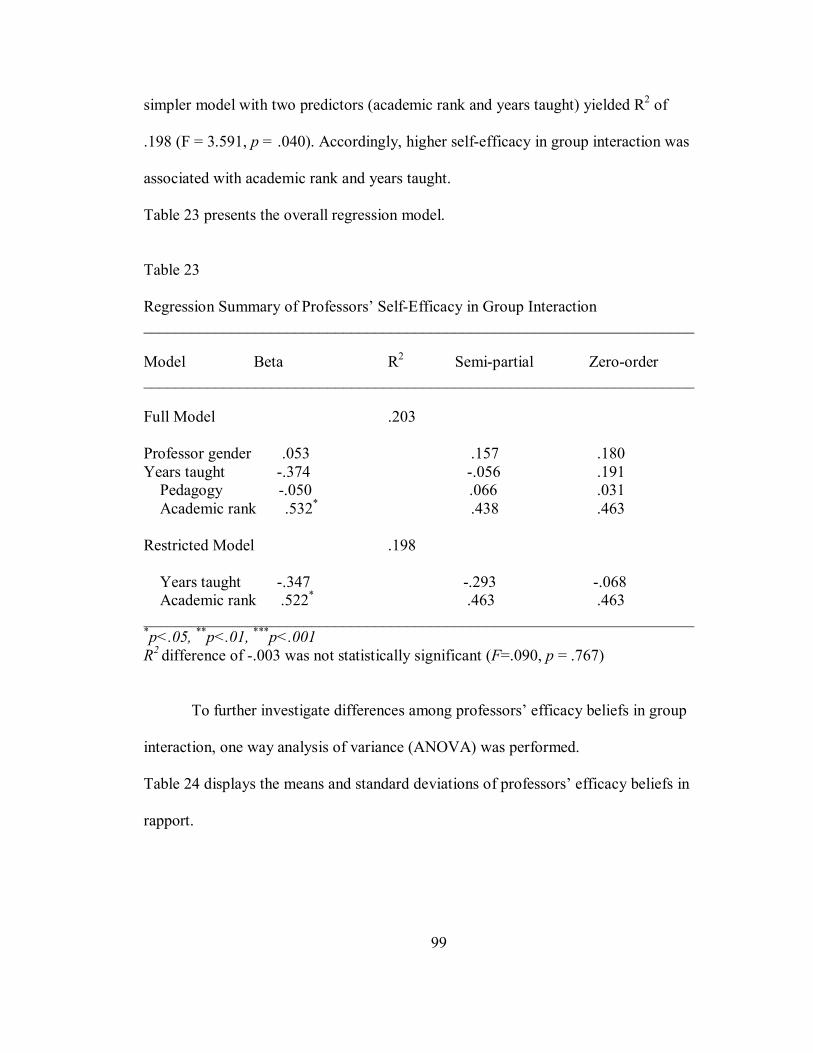
99
simpler model with two predictors (academic rank and years taught) yielded R2 of
.198 (F = 3.591, p = .040). Accordingly, higher self-efficacy in group interaction was
associated with academic rank and years taught.
Table 23 presents the overall regression model.
Table 23 Regression Summary of Professors’ Self-Efficacy in Group Interaction _____________________________________________________________________ Model Beta R2 Semi-partial Zero-order _____________________________________________________________________ Full Model .203 Professor gender .053 .157 .180 Years taught -.374 -.056 .191 Pedagogy -.050 .066 .031 Academic rank .532* .438 .463 Restricted Model .198 Years taught -.347 -.293 -.068 Academic rank .522* .463 .463 _____________________________________________________________________ *p<.05, **p<.01, ***p<.001 R2 difference of -.003 was not statistically significant (F=.090, p = .767)
To further investigate differences among professors’ efficacy beliefs in group
interaction, one way analysis of variance (ANOVA) was performed.
Table 24 displays the means and standard deviations of professors’ efficacy beliefs in
rapport.

100
Table 24 Means and Standard Deviations for Professors’ Efficacy Beliefs in Group Interaction _____________________________________________________________________ Variable M SD _____________________________________________________________________ Academic Rank Graduate Teaching Assistant 5.59 .778 Instructor 4.78 1.018 Assistant Professor 5.54 1.038 Associate Professor 5.70 1.069 Full Professor 6.22 .694 _____________________________________________________________________
The homogeneity of variance assumption was tested using Levene’s Test for
Equality of Variances with violation being reported (p> .05). Full professors seemed
to have the highest (M = 6.22, SD = .694), while the instructors the lowest efficacy
beliefs in group interaction (M = 4.78, SD = 1.018); however, the analysis yielded no
statistically significant differences across academic rank (F 4, 29 = 1.897, p> .05). An
observed power of .249 and (ε2) eta square of .110 were reported.
Further simple correlation was performed to analyze the relation between
years professors taught and efficacy beliefs in group interaction. Correlation analysis
indicated no statistically significant correlation between years taught and efficacy
beliefs in group interaction (r = -.068, p > .05).
2g: Predicting Self-Efficacy in Exam/Evaluation
A backward regression analysis was used to investigate the extent to which

101
professor academic rank (GTA, instructor, assistant professor, associate professor, or
full professor), gender, years taught, and number of pedagogical training they
received were related to their self-efficacy in exam. The overall regression model
(with all four predictors) resulted in an R2 of .205 (F = 1.735, p> .05) (see Table 25).
A simpler model, however, comprised of just one predictor (academic rank), yielding
R2 of .182 (F = 6.653, p = .015). Accordingly, higher self-efficacy in exam was
associated with higher academic rank.
Table 25 Regression Summary of Professors’ Self-Efficacy in Exam/Evaluation _____________________________________________________________________ Model Beta R2 Semi-partial Zero-order _____________________________________________________________________ Full Model .205 Professor gender -.140 -.128 -.103 Years taught .023 -.018 .142 Pedagogy .029 .029 .031 Academic rank .452* .393 .426 Restricted Model .182 Academic rank .426* .426 .426 _____________________________________________________________________ *p<.05, **p<.01, ***p<.001 R2 difference of -.022 was not statistically significant (F=.796, p = .380)
To further investigate differences among professors’ efficacy beliefs in exam
and evaluation, univariate analysis of variance (ANOVA) was performed.
Table 26 displays the means and standard deviations of professors’ efficacy beliefs in
exam and evaluation.

102
Table 26
Means and Standard Deviations for Professors’ Efficacy Beliefs in Exam/Evaluation _____________________________________________________________________ Variable M SD _____________________________________________________________________ Academic Rank Graduate Teaching Assistant 5.78 .712 Instructor 5.33 .577 Assistant Professor 5.94 .821 Associate Professor 5.77 .754 Full Professor 6.67 .577 _____________________________________________________________________
The homogeneity of variance assumption was tested using Levene’s Test for
Equality of Variances with violation being reported (p> .05). Full professors seemed
to have the highest efficacy beliefs in exam and evaluation (M = 6.67, SD = .577),
while instructors the lowest (M = 5.33, SD = .577); nevertheless, the analysis yielded
no significant differences across academic rank (F 4, 29 = 1.366, p> .05). An observed
power of .371 and (ε2) eta square of .159 were reported.
2h: Predicting Self-Efficacy in Assignment
A backward regression analysis was used to investigate the extent to which
professor academic rank (GTA, instructor, assistant professor, associate professor, or
full professor), gender, years taught, and number of pedagogical training they
received were related to their self-efficacy in assignment. The overall regression
model (with all four predictors) resulted in an R2 of .214 (F = 1.835, p> .05)

103
Table 27 displays the summary of regression analysis. (see Table 27). A simpler
model, however, comprised of just one predictor (academic rank), yielding R2 of .197
(F = 7.367, p = .011). Accordingly, higher self-efficacy in assignment was associated
with higher academic rank.
Table 27
Regression Summary of Professors’ Self-Efficacy in Assignment _____________________________________________________________________ Model Beta R2 Semi-partial Zero-order _____________________________________________________________________ Full Model .214 Professor gender .123 .112 .156 Years taught -.067 -.062 .006 Pedagogy .066 .065 .126 Academic rank .420* .411 .444 Restricted Model .197 Academic rank .444* .444 .444 _____________________________________________________________________ *p<.05, **p<.01, ***p<.001 R2 difference of -.009 was not statistically significant (F=.312, p = .581)
To further investigate differences among professors’ efficacy beliefs in
assignment, univariate analysis of variance (ANOVA) was performed.
Table 28 displays the means and standard deviations of professors’ efficacy beliefs in
assignment.

104
Table 28 Means and Standard Deviations for Professors’ Efficacy Beliefs in Assignment _____________________________________________________________________ Variable M SD _____________________________________________________________________ Academic Rank Graduate Teaching Assistant 5.39 .961 Instructor 4.83 .764 Assistant Professor 5.88 .694 Associate Professor 5.77 .720 Full Professor 5.17 1.041 _____________________________________________________________________
The homogeneity of variance assumption was tested using Levene’s Test for
Equality of Variances with violation being reported (p> .05). Assistant professors
seemed to have the highest efficacy beliefs in assignment (M = 5.88, SD = .694) and
the instructors the lowest (M = 4.83, SD = .764); however, the analysis yielded no
statistically significant differences across academic rank (F 4, 29 = 1.355, p> .05). An
observed power of .368 and (ε2) eta square of .157 were reported.
Question #3: Do individual professor variables (i.e., gender, academic rank, teaching
experience) influence student ratings of overall teaching effectiveness?
A backward regression analysis was performed to investigate the extent to
which individual professor variables (gender, academic rank, years taught, and
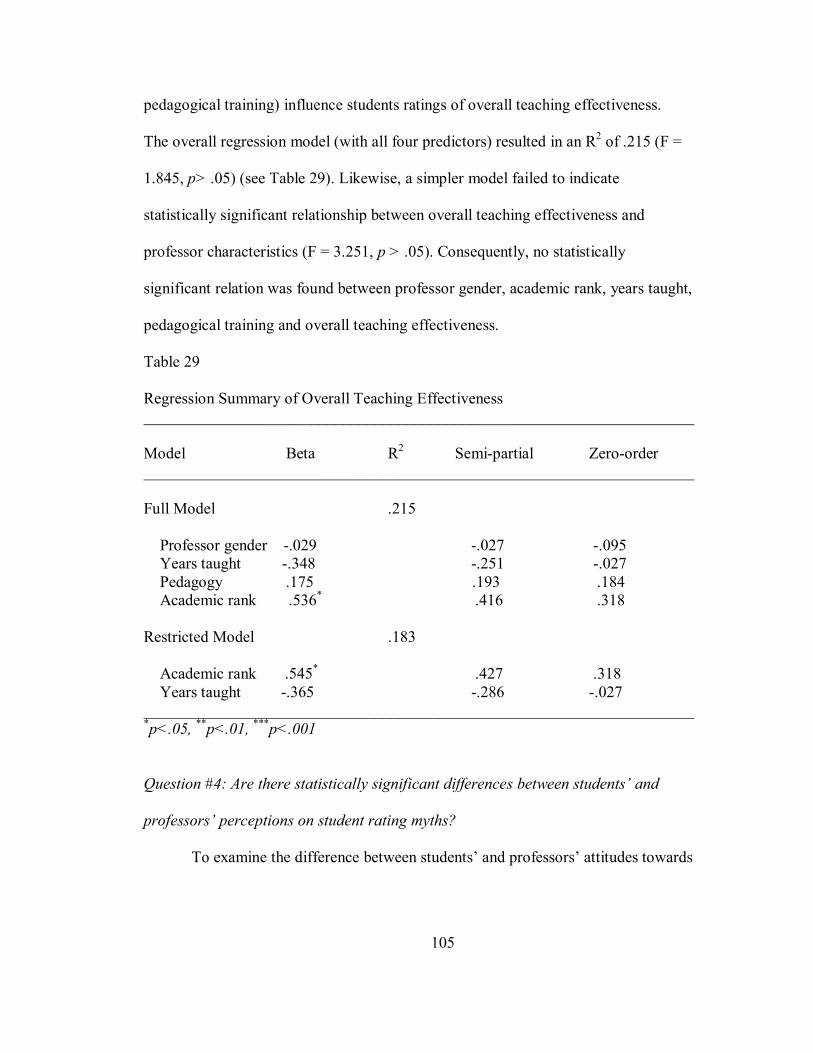
105
pedagogical training) influence students ratings of overall teaching effectiveness.
The overall regression model (with all four predictors) resulted in an R2 of .215 (F =
1.845, p> .05) (see Table 29). Likewise, a simpler model failed to indicate
statistically significant relationship between overall teaching effectiveness and
professor characteristics (F = 3.251, p > .05). Consequently, no statistically
significant relation was found between professor gender, academic rank, years taught,
pedagogical training and overall teaching effectiveness.
Table 29 Regression Summary of Overall Teaching Effectiveness _____________________________________________________________________ Model Beta R2 Semi-partial Zero-order _____________________________________________________________________ Full Model .215 Professor gender -.029 -.027 -.095 Years taught -.348 -.251 -.027 Pedagogy .175 .193 .184 Academic rank .536* .416 .318 Restricted Model .183 Academic rank .545* .427 .318 Years taught -.365 -.286 -.027 _____________________________________________________________________ *p<.05, **p<.01, ***p<.001
Question #4: Are there statistically significant differences between students’ and
professors’ perceptions on student rating myths?
To examine the difference between students’ and professors’ attitudes towards

106
student rating myths, multivariate analysis of variance (MANOVA) was conducted
upon the statistically significant correlations (p< .05) among the dependent variables.
The multivariate homogeneity of variance assumption was tested using Box’s Test of
Equality of Covariance Matrices with no violation being reported (p > .001).
MANOVA yielded statistically significant difference between students’ and
professors’ attitudes towards student rating myths in four (4) items, Hotelling’s T2 =
.081, p < .001. The multivariate η 2 based on Hotelling’s Trace was .075. An
observed power of 1.0 was reported. Table 30 displays the results of multivariate
analysis of variance between students’ and professors’ attitudes towards student
rating myths.
Table 30 Comparison between Students’ and Professors’ Perceptions towards Student Rating Myths _____________________________________________________________________ Myths Student Professor F M (SD) M (SD) _____________________________________________________________________ Myth #1 5.44 (1.28) 4.16 (1.34) 29.419**
Myth #2 3.69 (1.54) 3.10 (1.11) 4.515*
Myth #3 3.39 (1.61) 3.23 (1.15) .317
Myth #4 2.66 (1.54) 3.06 (1.32) 2.050
Myth #5 2.48 (1.52) 3.19 (1.22) 6.713*
Myth #6 3.84 (1.57) 4.23 (1.38) 1.787
_____________________________________________________________________

107
Table 30 (continued) Comparison between Students’ and Professors’ Perceptions towards Student Rating Myths _____________________________________________________________________ Myths Student Professor F M (SD) M (SD) _____________________________________________________________________
Myth #7 2.61 (1.55) 3.10 (1.56) 2.985
Myth #8 3.56 (1.65) 3.48 (1.36) .072
Myth #9 3.74 (1.60) 3.81 (1.47) .056
Myth #10 3.77 (1.60) 3.68 (1.60) .103
Myth #11 3.57 (1.62) 4.00 (1.44) 2.144
Myth #12 2.94 (1.60) 2.48 (1.53) 2.461
Myth #13 4.31 (1.56) 4.10 (1.35) .587
Myth #14 3.28 (1.46) 2.87 (1.26) 2.307
Myth #15 3.87 (1.38) 2.84 (1.37) 16.846**
Myth #16 2.72 (1.69) 2.29 (1.10) 1.960
_____________________________________________________________________*p<.05, **p<.01, ***p<.001. A multivariate analysis of variance (MANOVA) comparison yielded a Hotelling’s T2 of .081, p < .001.
Follow-up univariate F tests were used to determine which specific items
separated the two groups. According to the analyses, students (M = 5.44, SD = 1.28)
believed that students are qualified to make accurate judgments of college professors’
teaching effectiveness more than the professors did (M = 4.16, SD = 1.34), while they
perceived professors’ colleagues with excellent publication records and expertise as

108
better qualified to evaluate their peers’ teaching effectiveness (M = 3.69, SD = 1.54)
than did the professors (M = 3.10, SD = 1.11). In addition, professors had stronger
agreement (M = 3.19, SD = 1.22) than the students (M = 2.48, SD = 1.52) on the
myth stating that student ratings are both unreliable and invalid. Finally, compared to
professors (M = 2.84, SD = 1.37), students (M = 3.87, SD = 1.38) more strongly
agreed on the myth that student ratings on single general items are accurate measures
of instructional effectiveness.
Question #5: Do student gender, grade point average (GPA), and academic year (e.g.
freshman, senior) predict an overall student rating myth?
A regression analysis was used to examine the extent to which student
characteristics were related to their perceptions of student rating myths. More
specifically, student gender, grade point average (GPA), and academic year (e.g.
freshman, senior) were used as predictors of an overall student rating myth scale. The
full regression model with all three predictors resulted in an R2 of .020 (p < .001). Of
the three predictors, gender was the only variable reaching statistical significance.
Therefore, a more restricted, simpler model using just gender was examined, yielding
an R2 of .018. The difference between the full and restricted regression models was
not statistically significant (F=.935, p = .393), therefore the restricted model was
accepted.
The summary of the regression analysis is presented in Table 31.

109
Table 31
Regression Summary of Students’ Perceptions of Student Rating Myths _____________________________________________________________________ Model Beta R2 Semi-partial Zero-order _____________________________________________________________________ Full Model .020 Gender -.140*** -.139 -.135 GPA .044 .044 .028 Academic year .006 .006 -.005 Restricted Model .018
Gender -.135*** -.135 -.135 _______________________________________________________________________________________________________
*p<.05, **p<.01, ***p<.001 R2 difference of .002 was not statistically significant (F=.935, p = .393)
As a result of gender contributing to students’ perceptions of myths, a
follow-up question was investigated to determine more specific differences between
male and female students. More specifically, a MANOVA was used to compare
males and females on each of the 16 myths. These results are reported in Table 32.
An overall multivariate difference was found between male and female students
(Hotelling’s T2 = .050, p < .01). Follow-up univariate F tests revealed specific
differences on nine (9) of the 16 myths with males believing more strongly that eight
(8) of these nine (9) myths were true.
More specifically, male students tended to believe that most student ratings
are nothing more than a popularity contest with the warm, friendly, and humorous
instructor emerging as the winner every time than the female students did. Also,
compared to female students, male students had stronger agreement on the myths that

110
students are not able to make accurate judgments until they have been away from the
course and possibly away from the university for several years; that student ratings
are both unreliable and invalid; the size, the rank of the instructor, the time of the day
the class is offered, as well as the gender of the students and the instructor affect
student ratings; and student ratings cannot meaningfully be used to improve
instruction. Female students, on the other hand, showed more agreement with the
myth that in general, students are qualified to make accurate judgments of college
professors’ teaching effectiveness.
Table 32
Comparison between Male and Female Students’ Attitudes towards 16 Myths ____________________________________________________________________ Myth Male Female (n=409) (n=540) M (SD) M (SD) F _____________________________________________________________________ Myth #1 5.29 (1.353) 5.54 (1.219) 8.809**
Myth #2 3.72 (1.490) 3.68 (1.568) .148
Myth #3 3.54 (1.605) 3.28 (1.605) 5.326*
Myth #4 2.85 (1.549) 2.53 (1.517) 9.010**
Myth #5 2.75 (1.601) 2.28 (1.428) 20.402***
Myth #6 4.01 (1.560) 3.72 (1.571) 7.166**
Myth #7 2.82 (1.641) 2.46 (1.454) 11.680**
_____________________________________________________________________

111
Table 32 (continued)
Comparison between Male and Female Students’ Attitudes towards 16 Myths ____________________________________________________________________ Myth Male Female (n=409) (n=540) M (SD) M (SD) F _____________________________________________________________________
Myth #8 3.78 (1.712) 3.41 (1.584) 10.655**
Myth #9 3.82 (1.587) 3.69 (1.586) 1.305
Myth #10 3.86 (1.596) 3.72 (1.592) 1.549
Myth #11 3.58 (1.614) 3.56 (1.628) .021
Myth #12 3.16 (1.655) 2.69 (1.543) 10.763**
Myth #13 4.41 (1.516) 4.25 (1.574) 2.298
Myth #14 3.39 (1.548) 3.20 (1.383) 3.842
Myth #15 3.96 (1.368) 3.81 (1.372) 2.579
Myth #16 2.91 (1.694) 2.57 (1.660) 8.270**
_______________________________________________________________________________________________________
*p<.05, **p<.01, ***p<.001 Question #6: Is there a statistically significant relationship between student and
course characteristics and student ratings?
Finally, the relationship between student and course characteristics with
student ratings of teaching effectiveness was examined. Specifically, the variables of
professor rank, class size, student’s reason for taking the class, student gender,

112
student academic level, and expected grade were used as predictors of an overall
teaching effectiveness rating scale. This scale was comprised of items measuring nine
dimensions of teaching effectiveness. An overall effectiveness scale was used as the
dependent variable for the regression analysis instead of performing nine separate
analyses. The overall regression model (with all six predictors) resulted in an R2 of
.095 (see Table 33). A simpler model, however, comprised of just four predictors
proved to be comparable, yielding the same R2 of .095. The variables contributing in
the model included professor rank, student gender, student academic level, and
expected grade. In general, higher ratings were associated with full professors, female
students, postgraduate students, and students expecting to earn higher grades. A
descriptive summary of teaching effectiveness ratings for each of these variables is
found in Table 34.
Table 33 Regression Summary of Students’ Ratings and Professor, Student, and Course Characteristics _____________________________________________________________________ Model Beta R2 Semi-partial Zero-order _____________________________________________________________________ Full Model .095 Professor rank .063 .056 .082 Reason for taking class .015 .014 .059 Student gender .097** .094 .141 Student academic level .125** .108 .145 Class size .029 .023 -.042 Expected grade .227*** .221 .261 _____________________________________________________________________

113
Table 33 Regression Summary of Students’ Ratings and Professor, Student, and Course Characteristics _____________________________________________________________________ Model Beta R2 Semi-partial Zero-order _____________________________________________________________________ Restricted Model .095 Professor rank .072* .071 .082 Student gender .094** .093 .141 Student academic level .116** .114 .145 Expected grade .226*** .220 .261 _____________________________________________________________________ *p<.05, **p<.01, ***p<.001 R2 difference of .001 was not statistically significant (F=.275, p = .759) Table 34 Descriptive Summary of Student Ratings of Teaching Effectiveness _____________________________________________________________________ Variable M SD _____________________________________________________________________ Gender Female 4.34 .54 Male 4.17 .62 Academic level Freshman 4.05 .65 Sophomore 4.30 .53
Junior 4.24 .57 Senior 4.31 .61 Postgraduate 4.45 .53
_____________________________________________________________________

114
Table 34 (Continued) Descriptive Summary of Student Ratings of Teaching Effectiveness _____________________________________________________________________ Variable M SD _____________________________________________________________________ Reason for taking class Major requirement 4.26 .60 Major elective 4.28 .54 General ed. requirement 4.17 .56 Minor/related field 4.22 .57 General interest 4.47 .50 Expected grade A 4.37 .52 B 4.22 .57 C 3.91 .73 D 3.20 .65 F 3.84 1.14 Professor rank GTA 4.28 .63 Instructor 4.17 .56 Assistant Professor 4.29 .57 Associate Professor 4.18 .68 Full Professor 4.33 .45 _____________________________________________________________________

115
Summary
In accordance with the research questions, the relevant data analyses such as
simple regression, multiple regression, and multivariate analysis of variance
(MANOVA) resulted in various research findings. To illustrate, statistically
significant relations were reported between teaching effectiveness in enthusiasm and
breadth and professors’ self-efficacy in enthusiasm and breadth, respectively.
Professors’ academic rank was found to be related to overall efficacy beliefs in
teaching as well as efficacy beliefs in students’ learning, organization of the class,
rapport, group interaction, exam, and assignment. High ratings were found to be
associated with full professors, female students, postgraduate students, and students
expecting to earn higher grades.

116
V. SUMMARY, DISCUSSION OF FINDINGS, CONCLUSIONS, AND
RECOMMENDATIONS
Discussion of Findings
This study focused on several aspects of student ratings: relation between
teacher effectiveness measured by student ratings and professor’s self-efficacy;
relation between professor’s self-efficacy, teaching effectiveness, and professor
characteristics; student rating myths and student and course characteristics; and
differences between female and male students as well as professors and students in
terms of student rating myths. Nine hundred and sixty-eight college students and
thirty-four college professors participated in the research, completing a battery of
survey instruments, Student Evaluation of Educational Quality (SEEQ) and Teacher
Appraisal Instrument (TAI).
Teacher self-efficacy in enthusiasm in teaching was found to predict teaching
effectiveness in terms of enthusiasm. Similarly, teacher self-efficacy in breadth was
related to teaching effectiveness in terms of breadth of the course as well. The higher
efficacious the professors were with regard to enthusiasm and breadth of their
teaching, the more effective they were in teaching that particular course. However,

117
neither of the remaining dimensions, self-efficacy in students’ learning, organization,
group interaction, rapport, exam/evaluation, assignment, nor overall teacher self-
efficacy was found to be statistically significant predictors of teaching effectiveness
regarding their corresponding dimensions.
In relation to the examination of relationship among professor gender,
academic rank, years taught, pedagogical training; and overall teacher self-efficacy,
academic rank was the only predictor reaching statistical significance. That is, overall
teacher self-efficacy was related to academic rank. Accordingly, the higher the
academic rank, the higher is the overall teacher self-efficacy.
Similarly, academic rank was found to be the only significant predictor of
teacher self-efficacy with regard to students’ learning, class organization, rapport with
students, examination or evaluation, and assignment. In other words, full professors
reported the highest efficacy beliefs in students’ learning, organization, and exam and
evaluation, while instructors reported the lowest efficacy beliefs in the relevant
dimensions. Assistant professors seemed to have the highest efficacy beliefs in
rapport with students and assignment, while instructors the lowest in the relevant
dimensions. With the exception of overall efficacy beliefs in teaching, instructors
reported the lowest efficacy beliefs in the relevant dimensions.
In terms of teacher self-efficacy in group interaction, academic rank and years
taught were the two significant predictors. This is consistent with the existing
literature on the relation between teaching experience and teacher self-efficacy in
planning and evaluation (Benz et al., 1992). Full professors seemed to have the

118
highest, while instructors the lowest efficacy beliefs in group interaction.
This study also investigated the attitudes towards the student rating myths mainly
with an emphasis on differences between students and professors. While both faculty
and students generally believed that students are qualified to make accurate
judgments of college professors’ teaching effectiveness, students believed it more
strongly than the professors. On the other hand, professors were more likely to
discredit students’ ratings as a valid and reliable source of effective teaching.
In general, both groups tended to agree that grade students received positively
correlated with student ratings, so higher the grades, higher the ratings. This finding
was also supported in our examination of student ratings. That is, students expecting
higher grades rated their professors higher as well. Whether expecting higher grades
implies that students learned due to effective teaching was beyond the scope of this
study. Marsh (1984) argued that when there is correlation between course grades and
students ratings as well as course grades and performance on the final exam, higher
ratings might be due to more effective teaching resulting in greater learning,
satisfaction with the grades bring about students’ rewarding the teacher, or initial
differences in student characteristics such as motivation, subject interest, and ability.
In his review of research, Marsh (1984) reported grading leniency effect in
experimental studies and concluded:
Consequently, it is possible that a grading leniency effect may produce some bias in student ratings, support for this suggestion is weak and the size of such an effect is likely to be insubstantial in the actual use of student ratings. (p. 741)

119
A third variable that might possibly contribute to the correlation between
expected grades and student ratings prevents making causational conclusions between
these two variables (Greenwald & Gillmore, 1997). Instructional quality, student’s
motivation, and student’s course-specific motivation, as a possible third variable,
might explain the correlation between these two variables, suggesting no concern
about grades having improper influence on ratings. Greenwald and Gillmore (1997)
also suggested that the students tend to attribute their unfavorable grades to poor
instruction, and hence give low ratings to professors. Although giving higher grades
individually does not guarantee getting high ratings of effective teaching, “if an
instructor varied nothing between two course offerings other than grading policy,
higher ratings would be expected in the more leniently graded course” (p. 1214).
While there are other methods to capture effective teaching such as classroom
observation, self-assessment, student learning and achievement, and peer evaluation,
student ratings remain the most dominant in higher education settings. The challenge
for faculty is to use student ratings as informative feedback to improve their teaching.
As a matter of fact, it is suggested that students provide the most essential judgmental
data about the quality of teachers’ teaching strategies, personal impact on learning
(Chism, 1999), delivery of instruction, assessment of instruction, availability to
students, and administrative requirements (Cashin, 1989).
Feedback provided from student ratings can be used to confirm and
supplement teachers’ self-assessment of their teaching. Marsh (1982, 1984) asserted
that student ratings of teaching effectiveness are better understood by multiple

120
dimensions instead of a single summary of score as teaching effectiveness is a
multidimensional construct. Through implementing a survey of multidimensions of
teaching effectiveness, teachers and administrators can get more detailed and
diagnostic feedback on how to enhance their teaching and hence their students’
learning.
In addition to using a student rating instrument that was built on a
multidimensional construct of teaching effectiveness, another efficient way to make
the best of these ratings is to administer them in middle of the semester to enable any
improvements and modifications. Usually, professors receive feedback after the
semester is over and make modifications (if any) for the following semester. One
problem with this approach is the fact that despite the commonalities of different
classes, the dynamics of each vary. So the feedback received for that class should be
most efficiently used for that particular class.
In this relevant study, while most of the professors expressed that they used
student ratings to improve their teaching, some stated that they kept updated with
research on teaching effectiveness, videotaped their teaching, had peer observation,
attended workshops on teaching effectiveness, asked peers to observe them, and used
their own teaching instruments. This indicated that their practices are in concert with
the suggestions that student ratings should be complemented with other methods to
measure teaching effectiveness.
Conclusions
The following conclusions are supported by data analyses from the present study:

121
1-Relations exist between professor self-efficacy beliefs and how effectively they
teach.
2- Relations exist between professor academic rank and professor’s overall self-
efficacy.
3- Professor’s academic rank and years taught have influence upon professor self-
efficacy in group interaction, students’ learning, class organization, rapport,
exam/evaluation, and assignment.
4- There are statistically significant differences between professors’ and students’
perceptions of student rating myths in that students had stronger perceptions that
students are qualified to make accurate judgments of college professors’ teaching
effectiveness than the professors did.
5- There are statistically significant differences between professors’ and students’
perceptions of student rating myths in that students deemed professors’ colleagues
with excellent publication records and expertise better qualified to evaluate their
peers’ teaching effectiveness than the professors did.
6- There are statistically significant differences between professors’ and students’
perceptions of student rating myths in that professors had stronger agreement than the
students that student ratings are both unreliable and invalid.
7- There are statistically significant differences between professors’ and students’
perceptions of student rating myths in that compared to professors, students more
strongly agreed that student ratings on single general items are accurate measures of
instructional effectiveness.
122
8- Both professors and students agree that grade students receive are positively
correlated with student ratings.
9- Male and female students differ in their perceptions of student rating myths.
10- Full professors as well as female professors tend to receive higher ratings than
their counterparts.
11- Postgraduate students tend to give higher ratings to professors than undergraduate
students do.
12- Students expecting higher grades tend to rate their professor higher than those
that are expecting lower grades.
Recommendations
One of the limitations of this research was the small sample size of professors.
Marsh (1984) states “University faculty have little or no formal training in teaching,
yet find themselves in a position where their salary or even their job may depend on
their classroom teaching skills. Any procedure used to evaluate teaching effectiveness
would prove to be threatening and highly criticized” (p. 749). Accordingly, not many
professors were willing to share students’ views on their teaching, making random
sampling procedure impossible. Therefore, due to the design of this research and lack
of random sampling procedures, making generalizations to the population should be
taken with considerable caution.
Further research, however, could attempt to recruit more professors across
different departments and study gender and departmental differences in professor

123
self-efficacy beliefs.
Moreover, although students taking classes from various colleges participated
in this study, the students were not asked to indicate their department or college they
were enrolled in. Hence, it was out of scope to examine differences in student ratings
across departments. As mentioned earlier, previous research indicated statistically
significant differences in student ratings across colleges. Future research could also
investigate differences in student ratings across departments.
During the early stages of this research, it was intended that validity would be
established through factor analysis.
Huck (2002) suggests the following for establishing the degree of construct
validity:
…the test developer will typically do one or a combination of three things: (1) provide correlational evidence showing that the construct has a strong relationship with certain measured variables and a weak relationship with other variables, with the strong and weak relationships conceptually tied to the new instrument’s construct in a logical manner; (2) show that certain groups obtain the higher mean scores on the new instrument that other groups, with the high- and low scoring groups being determined on logical grounds prior to the administration of the new instrument; or (3)conduct a factor analysis on scores from the new instrument. (p. 104)
However, the small sample of this research study did not lend itself to factor
analyses to further examine dimensions of professor’s self-efficacy beliefs and
establish a solid ground for construct validity. Although the factors were established
through reliability analyses and literature, future research would provide more

124
sufficient evidence for validity and complement the evidence yielded from this
research.

125
REFERENCES
Adamson, G., O’kane, D., & Shevlin, M. (2005). Students’ ratings of teaching
effectiveness: A laughing matter? Psychological Reports, 96, 225-226.
Airasian, P., & Gullickson, A. (1994). Examination of teacher self-
assessment. Journal of Personnel Evaluation in Education, 8, 195-203.
Aleamoni, L.M. (1987). Student rating myths versus research facts. Journal of
Personnel Evaluation in Education, 1, 111-119.
Aleamoni, L. M. (1999). Student rating myths versus research facts from 1924
to 1998. Journal of Personnel Evaluation in Education, 13(2),153-166.
Alsmadi, A. (2005). Assessing the quality of students’ ratings of faculty
members at Mu’tah University. Social Behavior and Personality, 33(2), 183-188.
Apollonia, S., & Abrami, P. C. (Nov. 1997). Navigating student ratings of
instruction. American Psychologist, 52(11), 1198-1208.
Arbizu, F., Olalde, C., Castillo, L. D. (1998). The self-evaluation of teachers:
A strategy for the improvement of teaching at higher education level. Higher
Education in Europe, 23(3), 351-356.
Ashton, P. T. & Others. (1983). A Study of Teachers' Sense of Efficacy. Final
Report, Executive Summary. (ERIC Document Reproduction Service No. ED21833)

126
Ashton, P. T., & Webb, R. B. (1986). Making a difference: Teachers’ sense of
efficacy and student achievement. White Plains, NY: Longman Inc.
Ashton, P. T., Olejnik, S., Crocker, L., & McAuliffe, M. (1982, April).
Measurement problems in the study of teachers’ sense of efficacy. Paper presented at
the Annual Meeting of the American Educational Research Association, New York.
Bandura, A. (1977). Self-efficacy: Toward a unifying theory of behavioral
change. Psychological Review, 84, 191-215.
Bandura, A. (1986). Social foundations of thought and action: A social
cognitive theory. Englewood Cliffs, NJ: Prentice-Hall.
Bandura, A. (1997). Self-efficacy: The exercise of control. New York: W.H.
Freeman and Company.
Bandura, A. (2001). Guide for constructing self-efficacy scales. Retrieved
August 26, 2004 from http://www.emory.edu/EDUCATION/mfp/effguide.PDF
Basow, S. A. (1995). Student evaluations of college professors: When gender
matters. Journal of Educational Psychology, 87(4), 656-665.
Basow, S. A., & Silberg, N. T. (1987). Student evaluations of college
professors: Are female and male professors rated differently? Journal of Educational
Psychology, 79 (3), 308-314.
Benz, C., & Blatt, S. J. (1995). Factors underlying effective college teaching:
What students tell us. Mid-Western Educational Researcher, 8 (1), 27-31.

127
Benz, C. R., Bradley, L., Alderman, M. K., & Flowers, M. A. (1992).Personal
teaching efficacy: Developmental relationships in education. Journal of Educational
Research, 85(5), 274-285.
Berman, P., McLaughlin, M., Bass, G., Pauly, E., and Zellman, G. (1977).
Federal programs supporting educational change: Vol. 7. Factors affecting
implementation and continuation. Santa Monica, CA: The Rand Corporation. (ERIC
Document Reproduction Service No. 140 432)
Boyer, E. (1990). Scholarship reconsidered: Priorities for the professorate.
New York:The Carnegie Foundation.
Boyer, E. L. (1991). The scholarship of teaching from scholarship
reconsidered:Priorities of the professoriate. College Teaching, 39(1), 11-13.
Brophy, J. (1986). Teacher influences on student achievement. American
Psychologist, 41(10), 1069-1077.
Brownell, M. T., & Pajares, F. (1999). Teacher Efficacy and Perceived
Success in Mainstreaming Students with Learning and Behavior Problems. Teacher
Education and Special Education, 22(3), 154-64.
Burton, L. D. (1996, March). How Teachers Teach: Seventh-and Eighth-
Grade Science Instruction in the USA. Paper presented at the Annual Conference of
the National Science Teachers Association, St. Louis, MO.
Caprara, G. V., Barbaranelli, C., Borgogni, L., & Steca, P. (2003). Efficay
beliefs as determinants of teachers’ job satisfaction. Journal of Educational
Psychology, 95 (4), 821-832.

128
Cashin, W. E. (1989). Student Ratings of Teaching: Recommendations for
Use. IDEA Paper No. 22. Manhattan, KS: Kansas State University, Center for Faculty
Evaluation and Development.
Cashin, W. E. (1995). Student ratings of teaching: The research revisited.
IDEA Paper No. 32. Manhattan, KS: Kansas State University, Center for Faculty
Evaluation and Development.
Cashin, W. E., & Downey, R. G. (1992). Journal of Educational Psychology,
84(4), 563-572.
Chambers, S. M., Henson, R. K., & Sienty, S. F. (2001, February). Personality
Types and Teaching Efficacy as Predictors of Classroom Control Orientation in
Beginning Teachers., Paper presented at the Annual Meeting of the Southwest
Educational Research Association, New Orleans, LA.
Chism, N. V. N. (1999). Peer review of teaching : A sourcebook. Bolton, MA:
Anker Pub. Co.
Coladarci, T. (1992). Teachers’ sense of efficacy and commitment to teaching.
Journal of Experimental Education, 60, 323-337.
Crotty, M. (1998). The foundations of social research: Meaning and
perspective in the research process. London: Sage Publications, Inc.
Davies, B. (December, 2004). The relationship between teacher efficacy and
higher order instructional emphasis. Paper presented at the Annual Meeting of the
Australian Association for Research in Education, Melbourne, Australia.

129
Evans, E. D., & Tribble, M. (1986). Perceived teaching problems, self-
efficacy and commitment to teaching among preservice teachers. Journal of
Educational Research, 80(2), 81-85.
Feldman, K. A. (1989). Instructional effectiveness of college teachers as
judged by teachers themselves, current and former students, colleagues,
administrators, and external (neutral) observers. Research in Higher Education,
30(2), 137-194.
Fiedler, R. L., Balam, E. M., Edwards, T. L., Dyer, K. S., Wang, S.C., &
Ross, M. E. 2004). College students’ perceptions of effective teaching and end-of-
course instructor evaluations. Unpublished manuscript.
Freeman, H. R. (1988). Perceptions of teacher characteristics and student
judgment of teacher effectiveness. Teaching of Psychology, 15 (3), 158-160.
Freeman, H. R. (1994). Student evaluations of college instructors: Effects of
type of course taught, instructor gender and gender role, and student gender. Journal
of Educational Psychology, 86 (4), 627-30.
Ghaith, G., & Yaghi, M. (1997). Relationships among experience, teacher
efficacy, and attitudes toward the implementation of instructional innovation.
Teaching and Teacher Education, 13, 451-458.
Ghaith, G., & Shaaban, K. (1999). The relationship between perceptions of
teaching concerns, teacher efficacy, and selected teacher characteristics. Teaching
and Teacher Education, 15(5), 487-496.

130
Gibson, S., & Dembo, M. (1984). Teacher efficacy: A construct validation.
Journal of Educational Psychology, 76(4), 569-582.
Greenwald, A. G., & Gillmore, G. M. (Nov. 1997). Grading leniency is a
removable contaminant of student ratings. American Psychologist, 52 (11), 1209-
1217.
Guskey, T. R. (1982). Differences in teachers’ perceptions of personal control
of positive versus negative student learning outcomes. Contemporary Educational
Psychology, 7, 70-80.
Guskey, T. R., & Passaro, P. D. (1994). Teacher efficacy: A study of construct
dimensions. American Educational Research Journal, 31(3), 627-643.
Hativa, N. (1996). University instructors’ rating profiles: Stability over time,
and disciplinary differences. Research in Higher Education, 37 (3), 341-365.
Hativa, N., Barak, R., & Simhi, E. (2001). Exemplary university teachers:
Knowledge and beliefs regarding effective teaching dimensions and strategies. The
Journal of Higher Education, 72(6), 699-729.
Henson, R. K., & Kogan, L. R., & Vacha-Haase, T. (2001). A reliability
generalization study of the teacher efficacy scale and related instruments. Educational
and Psychological Measurement, 61(3), 404-420.
Hoyt, D.P., & Pallett, W. H. (1999). Appraising teaching effectiveness:
Beyond student ratings. IDEA Paper No. 36. Manhattan, KS: Kansas State
University, Center for Faculty Evaluation and Development.

131
Huck, S. W. (2000). Reading statistics and research. NY: Addison Wesley
Longman, Inc.
Marsh, H. W. (1982). Seeq: A reliable, valid, and useful instrument for
collecting students’ evaluations of university teaching. British Journal of Educational
Psychology, 52, 77-95.
Marsh, H. W. (1984). Students’ evaluations of university teaching:
Dimensionality, reliability, validity, potential biases, and utility. Journal of
Educational Psychology, 76(5),707-754.
Marsh, H. W. & Hocevar, D. (1984). The factorial invariance of students'
evaluations of college teaching. American Educational Research Journal, 21, 341-
366.
Marsh, H. W., & Hocevar, D. (1991). The multidimensionality of students’
evaluations of teaching effectiveness: The generality of factor structures across
academic discipline, instructor level, and course level. Teaching and Teacher
Education, 7(1), 9-18.
Marsh, H. W., & Roche, L. A. (1997). Making students’ evaluations of
teaching effectiveness effective. American Psychologist, 52(11), 1187-1197.
Marsh, H. W., Hau, K. T., & Chung, C. M. (1997). Students’ evaluations of
university teaching: Chinese version of the students’ evaluations of educational
quality instrument. Journal of Educational Psychology, 89(3), 568-572.

132
McKeachie, W. J. (1997).Student ratings: The validity of use. American
Psychologist, 52(11), 1218-1225.
McKeachie, W. J. (2001). McKeachie's Teaching Tips: Strategies, Research,
and Theory for College and University Teachers. New York: Houghton Mifflin
Company
Medley, D. M., & Mitzel, H. E. (1963). Measuring classroom behavior by
systematic observation. In N.L. Gage (Ed.) Handbook on research in teaching.
Chicago, IL: Rand McNally.
Meijer, C., & Foster, S. (1988). The effect of teacher self-efficacy on referral
chance. Journal of Special Education, 22, 378-385.
Melland, H. I. (1996). Great researcher…good teacher? Journal of
Professional Nursing, 12 (1), 31-38.
Midgley, C., Feldlaufer, H., & Eccles, J. (1989). Change in teacher efficacy
and student self- and task-related beliefs in mathematics during the transition to junior
high school. Journal of Educational Psychology, 81, 247-258.
Minor, L. C., Onwuegbuzie, A. J., Witcher, A. E., & James, T. L. (2002).
Preservice teachers’ educational beliefs and their perceptions of characteristics of
effective teachers. The Journal of Educational Research, 96(2), 116-127.
Morehead, J.W., & Shedd, P.J. (1997). Utilizing summative evaluation
through external peer review of teaching. Innovative Higher Education, 22(1), 37-44.
Obenchain, K. M., Abernathy, T. V., & Wiest, L. R. (2001). The reliability of
students’ratings of faculty teaching effectiveness. College Teaching, 49(3), 100-104.

133
Ory, J. C. (1991). Changes in evaluating teaching in higher education. Theory
into Practice, 30(1), 30-36.
Pehazur, E. J., & Schmelkin, L. P. (1991). Measurement, design, and analysis:
An integrated approach. Hillsdale, NJ: Lawrence Erlbaum Associates.
Pintrich, P. R., & Schunk, D. H. (2002). Motivation in education: Theory,
research, and applications. Upper Saddle River, NJ: Pearson Education, Inc.
Prieto, L.R., & Altmaier, E.M. (1994). The relationship of prior training and
previous teaching experience to self-efficacy among graduate teaching assistants.
Research in Higher Education, 35(4), 481-497.
Podell, D., & Soodak, L. (1993). Teacher efficacy and bias in special
education referrals. Journal of Educational Research, 86, 247-253.
Raudenbush, S., Rowen, B., & Cheong, Y. (1992). Contextual effects on the
self-perceived efficacy of high school teachers. Sociology of Education, 65, 150-167.
Riggs, I., Enochs, L. (1990). Toward the development of an elementary
teacher’s science teaching efficacy belief instrument. Science Education, 74, 625-638.
Rose, J. S., & Medway, F. J., (1981). Measurement of teachers’ beliefs in their
control over student outcome. Journal of Educational Research, 74, 185-190.
Ross, J. A. (1992). Teacher efficacy and the effect of coaching on student
achievement. Canadian Journal of Education, 17(1), 51-65.
Ross, J. A., Cousins, J. B., & Gadalla, T. (1996). Within-teacher predictors of
teacher efficacy. Teaching and Teacher Education, 12(4), 385-400.

134
Rotter, J. B. (1966). Generalized expectancies for internal versus external
control of reinforcement. Psychological Monographs, 80, 1-28.
Safer, A. M. , Farmer, L. S. J., Segalla, A., & Elhoubi, A. F. (2005). Does the
distance from the teacher influence student evaluations? Educational Research
Quarterly, 28 (3), 28-35.
Schaller, K.A., & Dewine, S. (1993, November). The development of a
communication-based model of teacher efficacy. Paper presented at the Annual
Meeting of the Speech Communication Association, Miami, FL.
Shadid, J.,& Thompson, D. (2001, April). Teacher efficacy: A research
synthesis. Paper presented at the Annual Meeting of the American Educational
Research Association, Seattle, WA.
Sherman, T. M., Armistead, L. P., Fowler, F., Barksdale, M. A., & Reif, G.
(1987). The quest for excellence in university teaching. Journal of Higher Education,
48(1), 66-84.
Sojka, J., Ashok, K. G., & Dawn, R. D. S. (2002). Student and faculty
perceptions of student evaluations of teaching. College Teaching, 50 (2), 44-49.
Swars, S. L. (2005). Examining perceptions of mathematics teaching
effectiveness among elementary preservice teachers with differing levels of
mathematics teacher efficacy. Journal of Instructional Psychology, 32(2), 139-147.

135
Tracz, S.M., & Gibson, S. (1986, November). Effects of efficacy on academic
achievement. Paper presented at the Annual Meeting of the California Educational
Research Association, Marina del Rey, CA.
Tschannen-Moran, M., & Hoy, A. W. (2001). Teacher efficacy: capturing an
elusive construct. Teaching and Teacher Education, 17, 783-805.
Tschannen-Moran, M., Woolfolk-Hoy, A. W., & Hoy, W. K. (1998). Teacher
efficacy “ Its meaning and measure. Review of Educational Research, 68(2), 202-248.
Wankat, P. C. (2002). The Effective, efficient professor.: Teaching,
Scholarship and Service. Boston, MA: Allyn and Bacon.
Witcher, A.E., Onwuegbuzie, A.J., Collins, K. M. T., Filer, J. D., Wiedmaier,
C.D., & Moore, C. (2003). Students’ perceptions of characteristics of effective
college teachers. (ERIC Document Reproduction Service No. ED482517).
Woolfolk, A. E., Rosoff, B., & Hoy, W. K. (1990). Teachers’ sense of
efficacy and their beliefs about managing students. Teaching and Teacher Education,
6(2), 137-148.
Woolfolk-Hoy, A., & Spero, R. B. (2005). Changes in teacher efficacy during
the early years of teaching: A comparison of four measures. Teaching and Teacher
Education, 21, 343-356.
Woolfolk, A.E., Rosoff, B., & Hoy, W.K., (1990). Teachers' sense of efficacy
and their beliefs about classroom control. Teaching and Teacher Education, 6, 137-
148.

136
Young, S., & Shaw, D. G. (Nov-Dec-1999). Profiles of effective college and
university teachers. The Journal of Higher Education, 70(6), 670-686.

137
APPENDICES
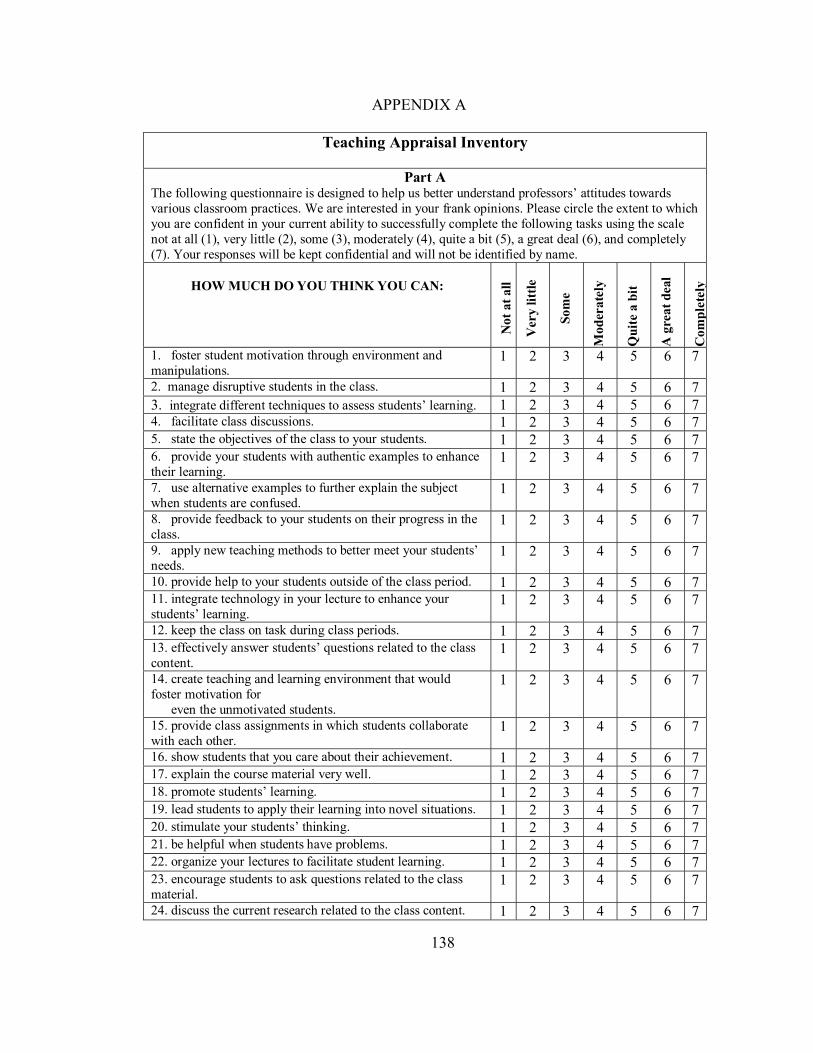
138
APPENDIX A
Teaching Appraisal Inventory
Part A The following questionnaire is designed to help us better understand professors’ attitudes towards various classroom practices. We are interested in your frank opinions. Please circle the extent to which you are confident in your current ability to successfully complete the following tasks using the scale not at all (1), very little (2), some (3), moderately (4), quite a bit (5), a great deal (6), and completely (7). Your responses will be kept confidential and will not be identified by name.
HOW MUCH DO YOU THINK YOU CAN:
Not
at a
ll
Ver
y lit
tle
Som
e
Mod
erat
ely
Qui
te a
bit
A g
reat
dea
l
Com
plet
ely
1. foster student motivation through environment and manipulations.
1 2 3 4 5 6 7
2. manage disruptive students in the class. 1 2 3 4 5 6 73. integrate different techniques to assess students’ learning. 1 2 3 4 5 6 74. facilitate class discussions. 1 2 3 4 5 6 75. state the objectives of the class to your students. 1 2 3 4 5 6 76. provide your students with authentic examples to enhance their learning.
1 2 3 4 5 6 7
7. use alternative examples to further explain the subject when students are confused.
1 2 3 4 5 6 7
8. provide feedback to your students on their progress in the class.
1 2 3 4 5 6 7
9. apply new teaching methods to better meet your students’ needs.
1 2 3 4 5 6 7
10. provide help to your students outside of the class period. 1 2 3 4 5 6 711. integrate technology in your lecture to enhance your students’ learning.
1 2 3 4 5 6 7
12. keep the class on task during class periods. 1 2 3 4 5 6 713. effectively answer students’ questions related to the class content.
1 2 3 4 5 6 7
14. create teaching and learning environment that would foster motivation for even the unmotivated students.
1 2 3 4 5 6 7
15. provide class assignments in which students collaborate with each other.
1 2 3 4 5 6 7
16. show students that you care about their achievement. 1 2 3 4 5 6 717. explain the course material very well. 1 2 3 4 5 6 718. promote students’ learning. 1 2 3 4 5 6 719. lead students to apply their learning into novel situations. 1 2 3 4 5 6 720. stimulate your students’ thinking. 1 2 3 4 5 6 721. be helpful when students have problems. 1 2 3 4 5 6 722. organize your lectures to facilitate student learning. 1 2 3 4 5 6 723. encourage students to ask questions related to the class material.
1 2 3 4 5 6 7
24. discuss the current research related to the class content. 1 2 3 4 5 6 7

139
Not
at a
ll
Ver
y lit
tle
Som
e
Mod
erat
ely
Qui
te a
bit
A g
reat
dea
l
Com
plet
ely
25. present the material in a way that facilitates note taking. 1 2 3 4 5 6 7
26. establish good rapport with your students. 1 2 3 4 5 6 727. assess students fairly. 1 2 3 4 5 6 728. provide students with assignments that facilitate their understanding the material.
1 2 3 4 5 6 7
29. assign your students reading/assignments that are valuable to their learning.
1 2 3 4 5 6 7
30. maintain your enthusiasm in teaching even if the students do not seem to be interested in the material.
1 2 3 4 5 6 7
31. encourage your students to express their ideas in the class.
1 2 3 4 5 6 7
32. enhance your students’ learning. 1 2 3 4 5 6 733. provide different points of view related to the topic when applicable.
1 2 3 4 5 6 7
34. help students develop their critical thinking. 1 2 3 4 5 6 735. answer students’ questions clearly. 1 2 3 4 5 6 736. emphasize the major points in your lecture 1 2 3 4 5 6 737. stimulate students’ interest in the subject area. 1 2 3 4 5 6 738. handle conflicts with students. 1 2 3 4 5 6 739. increase students’ interest of the course you are teaching 1 2 3 4 5 6 740. hold students’ attention during class. 1 2 3 4 5 6 741. implement fair evaluation to assess student learning. 1 2 3 4 5 6 742. conduct your class in an energetic way. 1 2 3 4 5 6 743. teach well overall. 1 2 3 4 5 6 7
PART B
Please respond to the following statements using the same scale provided.
Not
at a
ll
Ver
y lit
tle
Som
e
Mod
erat
ely
Qui
te a
bit
A g
reat
dea
l
Com
plet
ely
1. I assume personal responsibility for my students’ learning.
1 2 3 4 5 6 7
2. I think it is mostly the students’ responsibility to learn 1 2 3 4 5 6 73. I tend to establish a friendly atmosphere in my classroom. 1 2 3 4 5 6 74. I believe there is nothing I can do to reach the low achieving students.
1 2 3 4 5 6 7
5. I can motivate even the most unmotivated students. 1 2 3 4 5 6 76. If a low achiever gives an incorrect response, I turn my attention to another student without waiting for the student to correct it.
1 2 3 4 5 6 7
7. No matter how effectively I teach, it is up to my students to learn.
1 2 3 4 5 6 7
8. When my students demonstrate low achievement, I question my teaching methods.
1 2 3 4 5 6 7

140
Not
at a
ll
Ver
y lit
tle
Som
e
Mod
erat
ely
Qui
te a
bit
A g
reat
dea
l
Com
plet
ely
9. When my students do not perform well, it is because of their lack of ability
1 2 3 4 5 6 7
10. When my students do not perform well, it is because of their lack of motivation.
1 2 3 4 5 6 7
11. If a student gets higher scores than before, it is because I use novel teaching methods.
1 2 3 4 5 6 7
PART C Using the same scale provided, please respond to the following statements indicating the extent to which you believe each of the following statements pertains to students in general. N
ot a
t all
Ver
y lit
tle
Som
e
Mod
erat
ely
Qui
te a
bit
A g
reat
dea
l
Com
plet
ely
1. In general, students are qualified to make accurate judgments of college professors’ teaching effectiveness.
1 2 3 4 5 6 7
2. Professors’ colleagues with excellent publication records and expertise are better qualified to evaluate their peers’ teaching effectiveness.
1 2 3 4 5 6 7
3. Most student ratings are nothing more than a popularity contest with the warm, friendly, humorous instructor emerging as the winner every time.
1 2 3 4 5 6 7
4. Students are not able to make accurate judgments until they have been away from the course and possibly away from the university for several years.
1 2 3 4 5 6 7
5. Student ratings forms are both unreliable and invalid.
1 2 3 4 5 6 7
6. The size of the class affects student ratings.
1 2 3 4 5 6 7
7. The gender of the student and the gender of the instructor affect student ratings.
1 2 3 4 5 6 7
8. The time of the day the course is offered affects student ratings.
1 2 3 4 5 6 7
9. Whether students take the course as a requirement or as an elective affects their ratings.
1 2 3 4 5 6 7
10. Whether students are majors or nonmajors affects their ratings.
1 2 3 4 5 6 7
11. The level of the course (freshman, sophomore, junior, senior, graduate) affects student ratings.
1 2 3 4 5 6 7
12. The rank of the instructor (instructor, assistant professor, associate professor, professor) affects student ratings.
1 2 3 4 5 6 7
13. The grades or marks students receive in the course are highly correlated with their ratings of the course and the instructor.
1 2 3 4 5 6 7
14. There are no disciplinary differences in student ratings. 1 2 3 4 5 6 715. Student ratings on single general items are accurate measures of instructional effectiveness.
1 2 3 4 5 6 7
16. Student ratings cannot meaningfully be used to improve instruction.
1 2 3 4 5 6 7
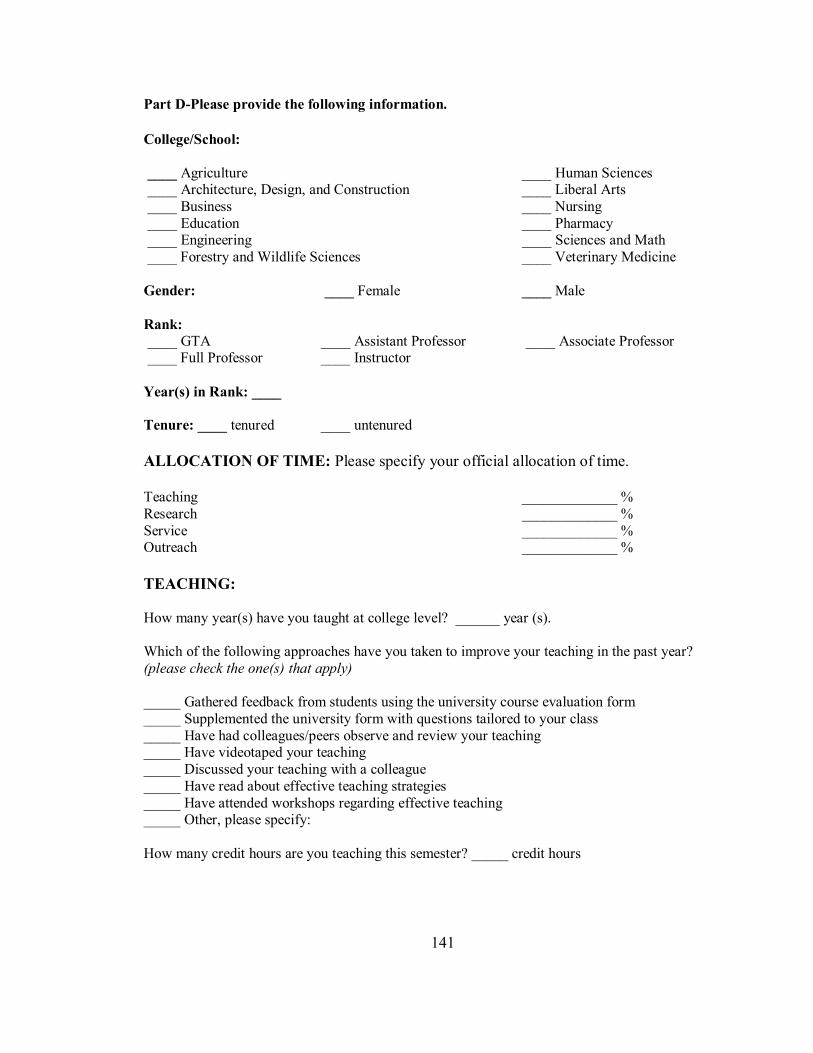
141
Part D-Please provide the following information.
College/School: ____ Agriculture ____ Human Sciences ____ Architecture, Design, and Construction ____ Liberal Arts ____ Business ____ Nursing ____ Education ____ Pharmacy ____ Engineering ____ Sciences and Math ____ Forestry and Wildlife Sciences ____ Veterinary Medicine Gender: ____ Female ____ Male Rank: ____ GTA ____ Assistant Professor ____ Associate Professor ____ Full Professor ____ Instructor Year(s) in Rank: ____ Tenure: ____ tenured ____ untenured ALLOCATION OF TIME: Please specify your official allocation of time. Teaching _____________ % Research _____________ % Service _____________ % Outreach _____________ % TEACHING: How many year(s) have you taught at college level? ______ year (s). Which of the following approaches have you taken to improve your teaching in the past year? (please check the one(s) that apply) _____ Gathered feedback from students using the university course evaluation form _____ Supplemented the university form with questions tailored to your class _____ Have had colleagues/peers observe and review your teaching _____ Have videotaped your teaching _____ Discussed your teaching with a colleague _____ Have read about effective teaching strategies _____ Have attended workshops regarding effective teaching _____ Other, please specify: How many credit hours are you teaching this semester? _____ credit hours

142
APPENDIX B
STUDENT EVALUATION OF EDUCATIONAL QUALITY (SEEQ)
INSTRUCTIONS: This evaluation form is intended to measure your reactions to this instructor and course. When you have finished completing the survey, please submit it to the researcher. Your responses will remain anonymous. Since the evaluations are done for research purposes, the summaries will not be given to the instructor.
Section A- As a description of this Course/Instructor, this statement is:
(Please circle the best response for each of the following statements, leaving a response blank only if it is clearly not relevant)
Ver
y po
or
Poor
Mod
erat
e
Goo
d
Ver
y G
ood
1- You found the course intellectually challenging and stimulating. 1 2 3 4 5 2- Instructor was enthusiastic about teaching the course. 1 2 3 4 5 3- Instructor’s explanations were clear. 1 2 3 4 5 4- Students were encouraged to participate in class discussions. 1 2 3 4 5 5- Instructor was friendly towards individual students. 1 2 3 4 5 6- Instructor contrasted the implications of various theories. 1 2 3 4 5 7- Feedback on examinations/graded materials was valuable. 1 2 3 4 5 8- Required reading/texts were valuable. 1 2 3 4 5 9- You have learned something, which you consider valuable. 1 2 3 4 5 10- Instructor was dynamic and energetic in conducting the course. 1 2 3 4 5 11- Course materials were well prepared and carefully explained. 1 2 3 4 5 12- Students were invited to share their ideas and knowledge. 1 2 3 4 5 13- Instructor made students feel welcome in seeking help/advice in or outside of class.
1 2 3 4 5
14- Instructor presented the background or origin of ideas/concepts developed in class.
1 2 3 4 5
15- Methods of evaluating student work were fair and appropriate. 1 2 3 4 5 16- Readings, homework, etc. contributed to appreciation and understanding of subject.
1 2 3 4 5
17- Your interest in the subject has increased as a consequence of this course.
1 2 3 4 5
18- Instructor enhanced presentations with the use of humor. 1 2 3 4 5 19- Proposed objectives agreed with those actually taught so you knew where course was going.
1 2 3 4 5
20- Students were encouraged to ask questions and were given meaningful answers.
1 2 3 4 5
21- Instructor had a genuine interest in individual students. 1 2 3 4 5 22- Instructor presented points of view other than his/her own when appropriate.
1 2 3 4 5
23- Examinations/graded materials tested course content as emphasized by the instructor.
1 2 3 4 5
24- You have learned and understood the subject materials in this course.
1 2 3 4 5

143
Ver
y po
or
Poor
Mod
erat
e
Goo
d
Ver
y G
ood
25- Instructor’s style of presentation held your interest during class.
1 2 3 4 5
26- Instructor gave lectures that facilitated taking notes.
1 2 3 4 5
27- Students were encouraged to express their own ideas and/or question the instructor.
1 2 3 4 5
28- Instructor was adequately accessible to students during office hours or after class.
1 2 3 4 5
29- Instructor adequately discussed current developments in the field.
1 2 3 4 5
30- How does this course compare with other courses you have had at Auburn University?
1 2 3 4 5
31- How does this instructor compare with other instructors you have had at Auburn University?
1 2 3 4 5
Section B- Student and Course Characteristics Please provide the following information. 32- Course difficulty, relative to other courses, was: 1. Very easy…3. Medium…5.very hard.
1 2 3 4 5
33- Course workload, relative to other courses, was: 1.very light…3.medium…5.very heavy
1 2 3 4 5
34- Course pace was: 1. Too slow…3.about right…5.too fast
1 2 3 4 5
35- Hours/weeks required outside of class: 1. 0 to 2; 2. 2 to 5; 3. 5 to 7; 4. 8 to 12; 5. Over 12.
1 2 3 4 5
36. Level of interest in the subject prior to this course: 1. Very low…3. Medium…5. Very high
1 2 3 4 5
37. Overall grade point average at Auburn University 1: Below 2.5 2: 2.5 to 3.0 3: 3.0 to 3.49 4: 3.5 to 3.7 5: Above 3.7
1 2 3 4 5
38. Expected grade in the course: 1. F; 2. D; 3. C; 4. B; 5. A
1 2 3 4 5
39. Reason for taking the course:1. Major requirement; 2. Major elective; 3. General ed. requirement; 4. Minor/related field; 5. General interest only (select the best one)
1 2 3 4 5
40. Year in school: 1. freshman; 2. sophomore; 3. junior; 4. senior; 5. postgraduate
1 2 3 4 5
41. My gender is: 0=Male 1=Female
0 1
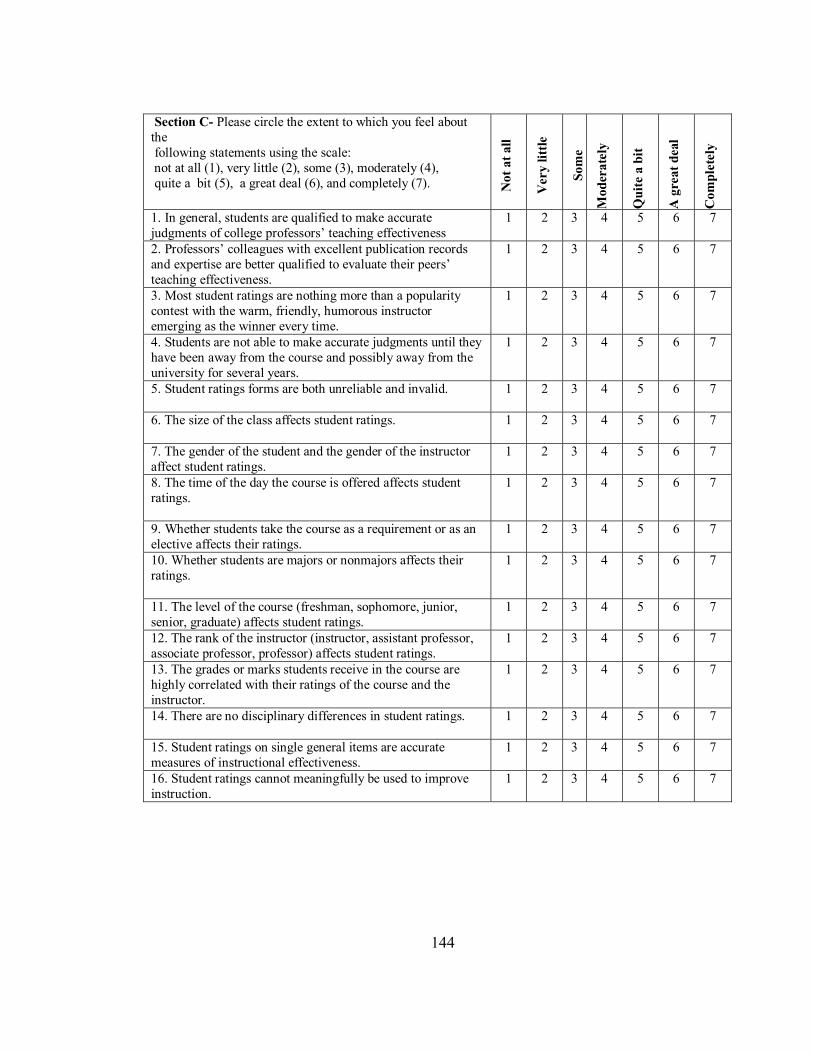
144
Section C- Please circle the extent to which you feel about the following statements using the scale: not at all (1), very little (2), some (3), moderately (4), quite a bit (5), a great deal (6), and completely (7).
Not
at a
ll
Ver
y lit
tle
Som
e
Mod
erat
ely
Qui
te a
bit
A g
reat
dea
l
Com
plet
ely
1. In general, students are qualified to make accurate judgments of college professors’ teaching effectiveness
1 2 3 4 5 6 7
2. Professors’ colleagues with excellent publication records and expertise are better qualified to evaluate their peers’ teaching effectiveness.
1 2 3 4 5 6 7
3. Most student ratings are nothing more than a popularity contest with the warm, friendly, humorous instructor emerging as the winner every time.
1 2 3 4 5 6 7
4. Students are not able to make accurate judgments until they have been away from the course and possibly away from the university for several years.
1 2 3 4 5 6 7
5. Student ratings forms are both unreliable and invalid.
1 2 3 4 5 6 7
6. The size of the class affects student ratings.
1 2 3 4 5 6 7
7. The gender of the student and the gender of the instructor affect student ratings.
1 2 3 4 5 6 7
8. The time of the day the course is offered affects student ratings.
1 2 3 4 5 6 7
9. Whether students take the course as a requirement or as an elective affects their ratings.
1 2 3 4 5 6 7
10. Whether students are majors or nonmajors affects their ratings.
1 2 3 4 5 6 7
11. The level of the course (freshman, sophomore, junior, senior, graduate) affects student ratings.
1 2 3 4 5 6 7
12. The rank of the instructor (instructor, assistant professor, associate professor, professor) affects student ratings.
1 2 3 4 5 6 7
13. The grades or marks students receive in the course are highly correlated with their ratings of the course and the instructor.
1 2 3 4 5 6 7
14. There are no disciplinary differences in student ratings.
1 2 3 4 5 6 7
15. Student ratings on single general items are accurate measures of instructional effectiveness.
1 2 3 4 5 6 7
16. Student ratings cannot meaningfully be used to improve instruction.
1 2 3 4 5 6 7