Embed Size (px)
Citation preview

Project Themes
Quality, Quality Assurance, Quality Models
Fishbone (Ishikawa) Diagram
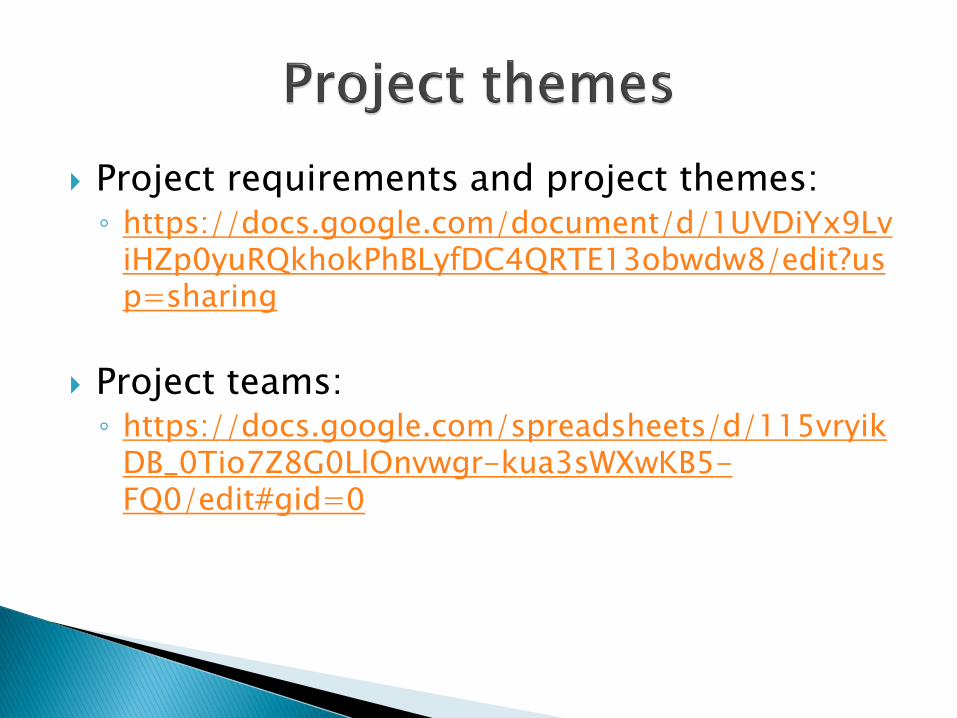
Project requirements and project themes:◦ https://docs.google.com/document/d/1UVDiYx9Lv
iHZp0yuRQkhokPhBLyfDC4QRTE13obwdw8/edit?usp=sharing
Project teams:◦ https://docs.google.com/spreadsheets/d/115vryik
DB_0Tio7Z8G0LlOnvwgr-kua3sWXwKB5-FQ0/edit#gid=0

IEEE defines product quality as:◦ the degree to which a system, component, or
process meets specified requirements/ customer oruser needs or expectations
Quality assurance (QA) is a way of preventingmistakes or defects in manufactured productsand avoiding problems when deliveringsolutions or services to customers;

Intangible quality views => tangible software measures
McCall’s Quality Model

Aspects:◦ Fault (abnormal condition or defect) – can lead to…
◦ Failure (not meeting an objective)
◦ Defect
◦ Error (incorrect result)


Make an Ishikawa diagram for FibonacciA or FibonacciB or FibonacciC; you can find the versions on: https://www.dropbox.com/sh/93yw6qeeffqzego/AADQVo2PxPQyIJDE8whhfpYxa?dl=0
◦ Attention: Ex A and B require a command line parameter, e.g. programA.exe 12
◦ Use as test params: 0, 1, 15, 23, 50, 98

Observe carefully some aspects: correctitude, performance, ease of use (for a specific OS), source code, user expectations.
Use a tool to create the diagram:◦ http://asq.org/sixsigma/tools-
exchange/docs/fishbone-cause-effect-diagram.xls
0
2
4
6
8
10
12
14
Fr
eq
ue
nc
y
1500
2500
3500
4500
5500
6500
7500
8500
Strength (psi)

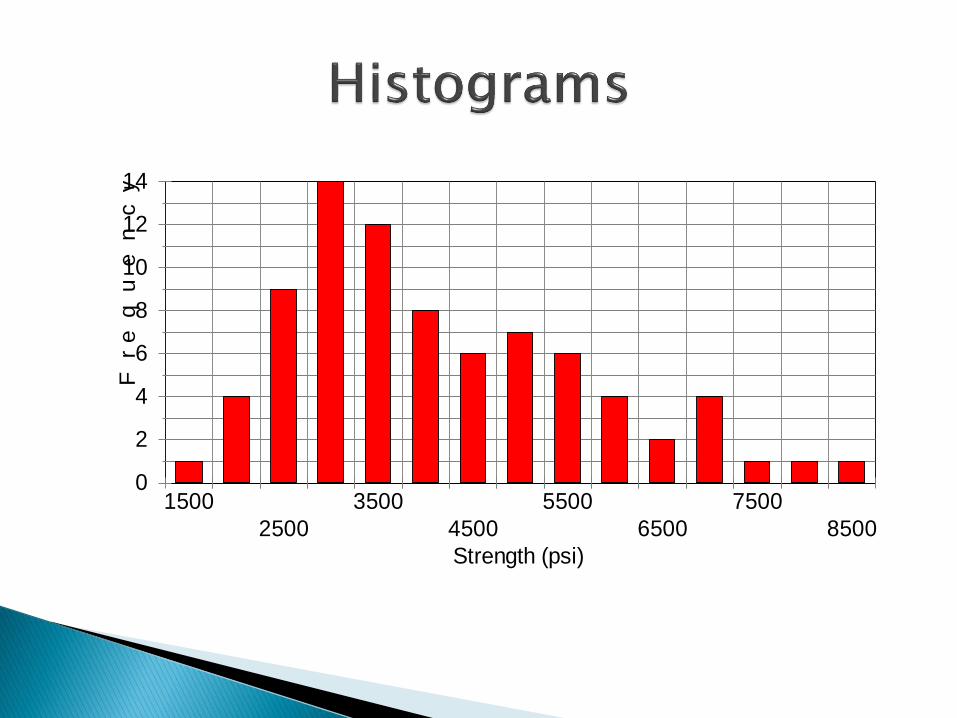
Calculate the age of each defect and draw a simple histogram of the age of defect for the defects from the next slide ->
Use Excel or http://easycalculation.com/graphs/create-histogram.php to make the histogram
Interpret the histogram and write down your conclusions

Defect Submitted Resolved Age
Def1 2010-02-01 2010-02-12
Def2 2010-02-01 2010-02-02
Def3 2010-02-01 2010-03-01
Def4 2010-02-01 2010-03-12
Def5 2010-02-01 2010-02-07
Def6 2010-02-02 2010-03-03
Def7 2010-02-03 2010-03-03
Def8 2010-02-06 2010-03-03
Def9 2010-02-08 2010-03-03
Def10 2010-02-08 2010-03-12
Def11 2010-02-08 2010-03-12
Def12 2010-02-08 2010-03-12
Def13 2010-02-08 2010-03-01
Def14 2010-02-11 2010-03-01
Def15 2010-02-11 2010-03-03
Def16 2010-02-11 2010-03-12
Def17 2010-02-11 2010-03-12
Def18 2010-02-11 2010-03-12
Def19 2010-02-11 2010-03-01
Def20 2010-02-12 2010-03-03
Def21 2010-02-13 2010-03-01
Def22 2010-02-14 2010-03-01
Def23 2010-02-15 2010-03-01
Def24 2010-02-16 2010-03-01
Def25 2010-02-17 2010-03-03
Def26 2010-02-18 2010-03-03
Def27 2010-02-19 2010-03-01

Please calculate Defect Density for thefollowing modules.
Make a graphical representation for yourresults and interpret it.
Module
Number of
defects Lines of code Defect density
M1 40 20
M2 15 30
M3 25 5
M4 10 10
M5 8 20
M6 4 20
M7 10 30
M8 5 5
M9 7 10
M10 14 20

Time
Cost
Scope
Quality – “built as it should” – Functional Requirements
– Non Functional Requirements
– Transition Requirements

Think of a metric to evaluate the quality of yourbachelor project and motivate why you considerit to be important.
Describe the measurement function (formula).
Think of a short scenario of collecting thenecessary data to calculate the metric.
What quality attribute does it evaluate?
Can you name a quality model which proposesthat attribute?