Embed Size (px)
Citation preview

Page 1 of 13
Next release: 14 January 2022
Release date: 7 October 2021
Contact: Josh Martin [email protected] +44 1633 455086
Article
Productivity overview, UK: April to June 2021The main findings from official statistics and analysis of UK productivity, presenting a summary of recent developments.
Table of contents
1. Main points
2. Latest statistics
3. Labour productivity headline measures
4. Labour productivity by industry
5. Multi-factor productivity
6. Public service productivity
7. Developments
8. Data
9. Glossary
10. Measuring the data
11. Strengths and limitations
12. Related links

Page 2 of 13
1 . Main points
Labour productivity
In Quarter 2 (Apr to June) 2021, output per hour worked was 1.7% above the 2019 average level, with a quarter-on-quarter rise of 0.1%.
Output per worker was 1.6% below the 2019 average level, despite a 5.2% increase from the previous quarter.
Multi-factor productivity
In Quarter 2 2021, multi-factor productivity was 2.2% above the 2019 average level.
Public service productivity
Public service productivity has not recovered yet to the 2019 average level, despite a rise of 6.5% in Quarter 2 2021 compared with Quarter 1 (Jan to March) 2021.
The increase in productivity in Quarter 2 (Apr to June) 2021 was driven by a rise of public service output by 6.6%, and a rise of 0.1% in public service inputs.
There are several revisions to data sources in this release, including annual national accounts related revisions to gross value added and changes to population estimates in the Labour Force Survey. See our Measuring the data
for more information.section
2 . Latest statistics
In Quarter 2 (Apr to June) 2021, the UK continued to recover from the impacts of the coronavirus (COVID-19) pandemic. Through May and June 2021 there was an unwinding of lockdown restrictions, with the reopening of retail stores, museums, and sporting events. We also saw a decrease in the number of individuals on furlough and an increase in hours worked.
Page 3 of 13
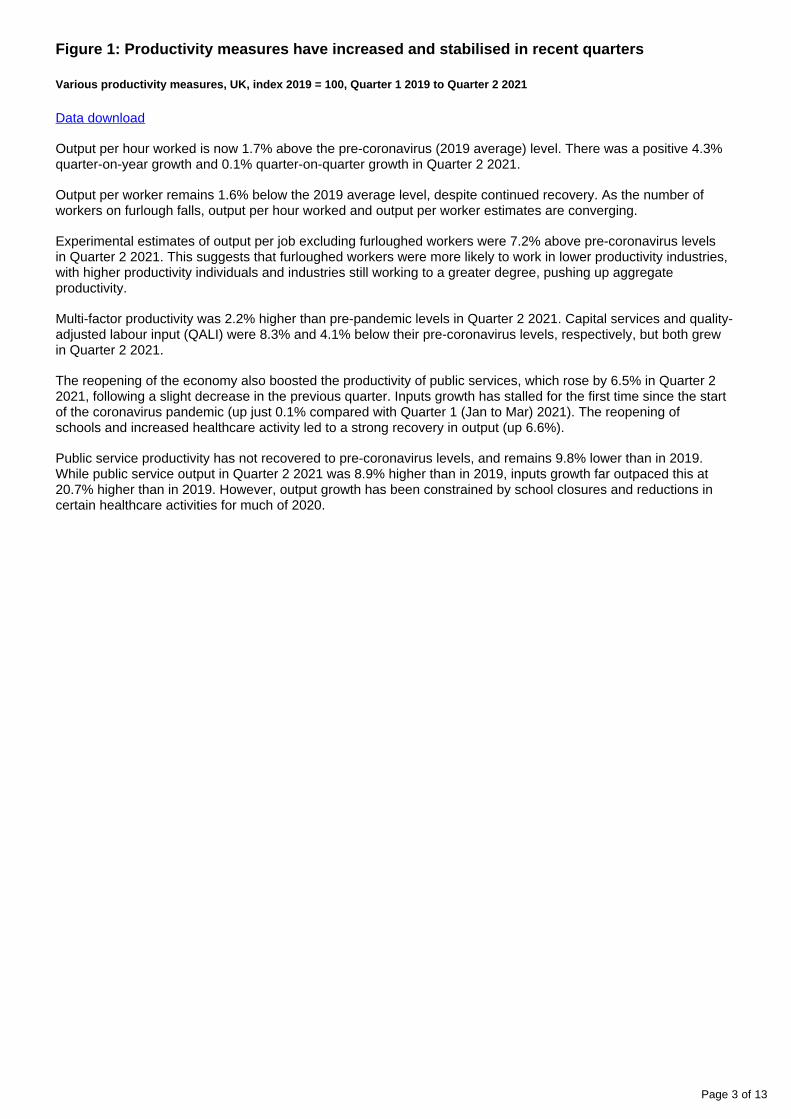
Figure 1: Productivity measures have increased and stabilised in recent quarters
Various productivity measures, UK, index 2019 = 100, Quarter 1 2019 to Quarter 2 2021
Data download
Output per hour worked is now 1.7% above the pre-coronavirus (2019 average) level. There was a positive 4.3% quarter-on-year growth and 0.1% quarter-on-quarter growth in Quarter 2 2021.
Output per worker remains 1.6% below the 2019 average level, despite continued recovery. As the number of workers on furlough falls, output per hour worked and output per worker estimates are converging.
Experimental estimates of output per job excluding furloughed workers were 7.2% above pre-coronavirus levels in Quarter 2 2021. This suggests that furloughed workers were more likely to work in lower productivity industries, with higher productivity individuals and industries still working to a greater degree, pushing up aggregate productivity.
Multi-factor productivity was 2.2% higher than pre-pandemic levels in Quarter 2 2021. Capital services and quality-adjusted labour input (QALI) were 8.3% and 4.1% below their pre-coronavirus levels, respectively, but both grew in Quarter 2 2021.
The reopening of the economy also boosted the productivity of public services, which rose by 6.5% in Quarter 2 2021, following a slight decrease in the previous quarter. Inputs growth has stalled for the first time since the start of the coronavirus pandemic (up just 0.1% compared with Quarter 1 (Jan to Mar) 2021). The reopening of schools and increased healthcare activity led to a strong recovery in output (up 6.6%).
Public service productivity has not recovered to pre-coronavirus levels, and remains 9.8% lower than in 2019. While public service output in Quarter 2 2021 was 8.9% higher than in 2019, inputs growth far outpaced this at 20.7% higher than in 2019. However, output growth has been constrained by school closures and reductions in certain healthcare activities for much of 2020.

Page 4 of 13
3 . Labour productivity headline measures
Figure 2 shows how output per hour worked, gross value added (GVA) and hours worked have changed since 2008. Output per hour worked was 1.7% above pre-coronavirus (2019 average) levels in Quarter 2 (Apr to June) 2021. Both GVA and hours worked have seen strong recoveries since Quarter 2 2020 but remain, respectively, 4.8% and 3.2% below pre-coronavirus levels. Their similar recovery trajectories have resulted in a relatively stable level of output per hour worked.
Figure 2: Output per hour worked was 1.7% above pre-coronavirus pandemic levels
Index 2019 = 100, output per hour worked, gross value added, hours worked, UK, Quarter 1 2008 to Quarter 2 2021
Source: Office for National Statistics – Productivity overview, UK

Page 5 of 13
4 . Labour productivity by industry
In Quarter 2 (Apr to June) 2021, most industries showed strong growth in both gross value added (GVA) and hours worked, compared with the previous quarter. In non-financial services, GVA grew faster than hours worked, lifting whole economy output per hour worked. However, this productivity gain was partially offset by other industries including construction and manufacturing, where hours worked grew a little faster than GVA.
As the economy opened further in Quarter 2 2021, economic activity increased more in low-productivity industries than in high-productivity industries compared with the previous quarter. With lower-productivity industries now accounting for a greater share of economic activity, growth in UK economy productivity was lower than it would otherwise have been.
Nevertheless, UK productivity in Quarter 2 2021 remained above pre-coronavirus (2019 average) levels because less productive industries still represent a smaller share of the economy than they did before the coronavirus pandemic.
Figure 3 shows productivity 1.6% higher in Quarter 2 2021 compared with the end of 2018, primarily because of a positive allocation effect of 3.0 percentage points. Within-industry productivity growth contributed negative 0.3 percentage points compared with the end of 2018. This reflects the challenges and costs that the coronavirus pandemic has placed on business operations, meaning that many industries have experienced a decline in output per hour worked. In the latest quarter we have seen the within-industry effects become less negative, further indicating the reopening of the economy.

Page 6 of 13
1.
Figure 3: Productivity would be below pre-coronavirus pandemic levels if not for a large positive allocation effect
Output per hour worked, allocation effect, productivity growth within industries, cumulative growth since Quarter 4 2018, percentage, Quarter 1 2019 to Quarter 2 2021
Source: Office for National Statistics – Productivity overview, UK
Notes:
The allocation effect and growth within industries may not add up to the output per hour total. This is because of the exclusion of the National Accounts balancing value. See our Labour productivity by industry
for more information.division dataset
5 . Multi-factor productivity
Output growth in the market sector can be decomposed into growth in the factors of production: capital services (the amount of productive capital available to businesses), quality adjusted labour input (the number of hours worked weighted by workers' wages) and multi-factor productivity (MFP) (how well inputs are used in the production process). You can find out more about these terms in the .Glossary section
Capital services are estimated from measures of the capital stock. Changes to the capital stock are because of inflows of new capital (from investments made in the period) and outflows of old capital (from retirement of assets and depreciation because of wear and tear). Investment has fallen during the coronavirus (COVID-19) pandemic, which reduces growth in the capital stock, negatively affecting capital services. However, this effect is muted because investment each quarter has a relatively small amount compared with the large value of the capital stock, which has been built up over long periods of time.
Reduced investment today will reduce the size of the capital stock and hence the productive potential of the economy in the future. Figure 4 compares capital services during the pandemic with the recovery of capital services following the UK's last recession in 2008.
Page 7 of 13
1.
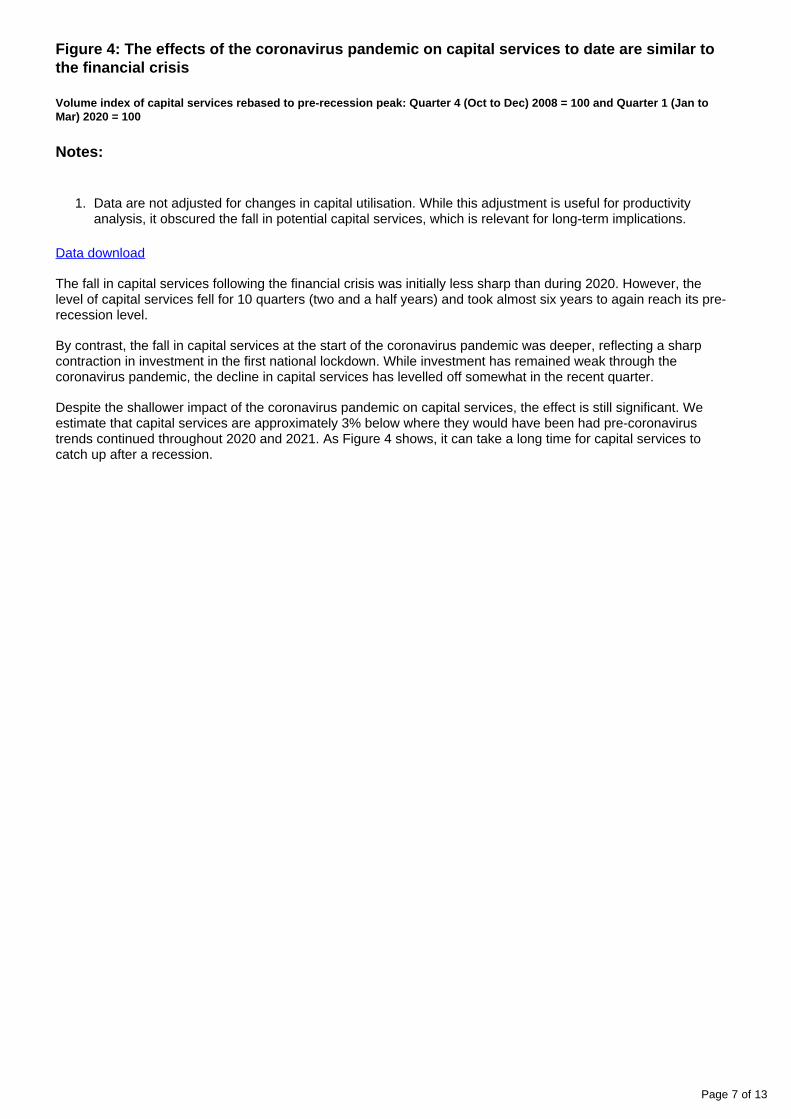
Figure 4: The effects of the coronavirus pandemic on capital services to date are similar to the financial crisis
Volume index of capital services rebased to pre-recession peak: Quarter 4 (Oct to Dec) 2008 = 100 and Quarter 1 (Jan to Mar) 2020 = 100
Notes:
Data are not adjusted for changes in capital utilisation. While this adjustment is useful for productivity analysis, it obscured the fall in potential capital services, which is relevant for long-term implications.
Data download
The fall in capital services following the financial crisis was initially less sharp than during 2020. However, the level of capital services fell for 10 quarters (two and a half years) and took almost six years to again reach its pre-recession level.
By contrast, the fall in capital services at the start of the coronavirus pandemic was deeper, reflecting a sharp contraction in investment in the first national lockdown. While investment has remained weak through the coronavirus pandemic, the decline in capital services has levelled off somewhat in the recent quarter.
Despite the shallower impact of the coronavirus pandemic on capital services, the effect is still significant. We estimate that capital services are approximately 3% below where they would have been had pre-coronavirus trends continued throughout 2020 and 2021. As Figure 4 shows, it can take a long time for capital services to catch up after a recession.

Page 8 of 13
6 . Public service productivity
In Quarter 2 (Apr to June) 2021, public service productivity rose by 6.5% compared with the previous quarter, when productivity fell slightly because of the reintroduction of coronavirus (COVID-19) restrictions. Public service inputs rose by 0.1% in Quarter 2 2021, the smallest increase since the start of the coronavirus pandemic, after unprecedented increases during 2020. Output grew by 6.6%, far outpacing inputs growth, delivering higher productivity.
Higher attendance in schools was one of the main contributors to the growth in public service output, as the quantity of education delivered via is generally lower than when children attend school. Increased remote learningactivity in hospitals further contributed to the rise in output, with rises in the volume of elective and non-elective health services and advances in the vaccination programme.

Page 9 of 13
1.
2.
Figure 5: Public service productivity grew in Quarter 2 2021 driven by a recovery of public sector output
Quarterly growth rates in public service output, inputs and productivity, UK, Quarter 1 2019 to Quarter 2 2021
Source: Office for National Statistics – Productivity overview, UK
Notes:
Growth rates for total inputs are inverted to reflect the negative impact that inputs have on productivity.
Our estimates include ongoing improvements of how we estimate non-market output for the and healthcare services.education
Nonetheless, public service productivity remained below pre-coronavirus (2019 average) levels in Quarter 2 2021. Public service productivity is estimated to fall by 15.0% in 2020 compared with 2019. More accurate estimates for 2020 will be published in 2023 in our , which is badged as annual public service productivity estimatea National Statistic and incorporates changes in service quality.

Page 10 of 13
7 . Developments
We have released our , where we set out plans to build on recent Productivity development plan for 2021 to 2023improvements to our productivity statistics and look to introduce new outputs. This follows the Office for Statistics Regulation in early 2021.assessment of ONS productivity statistics
The datasets associated with this release will be changing from January 2022 to meet legislative guidance around accessibility. We are taking this opportunity to consolidate and restructure our datasets to improve user experience.
We will be releasing a new suite of Unit Labour Costs statistics on 3 November 2021. These will incorporate new measures of Average Labour Compensation per hour (ALCH), and new official estimates of the labour share of income.
We welcome any feedback on our developments to [email protected]
8 . Data
Labour Productivity Tables 1 to 8 and R1Dataset LPROD01 | Released 7 October 2021Quarterly output per hour, output per job and output per worker for the whole UK economy and a range of industries.
Productivity jobs, productivity hours, market sector workers, market sector hoursDataset LPROD02 | Released 7 October 2021Underlying labour inputs behind the labour productivity estimates by industry and industrial sector as defined by the Standard Industrial Classification (SIC). Contains statistics on productivity jobs, productivity hours and market sector workers. These statistics are the main intermediates in producing output per worker and output per hour statistics.
Breakdown of contributions, whole economy and sectorsDataset PRODCONTS | Released 7 October 2021Provides estimates of contributions to labour productivity (measured as output per hour) using the "Generalised Exactly Additive Decomposition" (GEAD) methodology as described in Tang and Wang (2004), UK. Contains data on total worked hours, gross value added (GVA) estimates, output per hour series and prices deflators. Includes data disaggregated by sector. Also contains quarter on quarter, quarter-on-same-quarter a year ago and annual formats for selected outputs.
Multi-factor productivity estimatesDataset MFP01 | Released 7 October 2021Indices and log changes for gross value added (GVA), multi-factor productivity, implied factor prices, hours worked, labour composition, capital services and GVA per hour worked.
Public service productivity, quarterlyDataset | Released 7 October 2021Includes quarterly, annual and revisions tabs to see the picture for UK public service productivity and also to see how much has changed in the data.
Unit labour costsDataset | Released 7 October 2021Unit labour costs and revisions from previously published estimates, UK.
9 . Glossary

Page 11 of 13
Labour productivity
Labour productivity measures how many units of output are produced for each unit of labour input and is calculated by dividing output by labour input.
Labour inputs
The preferred measure of labour input is hours worked ("productivity hours"), but workers and jobs ("productivity jobs") are also used.
Output
Output refers to gross value added (GVA), which is an estimate of the volume of goods and services produced by an industry, and in aggregate for the UK.
Multi-factor productivity
For any given change in output, multi-factor productivity (MFP) measures the amount that cannot be accounted for by changes in inputs of quality-adjusted labour and capital.
Capital services
Capital services refer to the flow of productive services provided by an asset that is employed in production. Capital services are the appropriate measure of capital input in production analysis.
Quality-adjusted labour input (QALI)
Quality-adjusted labour input (QALI) estimates the growth of hours worked (labour input) taking into account the quality of the workforce based on experience and skills. The hours worked by more productive workers are weighted higher than the hours worked by less productive workers.
Public service productivity
Productivity of public services is estimated by comparing growth in the total amount of output with growth in the total amount of inputs used. Growth rates of output and inputs for individual service areas are aggregated by their relative share of total government expenditure (expenditure weight) to produce estimates of total public service output, inputs and productivity.
10 . Measuring the data

Page 12 of 13
Revisions in this release
This release is the first to reflect changes to labour market statistics, following a re-weighting of the Labour Force Survey to new population estimates. As set out in our , this improves but impact of Labour Force Survey articledoes not materially affect the path of productivity through the coronavirus pandemic. A calculation error in the reweighting has been identified; see the notice in the for more information. This is Labour market overview bulletinlikely to result in small changes to our productivity estimates, but unlikely to change the narrative of UK productivity through the coronavirus pandemic.
Data in this release are consistent with Blue Book 2021 (BB21), which implements double deflation for the first time. See Impact of Blue Book 2021 changes on quarterly and monthly volume estimates of gross domestic
for more information about the Bluebook related changes to gross value added (GVA) and product by industrysee for more information about changes to our Impact of double deflation on labour productivity: 1997 to 2018labour productivity estimates because of BB21 changes.
New estimates of GVA are more volatile on a quarterly basis than previously, especially in production industries. This reflects the use of new data and methods, but also . As challenges in reconciling quarterly and annual dataproductivity is a structural feature of the economy, we continue to advise users to focus on long-term trends of productivity.
This release reflects revisions to GVA and income data resulting from quarterly national accounts. Revisions resulting from seasonal adjustment affect all periods.
Methodological information
Multi-factor productivity (MFP) estimates are compiled using the growth accounting framework. This decomposes changes in economic output, in this case GVA of the UK market sector, into contributions from changes in measured inputs: labour, capital and a residual element known as MFP. For more information, see our simple
and our guide to multi-factor productivity Multi-factor productivity (MFP) quality and methodology information (QMI).
Information on data used in public service productivity can be found in our previous Public service productivity and in .release Sources and methods for public service productivity estimates
The measure of output used in these statistics is the chained volume (real) measure of gross value added (GVA) .at basic prices
11 . Strengths and limitations
During the coronavirus (COVID-19) pandemic there have been additional challenges to collecting labour market data and estimating gross domestic product (GDP). As a result, the estimates are subject to increased uncertainty and there is an increased likelihood of larger revisions than usual in future releases of these measures.
More information on the strengths and limitations of the data, as well as the quality and accuracy of the data, is available in the for the labour productivity estimates; the Labour productivity QMI Multi-factor productivity (MFP)
for the multi-factor productivity estimates; and in the for the public QMI Public service productivity: total, UK QMIservice productivity estimates with further information available in Sources and methods for public service
.productivity estimates

Page 13 of 13
12 . Related links
Productivity development plan: 2021 to 2023Article | Released 6 October 2021This development plan builds on recent improvements to Office for National Statistics (ONS) productivity statistics and looks at introducing new outputs, further improving our productivity statistics and consolidating our improvements to date.
GDP quarterly national accounts, UK: April to June 2021Bulletin | Released 30 September 2021Revised quarterly estimate of gross domestic product (GDP) for the UK. Uses additional data to provide a more precise indication of economic growth than the first estimate.
Labour market overview, UK: September 2021Bulletin | Released 14 September 2021Estimates of employment, unemployment, economic inactivity and other employment-related statistics for the UK.
Public service productivity: total, UK, 2018Article | Released 14 April 2021Updated measures of output, inputs and productivity for public services in the UK between 1997 and 2018. Includes service area breakdown, as well as impact of quality adjustment and latest revisions.