Embed Size (px)
Citation preview

PRODUCTIVITY IMPROVEMENT OF FISH CRACKERS
PROCESSING USING SIMULATION TECHNIQUE
WAN NURUL AFIQAH BT WAN MOHD SHAFIE
Report submitted in partial fulfillment of the requirements
for the award of degree of
Bachelor of Mechanical Engineering
Faculty of Mechanical Engineering
UNIVERSITI MALAYSIA PAHANG
JUNE 2013

vii
ABSTRACT
Fish cracker is one of the famous foods that originated from East Coast of Malaysia
consists of Terengganu, Kelantan and Pahang. It is mainly made from mixing of sago
flour, fish, egg, salt and water. Up today, fish crackers are traditionally produces by small
industries that not acquire the good practices and latest technology. Therefore, this
industry has a lot of inadequacy to expand due to low productivity and unreliable
production management. Looking into this issue, the purpose of this study is to determine
optimum process layout configuration fish crackers factory using computer simulation
analysis. This study adopts industrial engineering concept to help the entrepreneur of fish
crackers to increase their productivity. Generally, this layout planning is involving the
overall process of fish crackers production. Study started with identification all the
process and the types of fish crackers production. Then, process variables such as
customer requirement and function of the entire machine are being defined and the time
production for all processes is being taken. The process continued with some of the
layout being created using WITNESS Software for the all process that involve in the
production of fish crackers. Based on the purpose outlined, suggestion and
recommendation for improvement has been proposed. Upon completion of this study, it
can be applied by the entrepreneurs who seriously involved in the fish crackers
manufacturing industry to fulfill the market requirement.

viii
ABSTRAK
Keropok ikan adalah salah satu makanan terkenal yang berasal dari Pantai Timur
Malaysia iaitu Terengganu, Kelantan dan Pahang. Ia dibuat daripada campuran tepung
sagu, ikan, telur, garam dan air. Sehingga hari ini, keropok ikan yang secara tradisinya
dihasilkan oleh industri kecil tempatan belum mempunyai teknologi terkini. Oleh itu,
industri ini mempunyai had yang terbatas untuk dikembangkan kerana produktiviti yang
dihasilkan rendah dan pengurusan pengeluaran tidak boleh dicapai. Melihat kepada isu
ini, tujuan kajian adalah untuk menentukan proses susun atur yang optimum pada kilang
keropok ikan dengan menggunakan analisis simulasi WITNESS di dalam komputer.
Kajian ini menggunakan konsep kejuruteraan perindustrian dan mengkaji penemuan ini
untuk membantu usahawan keropok ikan meningkatkan produktiviti mereka. Secara
umumnya, ini perancangan susun atur yang melibatkan keseluruhan proses pengeluaran
keropok ikan. Kajian bermula dengan pengenalan semua proses yang terlibat dan jenis
pengeluaran ikan keropok. Kemudian, spesifikasi seperti keperluan pelanggan dan fungsi
keseluruhan mesin dijelaskan dan pengeluaran masa untuk semua proses diambil. Proses
ini dijalankan dengan beberapa susun atur yang dicipta menggunakan Perisian WITNESS
untuk semua proses yang terlibat dalam pengeluaran keropok ikan. Berdasarkan kepada
tujuan yang digariskan, cadangan dan syor untuk penambahbaikan akan dicadangkan
sebagai peningkatan berterusan kepada peningkatan pengeluaran. Setelah selesai kajian
ini, ia boleh digunakan oleh usahawan yang serius terlibat dalam industri pembuatan
keropok ikan untuk memenuhi keperluan pasaran.

ix
TABLE OF CONTENTS
Page
EXAMINER APPROVAL DOCUMENT ii
SUPERVISOR’S DECLARATION iii
STUDENT’S DECLARATION iv
ACKNOWLEDGEMENTS vi
ABSTRACT vii
ABSTRAK viii
TABLE OF CONTENTS ix
LIST OF TABLES xii
LIST OF FIGURES xiii
CHAPTER 1 INTRODUCTION
1.1 Introduction 1
1.2 Background of Study 1
1.3 Problem Statement 3
1.4 Objective 5
1.5 Scopes of Work 5
1.6 Benefits of the Project 6
CHAPTER 2 LITERATURE REVIEW
2.1 Introduction 7

x
2.2 Design 7
2.2.1 Engineering Design 8
2.3 Production System 9
2.4 Keropok Ikan Characteristics 11
2.5 Simulation and Software 12
CHAPTER 3 METHODOLOGY
3.1 Introduction 13
3.2 Flow Chart 14
3.3 Identify the Problem Solving 15
3.4 Production Layout Proposal 16
3.5 Simulation Study 16
CHAPTER 4 RESULTS AND DISCUSSION
4.1 Introduction 17
4.2 Simulation 17
4.3 The current process layout 19
4.3.1 Simulation using WITNESS Software for Real Industry 21
4.3.2 Result for Actual Industry using WITNESS Software 22
4.4 Case study 1: Reduction of Waiting Area (Blocked) Process 25
4.4.1 The combination of two or more workstation 25
4.5 Case study 2: Additional some of the machine 26
4.5.1 Add on the number of mincer machine 26
4.5.2 Add on the number of mixer machine 29
4.5.3 Add on the number of boiler machine 32
4.5.4 Add on the number of cooling shelf 35
4.6 Discussion 38
CHAPTER 5 CONCLUSION AND RECOMMENDATIONS
5.1 Conclusion 42

xi
5.2 Recommendations 44
REFERENCES 45
APPENDICES
A Gantt chart for Semester 1 49
B Gantt chart for Semester 2 50
C Terminology of Words in Simulation 51
D Analysis at the Industry 52

xii
LIST OF TABLES
Table No. Title Page
Table 4.1 Result from the current process layout 22
Table 4.2 Result for idle time, busy time and blocked area for the
whole process 25
Table 4.3 Comparison between Software and Actual about the
Volume produces and process time 24
Table 4.4 Number of Product Shipped 27
Table 4.5 Result for the machines state 27
Table 4.6 Comparison result when improving the layout 28
Table 4.7 Number of product shipped by double the mixer machine 30
Table 4.8 The states of machine 30
Table 4.9 Comparison result when improving the layout 31
Table 4.10 Product shipped by adding up the boiler 33
Table 4.11 States of the machines in the layout 33
Table 4.12 Comparison result when improving the layout 34
Table 4.13 Number of Keropok Shipped 36
Table 4.14 States of machines in layout 36
Table 4.15 Comparison result when improving the layout 37

xiii
LIST OF FIGURES
Figure No. Title Page
1.1 The process in the Keropok Ikan Factory 2
2.1 The Outlines for SLP Procedure 10
3.1 Flow chart about full Project Planning 14
4.1 Types of Keropok that have in the industry 18
4.2 The current Floor Layout 19
4.4 The current Layout (real situation) for Full Process using
WITNESS Software 21
4.5 The Simulation for Combination of Two Work Station 25
4.6 The Simulation for two numbers of Mincer Machine 26
4.7 The Simulation with two number of Mixer Machine 29
4.8 Increasing the number of Boiler Machine 32
4.9 Add on the number of Cooling Shelf 35
4.10 Comparison value between current layout with new layouts 40

CHAPTER 1
INTRODUCTION
1.1 INTRODUCTION
This chapter provides information about background of study, problem
statement, objectives, scopes of work and benefits of the project. Besides that,
this chapter also include about the outline of the project.
1.2 BACKGROUND OF STUDY
Small and Medium Industries (SMI’s) now are playing significant
contribution in the economics of development, social uplifting and political
stability of Malaysia. SMI’s now can be established for any kind of business
activities either in urban or rural area. It also can be considered as the back bone
of national economy nowadays. Due to significant contribution of SMI’s
towards the development of the economy, various agencies now have given a lot
of importance on the development of SMI’s. There are lots of activities and
facilities were being provided to strengthen and enhance their performance and
competitiveness. To strengthen and enhance the SMI’s industry, the productivity
of the industry must be the most important thing to always being observed.

2
The productivity for SMI’s industry depends on how much the
production they can be produced either based on day or every week even for
every month. Basically, for SMI’s industry, their production is not fixed day by
day. It depends on the workers, and also depends on their customer demand. In
addition, productivity also measures the relationship between outputs such as
goods and services provided, and inputs that include the labor, capital, material,
and other resources. The two more specific types of productivity measured are
the labor productivity measuring outputs in terms of hours worked or paid for
and the total factor productivity was including the cost of equipment, energy,
material and the cost of the labor.
Figure 1.1: Figure shows some of The Process in the fish crackers
Factory.
The project that has been used in this study is about the productivity
improvement for SMI’s in keropok ikan production. Fish crackers are one of the
popular and highly relished fish products in Malaysia especially for east coast

3
area of peninsular Malaysia like in Pahang, Terengganu and Kelantan. It is the
specialty most from Terengganu, and omnipresent in the streets and villages and
very much a part of the live of the people there. Fish crackers demands have
been increasing day by day nowadays and it is widely sold in the local market
and usually produced on a daily basis to fulfill the market demand, especially for
school canteens, night markets and hawker stalls. At present, most of Fish
crackers manufacturers carry out the processing manually, following established
procedures with little mechanization.
Nowadays, SMI’s products have been spread widely and become popular
rather than well-known imported product. Fast foods like nugget, burger,
frankfurter, and fish ball are imported or very hard to find in the market but
currently can be easily found. The development of SMI’s also was influenced
many local foods such as Fish crackers, otak-otak, and many confectionary
products to be commercialized. Therefore, SMI’s entrepreneurs need a better
machine to increase their productivity in order to fulfill market requirement.
Unfortunately, special machine to automate the process in SMI still not widely
used. .
In this study, two main aims are to identify current production time for
processing fish crackers and the simulation study of the process automation for
the keropok production.
1.3 PROBLEM STATEMENT
Fish crackers, is a popular snack based on fish, is usually molded from
kneaded fish meat and dough. Usually, fish crackers is processed traditionally
with application certain mechanical equipment such as mixer and mincer.
Meanwhile degutting and deboning of the fresh fish is done manually, the job to

4
roll the kneaded fish meat is also done manually. Boiling the water for boil the
fish crackers also being done manually and it takes more times to be waited.
Other than that, fish crackers itself should be cool down the temperature after
being boiled also is done manually. The cutting process to smaller size also done
semi-manual since no proper machine available in the market.
The high requirements of fish crackers in the market urge entrepreneurs
to increase their production but they facing a lot of problem to fulfill market
requirement. The entrepreneurs faced a problem to increase production volume
because a lot of process in producing fish crackers has been done manually. In
manual process and current practice, mass production for fish crackers is not
suitable. Material characteristics of fish crackers which is sticky, glutinous, and
gummy have influenced to the time taken to cool down the temperature, cut and
pack the fish crackers itself. If the entrepreneurs want to increase their
production, major of the process should be done in automated way.
Besides, the use of automated equipment compensates for the labor cost
disadvantage relative to competitors. More, automations can decreases
production cycle times, and increases product quality and consistency. This
statement was firmly proved that if the fish crackers entrepreneurs want to
increase their product volume, this is the best way to have.
Nowadays, proper study to improve production layout and introduction
of good machines that capable to improve fish crackers production still not
widely implemented in SMI industry. Thus, fish crackers simulation study
should be conducted to assist entrepreneurs to increase their production and
improve their manual process to automated process. As a consequence, their
volume production will increase and the product itself can be commercialized
and exported to worldwide.

5
1.4 OBJECTIVE
The objectives of this study are:
i. To identify process problems in fish crackers processing.
ii. To simulate current practice in fish crackers processing.
iii. To analyses and propose better process layout for fish crackers
processing
1.5 SCOPES OF WORK
In order to meet the objectives listed, the scopes of this project have been
defined. There are:
i. Data collection to determine current processing time for one type of fish
crackers.
ii. Conduct simulation analysis on the proposed of process layout using
WITNESS Software.
iii. Identify suitable production layout can be implemented in industry.
The study is involved in development of automated the process in the
industry that will be used to production of fish crackers into specific size and
uniform shape required by the customer. The entire layout process consists of
three mechanisms which are for three types of keropok which is rectangle
keropok, big long keropok and small long keropok. All the mechanisms
probably are automated, because that is one of the objectives of this study. Upon
a completion of this study, feeding mechanism will be implementing using the
conveyor while the layout mechanism will be done using witness software
system.

6
1.6 BENEFITS OF THE PROJECT
There are a few benefits of this project either directly or just influenced by this
new invention. The benefits are:
i. University as a learning center has done their responsibility in
implementing research and innovation at the specific area thus can be
applied for human to increase quality of lifestyle.
ii. Student learned a knowledge about invention of machinery especially
which is related to SMI’s. Student also gains knowledge to conduct a
project with proper procedure and write a thesis in correct format.
iii. The company can adapt and commercialized the research and innovation
has been done by university academician via memorandum of agreement
(MOA).

7
CHAPTER 2
LITERATURE REVIEW
2.1 INTRODUCTION
This chapter will explain about systematic layout planning, the design,
keropok ikan characteristics, the simulation study, and the relationship among
them that involve in the implementation of this project. Generally, this chapter
focused on a single question which tries to identify, appraise, select and
synthesize all the high quality research evidence that relevant to this project.
2.2 DESIGN
Technical design focused on the development of a product or process.
Generally, design can be divided into conceptual design and detail design, which
categorized under engineering design.

8
2.2.1 Engineering Design
Engineering design is the systematic, intelligent generation and
evaluation of specifications for artifacts whose form and function achieve stated
objectives and satisfy specified constraints (Dym and Lewit., 1991). Besides,
engineering design has been defined as the process of applying the various
techniques and scientific principles for the purpose of defining a device, a
process or a system in sufficient detail to permit realization (Norton, 1999). He
also stated that design may be simple or enormously complex, easy or difficult,
mathematical or nonmathematical which may involve a trivial problem or one of
the great importances.
Meanwhile, according to Madara & Kremer (2004), engineering design
is the application of technical knowledge with knowledge of from non-technical
disciplines and the use of design and analysis tools to synthesize a product or
system that solves a particular problem or meet a specific need. Both
academicians also agreed with the statement of The US Accreditation Board for
Engineering and Technology (ABET, 1995) which identifies engineering design
as the process of deriving a system, component, or process to meet desired need.
It is a decision making process (often iterative), in which the basic sciences,
mathematics, and engineering sciences are applied to convert resources
optimally to meet a stated objective. Among the fundamental elements of design
process are the establishment of the objectives and criteria, synthesis and
analysis, construction, testing and evaluation.
Further, engineering design is entailed to include a variety of constrains
such as economic factors, safety and reliability, aesthetics, ethics and social
impacts. Researches about engineering design have been conducted by many
scientists who have successfully identified and classified the design category in
very detail.

9
2.3 PRODUCTION SYSTEM
In production management system, all activities are properly planned to
accommodate process requirement and production floor layout. A well-known
solution approach for the layout problem is the Systematic Layout Planning
(SLP), which is developed in the early 1970s by Muther (Muther 1973), is by far
the most popular facility design approach in practice. A primary reason the SLP
technique has remained popular for more than 30 years is its simple step-by-step
approach to facility design (Tompkins, White et al. 2003).
It consists of four phases: determining the location of the area where
facilities will be laid out, establishing general overall layout, establishing
detailed layout plans, and installing the selected layout. For the second and the
third phases are the most important. Establishing the general overall layout
involves determining the flow of materials between facilities, examining special
adjacency requirements, determining the space required for each facility,
balancing it with the space available, incorporating practical constraints (e.g.,
budget, safety), and generating alternative layout plans (Heragu 1997) as shown
in Figure 2.1.
10
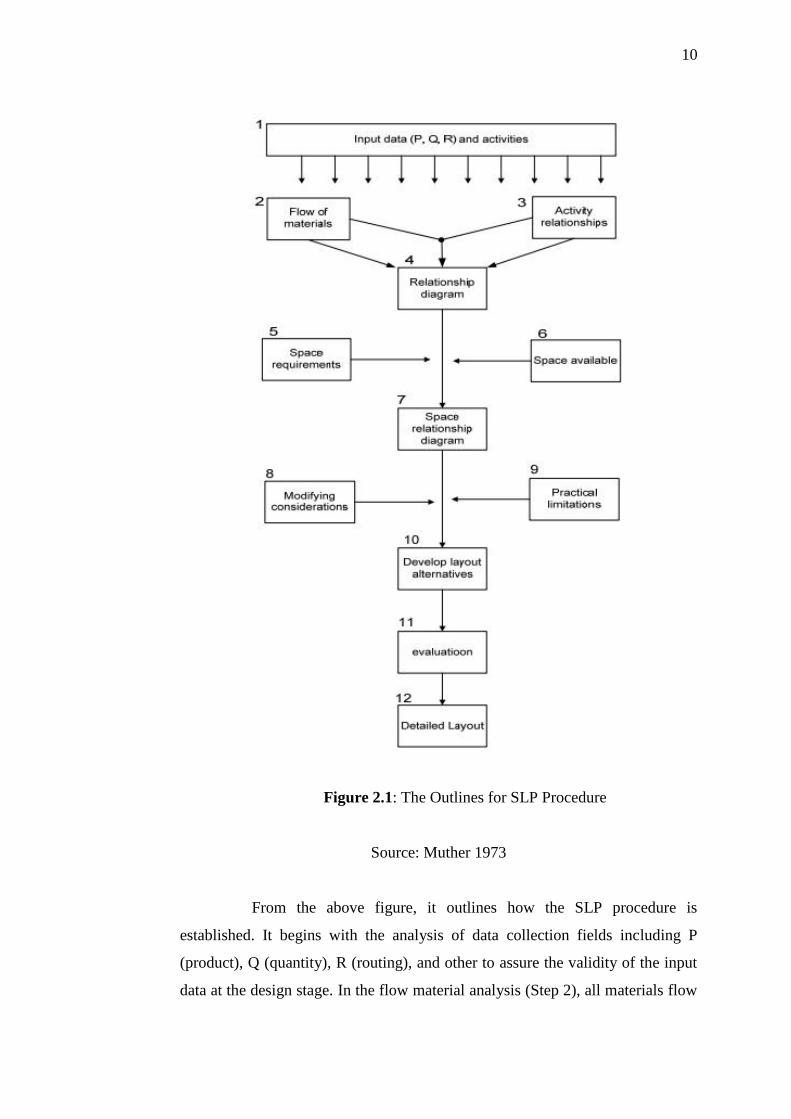
Figure 2.1: The Outlines for SLP Procedure
Source: Muther 1973
From the above figure, it outlines how the SLP procedure is
established. It begins with the analysis of data collection fields including P
(product), Q (quantity), R (routing), and other to assure the validity of the input
data at the design stage. In the flow material analysis (Step 2), all materials flow

11
from all facilities are aggregated into a from-to chart that represents the flow
intensity among departments. The step of ‘activity relationships’ (Step 3)
performs qualitative analysis towards the closeness relationship decision among
different departments. The Step 4 positions department’s space; those
departments that have strong interaction and or closes relationships are placed in
proximity. The step of ‘space requirements’ which is Steps 5 and 6 is to
determine the amount of floor space to be allocated to each department. The
‘space relationship diagram’ adds departmental size information into the
relationship diagram from step 4. Additional design constraints and limitation
are considered before the start of block layout generation in Steps 8 and 9. Step
10 then is develops the layout alternatives as design candidates. The next step is
Step 11 chooses the final design from these design candidates (Tompkins, White
et al. 2003).
Once the relative position of each department is found, Step 12 follows
with the detailed layout of the facilities. This includes locating the input or
output of the locations, providing the layout and location of specific machines
and equipments within the departments, determining the location of the docks in
the warehouses, determining the flow of materials between departments, and
others.
2.4 KEROPOK IKAN CHARACTERISTICS
Keropok ikan is an important fish product in Malaysia. The customer
demands for keropok ikan have been increasing day by day nowadays. Keropok
ikan has been known to have a short shelf life of only one day at the room
temperature by (Embong et. al., 1990). Che Rohani and Mat Arup (1992)
showed that the total viable count of bacteria in keropok ikan increased from
less than 1 x 10² cfu/g to 1.5x 10⁸ cfu/g after two days at the room temperature.
Signs of spoilage for this product include sliminess and formation of
spots on the surface, which are resulted from the bacterial growth. Thus, a good

12
understanding of the microbial profile of keropok ikan is vital. Microorganisms
gain access into processed meat, from a variety of modes including ingredients,
environment, equipment and handlers, during processing. This will definitely
affect the microbiological status of the product. Processing conditions such as
boiling of product can reduce microbial levels, although recontamination takes
place during post-processing and handling of food (Sachindra et al., 2005).
2.5 SIMULATION AND SOFTWARE
Over time, simulation tools have found use in most manufacturing
industries. Due to the increased flexibility and openness of the tools available
today, simulation can now begin to permeate all facets of the organization
beyond the industrial engineering and manufacturing specific factor (Pam Laney
Markt and Michael H. Mayer., 1997).
WITNESS software is actually is a true process about the simulation and
modeling tool. With WITNESS, the optimization of the manufacturing floor
layout, with respect to material flow, and provided by MATFLOW can be
further refined. WITNESS is used to simulate about the full production runs,
over an arbitrary time period, so that by using the WITNESS software, will
allows people to designing a facility to get a glimpse of how the production lines
might operate in reality (Pam Laney Markt and Michael H. Mayer.,1997).
13
CHAPTER 3
METHODOLOGY
3.1 INTRODUCTION
In this chapter, the research methodology used in the study is being
described. The area where the study are being conducted, the study design and
the population and sample are also being described.

14
3.2 FLOW CHART
Figure 3.1: Flow chart about full project planning
From the figure 3.1, it shows the research flow in this study. Therefore,
all acticvities that was conducted based on the flow chart. For the first step of
the study, the problem statement needs to be stated for the case of this project, so
that the problem in the current process can be known. After studying the
problem that have in the current process, the site visit have been done to know
more on the layout of the actual process and at the same time the study on the

15
literature review also been done. The next step is sketching the layout of actual
process in the industry and where the workstation have problems been
investigated. It was been continue with sketching the layout in the WITNESS
Software and been compared with the actual layout. The studies being continued
with the some of the case study that can being improved the production time and
volume become well increase for the whole process and types of keropok’s.
Lastly, all the result that been produced need to be analyses and discusses and
the study is more focused on the increasing of the production volume and
production time for whole processes.
3.3 IDENTIFY THE PROBLEM
In the week first, the topic for the final year project have been given to
student and the problem statement that relate to the topic need to be review. In
identify the problem, site visiting have been done to seen face to face what is the
problem that being faces by the SMI’s factory. Other than that, the site visit also
can make my work become easier to finding the problems that they have been
facing which can affect the factory production volume.
Site visiting to the factory has been done about two times for at this time
to know deeper the problem that the factory facing. From this site visit, the
better arrangement layout that suitable with the factory also can be seen.
16
3.4 PRODUCTION LAYOUT PROPOSAL
After have been done with the site visiting, the layout that can be done in
the factory need to be draft and need to be check with supervisor about the
layout. For the layout, WITNESS software will be used to sketch the layout for
the factory.
The manual sketching of the working layout need to be sketch based on
the data got during the site visit. All the machines and equipment that they have
in the factory must be placed exactly with the real arrangement in the factory.
3.5 SIMULATION STUDY
After done with the sketching the real layout based on the real situation,
the new sketching layout must be done to compare with the old one. All the
production time, production volume and others that can affect the production
volume must be consider.
After that, the sketching of the layout can be do using the WITNESS
software and can be run to see the result for all types of layout. The simulation
for both, old and new layout need to be discuss and study.