Embed Size (px)
Citation preview

BIS ECONOMICS PAPER NO. 12
Productivity and the Economic Cycle
MARCH 2011


BIS ECONOMICS PAPER NO. 12
Productivity and the Economic Cycle
DR SUMON BHAUMIK ASTON BUSINESS SCHOOL, ASTON UNIVERSITY
MARCH 2011
The views expressed within this paper are those of the author and should not be treated as Government policy


Productivity and the Economic Cycle
Contents List of Tables and Figures......................................................................................................... iv
Acknowledgments...................................................................................................................... vi
Foreword.................................................................................................................................... vii
Executive Summary ................................................................................................................. viii
Part 1 – A Review of the Literature.......................................................................................... viii
Part 2 – Impact of the 2008-2009 Recession on Productivity and Recovery in the UK.............xi
Part 1 A Review of the Literature ............................................................................................... 1
1. Introduction ......................................................................................................................... 2
2. Pro-cyclicality of productivity growth ............................................................................... 5
2.1 Hypotheses for observed pro-cyclicality ........................................................................ 6
2.2 Implications of the hypotheses ...................................................................................... 7
2.3 Evidence from empirical analyses ................................................................................. 7
2.4 Evidence from micro data.............................................................................................. 8
3. Sources of productivity growth ............................................................................................. 9
3.1 Net entry explains a significant proportion of productivity growth but within-firm factors are possibly more important ...................................................................................................... 9
3.2 Explaining the relatively smaller impact of net entry: institutional rigidities and firm characteristics ......................................................................................................................... 11
4. Within-firm versus external determinants of productivity............................................. 14
4.1 Competition, managerial skill and their cyclicality........................................................ 15
4.2 Within-firm strategies and their cyclicality.................................................................... 16
4.2.1 Innovation and pro-cyclicality of R&D expenditure ..................................................... 16
4.2.2 Pro-cyclicality of business investment ........................................................................ 18
4.2.3 Likely pro-cyclicality of investment in ICT capital ....................................................... 19
i

Productivity and the Economic Cycle
4.2.4 Mixed evidence about investment in human capital ................................................... 24
5. Conclusions........................................................................................................................... 26
References ................................................................................................................................. 28
Part 2 Impact of the 2008-2009 Recession on Productivity and Recovery in the UK ......... 33
1. Introduction ....................................................................................................................... 34
2. Determinants of productivity............................................................................................ 36
3. Enterprise........................................................................................................................... 40
3.1 Policy discussion within the UK ................................................................................... 40
3.2 Entrepreneurial activity during recession and recovery ............................................... 43
3.3 Outlook for enterprise .................................................................................................. 47
4. Infrastructure ..................................................................................................................... 49
4.1 Policy discussions within the UK ................................................................................. 50
4.2 Infrastructure development during recession and recovery......................................... 55
4.3 Looking ahead ............................................................................................................. 56
5. Competition ....................................................................................................................... 59
5.1 Policy discussions within the UK ................................................................................. 60
5.2 Competition during recession and recovery ................................................................ 63
6. Skills ................................................................................................................................... 66
6.1 Policy discussion within the UK ................................................................................... 66
6.2 Skill development through recession and recovery ..................................................... 70
6.3 Outlook for skills .......................................................................................................... 73
7. Business Investment ........................................................................................................ 75
7.1 Business investment during recession and recovery................................................... 76
7.2 Outlook for Business Investment ................................................................................. 77
ii

Productivity and the Economic Cycle
8. Innovation .......................................................................................................................... 78
8.1 Policy discussion in the UK ......................................................................................... 79
8.2 Innovation during Recession and Recovery ................................................................ 83
8.3 Outlook for innovation.................................................................................................. 85
9. Outlook for productivity growth in recovery .................................................................. 87
References ................................................................................................................................. 89
BIS Economics Papers ............................................................................................................. 98
iii

Productivity and the Economic Cycle
List of Tables and Figures Tables
Table 1: Decomposition of TFP growth for US manufacturing industries ...................... 10
Table 2: Decomposition of labour productivity for US and UK manufacturing industries (per cent) ....................................................................................................................... 11
Table 3: Contribution of ICT, Non-ICT and dwellings to capital deepening .................. 20
Table 4: Impact of ICT capital on labour productivity.................................................... 22
Table 5: Percentage of UK nascent entrepreneurs who sought and were refused finance, by type of funding refused................................................................................ 44
Table 6: OECD progress report on infrastructure development..................................... 54
Table 7: High priority skills............................................................................................. 69
Table 8: Business priorities for educational institutions ................................................. 70
Table 9: Impact of economic climate on business plans for skills investment (%) ......... 72
Table 10: Innovation in the UK 2002-2004 (%).............................................................. 80
Figures
Figure 1: Cyclicality of labour productivity and TFP in the UK ......................................... 5
Figure 2: Cyclicality of labour productivity and TFP in the USA....................................... 6
Figure 3: Models of firm-level technical progress .......................................................... 15
Figure 4: Growth of GDP and Business Investment ...................................................... 19
Figure 5: ICT investment growth and GDP growth in the US........................................ 23
Figure 6: Determinants of productivity ........................................................................... 38
Figure 7: Early-stage entrepreneurial activity (as % of working age population) ........... 41
Figure 8: Experts’ view on entrepreneurial conditions in UK and USA .......................... 42
iv

Productivity and the Economic Cycle
v
Figure 9: Credit availability of SMEs (change over previous month) ............................. 45
Figure 10: New business banking relationships............................................................. 46
Figure 11: Insolvencies.................................................................................................. 47
Figure 12: Infrastructure quality in the UK relative to large G7 economies.................... 51
Figure 13: Annual average of public investment/GDP in EU-15 countries (1997-2008) 52
Figure 14: Cost to business of transport infrastructure problems .................................. 53
Figure 15: Problems experienced as a result of poor infrastructure: Transport vs. digital communications............................................................................................................. 57
Figure 16: Competition regime performance index........................................................ 61
Figure 17: Goods market efficiency ............................................................................... 61
Figure 18: Labour market efficiency .............................................................................. 62
Figure 19: Bank rate, money market rates and mortgage rate ...................................... 64
Figure 20: Mergers and acquisitions in the UK.............................................................. 65
Figure 21: Profile of skill-shortage vacancies across sectors ........................................ 68
Figure 22: Trends in education ...................................................................................... 71
Figure 23: Apprenticeships starts and achieved ............................................................ 73
Figure 24: Business investment during past and most recent recessions and recoveries...................................................................................................................................... 76
Figure 25: Quarterly net lending flows (by UK MFIs) ..................................................... 77
Figure 26: Innovation across sectors............................................................................. 81
Figure 27: Business enterprise R&D across regions ..................................................... 82
Figure 28: Trends in R&D and intangible investments................................................... 84
Figure 29: Innovation during the recession.................................................................... 85

Productivity and the Economic Cycle
Acknowledgments The author is grateful to the Economic and Social Research Council (ESRC) for financial support. He is also grateful to economists at the UK Department of Business Innovation and Skills (BIS) and the Organisation for Economic Cooperation and Development (OECD) for their support. He thanks, in particular, Paul Crawford, Agnès Estibals, Stephanie Dales and Sarika Gupta for their feedback, and Dominic Scott for his help with the manuscript. He also thanks Jonathan Haskel for helpful discussions about certain issues.
vi

Productivity and the Economic Cycle
vii
Foreword Productivity is fundamental to sustainable economic growth and the prosperity of UK citizens. However, the measurement of productivity, and the interpretation of statistics relating to productivity, is necessarily imperfect. It is particularlychallenging in the context of an economic downturn andsubsequent recovery. Therefore, understanding the dynamics of productivity in the economic cycle is instrumental if we are to draw the right policy conclusions for the future.
In this context, it is instructive to return to the academic literature on the cyclical nature of productivity, to ensurelessons from studies of the UK and internationally arelearned, and to consider the likely prospects for UK
productivity at this and further stages of the economic cycle.
The Department is grateful to Dr Sumon Bhaumik for preparing this paper. This first part of the paper reviews the evidence on the determinants of productivity at the aggregate and micro level, considers the cyclicality of productivity, and identifies drivers of such cyclicality. The second part builds on this evidence to consider for the UK the impact of the 2008-2009 recession on productivity and the prospects for recovery, focusing on key factors: enterprise, infrastructure, competition, skills, business investment, and innovation.
In publishing the paper the Government is both demonstrating its continued commitment to ensuring that policy making is informed by strong evidence and analysis and highlighting its commitment to delivery of sustainable growth that is underpinned by continuous productivity gains. The Department welcomes the paper and hopes it will stimulate debate on the cyclical nature of productivity.
Tera Allas
Director General, Economics, Strategy and Better Regulation, Department for Business, Innovation & Skills and Joint Head, Government Economic Service

Productivity and the Economic Cycle
Executive Summary The first part of this paper reviews the literature on the cyclical nature of productivity, while the second considers the impact of the recent recession on productivity and considers the outlook for recovery. Accordingly, the executive summary, below, is presented in two parts.
Part 1 – A Review of the Literature
Productivity is a key determinant of output growth. While estimates vary, it has been argued that variance in the growth of total factor productivity (TFP) can account for as much as two-thirds of cross-country variance in GDP growth. It is therefore important to understand the sources of productivity growth at the aggregate and firm (or micro) levels.
It is also important to understand the behaviour of productivity over economic cycles. Economic downturns, when the opportunity cost of resources is low, provide opportunities for firms to implement changes that could raise the trend level of productivity in the long run. Downturns also coincide with Schumpeterian “creative destruction” that can improve average productivity.
In this section of the paper, we discuss the literature on three related issues:
the evidence about the cyclicality of productivity at the aggregate level, and explanations of this cyclicality;
the evidence about the sources of productivity growth at the aggregate level; and
the micro evidence about the determinants of firm-level productivity, and the cyclicality of these determinants
The evidence about the cyclicality of productivity at the aggregate level suggests that productivity is pro-cyclical. The macro literature discusses three plausible explanations of this cyclicality. First, it is argued that GDP growth and productivity growth move together because they are both driven by technology shocks. The second hypothesis suggests that the observed pro-cyclicality is an outcome of a measurement error. If unobserved employee effort rather than employee numbers is adjusted over a business cycle, with employees putting in less effort during downturns and more effort during upturns, measures of productivity that do not control for the time-varying effort would necessarily be pro-cyclical. Finally, it is suggested that the production process is subject to economies of scale such that productivity would rise during upturns and decline during downturns.
The first of these explanations is heavily discounted. It has been observed, for example, that productivity was pro-cyclical even during the interwar period during which major technology shocks were unlikely. Empirical analyses suggest that the explanation involving the differences in effort levels over a business cycle is more
viii

Productivity and the Economic Cycle
plausible of the other two, even though there is some evidence of economies of scale as well.
The micro or firm- (or plant) level literature on pro-cyclicality of productivity is very limited. Baily et al1use plant level data from the United States to examine the three aforementioned hypotheses, as well as the possibility that the reduction in aggregate productivity during downturns can be attributed to a “productivity penalty” that is paid by permanently downsizing firms (firms that downsize during recession, and do not expand in the upturn). They conclude that the pro-cyclicality of productivity is much more likely to be an outcome of this productivity penalty than of the other reasons including variation of effort over a business cycle. Productivity of plants that grow in the long run is not strongly cyclical, and hence these plants play a limited role in driving the cyclicality of productivity. The literature on the (limited) plant level evidence and the industry level evidence are, therefore, at odds with each other: one explanation emphasises labour hoarding as a driver of pro-cyclicality while the other emphasises permanently downsizing firms.
In order to identify the sources of productivity growth at the aggregate level, a number of studies have decomposed productivity growth over time into its components, namely, the impact of within firm changes, the impact of reallocation of resources among firms, and the impact of net entry that is associated with creative destruction. The evidence is somewhat mixed, with some studies attributing as much as 50 percent of productivity growth to net entry while others attributing half as much. However, two important conclusions can be drawn from the range of studies: (a) both net entry and within firm strategies account for a significant proportion of productivity growth, (b) the relative importance of net entry is greater during downturns while that of within firm changes is greater during upturns. In other words, development of institutional structures that facilitate exit of firms with low productivity is an important component of the portfolio of policies aimed at increasing productivity growth, but it is equally important to focus on policies that facilitate appropriate within firm changes.
Finally, empirical studies have identified determinants of firm-level productivity. One strand of the literature focuses on high level determinants of firm level productivity such as competitive pressures on firms and the incentive of their managers to adopt productivity-augmenting practices. This strand of the literature suggests the following:
Competitive pressures can induce firms to take actions that lead to productivity growth. However, recent evidence suggests that a firm experiencing competition would adopt productivity-augmenting measures only if it is already close to the productivity frontier, such that it is relatively easy for it to affect the changes that are necessary to raise its productivity levels vis-à-vis its competitors.
1 Baily, Bartelsman and Haltiwnager 2001
ix

Productivity and the Economic Cycle
There is some evidence to suggest that firms are likely to adopt strategies that increase productivity (and improve other measures of firm performance) if there is alignment of interests between managers and shareholders, and if the managers are subjected to effective monitoring from creditors and other stakeholders. But overall the implications of ownership structures for managerial ability and productivity growth are ill defined.
A second strand of the literature focuses on the impact of specific firm characteristics and actions such as investment in innovation and human capital of the employees on firm level productivity. This strand of the literature suggests that:
o Innovation is an important determinant of firm-level productivity (and its growth). Even though innovation potentially includes a wide range of activities, in the academic literature it is generally synonymous with research and development (R&D).
o Business investment too is a determinant of productivity growth. New capital embodies technical progress, and evidence suggests that productivity growth is much more likely to be driven by use of new technology than by creation of new technology.
o Finally, productivity growth at the firm level is significantly correlated with the human capital of the employees.
The literature on determinants of firm level productivity itself does not discuss the cyclicality of these determinants. For some of these determinants, such as competition and ownership structure, there is no separate (and conclusive) evidence about changes over economic cycles. Nor does economic theory have any obvious implications for the cyclicality of competitive pressures and managerial ability. However, there is empirical evidence about the cyclicality of the other determinants discussed above:
R&D expenditure is generally pro-cyclical. However, the less tangible and hence difficult to measure aspects of innovation might be pro-cyclical.
Business investment is pro-cyclical in OECD countries, and there is evidence to suggest that this is on account of pro-cyclicality of available credit and internal resources. While there is little specific evidence about the cyclicality of investment in ICT capital, which may have contributed to as much as three-quarters of the growth in labour productivity during the 1995-2002 period, it is reasonable to infer that this type of business investment would also be pro-cyclical.
The evidence about the cyclicality of investment in human capital is somewhat mixed. Enrolment in schools and universities is countercyclical in developed countries. On the other hand, recruitment of trainees and apprentices is generally pro-cyclical. Finally, there is mixed evidence about the cyclicality of investment in employee training.
x

Productivity and the Economic Cycle
Part 2 – Impact of the 2008-2009 Recession on Productivity and Recovery in the UK
Policy discussions about determinants of productivity often revolve around factors that are functionally separable. Some of these factors such as investment are inherently cyclical in nature, while others such as infrastructure and competition are structural factors that have a long run relationship with productivity and its growth. An examination of the functional factors that affect productivity and its growth in the UK suggest the following:
The level of enterprise in the UK is comparable to those in other G7 countries, and is largely opportunity driven, but it is significantly lower than that in the USA. Key structural factors that adversely affect the enterprise level in the UK, especially as compared with the USA, are cultural inhibitions about starting a business, and low levels of innovation and low growth ambitions subsequent to starting a business. Entrepreneurial activity is also affected by cyclical factors, namely, the recent financial crisis and recession. The 2009 Global Enterprise Monitor survey documented a steep increase in the proportion of entrepreneurs who sought and were refused finance by banks and other sources. However, the difficulty in accessing financial resources notwithstanding, product market entry was not significantly affected in 2009, during the height of the recession. In the long run, the key to improving the enterprise level in the UK may lie less in cyclical factors and more in the government’s ability to address the aforementioned structural problems.
The UK lags behind comparable industrialised economies such as France,
Germany, Japan and the USA with respect to the quality of its physical infrastructure. The genesis of this weakness can perhaps be traced back to the relatively low levels of investment in physical. Business organisations such as the Confederation of British Industries have noted the adverse impact of lacking quality and reliability of infrastructural facilities, notably in the transport sector, on the productivity of UK businesses. Since the publication of the Eddington Study of 2006, the government has addressed some of the structural problems associated with infrastructural development in the UK. However, while progress has been made, a 2009 review published by the OECD makes a persuasive case for further action. In light of the Spending Review of 2010, it is reasonable to assume that in the foreseeable future the government will have to play a limited role in infrastructure development. Indeed the National Infrastructure Report 2010 suggests that, in the future, the private sector would have to play a significant role in developing infrastructure in the UK, with the government intervening selectively.
A 2007 survey undertaken by KPMG suggests that the UK’s competition regime compares favourably with those of the USA and the EU countries. It has narrowed the gap with the German and American regimes, and consistently performs better than the EU average. In part, the narrowing of the gap vis-a-vis the USA can be attributed to an improvement in the capability of the UK’s regulators to rigorously analyse available information. This view is
xi

Productivity and the Economic Cycle
also reflected in the indices of product and labour market efficiencies published in various issues of the Global Competitiveness Report published by the World Economic Forum.
The Leitch Review of 2006 argue that UK has historically had a skills gap vis-a-vis other OECD countries, and this gap has not been bridged despite the significant improvement in the skills level in the UK between the early nineties and the middle of the last decade. Available evidence suggests that there are two problems in particular, namely, a mismatch between the skills of the workers and the skills required for their jobs, and heterogeneity about perceived benefits from skills acquisition. The skills gap is also reflected in the greater perceived difficulty of British businesses to recruit workers with appropriate skills, as reflected in a recent survey undertaken by the British Chamber of Commerce, and their consequent reliance on training. The 2008-09 recession and its aftermath has witnessed a sharp increase in the demand for university places. Government action may have also prevented a shift away from the upward trend in the number of apprenticeships. But there was a modest negative impact on training. In the long run, the challenge for UK’s policy makers is to foster higher levels of skills that are essential for emergence as a leading knowledge-based economy, as well as progression of a significant proportion of the population beyond the first university degree.
Not surprisingly, especially given that the 2008-09 recession was precipitated by a financial crisis, aggregate business investment decreased sharply from the end of 2008, and the rate of decline of business investment was far more rapid during this recession than during the recessions of the eighties and the nineties. This is consistent with data that suggest that net disbursal of credit to major sectors of the UK economy, such as manufacturing, real estate, construction and wholesale and retail trade, has been persistently negative since Q2 of 2009. Academic research suggests that recovery in flow of credit to UK businesses, and the corresponding increase in business investment, may take time. In part, this would be on account of heightened wariness among banks about borrower quality and the likelihood of adverse selection, and in part on account of continuing wariness among businesses about investment in new and existing projects.
Innovation has traditionally been measured using R&D expenditures. However, evidence suggests that conventional R&D is undertaken by a minority of firms. Incidence of R&D is particularly low among small and medium enterprises. As a consequence, it is important to take into consideration wider innovation that includes, for example, improvement in product design and organisational restructuring. Evidence suggests that in the UK incidence of both product and process innovation and wider innovation are lower than in Germany, one of the countries that continues to maintain a productivity gap vis-a-vis the UK. There is also considerable regional heterogeneity in the incidence and depth of innovative activities within the UK. Emerging evidence suggests that there is scope for optimism about the extent of innovation in the UK during the recession. Longer term challenges for policy
xii

Productivity and the Economic Cycle
xiii
makers lie in structural issues such as greater cooperation between creators of knowledge such as universities and users of knowledge such as businesses, and development of infrastructure such as high speed broadband and a property rights system that facilitate such cooperation.
The most important conceptual challenge for policy makers is to understand that these factors are inter-related, and indeed are part of a system. An important implication of this systemic view of the determinants of productivity is that, while pursuing productivity growth, it is difficult to substitute any one of these drivers with one or more of the others, i.e., they are complements.


Productivity and the Economic Cycle
1
Part 1 A Review of the Literature

Productivity and the Economic Cycle
1. Introduction Since Solow’s path breaking contribution to the discussion about economic growth, technical progress is viewed as the cornerstone of sustained growth.2 The importance of technical progress is particularly high for mature industrialised countries for which there is not much scope to grow by adding more factor inputs and by reallocating factor inputs across sectors.3 Productivity, in turn, is the widely used proxy for technical progress.
There is much disagreement about the measurement of productivity. Total factor productivity (TFP), which is conceptually closer to the concept of technical progress captured in a Solow-vian production relationship than labour productivity, is notoriously difficult to measure. The genesis of the problem lies in the difficulty in measuring factor inputs like capital and labour accurately. Consequently, labour productivity is often used as the proxy for productivity. But growth in labour productivity does not necessarily reflect technical progress,4 and hence estimation of TFP and identification of its determinants remains a major endeavour in both academic and policy circles.
Empirical evidence suggests that TFP growth accounts for a fairly large proportion of the growth among “western” industrialised countries, including the United Kingdom and the United States. While some studies suggest that TFP growth may have contributed to as much as 90 percent of growth of domestic output in the countries like the United States, analyses that use long time series data suggest that the contribution of TFP growth is a more modest yet fairly substantial 25 percent.5 Further, cross-country analyses suggest that variance in TFP growth accounts for more than two-thirds of the variance in output growth across countries.
The long term trend in TFP growth depends on how firms and individuals make use of the opportunity to undertake activities such as innovation and investment in human capital at times when the opportunity cost of using labour power and other resources for such endeavours is low, i.e., during periods of economic slowdown.6 This makes it imperative to better understand how productivity and, more importantly, firm-level activities and environmental factors that drive it behave over a business cycle. In particular, in order to be able to better target productivity growth with policy initiatives over a business cycle, it is important to differentiate between the factors that facilitate growth in aggregate productivity during periods of economic slowdown (or recessions) and periods of rapid economic growth.
2 Solow 1956 3 Harrod 1939, Domar 1946, Lewis 1954, Ranis and Fei 1961 4 See Box 1 for details. 5 Baier et al. 2002 6 Aghion and Saint-Paul 1998
2

Productivity and the Economic Cycle
In this paper, therefore, we examine the cyclicality of productivity, and the factors that are generally accepted as contributors to this growth. In Section 2, we discuss the evidence about, and the explanations for, the cyclicality of productivity. In Section 3, we discuss the evidence about the relative contributions of within-firm changes and market forces to productivity growth. In Section 4, we discuss the cyclicality of specific firm-level strategies like innovation and environmental factors like competition that contribute to productivity growth. In Section 5, we report the conclusions drawn from the discussion in the rest of the paper.
Box 1: Measures of productivity
In the economics literature, two measures of productivity are generally used: average labour productivity (ALP) and total factor productivity (TFP).
ALP is usually measured as gross output per worker or gross output per hour of work. On occasions, it is also measured as value added per worker or value added per hour of work. While this measure of productivity is relatively easy to estimate and interpret, it has an important shortcoming. It embodies changes in both capital inputs and technological progress. When measured as gross output per worker (or work hour), it also embodies changes in factor inputs. ALP, therefore, is a partial measure that could be misrepresented as technical progress or productivity of workers.
TFP (sometimes also called multifactor productivity or MFP) attempts to harness the impact of pure technical progress and is measured as the part of gross output or value added that cannot be explained by factor inputs such as labour and capital. Consider a production function with Hicks neutral technology
[1.1]
TFP can then be defined as pure technical progress
[1.2]
Since it is not easy to measure TFP using equation 1.2, it is customary to measure TFP growth instead. Under assumptions of constant returns to scale, equation 1.1 can be transformed into
t
tK
t
tL
t
t
t
t
K
Ks
L
Ls
A
A
Y
Y
[1.3]
3

Productivity and the Economic Cycle
Box 1: Measures of productivity
where sL and sK are the shares of labour and capital, respectively, in the output
(sL + sK = 1), and , , and are the growth rates of the relevant variables. From equation 1.3, growth in TFP can be estimated as
tY tA tL tK
t
tK
t
tL
t
t
t
t
K
Ks
L
Ls
Y
Y
A
A
[1.4]
While TFP growth is a more meaningful measure of productivity than ALP, its measurement is affected by two important factors. First, one has to control for changes in the quality of factor input across the two points in time across which the growth rate is computed. Second, one has to control for the actual level of effort of the workers, effort levels being potentially variable across business cycles. In addition, econometricians argue that factor inputs might not be exogenously given for a relatively long time period (e.g., a year) and might be adjusted in response to signals about productivity. Nevertheless, despite these challenges, equation 1.4 remains a popular (the so-called “growth accounting”) way of measuring TFP growth.
Using equation 1.3, it is easy to link the two measures of productivity. Specifically, we get
t
t
t
tK
t
t
t
t
t
t
L
L
K
Ks
A
A
L
L
Y
Y
[1.5]
In other words, growth in labour productivity is explained in part by growth in TFP and in part by capital deepening, i.e., an increase in the amount of capital per worker.
4

Productivity and the Economic Cycle
2. Pro-cyclicality of productivity growth
Productivity is pro-cyclical. This is essentially an outcome of labour hoarding, as employees reduce or increase their effort as the demand for output falls or increases, combined with economies of scale that arise during periods of economic boom.
Macroeconomists agree that productivity is pro-cyclical (with the notable exception of 2006-2008 in the United States).7 This is evident from Figure 1 and Figure 2 in which growth rates for ALP and TFP are plotted against GDP growth rates in the United Kingdom and the United States, respectively.
Figure 1: Cyclicality of labour productivity and TFP in the UK
Source: OECD Stat Extracts
7 Gordon (2004) notes that productivity in the United States rose sharply at the turn of the century, even as the economy slowed down on account of a number of negative shocks. He attributes this to a lagged (or continuing) impact of the surge in ICT investment in the USA in the nineties.
5

Productivity and the Economic Cycle
Figure 2: Cyclicality of labour productivity and TFP in the USA
Source: OECD Stat Extracts
2.1 Hypotheses for observed pro-cyclicality
Hypothesis 1: Dependence of both productivity and GDP growth on exogenous productivity shock
Proponents of real business cycle (RBC) theory have argued that this pro-cyclicality of productivity results from the fact both GDP growth and productivity growth have their genesis in the same thing, namely, exogenous technology shocks. Despite some support,8 this view is generally discounted. It has been demonstrated, for example, that productivity growth was pro-cyclical even during the interwar period even though significant technology shocks were unlikely during the Depression era.9
Hypothesis 2: Labour hoarding
A more commonly held view is that the pro-cyclicality is an outcome of labour hoarding.10 Firms do not downsize as rapidly as the decline in their output (or output growth) during periods of economic slowdown. Employees merely reduce their effort as the demand for output falls. This results in both lower ALP and TFP during such periods. As the economy expands rapidly once more, in a period of economic boom, the employees increase their effort to meet greater output demand, and ALP and TFP rise once again.
8 Basu 1996 9 Bernanke and Parkinson 1991 10 Solow 1964, Rosen 1968
6

Productivity and the Economic Cycle
Hypothesis 3: Economies of scale in production
Another view is that there are economies of scale in production.11 They could be intrinsic to firms, but they could also arise on account of spill-over effects of aggregate industry- or economy-wide output.12 These economies are realised during periods of economic boom, when output expands rapidly, and hence productivity rises during years of economic boom and declines during years of economic slowdown.
2.2 Implications of the hypotheses
To recapitulate, the methodological basis for all empirical analyses of productivity and productivity growth is the neoclassical production function which posits that output is a function of factor inputs – labour and capital – and technical progress.
The implication of the labour hoarding view is that we measure labour incorrectly. While we observe the number of employees and the number of work hours, we do not observe the effort of the employees which change according to the phase of the business cycle. According to this view, therefore, the standard neoclassical production function is mis-specified. A correct specification of a production function should include some measure or (or proxy for) effort which varies over a business cycle.
The implication of the economies of scale view is that the production function is correctly specified if these economies are intrinsic to a firm. But the estimated impact of factor inputs would be higher for aggregated data – say, for the entire manufacturing sector – than for disaggregated data – say, for individual industries. If, however, the source of the economies of scale is external to a firm, then the specification for a production function should also include some measure of aggregate output.
2.3 Evidence from empirical analyses
Scholars who have extended their specification for the neoclassical production function to include proxies of effort have generally found that the impact of proxies of work effort – which varies over a business cycle – on output is statistically significant.13 Examples of proxies include ratio of non-production worker to total production14 and accident rates15. They have interpreted these results as evidence favouring the labour hoarding view.
11 Hall 1988, 1991 12 Murphy, Shleifer and Vishny 1989 13 Rotemberg and Summers 1990, Bernanke and Parkinson 1991, Caballero and Lyons 1992, Sbordone 1997 14 Rotemberg and Summers argue that employment of non-production workers vary much less than that of production workers, and hence there is greater labour hoarding in industries with a higher proportion of non-production workers.
7

Productivity and the Economic Cycle
However, the economies of scale view cannot be ruled out altogether. To begin with, empirical results suggest that variations in factor inputs and proxies of work effort do not explain all of the variation in output. Hence, factors other than labour hoarding may be at work. Further, some scholars have found that estimates of returns to scale are indeed much higher for aggregate manufacturing sector than for 2-digit industries.16
2.4 Evidence from micro data
Almost all empirical analyses of the pro-cyclicality of productivity and productivity growth involve the use of industry level data. However, from a policymaking perspective it is important to examine behaviour of individual firms because policies are generally formulated to target firm behaviour.
In a notable exception, Baily et al.17 find that there is a considerable difference in the cyclicality of productivity of firms that permanently downsize during economic downturns and those that experience growth in the longer run. Firms that downsize permanently experience a “productivity penalty” which is possibly an outcome of suboptimal combination of factor inputs during a period of rapid downsizing. By contrast, the productivity of firms that experience growth in the longer run does not exhibit much pro-cyclicality. Pro-cyclicality of overall productivity, therefore, is driven by the productivity penalty of permanently downsizing firms.
While the Baily et al. explanation is not implausible, the intuition for the penalty is not completely clear. Moreover, in the absence of more firm-level evidence, it is not clear as to whether this experience in the United States in the eighties is replicated over time and across countries. However, the incongruence of the view that the pro-cyclicality is driven by labour hoarding with the view that it is driven by permanently downsizing firms suggests that there is need for further examination of this phenomenon using micro or firm-level data.
15 Caballero and Lyons argue that accident rates are higher when workers put in greater effort. 16 Caballero and Lyons 1992 17 Baily, Bartelsman and Haltiwnager 2001
8

Productivity and the Economic Cycle
3. Sources of productivity growth Changes both in the composition of firms within industries (net entry)
and within firms as they restructure, invest in new capital, technology and human resources have an impact on aggregate productivity.
In the USA net entry plays a more important role in productivity growth,
especially during periods of economic recovery, whereas in the UK within firm changes have a much greater impact.
Economists generally distinguish between two sets of factors that have an impact on aggregate productivity. First, there might be a change in firm level productivity, as firms restructure, invest in new capital and technology, and adopt human resources policies that increase the average human capital endowment of their work force. Second, there might be a change in the composition of firms within industries, e.g., as firms with low productivity exit.
3.1 Net entry explains a significant proportion of productivity growth but within-firm factors are possibly more important
The literature uses algorithms developed by a number of scholars to decompose productivity growth into several components.18 The commonly used algorithm proposed by Foster et al. decomposes aggregate productivity growth into the following components: (a) growth that is accounted for by restructuring within continuing firms or plants (“within plant” component), (b) growth that is accounted for by reallocation of resources among continuing firms or plant (“between plant” component) , (c) growth that is accounted for by entry of new firms (which may or may not be more productive than incumbent firms), and (d) growth that is accounted for by exit of existing firms (which presumably have lower levels of productivity than incumbent firms). Often, the impact of entry and exit are combined in the form of the “net entry” component of productivity growth.19
We are particularly interested in the relative importance of the contribution of within-firm changes and net entry for productivity growth.
Evidence from the United States, obtained from plant-level data, for the 1977-1987 periods, is reported in Table 1. Of these, 1977-1982 was a period of economic slowdown, while 1982-1987 was a period of rapid economic growth. Consistent with
18 Griliches and Regev 1995, Olley and Pakes 1996, Foster, Haltiwanger and Krizan 1998 19 In addition, there is a “cross” component of productivity growth, which captures the covariance effect that is positive when there an increase in the market share of firms that experience growth in productivity.
9

Productivity and the Economic Cycle
the evidence about the pro-cyclicality of productivity, TFP growth was 2.7 percent during the former period, and 7.32 percent during the latter period.
Table 1: Decomposition of TFP growth for US manufacturing industries
Decomposition of TFP growth
Total growth
Within-plant share (%)
Between-plant share (%)
Cross-plant share (%)
Net entry share (%)
1977 - 82 2.7 -9 -33 116 251982 - 87 7.32 52 -18 51 14
Source: Bartelsman and Doms (2001): Table 1 (pp. 584)
The results reported in the table suggests that during the 1977-1982 period, within-plant changes were such that productivity growth was reduced by 9 percent on their account.20 However, net entry during that period accounted for 25 percent of the growth of TFP. During the 1982-1987 period, by contrast, within-plant changes accounted for 52 percent of the growth in TFP, while net entry accounted for 14 percent of this growth.
This suggests two things: First, it suggests that net entry is a bigger determinant of aggregate productivity growth during periods of economic slowdown. This is consistent with the Schumpeterian view that periods of economic slowdown have a “cleansing effect” on aggregate productivity by way of firm exit.21 Second, it suggests that during periods of rapid economic growth the within-firm factors play a much bigger role in boosting productivity (and productivity growth) than net entry.
More recent evidence from the United Kingdom and the United States, albeit about labour productivity, are reported in Table 2. Of the two time periods, 1987-1992 was a period of economic slowdown, while 1992-1997 was a period of economic recovery and accelerating economic growth.
20 The sum of the contributions of the various components of productivity growth should add up to 100 percent. For example, for 1977-1982, -9, -33, 116 and 25 add up to 99. The mild discrepancy is on account of rounding off errors. 21 Campbell 1998
10

Productivity and the Economic Cycle
Table 2: Decomposition of labour productivity for US and UK manufacturing industries (per cent)
Decomposition of labour productivity growth
Total growth (%)
Within (%) Between (%)
Cross (%) Net entry (%)
United Kingdom
1987–92 2.7 63 22 -11 261992-97 3.3 83 0 -11 28
United States 1987–92 1.8 90 26 -36 211992-97 3.1 97 7 -21 17
Source: Barnes, Haskel and Maliranta (2002)
The evidence suggests that, in the United States, net entry did indeed play a more important role in determining labour productivity growth during a period of economic recovery and accelerating growth than during a period of economic slump. However, that was not the case in the United Kingdom. Further, in both these countries, within-firm changes had a much greater, and positive, impact on labour productivity growth, during both the time periods.
Scarpetta et al.22 use an alternative decomposition methodology, proposed by Griliches and Regev, to decompose labour productivity growth across OECD countries into its various components. Their study also finds that in the United Kingdom the impact of net entry on productivity growth was relatively small across a number of 2- and 3-digit industries.
3.2 Explaining the relatively smaller impact of net entry: institutional rigidities and firm characteristics
A plausible explanation for the relatively small contribution of net entry to productivity growth, measured in terms of either labour productivity or TFP, is that structural rigidities and institutional weaknesses prevent reallocation of productive resources from exiting firms to (presumably more productive) incumbent firms or new entrants.23 The study by Scarpetta et al. confirms the negative impact of regulatory barriers to market entry on TFP growth.
22 Scarpetta et al. 2002 23 Caballero and Hammour (1996, 2000) discuss these rigidities and weaknesses in general terms. However, the nature of such rigidities is easy to comprehend. For example, if inability to mitigate credit risk makes banks risk averse, such that they are more willing to lend to financially solvent incumbents that do not experience rapid productivity growth than to risky new entrants that are at the cutting edge of innovation, the impact of entry on productivity growth would be limited.
11

Productivity and the Economic Cycle
Another explanation is that the extent of contribution of net entry to productivity growth depends on the distribution of single-plant and multi-plant firms in an economy. Disney et al.24 find that, between 1980 and 1992, single-plant firms did not experience any productivity growth. Multi-plant firms accounted for all the observed productivity gain, and the impact of net entry on productivity growth was due to the closure and opening of plants by these multi-plant firms.
24 Disney, Haskel and Yeden 2003
12

Productivity and the Economic Cycle
Box 2: Decomposing productivity growth into its components
Economists use a variety of decomposition algorithms to better understand the drivers of changes in productivity. Two commonly used decomposition algorithms are attributed to Griliches and Regev (1995) and Foster, Haltiwanger and Krizan (1998).
Griliches and Regev (1995) Griliches and Regev propose that change in overall productivity for an industry can be decomposed as follows:
exit
Xiiikti
entry
Niiitit
between
Ciiiit
within
Ciitit PpPpPppP
, [2.1]
where indicates change, is the market share of firm j in the industry, pi is the productivity of firm i and P is the aggregate (i.e. weighted average) productivity level of the industry, the change in productivity is measured over the (t-k, t) time horizon, C is the set of all firms that remain in the industry over this entire period, N is the set of all firms that enter the industry in period t, and X is the set of all firms that exit the industry at the end of period t. The within component captures the (market-share weighted) impact of changes (or growth) in the productivity of continuing firms on industry-level productivity. The between component captures the impact of reallocation of resources (and hence changes in market share) between more productive and less productive firms. The entry component captures the impact of market entry by (presumably more productive) firms. Finally, the exit component accounts for the impact of exit by (presumably less productive) firms.
Foster, Haltiwanger and Krizan (1998) Foster et al. take into account the impact of entry and exit and decompose change in industry-level productivity as follows:
Exit
Xjktktjktj
Entry
Njktjtjt
Cross
Cjjtjt
Between
Cjktktjjt
Within
Cjitktit PPPPPPPPP
,,,,
[2.2] where, as in the Griliches-Regev methodology, indicates change, is the market share of firm j in the industry, the change in productivity is measured over the (t-k, t) time horizon, C is the set of all firms that remain in the industry over this entire period, N is the set of all firms that enter the industry in period t, and X is the set of all firms that exit the industry at the end of period t. The within, between, entry and exit effects too have the same interpretations as in the Griliches-Regev model. Additionally, however, the cross component accounts for the covariance effect that is positive when there is market share growth for firms that experience growth in productivity.
13

Productivity and the Economic Cycle
4. Within-firm versus external determinants of productivity
Productivity is positively correlated with competitive pressures. This
positive correlation is especially strong for firms that are close to the technology frontier or in sectors with small average establishment size; in other cases competition can have a negative impact
It is difficult to predict the cyclicality of innovation as greater access to
credit supports innovation during periods of economic growth, but firms also may reallocate resources to prepare for subsequent recovery during periods of downturn. However, private R & D expenditure tends to be pro-cyclical
Aggregate business investment is pro-cyclical and more volatile than
output. There is no simple relationship between total business investment as a share of GDP and GDP growth, as the quality of business investment and other forms of investment such as intangible investment play a role
Investment in ICT capital has made a significant contribution to
productivity over the previous period of expansion and there is some evidence that it might be pro-cyclical
Although economic theory suggests that individuals' investment in
human capital should be countercyclical, empirical evidence suggests pro-cyclicality of training, in particular apprenticeships. There is mixed evidence on the cyclicality of training of existing employees
14
Productivity and the Economic Cycle
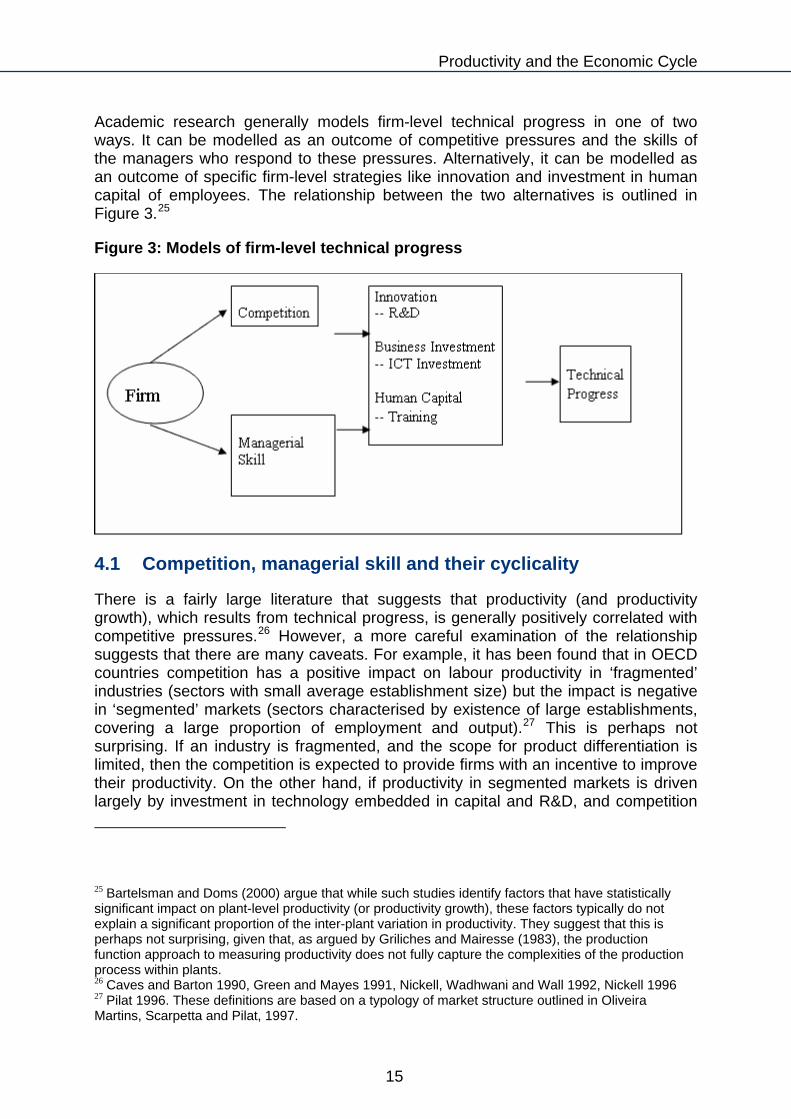
Academic research generally models firm-level technical progress in one of two ways. It can be modelled as an outcome of competitive pressures and the skills of the managers who respond to these pressures. Alternatively, it can be modelled as an outcome of specific firm-level strategies like innovation and investment in human capital of employees. The relationship between the two alternatives is outlined in Figure 3.25
Figure 3: Models of firm-level technical progress
4.1 Competition, managerial skill and their cyclicality
There is a fairly large literature that suggests that productivity (and productivity growth), which results from technical progress, is generally positively correlated with competitive pressures.26 However, a more careful examination of the relationship suggests that there are many caveats. For example, it has been found that in OECD countries competition has a positive impact on labour productivity in ‘fragmented’ industries (sectors with small average establishment size) but the impact is negative in ‘segmented’ markets (sectors characterised by existence of large establishments, covering a large proportion of employment and output).27 This is perhaps not surprising. If an industry is fragmented, and the scope for product differentiation is limited, then the competition is expected to provide firms with an incentive to improve their productivity. On the other hand, if productivity in segmented markets is driven largely by investment in technology embedded in capital and R&D, and competition
25 Bartelsman and Doms (2000) argue that while such studies identify factors that have statistically significant impact on plant-level productivity (or productivity growth), these factors typically do not explain a significant proportion of the inter-plant variation in productivity. They suggest that this is perhaps not surprising, given that, as argued by Griliches and Mairesse (1983), the production function approach to measuring productivity does not fully capture the complexities of the production process within plants. 26 Caves and Barton 1990, Green and Mayes 1991, Nickell, Wadhwani and Wall 1992, Nickell 1996 27 Pilat 1996. These definitions are based on a typology of market structure outlined in Oliveira Martins, Scarpetta and Pilat, 1997.
15

Productivity and the Economic Cycle
either reduces the incentive to make these investments or the ability to make these investments, as strategic considerations (e.g., advertisement, acquisitions, etc) crowd out the available resources, then productivity might be adversely affected. Similarly, competitive pressures might lead to productivity growth in firms that are close to the technological frontier, but not in those that are far from it.28 Finally, import liberalisation may augment productivity of domestic firms not because of import competition in the market for final products but because of competition in the market for intermediate inputs.29
A similarly large literature has attempted to estimate the impact of managerial skills and incentives – the usual proxy for which is some measure of the ownership structure of the firm – to output and productivity. The popular wisdom in this literature is that managerial incentives to adopt appropriate strategies is enhanced through private ownership of productive assets, greater alignment between the incentives of the managers and the shareholders, and better monitoring by creditors and other stakeholders.30 However, the relationships are not necessarily linear, and the proxies themselves capture managerial incentives much more than their skills.
Competitive pressures and ownership structures might also interact with each other. In the United Kingdom, for example, competitive pressures have been found to increase productivity in widely held firms and in firms with concentrated ownership, but not in firms controlled by insiders.31
More importantly, there is no theoretical basis to predict the cyclicality of competitive pressures and managerial skills. Some phenomena like mergers and acquisitions (M&A) that have impact on – in this case, both – market concentration and incentives of managers exhibit cyclicality; M&A is pro-cyclical.32 But the cyclicality of competition and managerial skill themselves cannot be ascertained.
4.2 Within-firm strategies and their cyclicality
4.2.1 Innovation and pro-cyclicality of R&D expenditure
Innovation encompasses a wide range of strategies. It includes introduction of new products and processes, changes in business models, and research and development (R&D). However, since some aspects of innovation like new process are difficult to measure, and since data for some other aspects of innovation are not readily available, academic research generally uses R&D (and patents) as the proxy
28 Aghion et al. 2004, 2009. In the latter paper for instance the authors provide evidence of a causal effect as predicted by Schumpeterian growth theory that the threat of technologically advanced entry spurs innovation incentives in sectors close to the technology frontier, where successful innovation allows incumbents to survive the threat, but discourages innovation in laggard sectors, where the threat reduces incumbents’ expected rents from innovating. 29 Amiti and Konings 2007 30 See Djankov and Murrell 2002, Bhaumik and Gregoriou 2010 31 Koke and Renneboog 2003 32 Komlenovic et al. 2009
16
Productivity and the Economic Cycle
for innovation. Since R&D accounts for over half of innovation-related expenditures,33 and certainly provides a key input into the innovation process,34 this is a reasonable approximation.
There is a broad agreement about the positive impact of R&D (or knowledge capital) on productivity.35 Gains from R&D increase with time and are likely to be much greater in the long run than in the short run.36 Even though R&D is undertaken by a relatively small fraction of firms, evidence suggests that firms benefit from the use of innovations37 such that the aggregate level of R&D in an economy has implications for firm-level productivity.38
From a theoretical point of view, it is difficult to predict the cyclicality of R&D expenditure.39 On the one hand, greater access to credit and larger internal resources might make it easier to incur R&D expenditure during periods of rapid economic growth. On the other hand, periods of economic downturn reduce the opportunity cost of a firm’s resources and these resources can therefore be used for R&D to prepare the firm better for the subsequent recovery. There is some evidence to suggest that firms may indeed reallocate resources to R&D during recessions.40 Overall, however, aggregate R&D expenditure is by and large pro-cyclical, with a fairly high positive correlation between private sector R&D expenditure and GDP growth rate.41
There are several plausible explanations for this pro-cyclical behaviour of R&D expenditure. First, reallocation of human resources to R&D activities may not be feasible during periods of economic slowdown if R&D requires specific skills. Indeed, the supply of labour that is suitable for R&D might itself be pro-cyclical.42 Second, since benefits of R&D might be limited by competitors who imitate new products that are generated using R&D, firms might be willing to undertake R&D only during periods of strong economic growth when strong demand limits the loss of revenue to imitating competitors.43 Finally, greater availability of credit and internal resources might make R&D more feasible during periods of strong economic growth.44 Empirical evidence suggests that at the firm level R&D expenditure is pro-cyclical for
33 Rammer 2005 34 Heger 2004 35 Crepon, Dueget and Mairesse, 1998 36 Geroski 1991 37 While it has been argued that even effective use of externally developed innovation requires some internal R&D activities (Parisi et al. 2006), evidence suggests that it is not always necessary to be R&D active to benefit from technology transfer from the technology leader (Cameron et al. 2005). 38 Geroski 1991, Guellec and van Pottelsberghe 2001 39 Harfi and Mathieu 2009 40 Bean 1990, Saint-Paul 1991 41 Barlevy 2006 42 Fatas 2000 43 Barlevy 2007 44 Aghion et al. 2005, Ouyang 2007
17

Productivity and the Economic Cycle
credit constrained firms, but countercyclical or “Schumpeterian” for firms that do not experience such constraints.45
4.2.2 Pro-cyclicality of business investment
Investment in physical capital increases labour productivity through capital deepening but does not have an impact on TFP per se. However, such investment can also be used for procurement of products that embody innovations, for technology transfer from innovators. Acquisition of innovative products and new technology has an impact on TFP as well.
Data for G7 countries suggest that aggregate business investment is pro-cyclical (and also more volatile than output).46 The Japanese experience, among others, indicates that this pro-cyclicality can be explained by greater access to credit and larger internal resources during periods of rapid economic growth.47 However, at the firm level, pro-cyclicality of business investment is possibly restricted to small and medium enterprises (SMEs), with business investment of larger firms immune to temporary demand shocks.48
Looking in more detail at the relationship between aggregate business investment (one of several inputs) and GDP growth (the desired output), a simple correlation of the average share of total business investment in GDP across countries over the period 1997-2007 against average GDP growth across countries over the same period is negative – with countries with lowest average shares of business investment in GDP over the period 1997-2007, like the UK and the US, exhibiting the strongest GDP growth over the period.
This suggests that: (a) the quality of business investment, rather than the level of business investment per se, has a role to play; (b) other forms of investment, like intangible investment, have a role to play; or (c) some combination of both. While the official data on business investment do not enable us to say anything definitive about the quality of business investment over the last few decades, there is some evidence to suggest that the UK compares favourably to other countries on intangible investment, and other forms of investment.
While there appears to be no simple relationship between total business investment as a share of GDP and GDP growth, any barriers or constraints that cause investment to fall below its efficient level will adversely affect long-term growth. It is important, therefore, that we identify potential barriers or constraints on business investment and assess, where appropriate, how the government may intervene to address these. It is particularly important that we do this now, as the recession may
45 Aghion et al. 2008, Bovha-Padilla et al. 2009 46 Fiorito and Kollintzas 1994 47 Kiyotaki and West 1996 48 Vermeulen 2000
18

Productivity and the Economic Cycle
have changed the scale or nature of these barriers and the way in which they impact on the economy.
Figure 4: Growth of GDP and Business Investment
Source: ONS
4.2.3 Likely pro-cyclicality of investment in ICT capital
ICT capital is special because it not only embodies technological progress, but also has significant spillover effects.49 Adoption of new ICT products facilitates firm-level innovation, and standardisation of operational platforms (e.g., Windows and Office) that improves efficiency of inter-firm communication and management of productive activities.
Evidence from the United Kingdom, reported in
Table 3, suggests that the contribution of ICT capital deepening on labour productivity growth increased 3-4 fold by the mid nineties. During the 1994-1998 period, it accounted for nearly half the growth in labour productivity in this country. However, even this is possibly an underestimate because ICT capital investment must have had an impact on TFP growth as well.
49 Gordon 2004
19

Productivity and the Economic Cycle
Table 3: Contribution of ICT, Non-ICT and dwellings to capital deepening
Contribution of capital deepening
Growth of Y/hour
ICT Non-ICT Dwellings TFP
% p.a. % % % % Low software
1979-89 2.75 13.5 18.6 6 61.91989-94 3.01 13.4 27.4 9.1 50.11994-98 1.47 43.5 5.5 -0.1 51.1
High software 1979-89 2.8 15.1 18.3 5.9 60.81989-94 3.1 16.3 26.6 8.8 48.31994-98 1.55 47.8 5.2 -0.1 47.1
Source: Oulton (2002)
Evidence from the United States, reported in Table 4, suggests that the impact of ICT capital on labour productivity is much higher once the indirect impact through TFP growth is taken into account. ICT investment accounted for about 75 percent of the growth in labour productivity during the 1995-2002 period over the 1973-1995 period (rows 12 and 13 of last column). Of this, about 43 percent50 is a direct outcome of investment in ICT equipment and software, and the rest is on account of the impact of ICT investment on TFP growth (row 10).
50 43%: calculated by expressing last column of row 3 as a percentage of last column of row 1
20

Productivity and the Economic Cycle
Table 4: Impact of ICT capital on labour productivity
1973-95 1995-99 Change 1995-2002
Change
1. Labour productivity 1.41 2.36 0.96 2.61 1.2Contributions from: 2. Capital deepening 0.72 0.98 0.26 1.2 0.493. ICT capital 0.42 0.95 0.53 0.93 0.51Of which 4. Computer hardware 0.22 0.52 0.31 0.47 0.255. Software 0.12 0.33 0.2 0.33 0.216. Communication equipment 0.08 0.09 0.01 0.13 0.057. Other capital 0.3 0.03 -0.26 0.27 -0.028. Labour quality 0.27 0.3 0.03 0.25 -0.029. TFP 0.42 0.98 0.56 1.15 0.74Of which 10. ICT/semiconductor 0.3 0.72 0.41 0.7 0.411. Other non-farm business 0.11 0.26 0.15 0.45 0.34Total ICT/semiconductor contribution to labour productivity 12. Sum of lines 3 and 10 0.72 1.66 0.94 1.63 0.9113. Share of line 1 in percent 51.6 70.4 98 62.6 75.5
Source: Oliner and Sichel (2003), as cited in Gordon (2004)
However, some studies suggest that in order for countries to realise the benefits of ICT investment, it may have to be supplemented by appropriate regulatory frameworks and business models. The slowdown in productivity growth in the UK (and Europe in general) towards the end of the nineties, in sharp contrast to the US experience, is arguably on account of differences in the impact of ICT capital on productivity. This may have been on account of a paucity of complementary skills in the UK relative to the US,51 or on account of more restrictive regulations that govern the three ICT-using industries that were the main contributors to productivity growth in the US,52 namely, wholesale, retail and security trading industries.53
51 Basu et al. 2003 52 Gordon 2004 53 For example, European retail outlets have not been able to replicate the “big box” formats of the US outlets, in part on account of land use (or planning) regulations and in part on account of their concentration within cities.
21

Productivity and the Economic Cycle
Table 5: Impact of ICT capital on labour productivity
1973-95 1995-99 Change 1995-2002
Change
1. Labour productivity 1.41 2.36 0.96 2.61 1.2Contributions from:
2. Capital deepening 0.72 0.98 0.26 1.2 0.493. ICT capital 0.42 0.95 0.53 0.93 0.51
Of which 4. Computer hardware 0.22 0.52 0.31 0.47 0.255. Software 0.12 0.33 0.2 0.33 0.216. Communication equipment 0.08 0.09 0.01 0.13 0.057. Other capital 0.3 0.03 -0.26 0.27 -0.028. Labour quality 0.27 0.3 0.03 0.25 -0.029. TFP 0.42 0.98 0.56 1.15 0.74
Of which 10. ICT/semiconductor 0.3 0.72 0.41 0.7 0.411. Other non-farm business 0.11 0.26 0.15 0.45 0.34
Total ICT/semiconductor contribution to labour productivity 12. Sum of lines 3 and 10 0.72 1.66 0.94 1.63 0.9113. Share of line 1 in percent 51.6 70.4 98 62.6 75.5
Source: Oliner and Sichel (2003), as cited in Gordon (2004)
The evidence on the cyclicality of business investment suggests that investment in ICT capital might also be pro-cyclical. This is borne out by the US experience, namely, large increase in ICT investment during the second half of the nineties followed by a sharp drop in it after the adverse shocks in 2000-2001.
22

Productivity and the Economic Cycle
Figure 5: ICT investment growth and GDP growth in the US
Source: EUKLEMS Growth and productivity accounts
Data from the UK suggest that investments in IT capital and CT capital are both pro-cyclical. The correlation coefficient of GDP growth and growth of investment in IT capital, for the 1986-2005 period is 0.48. The corresponding correlation coefficient for the growth in CT investment is 0.44. But investment in the latter is more volatile than investment in the former. By contrast, investment in software does not exhibit cyclicality, with a correlation coefficient of 0.02.
23

Productivity and the Economic Cycle
4.2.4 Mixed evidence about investment in human capital
There is consensus about the proposition that human capital and productivity are positively correlated. Human capital of employees influences a firm’s ability to absorb new technology.54 It can also contribute to inter-firm spillover effects that augment productivity,55 even though benefits from such spillover may disproportionately accrue to high technology firms. The relationship between human capital of employees and firm-level productivity is, of course, complex,56 and is affected by environmental factors such as workplace practices within firms.57 But the positive impact of employee human capital on productivity is not in question.58
A firm’s employee human capital is dependent on both its ability to hire well trained and skilled individuals, and its policies regarding apprenticeships and training. Economic theory suggests that individuals’ investment in human capital as well as apprenticeships and training should be countercyclical because opportunity cost of labour time is lower during periods of economic downturn. However, this line of argument presumes perfect capital markets, i.e., the ability of firms and individuals to pay for education and training (or bear lower wages associated with apprenticeship) during periods of economic downturn by borrowing against expected (increased) earnings during recovery and the subsequent period of economic upturn. Hence, it may not be supported by the empirical evidence.
Empirical evidence suggests that school enrolment and investment in higher education are indeed countercyclical in OECD countries that have well functioning credit markets.59 However, availability of credit can be a binding constraint for investment in human capital, as evidence from the pro-cyclicality of such investment in emerging markets.
Evidence about the cyclicality of training of existing employees is mixed. A recent study suggests that employee training is pro-cyclical in Europe.60 In the United
54 Griffith et al. 2004 55 For example, it was found that a 1 percentage point increase in the share of college graduates in a city can increase the output of an average firm by as much as half a percentage point (Moretti 2004). 56 Studies have demonstrated, for example, that ICT related human capital of managers contributes much less to productivity growth than comparable human capital of non-managerial employees. Similarly, addition to ICT knowledge of employees has a much larger impact on productivity growth in the services sector than in the manufacturing sector. 57 Black and Lynch 1996, 2001 58 Dearden et al. (2006) report that even after making appropriate methodological corrections for the possibility that firm strategies like provision of training is not random and that certain types of firms are more likely than others to adopt such strategies, they obtain statistically and economically significant estimates of training on productivity in the UK. They find that a 1 percent increase in the proportion of employees that receive training leads to a 0.6 percent increase in productivity. 59 DeJong and Ingram 2001, Dellas and Koubi 2003, Dellas and Sakellaris, 2003, Sakellaris and Spilimbergo 2000 60 Bassanini and Brunello 2008
24

Productivity and the Economic Cycle
States, on the other hand, training exhibits weak counter-cyclicality (as well as a high degree of volatility).61
Finally, consistent with the European evidence about the pro-cyclicality of training, demand for apprentices is also pro-cyclical, at least in the United Kingdom.62 In particular, apprenticeships decline noticeably during periods of significant economic downturn, for example, during the Great Depression, in the early seventies and later between 1989 and 1992.63 During the last of these periods, the decline in the number of apprentices was 15 percent.
61 Sepulveda 2004 62 Brunello 2009 63 Stevens 1994, Felstead and Green 1992, Hart 2005
25

Productivity and the Economic Cycle
5. Conclusions A number of conclusions can be drawn from the above discussion. They are as follows:
a) Productivity is pro-cyclical, essentially an outcome of labour hoarding, as employees reduce or increase their effort as the demand for output falls or increases, combined with economies of scale that arises during periods of economic boom
b) While net entry accounts for a significant proportion of productivity growth,
especially during periods of economic downturn, within-firm changes –involving restructuring and investment in new capital, technology and human resources – generally account for a greater proportion of productivity growth
c) The relatively smaller contribution of net entry could be on account of
institutional weaknesses that prevent exit and entry of firms, as well as rigidities that prevent transfer of resources from incumbent firms to new entrants
d) The contribution of net entry to productivity growth may also be limited by the numerical dominance of single-plant firms in the firm population; much of the benefits of creative destruction accrue from entry and exit of plants owned by multi-plant firms
e) Within-firm changes that determine productivity growth are, broadly speaking, innovation, investment in ICT and non-ICT capital, and investment in human capital
f) Although productivity is positively correlated with competitive pressures, it is especially the case in fragmented industries and firms that are close to the technology frontier. In other cases competition can have a negative impact
g) It is difficult to predict the cyclicality of innovation, as greater access to credit supports innovation during periods of economic growth but during downturns firms tend to reallocate resources to prepare for subsequent recovery. However, private R & D expenditure tends to be pro-cyclical
h) Aggregate business investment is pro-cyclical and also more volatile than output. There is no simple relationship between total business investment and GDP growth as the quality of business investment and other forms of investment, such as intangible investment, play a role
i) Investment in ICT capital has made a significant contribution to productivity over the previous period of expansion and there is some evidence that it might be pro-cyclical
26

Productivity and the Economic Cycle
27
j) Although economic theory suggests that individual investment in human capital should be countercyclical, empirical evidence suggests pro-cyclicality of training, in particular apprenticeships. There is mixed evidence on the cyclicality of training of existing employees

Productivity and the Economic Cycle
References Aghion, P. and Saint-Paul, G. (1998) ‘Virtues of Bad Times: Interaction Between Productivity Growth and Economic Fluctuations’ Macroeconomic Dynamics, Vol. 2, pp. 322-344
Aghion, P. et al. (2004) ‘Entry and Productivity Growth: Evidence from Micro-Level Panel Data’, Journal of European Economic Association, Vol. 2, pp. 265-276
Aghion, P. et al. (2008) ‘Credit Constraints and the Cyclicality of R&D Investments: Evidence from France’, Banque de France Research Note, No. NER-R #198
Aghion, P. et al. (2009) ‘The Effects of Entry on Incumbent Innovation and Productivity’, Review of Economics and Statistics, Vol. 91, PP. 20-32
Amiti, M. and Konings, J. (2007) ‘Trade liberalization, intermediate inputs, and productivity: Evidence from Indonesia’, American Economic Review, Vol. 97, pp. 1611-1638
Baier, S.L., Dwyer Jr., G.P. and Tamura, R. (2002) ‘How Important are Capital and Total Factor Productivity for Economic Growth?’ Federal Reserve Bank of Atlanta Working Paper No. 2002-2a,
Baily, M., Bartelsman, E. and Haltiwanger, J. (2001) ‘Labor Productivity: Structural Change and Cyclical Dynamics’, The Review of Economics and Statistics, Vol. 83, pp. 420-433
Barlev, G. (2007) ‘On the cyclicality of research and development, American Economic Review’, Vol. 97, pp. 1131-1164
Barnes, M., Haskel, J. and Maliratna, M. (2002) The Sources of Productivity Growth: Micro Level Evidence for the OECD, Mimeo, OECD, Paris
Bartelsman, E. and Doms, M. (2000) ‘Understanding Productivity: Evidence from Longitudinal Microdata’, Journal of Economic Literature, Vol. 38, pp. 569-594
Bassanini, A. and Brunello, G. (2008) ‘Barriers to Entry and Workplace Training’, Discussion Paper No. 2746, IZA, Bonn
Basu, S. (1996) ‘Procyclical Productivity: Increasing Returns or Cyclical Utilization? Quarterly Journal of Economics, Vol. 111, pp. 719-751
Basu, S., Fernald, J.G., Oulton, N. and Srinivasan, S. (2003) ‘The Case of the Missing Productivity Growth: Or, Does Information Technology Explain Why Productivity Accelerated in the United States but not the United Kingdom?’ National Bureau of Economic Research Working Paper No. 10010, Cambridge, Massachusetts
28
Productivity and the Economic Cycle
Bean, C.R. (1990) ‘Endogenous Growth and the Procyclical Behaviour of Productivity, European Economic Review, Vol. 34, pp. 355-363
Bernanke, B. and Parkinson, M. (1991) ‘Procyclical Labor Productivity and Competing Theories of the Business Cycle: Some Evidence from Interwar US Manufacturing Industries, The Journal of Political Economy, Vol. 99, pp. 439-459
Bhaumik, S.K. and Gregoriou, A. (2010) ‘‘Family’ Ownership, Tunnelling and Earnings Management: A Review of the Literature’, Journal of Economic Surveys, Vol. 24, pp. 705-730
Black, S. and Lynch, L. (1996) ‘Human-Capital Investment and Productivity, American Economic Review Papers and Proceedings, Vol. 86, pp. 263-267
Black, S. and Lynch, L. (2001) ‘How to Compete: The Impact of Workplace Practices and Information Technology on Productivity, Review of Economics and Statistics, Vol. 83, pp. 434-445
Bovha-Padilla, S., Damijan, J.P. and Konings, J. (2009) ‘Financial Constraints and the Cyclicality of R&D Investment: Evidence from Slovenia’, Discussion Paper No. 239/2009, LICOS – Centre for Institutions and Economic Performance, Catholic University of Leuven, Belgium
Brunello, G. (2009) ‘The Effect of Economic Downturns on Apprenticeships and Initial Workplace Training: A Review of the Evidence, Discussion Paper No. 4326, IZA, Bonn
Caballero, R. and Hammour, M. (1996) ‘On the Timing and Efficiency of Creative Destruction’, Quarterly Journal of Economics, Vol. 111, pp. 805-852
Caballero, R. and Hammour, M. (2000) ‘Institutions, Restructuring, and Macroeconomic Performance’, National Bureau of Economic Research Working Paper No. 7720, Cambridge, Massachusetts
Caballero, R. and Lyons, R. (1992) ‘External Effects in US Procyclical Productivity’, Journal of Monetary Economics, Vol. 29, pp. 209-225
Campbell, J. (1998) ‘Entry, Exit, Embodied Technology, and Business Cycles’, Review of Economic Dynamics, Vol. 1, pp. 371-408
Caves, R.E. and Barton, D.R. (1990) ‘Efficiency in US Manufacturing Industries’, MIT Press, Cambridge, Massachusetts
Crepon, B., Duguet, E. and Mairesse, J. (1998) ‘Research, Innovation, and Productivity: An Econometric Analysis at the Firm Level, National Bureau of Economic Research Working Paper No. 6696, Cambridge, Massachusetts
De Long, J.B. and Waldman, R. (1997) ‘Interpreting Procyclical Productivity: Evidence from a Cross-Nation Cross-Country Panel, Economic Review (Federal Reserve Bank of San Francisco), Vol. 1, pp. 33-52
29

Productivity and the Economic Cycle
Dearden, L., Reed, H. and van Reenen, J. (2006) ‘The Impact of Training on Productivity and Wages: Evidence from British Panel Data’, Oxford Bulletin of Economics and Statistics, Vol. 68, pp. 397-421
DeJong, D.N. and Ingram, B.F. (2001) ‘The Cyclical Behavior of Skill Acquisition’, Review of Economic Dynamics, Vol. 4, pp. 536-561
Dellas, H. and Koubi, V. (2003) ‘Business Cycles and Schooling’, European Journal of Political Economy, Vol. 19, pp. 843-859
Dellas, H. and Sakellaris, P. (2003) ‘On the Cyclicality of Schooling: Theory and Evidence’, Oxford Economic Papers, Vol. 55, pp.148-172
Disney, R., Haskel, J. and Heden, Y. (2003) ‘Restructuring and Productivity Growth in UK Manufacturing’, Economic Journal, Vol. 113, pp. 664-694
Djankov, S. and Murrell, P. (2002) ‘Enterprise Restructuring in Transition: A Quantitative Survey, Journal of Economic Literature, Vol. 40, pp. 739-792
Domar, E. (1946) ‘Capital Expansion, Rate of Growth, and Employment, Econometrica, Vol. 14, pp. 137-147
Felstead, A. and Green, F. (1996) ‘Training Implications of Regulation Compliance and Business Cycles’, In: A. Booth and D. Snower (Eds.) Acquiring Skills, Cambridge University Press, pp. 257-283
Fiorito, R. and Kollintzas, T. (1994) ‘Stylized Facts of Business Cycles in the G7 from a Real Business Cycle Perspective’, European Economic Review, Vol. 38, pp. 235-269
Foster, L., Haltiwanger, J. and Krizan, C.J. (1998) ‘Aggregate Productivity Growth: Lessons from Microeconomic Evidence’, National Bureau of Economic Research Working Paper No. 6803, Cambridge, Massachusetts
Geroski, P. (1991) ‘Innovation and Sectoral Sources of UK Productivity Growth’, Economic Journal, Vol. 101, pp. 1438-1451
Gordon, R. (2004) ‘Five Puzzles in the Behaviour of Productivity, Investment and Innovation’, National Bureau of Economic Research Working Paper No. 10660, Cambridge, Massachusetts
Green, A. and Mayes, D.G. (1991) ‘Technical Efficiency in Manufacturing Industries, Economic Journal, Vol. 101, pp. 523-538
Griffith, R., Redding, S. and van Reenen, J. (2004) ‘Mapping the two Faces of R&D: Productivity Growth in a Panel of OECD Countries’, Review of Economics and Statistics, Vol. 86, pp. 883-895
Griliches, Z. and Mairesse, J. (1983) ‘Comparing Productivity Growth: An Exploration of French and US Industrial and Firm Data, European Economic Review, Vol. 21, pp. 89-119
30

Productivity and the Economic Cycle
Griliches, Z. and Regev, H. (1995) ‘Firm Productivity in Israeli Industry 1979-1988’, Journal of Econometrics, Vol. 65, pp. 175-203
Guellec, D. and van Pottelsberghe de la Potterie, B. (2001) ‘R&D and Productivity Growth: Panel Data Analysis of 16 OECD Countries’, Economic Studies No. 33
Hall, R.E. (1988) ‘The Relation Between Price and Marginal Cost in US Industry’, Journal of Political Economy, Vol. 96, pp. 921-947
Hall, R.E. (1991) ‘Labour Demand, Labour Supply, and Employment Volatility’, In: Blanchard O.J. and Fischer S. (Eds.) NBER Macroeconomics Annual, No. 6, pp. 17-62
Harfi, M. and Mathieu, C. (2009) ‘Economic Cycles and Business Enterprise R&D in the OECD Countries’, Working Paper No. DSTI/IND/WPGI(2009)4, OECD, Paris
Harrod, R.F. (1939) ‘An Essay on Dynamic Theory, Economic Journal, Vol. 49, pp. 14-33
Hart, R. (2005) ‘General Human Capital and Employment Adjustment in the Great Depression: Apprentices and Journeymen in UK Engineering’, Oxford Economic Papers, Vol. 57, pp. 169-189
Heger, D. (2004) ‘The Link Between Firms’ Innovation Decision and the Business Cycle: An Empirical Analysis’, Discussion Paper No. 04-85, ZEW – Centre for European Economic Research, Mannheim
Kiyotaki, N. and West, K. (1996) ‘Business Fixed Investment and the Recent Business Cycle in Japan’, In Bernanke B. and Rotemberg J. (Eds.) NBER Macroeconomics Annual, pp. 277-323
Koke, J. and Renneboog, L. (2005) ‘Do Corporate Control and Product Market Competition Lead to Stronger Productivity Growth? Evidence from Marker-Oriented and Blockholder-Based Governance Regimes’, Journal of Law and Economics, Vol. 48, pp. 475-516
Lewis, W.A. (1954) ‘Economic Development with Unlimited Supplies of Labour’, Manchester School, Vol. 22, pp. 139-191
Murphy, K.M., Shleifer, A. and Vishny, R.W. (1989) ‘Building Blocks of Market-Clearing Business Cycle Models, In Blanchard O.J. and Fischer S. (Eds.) NBER Macroeconomics Annual, Vol. 4, pp. 247-302
Nickell, S.J. (1996) ‘Competition and Corporate Performance’, Journal of Political Economy, Vol. 104, pp. 724-746
Nickell, S.J., Wadhwani, S. and Wall, M. (1992) ‘Productivity, Growth in the UK Companies, 1975-1986’, European Economic Review, Vol. 36, pp. 1055-1085
Oliner S.D. and Sichel D.E. (2002) ‘Information Technology and Productivity: Where Are We Now and Where Are We Going?’ Federal Reserve Bank of Atlanta Economic Review, Vol. 87, pp. 15-44
31

Productivity and the Economic Cycle
Olley, G.S. and Pakes, A. (1996) ‘The Dynamics of Productivity in the Telecommunications Equipment Industry’, Econometrica, Vol. 64, pp. 1263-1297
Oulton, N. (2002) ‘ICT and Productivity Growth in the United Kingdom’, Oxford Review of Economic Policy, Vol. 18, pp. 363-379
Ouyang, M. (2007) ‘On the Cyclicality of R&D: Disaggregated Evidence’, Federal Reserve Bank of Cleveland Working Paper No. 07-07R
Parisi, M., Schiantarelli, F. and Sembenelli, A. (2006) ‘Productivity, Innovation Creation and Absorption, and R&D: Micro Evidence for Italy’, European Economic Review, Vol. 50, pp. 2037-2061
Pilat, D. (1996) ‘Competition, Productivity and Efficiency’, OECD Economic Studies No. 27
Ranis, G. and Fei, J.C.H. (1961) ‘A Theory of Economic Development’, American Economic Review, Vol. 51, pp. 533–565
Rosen, S. (1968) ‘Short Run Employment Variation on Class-I Railroads in the US, 1947-1963’, Econometrica, Vol. 36, pp. 511-529
Rotemberg, J. and Summers, L. (1990) ‘Inflexible Prices and Procyclical Productivity’, Quarterly Journal of Economics, Vol. 105, pp. 851-874
Sakellaris, P. and Spilimbergo, A. (2000) ‘Business Cycles and Investment in Human Capital: International Evidence on Higher Education’, Carnegie-Rochester Conference Series on Public Policy, Vol. 52, pp. 221-256
Sbordone, A.M. (1997) ‘Interpreting the Procyclical Productivity of Manufacturing Sectors: External Effects or Labour Hoarding?’ Journal of Money Credit and Banking, Vol. 29, pp. 26-45
Scarpetta, S., Hemmings, P., Tressel, T. and Woo, J. (2002) ‘The Role of Policy and Institutions for Productivity and Firm Dynamics: Evidence from Micro and Industry Data’, OECD Economic Department Working Paper, No. 329
Solow, R.M. (1956) ‘A Contribution to the Theory of Economic Growth, Quarterly Journal of Economics, Vol. 70, pp. 65-94
Solow, R.M. (1964) ‘Presidential Address to the Econometric Society on the Short Run Relation between Employment and Output’
Stevens, M. (1994) ‘An Investment Model for the Supply of Training by Employers’, Economic Journal, Vol. 104, pp. 556-570
Vermeulen, P. (2000) ‘Business Fixed Investment: Evidence of a Financial Accelerator in Europe’, European Central Bank Working Paper No. 37
32

Productivity and the Economic Cycle
Part 2 Impact of the 2008-2009 Recession on Productivity and
Recovery in the UK
33

Productivity and the Economic Cycle
1. Introduction As the UK economy emerges from the worst recession since the Great Depression of the thirties,64 the recovery process is challenging.65 An economic brief published by the European Commission (EC) estimates that the financial crisis that precipitated the recession could lead to a loss in potential output of the order of 5 percent in the European Union (EU), with severe consequences for long term growth prospects.66 As Government’s ability to stimulate demand will be limited for the foreseeable future, growth in the long run will have to be driven largely by productivity gains.
This paper addresses this policy issue, and examines evidence on the determinants of productivity growth in the UK, with emphasis on the impact of the 2008-09 recession on these determinants.67 It then takes a view on the outlook for these determinants of productivity growth during the recovery period. However, the discussion does not take into consideration the impact of the Spending Review which was presented to the Parliament on 20 October 2010, and which has fixed spending budgets for government departments until 2014-15.
It is generally accepted that recessions offer an opportunity to innovate, as output declines and thereby reduces the opportunity cost of productive resources. Companies that take the opportunity to innovate during economic downturns emerge stronger to take better advantage of the subsequent upturn, while many companies that do not innovate remain weak, and eventually exit the market. This indeed is the basis for the much-discussed Schumpeterian “creative destruction”.
Government has played an important role in recovery from financial crises in other countries, eg in Sweden and Finland in the early nineties the loss of potential output was limited by productivity-augmenting restructuring and innovation policies. In 1993, following three years of deep recession, the Finnish government helped coordinate leverage of the country’s strong engineering legacy, transforming it into a “knowledge economy”. Finland’s annual productivity growth rose by 30 percent over the decade.68 Not surprisingly, policies adopted by OECD governments to mitigate the effects of the 2008-09 recession included measures such as investment in
64 According to latest estimates, the UK economy shrank by a cumulative 6.5 percent during the course of the recession. 65 Recent projections of the International Monetary Fund (IMF) show that UK GDP will grow by the 1.7 percent in 2010, matching the Euro area’s average growth rate, and by 2.0 percent in 2011,higher than the projected 1.5 percent growth in the Euro area. (Source: World Economic Outlook, IMF, Washington, D.C. (October 2010)) 66 Koopman and Szekely, 2009 67 The ECFIN economic brief above argues that as well as restructuring the financial sector, EU economies have to focus on increasing productivity growth, in particular through better use of research and innovation. 68 Leadbeater, 2008
34

Productivity and the Economic Cycle
35
infrastructure, support for research and development (R&D), investment in human capital, and support for innovation including support for innovation and investment in small and medium enterprises (SMEs).69
This paper argues that while considering policy options it is important to view individual factors that affect productivity, such as business investment and innovation, as interdependent components of a system, rather than as isolated drivers of productivity. The conceptual framework for this interrelated system is presented in the next section. Thereafter, given that data are available for individual determinants of productivity such as business investment and innovation, it examines the impact of the recession on these individual factors, but links between these individual factors are made where necessary. An attempt is made to distinguish between cyclical and structural factors affecting productivity growth in the UK, arguing that future policy initiatives should address structural far more than cyclical factors.
69 Germany, for example, has invested €11.5 billion (0.5 percent of GDP) in infrastructure, €1.4 billion (0.1 percent of GDP) in science, R&D and innovation, €14.5 billion (0.6 percent of GDP) in education, and €5.7 billion (0.2 percent of GDP) in green technologies that embody the cutting edge of technological R&D and new ideas. The corresponding figures for the United States of America (USA) are $100 billion (0.7 percent of GDP), $16 billion (0.11 percent of GDP), $83 billion (0.58 percent of GDP) and $59 billion (0.41 percent of GDP), respectively. (Source: Policy responses to the economic crisis: Investing in innovation for long term growth, OECD (June 2009), Table 4)

Productivity and the Economic Cycle
2. Determinants of productivity
Investment, infrastructure, innovation, skills, enterprise and competition
are key determinants of productivity and should be regarded as interdependent components of an integrated system
While pursuing productivity growth, it is difficult to substitute any of
these determinants with one or more others, as they are complements
The academic literature has identified a number of factors which have an impact on productivity. Growth of multifactor or total factor productivity (TFP) is driven by technological changes, at least part of which can be embodied in physical capital, as well as by environmental factors such as competition. Growth in labour productivity (more commonly used for policy purposes) is affected by factors such as changes in capital intensity and the skill level of the labour force as well as TFP growth.
While factor inputs such as investment in technology have a direct impact on productivity and productivity growth, environmental factors such as competition have an indirect and complex impact. Competition gives companies the incentive to improve efficiency through product and process innovation, and invest in new technology and human capital,70 but the extent of competition and the generation of innovative ideas are in turn influenced by entry of new companies.
Academic research sometimes uses reduced form empirical models71 to explore the impact of the individual aspects of competition on productivity and its growth.72 This simplifying approach in empirical research is often reflected in the approach of policy makers towards the management of productivity and its growth. In the UK, for example, discussion about determinants of productivity often revolves around inter-related factors that are functionally separable:73
70 However, too much competition might also reduce the incentive to innovate, given that competition will reduce the ability of the innovative companies to earn supernormal profits for an extended period of time. See Aghion, 2005 71 Reduced form models abstract from the complex inter-relatedness of economic factors, and present summative views of relationships between economic variables. For example, it is well known that in a market price is jointly determined by aggregate demand and aggregate supply, but price itself has an impact on the buying and selling decisions of individual consumers and producers. A reduced form model abstracts from this complexity, and posits that quantity exchanged in a market depends on income and other demand-side factors such as tastes and preferences, as also on factors such as technology that affects supply decisions. 72 Aghion, 2006, and Parisi, 2006 73 DTI, 2006
36

Productivity and the Economic Cycle
Investment in physical capital such as machinery and equipment.
Infrastructure that facilitates both physical and virtual interaction between the market players. Traditional examples of infrastructure therefore include road and railway networks, while more contemporary examples include fibre optics networks that facilitate interaction through cyberspace.74
Innovation which involves generation and exploitation of new ideas that can take the form of new technology, new designs, new processes, etc.
Skills which involve investment in the human capital of workers, and improve their ability to both generate and adapt to new ideas.
Enterprise which involves seizing opportunities to start new companies, often based on new ideas about products and processes.
Competition which provides the incentive to undertake investment in physical and human capital, and innovate, and supports the socially efficient allocation of resources, depending on market frameworks and institutions.
The separation of the determinants of productivity along these lines, the intellectual basis of which can be traced back to empirical analysis of reduced form models in the academic literature, is appealing from a functional point of view. However, such separation is difficult to justify from a conceptual point of view. It is evident from the above discussion that factors such as market entry by new companies, competition, innovation and investment in physical and human capital are inter-related. Therefore, rather than thinking about them individually, one has to think about them as interdependent components of an integrated system. The system itself can be depicted as follows:
74 Arguably, infrastructure could also include regulatory structures of countries. The importance of regulatory infrastructure has increased manifold in the aftermath of the financial crisis that precipitated the last recession.
37

Productivity and the Economic Cycle
Figure 6: Determinants of productivity
The diagram captures the characteristics of the system discussed above. The extent of competition is determined by a range of factors, including product market entry and competition policy. Entry itself is affected by competition (which affects returns on investment), regulation, and ease of access to physical infrastructure. Competition is also influenced by the state of physical infrastructure, which can affect the extent of market segmentation, and it in turn affects companies’ incentives to invest in physical and human capital. Finally, firms’ innovation capability depends on access to new capital, new technology and skilled workers, and itself provides a competitive edge to innovation-active companies, which sharpens competition.
An important implication of this systemic view of the determinants of productivity is that, while pursuing productivity growth, it is difficult to substitute any one of these drivers with one or more of the others, i.e., they are complements. For example, investment in new technology embodied in physical capital may not augment productivity unless it is supplemented by an increase in the skill level of the work force. Similarly, while competition may provide the incentive to innovate, certain types of innovation might be infeasible without adequate access to appropriate infrastructure such as high speed data networks. While policy emphasis can and should change with circumstances, effective policy making has to ensure that the balance among the different components of the system is maintained over time.
38

Productivity and the Economic Cycle
39
In the sections that follow, we discuss the individual components of this system. This approach is necessary since evidence is often collected for each functionally separable determinant of productivity and its growth.75 We revert to a more systemic approach towards the end of the paper, when we discuss the outlook for UK productivity.
75 We do not discuss the aspect of competition that incentivises investment in physical and human capital, and innovation. Even in markets that experience a significant amount of new entry (and exit) by companies, competition evolves relatively slowly and short-term variations are difficult to measure.

Productivity and the Economic Cycle
3. Enterprise Early-stage entrepreneurial activity in the UK compares favourably with
those of many G7 countries but is lower than in the USA and emerging economies. An unfavourable entrepreneurial culture and associated social norms may be factors holding back UK entrepreneurship growth
Early-stage entrepreneurial activity has remained unaffected in the UK in
the aftermath of the recent recession, even though access to finance proved difficult for nascent entrepreneurs
There was an increase in the number of insolvencies during this
recession but it is not obvious whether this was chiefly driven by Schumpeterian dynamics or short term financial pressures
Enterprise – the seizing of new business opportunities – is a key driver of productivity growth. New companies serve two different purposes. First, by increasing competition, they provide an incentive for incumbent companies to innovate, and thereby raise average productivity. Second, new companies introduce new ideas in the form of new products and new processes, which can transform the ways in which industries function, once again raising productivity. Indeed, even though a large proportion of new companies go out of business within three to four years of starting operation, enterprise is considered an important component of the “Schumpeterian dynamics” that drive productivity growth. Incumbent companies which are unable to match the innovation and productivity levels of surviving new entrants are driven out of business. This results in a reallocation of factor inputs from less productive to more productive units of production, raising average productivity. The benefits of competition and the role of enterprise in facilitating competition in the UK are well documented.76
3.1 Policy discussion within the UK
Overall, the enterprise level in the UK is comparable to the G7 average. Data collected by the Global Entrepreneurship Monitor (GEM) project suggest that early-stage entrepreneurial activity in the UK (measured as a percentage of the working age population) compares favourably with those in many other G7 countries. But it is significantly lower than early-stage entrepreneurial activities in the USA and fast growing emerging markets such as China and India (Figure 7). However, while early-stage entrepreneurial activity has declined in the USA in the aftermath of the
76 Davies, 2004
40

Productivity and the Economic Cycle
recent recession, it has remained unaffected – indeed increased marginally – in the UK. Further, nearly 80 percent of entrepreneurial activity in the UK is driven by opportunities, in contrast to emerging markets like China where about half of all such activities are driven by necessity.77
Figure 7: Early-stage entrepreneurial activity (as % of working age population)
Source: Global Entrepreneurship Monitor: United Kingdom 2009 Monitoring Report, Figure 5
However, enterprise is also hindered by structural (in the UK’s case, cultural) factors. Responding to the GEM survey, 25 experts assigned scores to factors that are known to influence entrepreneurship, on a 5-point scale, for the UK and some other G7 countries. Figure 8 compares the scores assigned to the UK and the USA. While the UK compares favourably with the USA in general, the scores suggest that unfavourable entrepreneurial culture and associated social norms are perhaps the single most important factor holding back growth of entrepreneurship in the UK.
77 ‘Opportunity entrepreneurship’ refers to circumstances where economic agents become entrepreneurs by choice, to benefit from an unexploited opportunity in the market. By contrast, “necessity entrepreneurs” are essentially self-employed people who were forced into entrepreneurial activities because of absence of appropriate job opportunities.
41

Productivity and the Economic Cycle
Figure 8: Experts’ view on entrepreneurial conditions in UK and USA
Source: Global Entrepreneurship Monitor: United Kingdom 2009 Monitoring Report
In a 2008 policy document78 (relating to 2006 data), the Government outlined its vision about ways to unlock entrepreneurial potential in the UK. It noted UK’s successes with respect to entrepreneurship, e.g., a 10 percent increase in the number of SMEs since 1997, improved survival rates with 71 percent of VAT registered companies continuing to be registered after three years, and faster growth of productivity among SMEs than among larger enterprises.
However, it also recognised the challenges associated with growth of entrepreneurial activity in the UK. Some of the key challenges identified in the document are as follows:
Cultural inhibitions: Over a third of the working age population in the UK cite fear of failure as an explanation for not starting a business, the corresponding figure for the USA being 21 percent. Entrepreneurial activity is particularly low among women, with women-led businesses accounting for only 14 percent of the total.
Low growth ambitions: More than a third of UK businesses do not have ambitions to grow, and growth is weak even among those who intend to grow. Only about 20 percent of all businesses in the UK experience employment growth in a given year, and fewer than 10 percent experience sustained growth.
78 HMT and BERR, 2008
42

Productivity and the Economic Cycle
Low level of innovation: In 2006, fewer than half of the businesses improved on an existing product or service, and only 12 percent introduced a new product or service. This low level of innovation was consistent with low level of training for managers; only about a quarter of managers receive any training.
In a 2009 document,79 the CBI made several specific policy recommendations to help increase entrepreneurial activity in the UK. The main thrust of the policy recommendations was to reduce tax burden of SMEs and improve their access to debt and equity capital. Some of the key recommendations are as follows:
reducing the corporation tax rate to 18 percent
doubling of investment allowance to £100,000, and introduction of a system of payable tax credits to SMEs that are not sufficiently profitable to benefit from investment allowance
implementating a modification of the capital gains tax to offset damage to SMEs and entrepreneurs
making the cost of raising equity tax deductible, to encourage equity investment in SMEs
widening the scope of publicly funded financing schemes to provide access to medium sized companies
fostering partnerships between major banks and the government to provide SMEs with a mix of long term debt and equity
helping to improve energy efficiency of SMEs, for example, by providing low-interest loans through the Carbon Trust
3.2 Entrepreneurial activity during recession and recovery
The recent recession made entrepreneurial activity difficult. Nearly two-thirds of nascent entrepreneurs and new business owners surveyed by GEM in 2009 felt that it was more difficult to start a business - 44 percent had lower expectations for growth, while 51 percent felt there were fewer business opportunities.
Not surprisingly given the nature of the recession, access to finance has been a problem for nascent entrepreneurs in the UK. The GEM survey revealed a steep increase in the proportion of entrepreneurs who sought and were refused finance by banks and other sources (Table 6). However, despite the increase, the overall proportion of nascent entrepreneurs who sought and were refused finance may not have been very high.
79 CBI, 2009
43

Productivity and the Economic Cycle
Table 6: Percentage of UK nascent entrepreneurs who sought and were refused finance, by type of funding refused
2006 2007 2008 2009
Friends and family
4.7 3 4.8 10.9 Individual investors (other than friends and family) 5.7 2.6 4.5 9.9 Unsecured bank loans
6.8 4.4 6.1 9.6 Bank overdraft
7.8 5.1 5.6 9.5 Non-bank unsecured loan
2.7 1.9 2.7 4.2 Mortgage or other secured loan
4.2 5.5 4.7 4 Equity finance or formal venture capital 2.5 2.3 2.1 2.4 Government grants
6.1 8.1 6.1 7.8 Credit cards
4.4 4.6 4.7 4.8 Source: Global Entrepreneurship Monitor: United Kingdom 2009 Monitoring Report, Table 9
The difficulty experienced by nascent entrepreneurs in accessing finance is also reflected in the data on fixed term lending and overdrafts (Figure 9). While the month-on-month change in fixed term lending and overdrafts accessed by SMEs was positive until about the middle of 2009, the recovery period has witnessed sharply negative figures for both. However, since use of credit is influenced by both demand for and supply of credit, the extent of the decline in the use of fixed term lending and overdrafts that is influenced by supply constraints alone is not obvious.
44

Productivity and the Economic Cycle
Figure 9: Credit availability of SMEs (change over previous month)
Source: British Bankers’ Association
The difficulty in accessing financial resources notwithstanding, product market entry was unaffected in 2009, during the height of the recession. Data on new business banking relationships, an approximate yet highly suggestive measure of product market entry, shows that monthly average new business banking relationships was higher in 2009 than in 2008 (Figure 10). The monthly figures for new banking relationships declined steadily between September and December of 2009, before recovering during the January-March period of 2010. However, this pattern is similar to the one observed during the October 2008 to March 2009 period, and hence should be attributed to seasonal factors rather than to the recession or to cyclical factors in general.
45

Productivity and the Economic Cycle
Figure 10: New business banking relationships
Source: British Bankers’ Association
As we have already noted, creative destruction requires insolvencies and exits as much as the entry of new firms. The data suggest that there was also an increase in the number of company insolvencies in England and Wales during the recession. However, when we take into consideration the insolvency rate that is adjusted for the impact of the Enterprise Act of 2002, we find that while the insolvency rate was higher during 2008 and 2009 relative to 2007, it was lower compared to the comparable figures from earlier in the decade (Figure 11). However, we should be careful about drawing inferences about the implications of the modest rise in insolvency rates for productivity growth. Given the nature of the last recession, it is not obvious as to whether firm exits during the recession was largely driven by Schumpeterian dynamics or whether a significant proportion of firms exited merely on account of short term financial pressures driven by inability to raise working capital or roll over existing debt.
46

Productivity and the Economic Cycle
Figure 11: Insolvencies
Source: Experian
3.3 Outlook for enterprise
Enterprise in the medium run may be affected adversely by weak growth and the difficulty in accessing reasonably-priced financial resources that generally follows a financial crisis. But these difficulties might in part be offset by fiscal incentives. The June 2010 emergency budget provides some fiscal incentives for small businesses. They are as follows:80
A one-year increase in the level of small business rate relief, from 1 October 2010, “giving full relief for eligible businesses with a rateable value of up to £6,000 and tapering relief to £12,000”.
A proposal to abolish the requirement that, for eligibility for R&D tax credits, the intellectual property (IP) of the R&D has to be owned by the company making the claim.
In addition, the government seeks to address the financing problem of SMEs by establishing a Growth Capital Fund that would provide £2-10 million in the form of growth capital to fast growing SMEs that are not being served by the market.
80 HMT, 2010
47

Productivity and the Economic Cycle
48
The longer term challenge, however, is twofold.
First, there has to be a significant change in the entrepreneurial culture and associated social norms. To recapitulate, a GEM survey of experts suggests that the observed UK-USA difference in enterprise levels can largely be attributed to culture and social norms.
Second, market entry can stimulate productivity only if both entering and incumbent companies strive to realise their growth ambitions. Haskel and Heden show that new entry accounts for around half of all improvements in productivity, but comparisons with other countries in particular the US suggest potential for increasing the contribution of enterprise to productivity growth by entrants and incumbents. This will require that individual employees (both managerial and non-managerial) be more enterprising.
However in the UK many companies do not fit this profile, either because organisational culture inhibits enterprise on the part of employees, or because risk associated with enterprise is overestimated. This is consistent with the observation that many businesses in the UK may not be innovative. However the route towards more entrepreneurial behavioural may not lie in fiscal incentives or greater access to finance alone. A better understanding of behaviour would be required to facilitate formulation of appropriate policies.

Productivity and the Economic Cycle
4. Infrastructure The weakness of UK infrastructure compared with other industrialised
economies can be traced back to low levels of investment over long time periods. This is a concern regularly expressed by business
The future of the UK infrastructure is likely to depend mainly on the
ability to sustain investment in the present fiscal and financial environment and also on the ability to successfully implement productivity-augmenting demand management e.g. flexible working to mitigate transport congestion. The latter in turn will depend on digital infrastructure quality
It is well understood that infrastructure enhances efficiency and welfare by facilitating transactions and hence improving allocation of resources.81 Further, a reduction in transportation costs can facilitate formation of production clusters that has implications for the economies of agglomeration.82 Both these factors have implications for productivity growth, and hence for GDP and welfare.83 Evidence suggests that investment in road building projects added 1.4 percentage points to TFP growth in the USA between 1951 and 1973, but that diminishing returns set in thereafter.84
It has been demonstrated that investment in individual types of infrastructure results in rapidly diminishing returns, and that there are complementarities between infrastructure and physical and human capital. In other words, a case can be made for investment not in any one type of infrastructure, but rather in a wider portfolio of infrastructure projects.85 Further, in the absence of appropriate infrastructure, investment in physical and human capital might not by themselves generate significant productivity growth. Unsurprisingly, the 2009 OECD review of the UK
81 Some elements of infrastructure such as energy are direct inputs into the production process. While provision of such infrastructure has serious implications for growth, therefore, by virtue of the fact that they are inputs in the production process, they do not directly contribute to TFP growth. 82 Craft, 2009 83 Craft (2009) argues that the welfare and GDP benefits of the Crossrail project, which takes into account intangibles such as welfare implications of time savings and the impact of the investment on safety and environment, could be as high as £19,991 million and £20,069 million, respectively. More generally, evidence points at strong positive influence of investment in many different types of infrastructure on GDP per capita, in the UK (see Egert et al. 2009) 84 Fernald, 1999 85 OECD, 2006
49

Productivity and the Economic Cycle
economy recommends improvements in public infrastructure, especially transport, to boost productivity.86
A key issue in planning the delivery of infrastructure is that the use of all infrastructure facilities varies over time, the most obvious example being peak and off-peak times for road and rail transport. If capacity is created to ensure unhindered flow of traffic during peak hours, much of the capacity would be underutilised during off-peak hours, which is inefficient and expensive. Hence, efficient provision of infrastructure might require demand management, for example, managing traffic flows using instruments such as traffic lights (or variable speeds) and road pricing.
4.1 Policy discussions within the UK
The UK lags behind comparable industrialised economies with respect to the quality of its physical infrastructure. The 2010 Global Competitiveness Report released by the World Economic Forum suggests that the overall quality of infrastructure in the UK lags behind those of France, Germany, Japan and the USA (Figure 12). An examination of the individual components of this overall quality index suggests that the UK lags behind France and Germany in all the relevant sub-categories, while performing better than Japan and the USA in some of the sub-categories. The differences between the UK and the other four countries are particularly stark for road and rail infrastructure. 87
86 OECD, 2009 87 The ‘National Infrastructure Plan 2010’ highlights UK’s advantage vis-a-vis fast growing emerging markets might also be shrinking rapidly. For example, Brazil plans to spend US$560 billion on infrastructure during 2011-14, while China spent US$103 billion on railways in 2009 alone.
50

Productivity and the Economic Cycle
Figure 12: Infrastructure quality in the UK relative to large G7 economies
Source: Global Competitiveness Report 2010, World Economic Forum
The genesis of this weakness vis-a-vis other major industrialised countries can perhaps be traced back to relatively low levels of investment in physical infrastructure. Data for the 1997-2008 period suggest that the UK lagged almost all EU-15 countries in public investment, as a percentage of GDP (Figure 13). The problem of underinvestment, however, stretches back far longer. For example, “vehicle kilometres doubled between 1979 and 2007, while the total length of road network increased by 17 percent” (Craft, 2009: pp. 328).
51

Productivity and the Economic Cycle
Figure 13: Annual average of public investment/GDP in EU-15 countries (1997-2008)
Source: Crafts (2009), Table 2
In 2000, it was estimated that the cost of delay on account of road congestion in the UK equals 3.6 percent of GDP. A 2010 poll conducted by the British Chambers of Commerce suggests that about 80 percent of businesses are affected by the weaknesses in UK’s transport network; 64 percent are affected through loss of man hours while 49 percent are affected through increased operating costs.88 While the costs per year are relatively low (below £5,000) for a majority of the surveyed businesses that could provide estimates, nearly a third of them incurred costs of over £10,000, with 9 percent of them incurring cost of more than £50,000 (Figure 14).
88 BCC, 2010
52

Productivity and the Economic Cycle
Figure 14: Cost to business of transport infrastructure problems
Source: British Chambers of Commerce (2010)
A more limited survey of London businesses, undertaken by the Confederation of British Industries in 2010,89 finds that 85 percent of the respondents are concerned about the adverse impact of the lack of quality and reliability of the city’s transport network on their productivity. The corresponding figure in the June 2009 survey was 76 percent.
The Eddington Study of 200690 recognises both the importance of transport infrastructure in promoting productivity and GDP growth, and the impact of some of its components such as road transport to contribute to environmental damage. However, returns on public investment in infrastructure are so high that substantial benefits remain even after accounting for the impact of infrastructure use on the environment. For example, the Study finds that every £1 spent on transportation in urban areas, inter-urban routes and surface access to international gateways generates average returns of £3, just under £2 and £6, respectively.91 It promotes
89 CBI, 2010 90 HMT and DfT, 2006 91 The return to inter-urban routes increases to just under £5 once expensive rail infrastructure projects are removed from the sample.
53

Productivity and the Economic Cycle
appropriate pricing as a key mechanism to strike a balance between efficient use of infrastructure and its environmental impact.92
The Study also promoted the introduction of an independent Planning Commission to take decisions on strategically important projects. The Infrastructure Planning Commission was created under the Planning Act of 2008. The 2009 OECD review of the UK economy suggests that the Commission “will put in place a faster, more certain and transparent process for planning for major national infrastructure projects” (pp. 127). Unsurprisingly, the 2010 British Chambers of Commerce survey suggests that 62 percent of businesses support the idea of an independent planning commission for infrastructure development.93
The 2009 OECD review suggests that some progress has been made in addressing infrastructure issues that have a bearing on productivity growth (Table 7). However, the survey data reported above make a persuasive case for further action.
Table 7: OECD progress report on infrastructure development
Desired action Progress since 2007
Ensure that infrastructure investment does not fall short of that envisaged in the government’s Ten Year Plan of Transport. Consider ways to improve the predictability of transport funding. Follow through with targeted spending in key areas.
The government will implement five year transport plans to provide greater certainty. This follows the example of the “control periods” for rail. Targeted spending in key areas was announced in January 2009, for example detailing a National Roads Programme of up to £6 billion to increase capacity and reduce congestion in the worst affected areas.
Continue to examine the options for addressing road congestion and environmental impacts including the implementation of a road-pricing system on a national scale.
A demonstration project to trial the technology and processes that could underpin more sophisticated road charging systems will be underway by spring 2009. In addition, the government is bringing forward schemes where capacity can be increased at peak times through the opening of the hard shoulder.
Source: OECD (2009)
92 The April 2010 survey by the British Chambers of Commerce suggests that at this point only 12 percent of surveyed businesses would accept a full road pricing scheme. However, nearly 40 percent are willing to accept motorway tolling, while both lane tolling and ring-fencing fuel duty are supported by 25 percent of the surveyed businesses. 93 Along the same lines, the Confederation of British Industries has proposed setting up an independent Highways Agency to help deliver better outcomes (CBI, March 2010)
54

Productivity and the Economic Cycle
4.2 Infrastructure development during recession and recovery
The fiscal stimulus in the UK during the 2008-09 recession did not include large scale additional expenditures that were specifically targeted towards improving infrastructural quality.94 However, the fiscal measures aimed at combating the recession and the rise of unemployment did include measures that had implications for infrastructural quality. For example, the credit provided by the Treasury Infrastructure Finance Unit, which was set up in March 2009, to private finance initiative (PFI) projects that were finding it difficult to raise debt finance during the crisis. The credit helped safeguard £13 billion of PFI projects. Similarly, the £700 million of transport spending was brought forward from 2010-11 into 2009-10. Of this, £400 million was to be used by the Highway Agency to improve the quality of important motorways such as M1 and M6, and develop strategically important road networks.
Both during the recession and during the subsequent recovery period, private investment in infrastructure, especially by the utilities companies, continued unabated. For example, during 2008-10, water companies planned investments of £8.5 billion. Similarly, regulated gas and electricity networks expected to invest over £4 billion a year during both 2009-10 and 2010-11. The investment of Network Rail during these two years is expected to be similar, in excess of £4.5 billion per year, and total expenditure of the railway company over the 5-year period commencing April 2009 is expected to be £34.6 billion.
The 2009 Budget highlighted the commitments of the government in improving the quality of Britain’s infrastructure.95 The budget recognises the need for investment in infrastructure, e.g., the need for £100 billion investment in the energy sector over the following ten years to enable the government to meet its renewable energy target. This recognition is backed by budgetary support; a total of £405 million will be allocated to support the development of the low carbon energy sector and advanced green manufacturing sector, including an allocation of £250 million from the new Strategic Investment Fund.
However, whereas the government recognises the need for improvement in certain types of infrastructure – it is committed to providing universal access to broadband with a speed of 2 Mbps by 2012 – it is reliant on the private sector companies to help meet these targets. The aim is to create a regulatory environment and a business environment in which private enterprises would make significant investments in Britain’s infrastructure.
94 By contrast, the American Recovery and Reinvestment Act passed by the US Congress in February 2009 made available US$ 275 billion for federal contracts, grants and loans, and part of this money was meant to be used for construction and repair of roads, expansion of broadband and wireless services, investment in the domestic renewable energy industry, etc. 95 HMT (2009) ‘Budget 2009: Building Britain’s Future’
55

Productivity and the Economic Cycle
4.3 Looking ahead
The future of infrastructure in the UK is likely to depend on two factors, the first of which is the ability to sustain investment in transport and other infrastructure in the present fiscal and financial environment. The 2009 OECD review of the UK economy recognises that “the financial crisis poses a problem with the ongoing viability of Private Finance Initiative (PFI) funding of infrastructure projects” (pp. 127). While the private sector recommends continued public investment in infrastructure,96 and even though the Spending Review has “increased the capital envelope [for investment in infrastructure] by £2.3 billion a year by 2014-15 relative to the Budget plan,”97 the challenge lies in accommodating UK’s infrastructural needs in the shrinking government budget.
The National Infrastructure Report 2010 suggests that in the future the government might have to be selective about investment in infrastructure, leaving infrastructure investment to the private sector wherever possible. Specifically, it should intervene if high social or environmental costs, or risks such as unproven technology, deter private investment. It should also intervene if the relevant infrastructure project has wider national interest, i.e., with significant positive externalities, or is of strategic importance. This view is reflected in the government’s intervention in initiatives such as Feed-in Tariffs.
The 2010 BCC survey, which argues that a £30 billion investment in infrastructure will generate benefits of £86 billion, suggests that there is strong private sector support for the creation of a National Infrastructure Bank. Specifically, 65 percent of the businesses surveyed would support the creation of such a bank that would pool together public and private sector resources. The extent of the support rises to 69 percent in East of England and to 73 percent in Northern Ireland. This demand is, in part, being met by the initiative to set up a Green Investment Bank for investment in green infrastructure, with £1 billion in capitalisation from the government.
By contrast, the 2010 report from CBI is more optimistic about the scope for the continued use of public-private partnerships (PPP) for financing infrastructure projects. CBI is also optimistic about the use of tax incremental funding (TIF) schemes to deliver infrastructure. Further, it recommends that community infrastructure levies (CIL) be amended “to include a direct obligation on local authorities to deliver transport projects” (pp. 23).
The second factor that has significant implications for productivity-enhancing infrastructural development in the UK relates to the digital sector. The 2010 CBI report suggests that flexible working practices might hold the key to mitigating road congestion, thereby reducing the pressure on transport infrastructure. While offering better work-life balance that facilitates staff retention, flexible working is therefore an important component of productivity growth. The ability to successfully implement
96 The CBI recommends government net capital spend to be of the order of 2.25 percent of GDP 97 HMT, October 2010
56

Productivity and the Economic Cycle
productivity-augmenting flexible working, in turn, would depend on the quality of digital infrastructure.
The 2010 BCC survey indicates that while fewer businesses experience problems with digital communications (63 percent) than with transport (80 percent), the quality of the former nevertheless adds to loss of man hours (45 percent) and increased operating cost (32 percent) of a significant proportion of the surveyed businesses (Figure 15). Note also that this does not take into consideration the role that digital communication can play in facilitating exchange and joint development of ideas, products and processes across geographical boundaries. The difficulties experienced by those involved in generation and development of such ideas, products and processes might be greater still. A 2006 report by the OECD, on the future of infrastructure, found that the UK was ahead of its fellow EU countries in its attempt to unbundle the potential of some aspects of its digital communications infrastructure. But the findings of the recent surveys reported above are sobering.
Figure 15: Problems experienced as a result of poor infrastructure: Transport vs. digital communications
Source: BCC (April 2010)
The National Infrastructure Plan 2010 indicates that the government seeks to encourage greater private sector investment in superfast broadband networks. It plans to do so by releasing electromagnetic spectrum from public use, making targeted interventions wherever required, and appropriate regulatory changes.
57

Productivity and the Economic Cycle
58
In an era of fiscal tightening financing infrastructure development would be challenging. In the absence of appropriate investment, however, accelerating productivity growth in the long run might be even more so. The challenge therefore lies in operationalising the targets that the government has set for itself in the National Infrastructure Report 2010.

Productivity and the Economic Cycle
5. Competition There are indications that the gap between the UK goods market
efficiency with the USA and Germany has declined since the onset of the recession. The prognosis for the UK labour market efficiency is quite favourable
However, competition may discourage innovation among firms that are
far away from the technology frontier and this may be the reason why innovation levels are low among a sizeable proportion of firms in the UK
The positive impact of competition on firm efficiency and productivity is well understood. Competition affects aggregate productivity in four different ways.
It ensures that less productive firms exit the market, thereby increasing the average productivity of an industry (and hence an economy) by construction.
The exit of less productive firms increases allocative efficiency, i.e., productive resources such as capital and labour are used by more productive firms rather than by less productive firms.
However, the impact of these factors on productivity growth is relatively small and varies over the business cycle.98 In particular, during periods of recovery, the impact of within-firm factors that are influenced by competition is greater.
The threat of exit induces firms to innovate and increase their productivity to ensure their own survival, thereby raising aggregate productivity.
Finally, competition is ensured by contestability of product markets, i.e., by the ability of new firms to enter without incurring high entry costs. Many of these new firms have innovative ideas that are adopted by some of the incumbents over time, thereby accelerating productivity growth. This last issue has relevance for a debate on enterprise.
98 Evidence suggests that net entry is a bigger determinant of aggregate productivity growth during periods of economic slowdown. This is consistent with the Schumpeterian view that periods of economic slowdown have a “cleansing effect” on aggregate productivity by way of firm exit. Second, it suggests that during periods of rapid economic growth the within-firm factors play a much bigger role in boosting productivity (and productivity growth) than net entry. See Bartelsman and Doms, 2000, and Scarpetta et al., 2002.
59

Productivity and the Economic Cycle
The overall impact of competition on productivity is positive and significant.99 However, recent research suggests that competition increases innovation – the main driver of within-firm productivity growth – only among firms that are already close to the technology frontier. Firms that are far away from this frontier might actually be discouraged to innovate when they experience competitive pressures.100 To the extent that the compulsion to innovate is the main driver of growth in a competitive environment, therefore, the magnitude of the impact of competition on productivity growth depends on the distribution of the productivity levels of the firms relative to the technology frontier.
5.1 Policy discussions within the UK
A review of UK’s competition regime, undertaken by KPMG in 2007,101 suggests that the UK’s regime compares favourably with those of the USA, Germany and the EU. The UK’s regime has consistently performed better than that of the EU since 2001, and has narrowed the gap with the USA and Germany over the same period (Figure 16). The review also suggests that the UK has narrowed the gap between its merger regime and those of the US and Germany. In part, this is on account of the continued use of robust economic analysis102 and in part on account of a decline in complex mergers in the USA during the two years preceding the survey that formed the basis for the indices.
99 OFT, 2007 100 Aghion et al., 2005 101 DTI & KPMG, 2007. 102 One of the factors that contributed to the superiority of the US competition policy regime was the ability of the Federal Trade Commission (FTC) to undertake robust econometric analysis using a large number of data points. This was aided by the fact that a number of analysts at the FTC had academic background, and were therefore able to analytically push the boundaries of relevant economic theory. Apparently, the UK regulators have shrunk the gap vis-a-vis their US counterparts.
60
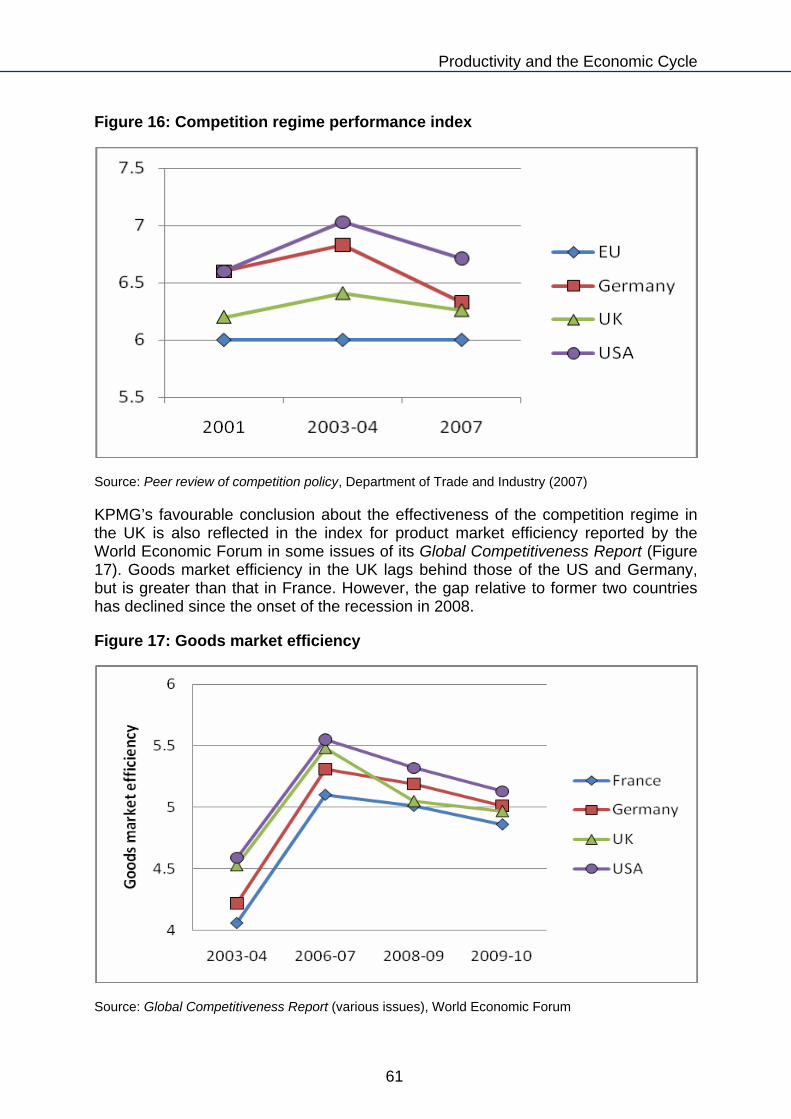
Productivity and the Economic Cycle
Figure 16: Competition regime performance index
Source: Peer review of competition policy, Department of Trade and Industry (2007)
KPMG’s favourable conclusion about the effectiveness of the competition regime in the UK is also reflected in the index for product market efficiency reported by the World Economic Forum in some issues of its Global Competitiveness Report (Figure 17). Goods market efficiency in the UK lags behind those of the US and Germany, but is greater than that in France. However, the gap relative to former two countries has declined since the onset of the recession in 2008.
Figure 17: Goods market efficiency
Source: Global Competitiveness Report (various issues), World Economic Forum
61

Productivity and the Economic Cycle
In addition, labour market efficiency in the UK lags that in the USA but is much greater than those in Germany and France (Figure 18). Since market entry and exit, as also restructuring of firms to better survive competition, are critically dependent on labour market efficiency, the prognosis for the competition regime in the UK is quite favourable.
Figure 18: Labour market efficiency
Source: Global Competitiveness Report (various issues), World Economic Forum
As such, the competition regime in the UK facilitates robust competition among firms. However, as we have noted, competition may have a curvilinear impact on innovation, and hence productivity growth at the firm level. In particular, competitive pressures may discourage innovation among firms that are far away from the technology frontier, such that competition per se may not be a panacea for innovation and productivity growth.
This indeed may be a reason as to why innovation levels are low among a sizeable proportion of firms in the UK, an issue that we shall discuss in further detail later in this paper. If this is indeed the case, however, such that low innovation level among a wide range of firms is the outcome of a rational decision making process in a competitive environment, rather than the outcome of a cultural factor, there is scope to address this issue using appropriate policy initiatives.
62

Productivity and the Economic Cycle
5.2 Competition during recession and recovery
Economic theory does not make any predictions about the cyclicality of product market competition. During recessions, the exit rate of firms generally increases, while the entry rate falls. At the same time, there is generally a reduction in the size of the market itself, and hence the net effect is difficult to predict. The 2008-09 recession in the UK, however, coincided with an event that had additional implications for competition.
There was a significant increase in the market concentration in UK’s banking sector, in the aftermath of the merger between Lloyd’s TSB plc and HBOS plc. Using 2007 market share data, the Office of Fair Trading (OFT) estimated that the combined market share of PCAs of the two merged banks was 33 percent, double that of their closest competitors – the Royal Bank of Scotland Group, HSBC and Barclays – each of whose market share was between 14 and 17 percent.103 As a consequence, the 4-firm concentration ratio (C4) increased from an already high 67 percent to a very high 80 percent. Correspondingly, the Herfindahl-Hirschman Index (HHI) increased to 1950, a change of nearly 500.104
A reduction in banking sector competition can have two different effects on the lending behaviour of banks. First, the interest rate spread is likely to increase for most bank loan products, and banks are less likely to pass through changes in market interest rates.105 Second, banking sector competition has implications on the banks’ risk-taking behaviour. The stylised “risk shifting” paradigm suggests that the increase in loan rates arising from a reduction in competition can raise the credit risk of borrowers.106 However, recent evidence suggests that, in certain contexts, the market power of banks and the extent of risk taking might be negatively correlated.107 In other words, the increased concentration in UK’s banking sector had the potential to reduce risk taking by banks, increase interest rate spreads on loans, and make banks reluctant to pass through changes in market interest rates to borrowers.
While there is no available analysis of the impact of the Lloyd’s-HBOS merger in January 2009, from early that year there was indeed an increase in the spread between loan rates offered by banks and the banks’ cost of borrowing from the central bank and the money markets (Figure 19). Available data, discussed earlier in the paper, suggest that since 2009 access to credit has also been adversely affected, especially for SMEs (Figure 9). However, there is no available estimate of the impact of the increase in the concentration ratio of the banking sector itself on disbursal of credit.
103 OFT, October 2008 104 In general, a market is deemed concentrated if HHI exceeds 1000, and a change of 100 or more in the HHI raises concerns about the impact of a merger on competition. 105 Van Leuvensteijn et al., 2008 106 Stiglitz and Weiss, 1981 107 Jiménez et al., 2007
63

Productivity and the Economic Cycle
Figure 19: Bank rate, money market rates and mortgage rate
Data source: Bank of England
The higher interest rate spreads and the difficulty in access to bank loans have implications for both entry and exit rates, which, together with events such as mergers and acquisitions, jointly influence the extent of competition. In the absence of affordable bank finance, entry rates should decline and exit rates may rise on account of liquidity problems. However, available data suggests that entry rate (as measured by new business banking relationships) rose year-on-year during both 2009 and 2010 (Figure 10), and since Q1 of 2009 the exit rate (as measured by insolvencies) has actually declined (Figure 11). In other words, the significant change in the structure of UK’s banking sector notwithstanding, the extent of competition in the other sectors may not have been affected adversely by changes in entry and exit rates during the recession and the subsequent recovery.
At the same time, there was a steady decline in the number of mergers and acquisitions (M&A) since 2007-08 (Figure 20). The decline in the number of M&A involving UK firms was especially sharp. This decline has been arrested since Q2 of 2009, but the recovery period has not witnessed a significant increase in M&A. Hence, it is unlikely that competition during the recession and the recovery period was adversely affected by M&A in the non-financial sectors.
64

Productivity and the Economic Cycle
65
Figure 20: Mergers and acquisitions in the UK
Data source: Office of National Statistics
Overall, therefore, the 2008-09 recession and the subsequent recovery may not have resulted in a reduction in competition in the non-banking sectors. Concrete evidence about the extent of competition in UK’s non-banking sectors during this period is as yet unavailable.

Productivity and the Economic Cycle
6. Skills There has been a sharp increase in the demand for university places
during the recession and this trend is continuing during the subsequent recovery
There are indications that the recession may have had only a mild
impact on training and apprenticeships Even though the recession did not have a significant impact on skill
formation, it is not obvious whether this will enable the UK to emerge as a technology leader given the existing weaknesses in the skill base compared to other industrialised countries
The importance of skills for successful innovation, and for productivity growth in general, is well understood. In the UK, there was a significant increase in job skills between 1986 and 2006.108 For example, the proportion of jobs requiring Level 4 education or higher increased from 20 percent in 1986 to 30 percent in 2006. Similarly, the proportion of employees using computerised or automated equipment in their job nearly doubled from 40.3 percent in 1986 to 77.4 percent in 2006. This is consistent with the OECD’s estimates that human capital accounted for an overwhelmingly large proportion of annual TFP growth in the UK between 1990 and 2000.109
6.1 Policy discussion within the UK
Emphasising the relationship between skills and productivity, the Leitch Review of 2006 argued that the UK has historically had a skill deficit vis-à-vis the other OECD countries. As a consequence, even though there was a noticeable increase in the skill level in the UK between the mid nineties and the middle of the last decade – for example, a 4 percentage point increase in the proportion of people with Level 4 and above education between 1994 and 2005, and a 236 percent increase in the number of apprentices between 1997 and 2005 – the country’s skill base is yet to catch up with those in leading OECD countries.
108 Felstead, A., 2007 109 OECD, 2003
66

Productivity and the Economic Cycle
The Leitch Review recommended that, in order to enhance skill levels in the UK,110 the skill development system become demand-led, with a focus on skills that generate economic value. The greater employer involvement that is integral to a demand-led system could involve providing more apprenticeships, greater interaction between employers and universities, and an increase in the number of co-funded workplace degrees. It was felt that SMEs should be given greater access to the Train to Gain programme, which was discontinued from November 2010,111 and that these enterprises should gain access to grants that facilitate management and leadership training. It also recommended putting in place a culture that promotes continual upgrading of skills.
The recommendations of the Leitch Review were consistent with the evidence reported in Felstead et al. (2007). Two important findings of the research are as follows:
Between 1986 and 2006 there was an increase in the mismatch between the qualifications of workers and the skills required for their jobs. Specifically, by 2006, a large number of workers in jobs that did not require qualifications had one. But since qualifications and jobs-specific skills do not necessarily overlap, this did not mean that many of these workers did not require additional skills. This has implications for the “demand-led” approach advocated by the Leitch Review.
While most employees who underwent training found it useful, the link between training and better pay or greater job security was weak. This, in turn, has implications for employee demand for training. Further, there was significant heterogeneity about the perceived benefits from training across skill levels. For low skilled workers, training had to be employer initiated in 80 percent of cases. This has implications for the desired culture of continual skill upgradation, and policy support for companies (especially SMEs) that aim to provide training.
The demand-led view of skill development, in turn, brought to the fore the issue of skill shortages across sectors. An UKCES study, released in 2010, found that the greatest shortages (where proportion of skill-shortage vacancies (SSVs) exceeds 20 percent) were for employees with professional and trade-specific skills. The profile of SSVs for these skills across the sectors is reported in Figure 21.
110 The Leitch Review (2006) argued that the UK would have to target the following by 2020: (a) 95 percent of the population to have functional literacy and numeracy skills; (b) at least 90 percent of the adult population to have at least Level 2 skills; (c) the balance of intermediate skills to shift from Level 2 to Level 3; and (d) at least 40 percent of the adult population to have Level 4 skills and above. The targets set out in the Review were endorsed in the 2009-14 strategic plan drawn up by the UK Commission for Employment and Skills (UKCES). 111 The £1 billion earmarked for the programme would be diverted to funding apprenticeship programmes.
67

Productivity and the Economic Cycle
Figure 21: Profile of skill-shortage vacancies across sectors
Source: Skills for Jobs: Today and Tomorrow, Volume 1, UKCES (2010), Table 3
The skill gap is higher in North West, South West, South East and West Midlands. In 2009, the skill gaps in these regions were 19 percent, 22 percent, 21 percent and 20 percent, respectively. In all regions, the skill gap increased in magnitude between 2007 and 2009.
A report published by the British Chambers of Commerce (BCC) suggested that 55 percent of business find it more difficult to recruit skilled workers in 2007 than they did five years ago.112 Not surprisingly perhaps, 77 percent of business made professional assessment of their training needs, and 83 percent of businesses sourced external training for employees. Training was more likely to be provided for managers and senior officials (19.4 percent of employers), administrative and secretarial staff (15.2 percent) and professionals (13.8 percent) than for other employees. Almost 80 percent of businesses spent £100 per employee annually, with nearly half the SMEs spending £250. Interestingly, only 20 percent of the SMEs sourced training through their local college. Finally, while more than 72 percent of surveyed businesses provided management and leadership training, only 14 percent of them paid their managers to undertake high level qualification.
112 BCC, 2007
68

Productivity and the Economic Cycle
Based on growth projections for the different sectors, and consequently for the demand for different types of skills, the 2010 UKCES study identifies the following high priority skills for the UK:
Table 8: High priority skills
Skills for immediate action Skills that are of importance but whose need is not critical to the economy
corporate managers as a group, and a range of specific management skills
management and professional skills in computing and software
professionals in certain medical specialisms, pharmacy, and social care
science and technology professionals in pharmaceutical and medical technology industries
teaching and research professionals across the education sector, especially in STEM related subjects
associate professionals and technical roles in a wide range of sectors, particularly manufacturing/processing
staff in care assistant roles, especially in view of the ageing population
customer service roles within the services sector, especially in retailing and after-sales maintenance
procurement, commissioning and financial management
management skills required for innovation in healthcare markets
risk management and ethics professionals in financial services sector
professionals involved in data security management and intellectual property exploitation
food technologists for manufacturing and process industries
urban planners and actuaries
science and engineering professionals for low carbon energy generation
Source: Skills for Jobs: Today and Tomorrow, Volume 1, UKCES (2010), pp. 33-35
69

Productivity and the Economic Cycle
A 2010 report released by the Confederation of British Industries (CBI) highlights the perspective of the business sector. The survey conducted by the CBI indicates that there is an overwhelming need to improve employability skills at all levels of education. The priorities identified by the survey are as follows:
Table 9: Business priorities for educational institutions
Priorities for schools and colleges Priorities for higher education Improve employability skills
Improve literacy and numeracy
Raise overall standards
Provide high quality vocational options
Improve science and maths skills
Provide improved career advice
Other
70%
63%
46%
42%
28%
20%
3%
Ensure all graduates have employability skills
Raise numbers/quality of STEM113 graduates
Encourage universities to provide more workforce training
Support high quality research/teaching
Support university-business collaboration
Support universities to diversify their provisions
Other
81%
42%
37%
31%
29%
28%
4%
Source: Ready to Grow: Business Priorities for Education and Skills – Education and Skills Survey 2010, CBI (2010)
6.2 Skill development through recession and recovery
Data from the Higher Education Statistics Agency (HESA) indicate that even though the number of full time students graduating with a first degree has declined since the peak of 2003-04, the number of these graduates increased marginally during the recession year of 2008-09, compared to the pre-recession years of 2004-05 through 2007-08 (Figure 22).114 This was supplemented by a continuing increase in the number of students who graduated with other undergraduate degrees and qualifications, from 45,525 in 2006-07 to 51,975 in 2008-09. These figures are
113 STEM: Science, Technology, Engineering, Maths 114 Figure 6 reports the degrees awarded to students domiciled in the UK. It does not take into account part time degrees because it is difficult; to assign time lines to part time degrees, such that it is not possible to take a view on the impact of the recession on part time education.
70

Productivity and the Economic Cycle
consistent with information that suggests that there has been a sharp increase in the demand for university places during the recession and that this trend is continuing during the subsequent recovery.
Figure 22: Trends in education
Source: Higher Education Statistics Agency
Estimates reported by a 2010 UKCES report suggests that the paucity of resources that accompanies a recession may have had only a mild impact on training.115 In all regions of England, two-thirds or more of the surveyed employers reported training their employees; there was virtually no reduction relative to the corresponding proportions reported in 2007. However, in all the regions, there was a greater than 3 percentage point decrease in the proportion of companies where more than 90 percent of the employees received some training.
CBI’s Educational and Skills Survey 2010 indicates that investment on skill development through training will be sustained during the upturn following the recession. The majority of the employers surveyed indicate that they plan to maintain their investment in employee training (Table 10). It should be noted that the employment freeze experienced by many businesses during the recession may have reduced the need to train new and inexperienced employees. When viewed in that light, the proportion of businesses envisaging no reduction in training expenditure is even more impressive.
115 UKCES, 2010 (Table 3.29)
71

Productivity and the Economic Cycle
Table 10: Impact of economic climate on business plans for skills investment (%)
Firm size Increase investment
No change Reduce Investment
1-49 employees 12 62 26
50-199 employees 14 56 30
200-499 employees
14 61 25
500-4,999 employees
13 56 30
5000+ employees 16 63 21
All respondents 14 58 28
Source: Ready to Grow: Business Priorities for Education and Skills – Education and Skills Survey 2010, CBI (2010), Exhibit 9
The British Chambers of Commerce’s Quarterly Economic Survey for Q4 of 2010 paints a more sobering picture. It suggests that there is significant heterogeneity in the balance of firms that plan to increase investment in training, by both sector and size class (in the manufacturing sector). The balance is +12 percent for the manufacturing sector, and a much lower +7 percent for the services sector. In the manufacturing sector, the balance is +30 for medium sized (200-499 employees) manufacturing firms, but it is -1 for micro (1-19 employees) and +11 for small (20-199 employees) firms. In the services sector, by contrast, there is much less variation by size class. The balance figures for for micro, small and medium sized firms are 0 percent, +10 percent and +3 percent, respectively.
At the time of the last recession in the UK, there was a 15 percent decline in the number of apprentices from about 367,000 in the spring of 1989 to about 312,000 in the spring of 1992. As such, apprenticeship as a percentage of employment was mildly pro-cyclical. But the impact of the nineties’ recession on apprenticeship was small, with the apprentice-to-employee ratio in the early nineties roughly the same as the corresponding ratio in the early to mid eighties.116
However, the latest recession did not have a negative impact on the number of apprenticeships. The number of apprenticeships started and achieved, for both Level 2 and Level 3, increased year-on-year between 2005-06 and 2008-09 (Figure 23). Given that the trend in the number of apprenticeship starts is upward sloping, especially for Level 2 apprenticeships, and in the absence of a counterfactual, it is difficult to draw firm conclusions about the impact of government policy on
116 Felstead, 1996
72

Productivity and the Economic Cycle
apprenticeship starts during the recession. However, it would possibly be safe to conclude that government intervention played a role in sustaining the upward trend in apprenticeship starts in 2008-09. There was a decrease in the ratio of achievements to starts in 2007-08 relative to 2006-07, from 62 percent to 50 percent for Level 2 apprenticeships, and from 59 percent to 50 percent for Level 3 apprenticeships. However, in 2008-09, the ratio rose again, to 62 percent and 56 percent, respectively.
Figure 23: Apprenticeships starts and achieved
Source: Statistical First Release archive of The Data Service
Overall, the evidence suggests that skill formation in the workforce was not adversely affected by the recession. Investment in higher and further education and apprenticeships increased during 2007-08 and 2008-09. Training for the employed labour force was somewhat more affected by the downturn. However, data suggests that a sizeable majority of the companies may have maintained their investment in training and skill formation.
6.3 Outlook for skills
Data suggest that the recession did not have a significant negative impact on skill formation, which is consistent with the observation that in developed countries investment in human capital is generally counter-cyclical or unaffected by business
73

Productivity and the Economic Cycle
cycles. However, the data itself does not address an important issue that have implications for innovation and productivity growth in the UK in the longer run.
UK policies on skill development emphasise spread of Level 2, Level 3 and first degree (or undergraduate) qualifications.117 While this raises the average productivity of the workforce, it is not obvious as to whether this will enable the UK to emerge as a “technology” leader which is likely to benefit more from a new product or process than those who adapt to it later. Indeed, progression of a significant proportion of the workforce beyond school education and the first university degree, might have to be an important component of the government’s strategy for skill development.
117 For example, while a very large proportion of the students who graduate with an undergraduate qualification are domiciled in the UK, the proportion of UK domiciled students who graduate with a postgraduate qualification has declined from 55 percent in 1994-95 to 35 percent in 2008-09.
74

Productivity and the Economic Cycle
7. Business Investment The decline in business investment was much more rapid during the
most recent recession than during the recession of the 1980s and the 1990s
Further levels of business investment will depend on uncertainty about
future economic growth, availability and cost of credit While the quantity of business investment for the medium run is difficult
to predict, the quality of the investment is likely to improve
Data for G7 countries suggest that aggregate business investment is pro-cyclical, and also more volatile than output.118 Data suggest that while business investment declines with output during recessions, it lags output growth during the early part of the recovery period.
The impact of a financial crisis on business investment could be more severe. Recessions induced by financial crises generally last longer than cyclical recessions, an average of 1.9 years in case of the former as opposed to a few months for the latter.119 The subsequent recovery is also generally weaker, especially if the extent of financial restructuring is significant. The (potentially self-fulfilling) expectation about weak future demand has adverse implications for demand for credit and business investment. The problem of a weak appetite for credit and investment on the part of the companies could be further aggravated if the recovery is fraught with macroeconomic uncertainties.
Financial crises also affect the supply of credit adversely, as banks and other financial institutions become risk averse and as the credit worthiness of borrowers is reduced by weak economic growth. As a consequence, recapitalisation of banks, whether by way of government interaction or by way of lower dividend and bonus payouts, is a necessary but not a sufficient condition for increase in the flow of credit in the aftermath of financial crises. It is also difficult to identify firms that are most likely to find it difficult to finance their investment needs. Evidence from countries such as South Korea, which have experienced severe financial crises in the recent past, suggests that post-crisis distribution of credit is influenced not by firm characteristics such as size, but by banks’ perceptions about the efficiency of the potential borrowers.120 Prior to the crisis, firms connected to the large, highly
118 Fiorito and Kollintzas, 1994 119 Rogoff and Reinhardt, 2009 120 Borensztein and Lee 2002
75
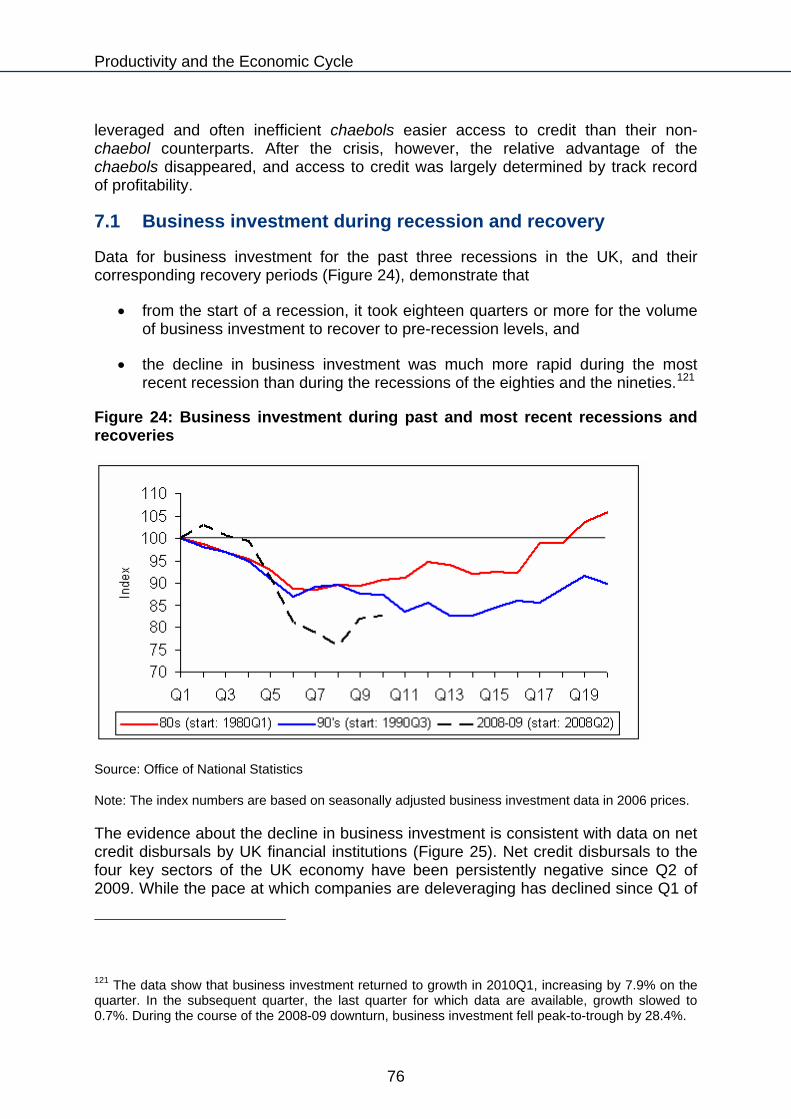
Productivity and the Economic Cycle
leveraged and often inefficient chaebols easier access to credit than their non-chaebol counterparts. After the crisis, however, the relative advantage of the chaebols disappeared, and access to credit was largely determined by track record of profitability.
7.1 Business investment during recession and recovery
Data for business investment for the past three recessions in the UK, and their corresponding recovery periods (Figure 24), demonstrate that
from the start of a recession, it took eighteen quarters or more for the volume of business investment to recover to pre-recession levels, and
the decline in business investment was much more rapid during the most recent recession than during the recessions of the eighties and the nineties.121
Figure 24: Business investment during past and most recent recessions and recoveries
Source: Office of National Statistics
Note: The index numbers are based on seasonally adjusted business investment data in 2006 prices.
The evidence about the decline in business investment is consistent with data on net credit disbursals by UK financial institutions (Figure 25). Net credit disbursals to the four key sectors of the UK economy have been persistently negative since Q2 of 2009. While the pace at which companies are deleveraging has declined since Q1 of
121 The data show that business investment returned to growth in 2010Q1, increasing by 7.9% on the quarter. In the subsequent quarter, the last quarter for which data are available, growth slowed to 0.7%. During the course of the 2008-09 downturn, business investment fell peak-to-trough by 28.4%.
76

Productivity and the Economic Cycle
2010, as the economy embarked on the path to recovery, the net lending levels continue to be negative.
Figure 25: Quarterly net lending flows (by UK MFIs)
Source: Bank of England
7.2 Outlook for Business Investment
Future levels of business investment in the UK will depend on a number of factors. Companies are unlikely to step up investment significantly unless there is a decline in the uncertainty about the future of economic growth in the industrialised world. Thereafter, the growth of investment would depend in part on the demand for the companies’ goods and services, and in part on the availability and cost of credit. The cost of capital is likely to be higher in future than in the previous business cycle, when risk was systematically underpriced.
However, given the level of uncertainty, demand, interest rates and other factors that affect business environment, credit could flow to the more innovative and efficient companies, and companies themselves are more likely to opt for projects, products and processes that make more efficient use of available financial resources. There could, therefore, be a greater impact per dollar of business investment on output, with positive implications for productivity. In other words, while the trend for the quantity of business investment for the medium run is difficult to predict, the quality of the investment is likely to improve.
77

Productivity and the Economic Cycle
8. Innovation A relatively smaller proportion of firms in the UK appear to undertake
innovation compared with some other industrialised countries, whether technological or non-technological, and this is apparent in both manufacturing and services. This is a consequence of low incidence of innovation among SMEs
The impact of the financial crisis and the recession on innovation is yet
to be well understood as data are not yet available. However, there are indications that around a third of firms were incurring intangible investments during the recession
The main challenges in the UK are structural in nature and require the
existence of an innovation system that facilitates collaboration both between and among creators such as universities and users of knowledge such as businesses
The importance of innovation in driving productivity growth is well documented in the academic literature. It has been recognised that traditional measures of innovation such as R&D expenditures underestimate the extent of innovation that is undertaken by companies. Indeed, according to OECD estimates, R&D was undertaken by around a third of all UK firms in 2002 - 2004. R&D intensity is particularly low among SMEs. Only in Canada (49.3 percent), Germany (33 percent) and South Korea (40.9 percent) do more than a third of SMEs perform R&D. By contrast, more than 60 percent of large firms perform R&D in most countries, with fewer than 50 percent of large firms performing R&D only in Japan (47.9 percent) and New Zealand (53.5 percent).122 In the UK, 32.4 percent of SMEs and 53.5 percent of large firms perform R&D. The proportion of companies that undertake R&D continuously is lower still.123 Hence, innovation is increasingly interpreted to include a wider range of activities than just research and development (R&D).124
Evidence from developed countries125 suggests that larger firms are more likely to undertake innovation, especially if they have international exposure. Both the likelihood of undertaking innovation and the magnitude of investment in innovation are higher for companies that belong to groups and those that cooperate with other companies. Interestingly, the likelihood of innovation is also positively correlated with
122 Data for Australia are not available. 123 OECD, 2009 (Table S-13) 124 OECD, 2009 (Chapters 1 & 2) 125 OECD, 2009 (Table 3.2)
78

Productivity and the Economic Cycle
the companies’ perceptions about the difficulties in accessing factor and product markets. In part, this could be on account of endogeneity, i.e., companies discovering barriers to market access only when they try to innovate. However, this could also indicate that existence of barriers necessitate innovation to sustain growth despite the barriers.
As mentioned earlier, the scope for innovation arguably increases significantly during periods of economic downturn. It is generally accepted that a company’s ability to undertake R&D and incur certain other kinds of expenditure is cyclical, and hence such expenditures are likely to be low during periods of downturn. However, as the opportunity cost of a company’s resources is reduced on account of the downturn, it has a greater opportunity to reorganise production and other business processes without sacrificing growth.
8.1 Policy discussion in the UK
Evidence reported by the OECD and highlighted in Table 11 suggests the following about innovation in the UK:
Overall, a relatively small fraction of the firms undertake innovation. Fewer than 40 percent of surveyed firms undertake process or product innovation. A similarly small proportion of firms undertake non-technological innovation.126 While cross-country comparisons are inherently difficult for a variety of reasons, data suggest that the incidence of innovation is noticeably lower than in Germany which is widely recognised as being a technology and productivity leader.
The low incidence of innovation is apparent in both the manufacturing and services sectors.
This low incidence of innovation is a consequence of low incidence of innovation among SMEs. About 60 percent of larger firms undertake product or process innovation, as also non-technological innovation.
126 This is consistent with more recent information which suggests that, uring the 2006-08 period. 27.1 percent of firms undertake either product or process innovation, while only 26.5 percent of the firms undertake wider innovation. The corresponding figures for SMEs are 26 percent and 24.5 percent, respectively (from BIS, 2010).
79
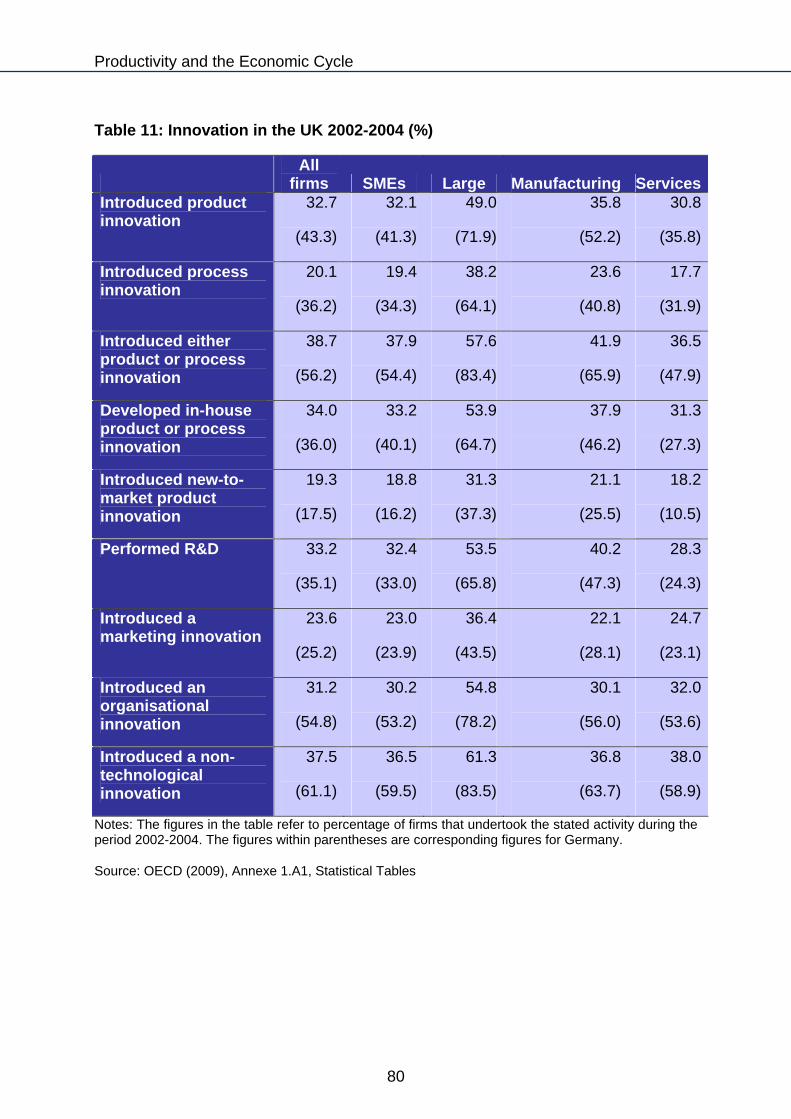
Productivity and the Economic Cycle
Table 11: Innovation in the UK 2002-2004 (%)
All
firms SMEs Large Manufacturing ServicesIntroduced product innovation
32.7
(43.3)
32.1
(41.3)
49.0
(71.9)
35.8
(52.2)
30.8
(35.8)
Introduced process innovation
20.1
(36.2)
19.4
(34.3)
38.2
(64.1)
23.6
(40.8)
17.7
(31.9)
Introduced either product or process innovation
38.7
(56.2)
37.9
(54.4)
57.6
(83.4)
41.9
(65.9)
36.5
(47.9)
Developed in-house product or process innovation
34.0
(36.0)
33.2
(40.1)
53.9
(64.7)
37.9
(46.2)
31.3
(27.3)
Introduced new-to-market product innovation
19.3
(17.5)
18.8
(16.2)
31.3
(37.3)
21.1
(25.5)
18.2
(10.5)
Performed R&D 33.2
(35.1)
32.4
(33.0)
53.5
(65.8)
40.2
(47.3)
28.3
(24.3)
Introduced a marketing innovation
23.6
(25.2)
23.0
(23.9)
36.4
(43.5)
22.1
(28.1)
24.7
(23.1)
Introduced an organisational innovation
31.2
(54.8)
30.2
(53.2)
54.8
(78.2)
30.1
(56.0)
32.0
(53.6)
Introduced a non-technological innovation
37.5
(61.1)
36.5
(59.5)
61.3
(83.5)
36.8
(63.7)
38.0
(58.9)
Notes: The figures in the table refer to percentage of firms that undertook the stated activity during the period 2002-2004. The figures within parentheses are corresponding figures for Germany.
Source: OECD (2009), Annexe 1.A1, Statistical Tables
80

Productivity and the Economic Cycle
Economists at the National Endowment for Science, Technology and the Arts (NESTA) argue that innovation has played an important role in driving labour productivity growth in the UK - it accounted for about two-thirds of the growth in labour productivity between 2000 and 2007.127 They estimate innovation related expenditures of the private sector, in 2007, to be £133.4 billion, i.e., 14 percent of the private sector gross value added. Training and skills development (24 percent), organisational improvement (19.5 percent), design (16.5 percent) and software development (15 percent) account for a significant proportion of this expenditure. R&D accounts for a smaller proportion of the gross value added.
This is consistent with the data from the UK Innovation Survey 2009, highlighted in Figure 26, which suggests that acquisition of capital that embody technological progress accounted for at least as high a proportion of 2008 expenditures as internal R&D.
Figure 26: Innovation across sectors
Source: UK Innovation Survey 2009: Science and Innovation Analysis (Figure 2.6)
The Innovation Survey 2009 also suggests that about 27 percent of the surveyed firms reported having undertaken “wider” forms of innovation such as changes in corporate strategy and organisational structure. As in the case of product and process innovation, wider innovation is more common among large firms (39 percent) than among small firms (24.5 percent). The incidence of wider innovation was
127 NESTA, 2009
81
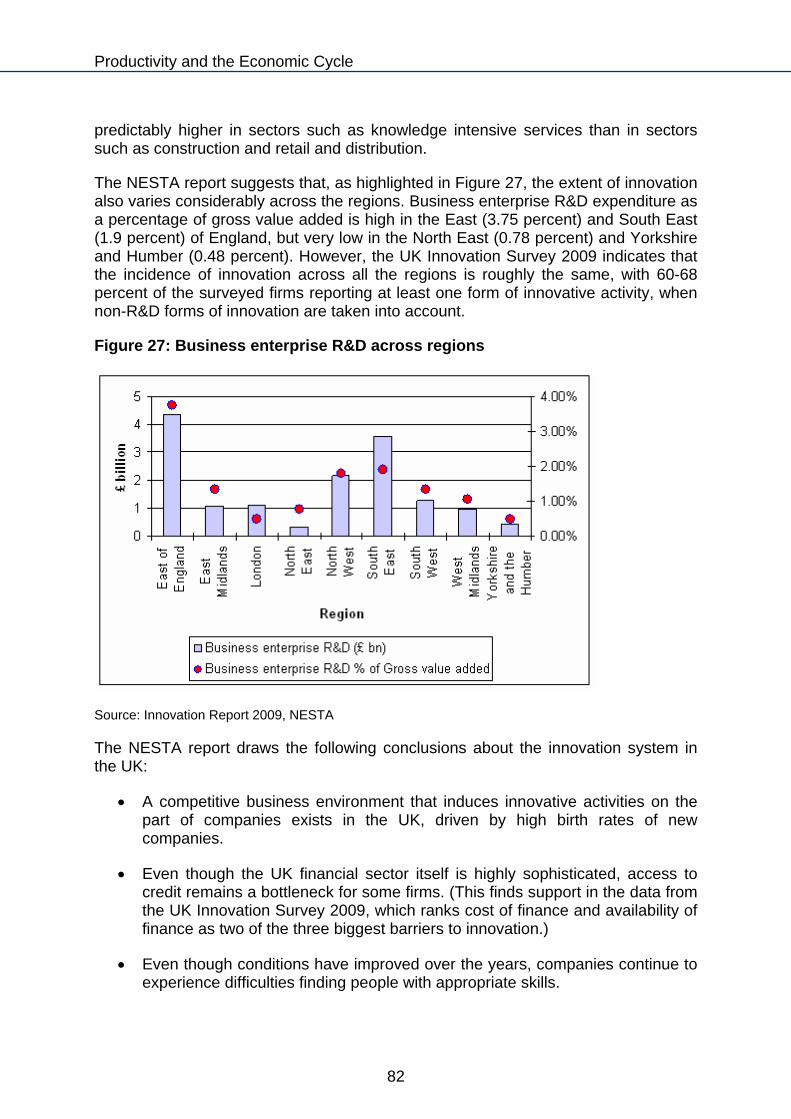
Productivity and the Economic Cycle
predictably higher in sectors such as knowledge intensive services than in sectors such as construction and retail and distribution.
The NESTA report suggests that, as highlighted in Figure 27, the extent of innovation also varies considerably across the regions. Business enterprise R&D expenditure as a percentage of gross value added is high in the East (3.75 percent) and South East (1.9 percent) of England, but very low in the North East (0.78 percent) and Yorkshire and Humber (0.48 percent). However, the UK Innovation Survey 2009 indicates that the incidence of innovation across all the regions is roughly the same, with 60-68 percent of the surveyed firms reporting at least one form of innovative activity, when non-R&D forms of innovation are taken into account.
Figure 27: Business enterprise R&D across regions
Source: Innovation Report 2009, NESTA
The NESTA report draws the following conclusions about the innovation system in the UK:
A competitive business environment that induces innovative activities on the part of companies exists in the UK, driven by high birth rates of new companies.
Even though the UK financial sector itself is highly sophisticated, access to credit remains a bottleneck for some firms. (This finds support in the data from the UK Innovation Survey 2009, which ranks cost of finance and availability of finance as two of the three biggest barriers to innovation.)
Even though conditions have improved over the years, companies continue to experience difficulties finding people with appropriate skills.
82
Productivity and the Economic Cycle
Companies in the UK are less open to ideas from overseas, and are also less likely to use customers as a source for innovation than the leading countries. They are also less likely to buy high tech products that facilitate or even embody innovation.
While research institutions in the UK, many of which receive public support for their research, have sustained their international reputation, collaboration between these institutions and the industry continues to be low.
Over past five years, a number of reports128 have examined ways to improve innovation in the UK. Many of them emphasise R&D and technological innovation more than non-technological innovation, and this is not surprising given the emerging consensus that the UK economy has to be rebalanced, towards manufacturing and away from financial services and the construction-property industries. However, there is also recognition that other forms of innovation can be more suitable for industries in which UK’s position as a global leader should be preserved. Most importantly, the reports strongly endorse the “innovation system” paradigm, encouraging much greater cooperation between creators of knowledge such as universities and users of knowledge such as businesses, and also encouraging creation of infrastructure and institutions that facilitate rapid dispersion of created knowledge.
8.2 Innovation during Recession and Recovery
The impact of the financial crisis and the recession on innovation is yet to be well understood. Indeed, time series data that can facilitate comparison of UK’s R&D investment and intangible investment before, during and after the recession are not available for the 2008-2010 period (Figure 28).129
128 These include the Cox Report (2005), vury Report (2007), Dyson Report (2010), and Hauser Report (2010) 129 Intangible investments include expenditure on software, design, advertising, mineral exploration, as well as tangible investments (Tang) in capital goods such as computer hardware.
83
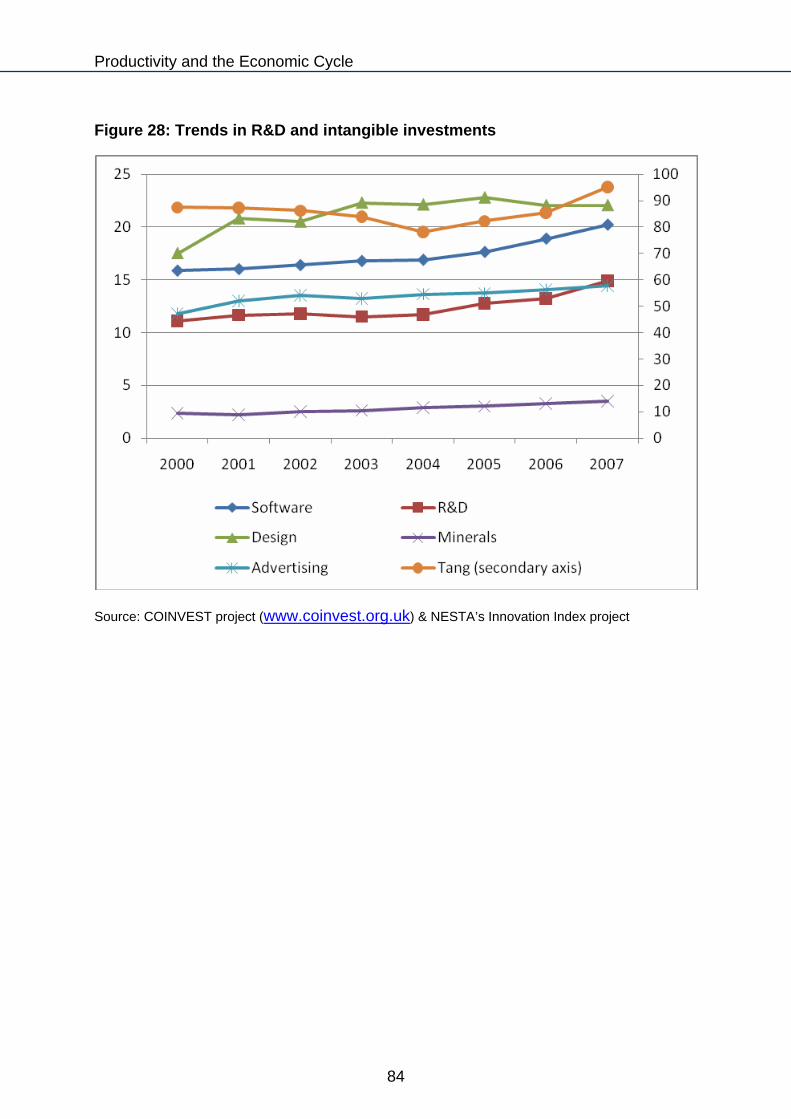
Productivity and the Economic Cycle
Figure 28: Trends in R&D and intangible investments
Source: COINVEST project (www.coinvest.org.uk) & NESTA’s Innovation Index project
84

Productivity and the Economic Cycle
Figure 29: Innovation during the recession
Source: Economic & Labour Market Review, Vol. 4, No. 7, July 2010
However, a survey launched by the Office of National Statistics (ONS) in October 2009 provides a snapshot of innovation during the recession period. It suggests that during the recession a small fraction of firms were investing in R&D, and R&D expenditure was higher, on average, among manufacturing companies than among services sector companies (Figure 29), as during normal times.
Data on the wider measures of innovation, which includes activities such as corporate restructuring which become particularly important during recessions, do not permit comparison of intangible investments before, during and after the recession. However, data collected by the ONS suggest that a fair proportion of firms were making intangible investments, particularly in training and software (Figure 29). Hence, there is perhaps some scope for optimism about the extent of innovation in the UK during the recession.
8.3 Outlook for innovation
The main challenges for innovation in the UK are structural in nature. As noted earlier (Table 11), a significantly smaller proportion of firms in the UK are involved in either product and process innovation compared to global leaders such as Germany. This is true for both the manufacturing and services sectors. The gap is particularly large for organisational innovation and non-technological innovation. The gap vis-à-vis global leaders is large for both SMEs and large firms. By contrast, the gap is negligible for the proportion of firms that undertake R&D. The emphasis of any policy aimed at enhancing innovation therefore has to be on non-R&D innovation.
85

Productivity and the Economic Cycle
It has also been recognised that rapid and continual innovation requires the existence of an innovation “system” that facilitates collaboration among creators and users of knowledge. This requires interaction among creators and users of knowledge – e.g., interaction between universities within countries and across international borders – and between creators of knowledge such as universities and users of knowledge such as businesses. It also requires interaction between companies and end-users of their products to facilitate demand-driven innovation, and interaction among companies to facilitate rapid spread of business best practices.
Traditionally, the role of government in fostering innovation has been viewed through the lens of fiscal incentives like tax credit for R&D expenditure. However, the wider definition of innovation, and the increasing emphasis on cooperation and collaboration within an innovation system also emphasises the role of a government as a facilitator for such collaboration, e.g., by putting in place the necessary infrastructure and an appropriate system of intellectual property rights. In the absence of a well-thought out strategy that encompasses the private and higher education sectors, and facilitates both their interaction with each other and their integration into the global innovation eco-system, innovation may prove to be the most significant bottleneck for productivity growth in the longer run.
86
Productivity and the Economic Cycle
9. Outlook for productivity growth in recovery The cyclical aspects of the recession are unlikely to have an impact on productivity growth during the course of the recovery. To recapitulate, available information about the impact of the recession on the determinants of productivity suggests the following:
Early-stage entrepreneurial activity has proved resilient in the aftermath of the recent recession, even though access to finance proved difficult for nascent entrepreneurs.
There was an increase in the number of insolvencies during this recession but it is not obvious whether this was chiefly driven by Schumpeterian dynamics or short term financial pressures. There are indications that the gap between the UK goods market efficiency with the USA and Germany has declined since the onset of the recession. The prognosis for the UK labour market efficiency is quite favourable
There has been a sharp increase in the demand for university places during the recession and this trend is continuing during the subsequent recovery. While training may have been adversely impacted by the recession, neither enrolment in FE and HE institutions nor apprenticeships were adversely affected. Hence, as business investment recovers towards the pre-recession level, and companies invest in their future growth, they are likely to have access to a larger pool of skilled workers.
The decline in business investment was much more rapid during the most recent recession than during the recession of the 1980s and the 1990s. While the typically pro-cyclical nature of business investment may be suggestive of a positive outlook, further levels of business investment will be affected by uncertainty about future economic growth, availability and cost of credit130. Although the quantity of business investment for the medium run is difficult to predict, the quality of the investment is likely to improve
The impact of the financial crisis and the recession on innovation is yet to be well understood as data are not yet available. However, there are indications that around a third of firms were incurring intangible investments during the recession
130 Indeed, whether business investment recovers to the pre-crisis levels would also depend on the change in composition of UK’s industrial sector, and on future strategic initiatives of companies. For example, there might be faster growth in industries that are less capital intensive. Equally, companies might emphasise investment in intangibles much more than investment in tangible assets such as capital.
87

Productivity and the Economic Cycle
88
If, therefore, the business environment in the UK provides the incentive for companies to adopt new technologies and innovate to develop better products and processes, as such, they may not be constrained by availability of basic factor inputs such as capital (which also embodies technology) and (skilled) labour. However, structural problems may impede the pace of productivity growth. These include:
Enterprise is hindered by risk aversion and lack of ambition; both growth ambitions and rates of innovation are low among a wide range of UK businesses, and early-stage entrepreneurial activity in the UK is still lower than in the USA and emerging economies
Competition may discourage innovation among firms that are far away from the technology frontier and this may be the reason why innovation levels are low among a sizeable proportion of firms in the UK
The weakness of UK infrastructure compared with other industrialised economies is a concern regularly expressed by business and can be traced back to low levels of investment over long time periods. The future of the UK infrastructure is likely to depend on the ability to sustain investment in the present fiscal and financial environment and on the ability successfully to implement productivity-augmenting flexible working to mitigate transport congestion. The latter in turn will depend on digital infrastructure quality
Even though the recession did not have a significant impact on skill formation, it is not obvious whether this will enable the UK to emerge as a technology leader given the existing weaknesses in the skill base compared to other industrialised countries. Furthermore, while the skills policies might increase the average skill level of the working population – an important goal by its own right – it is not obvious whether the emphasis on Level 2, Level 3 and first (or undergraduate) degree qualifications will enable the UK to emerge as a global technology leader
A relatively smaller proportion of firms in the UK undertake innovation compared with some other industrialised countries, whether technological or non-technological, and this is apparent in both manufacturing and services. This is a consequence of low incidence of innovation among SMEs. Furthermore, it is not obvious as to whether interaction between the private sector and HE institutions, and also between UK companies and universities and their counterparts in other countries will grow at a pace that is consistent with the UK becoming a pivotal node for the global innovation eco-system. More data and a careful analysis are required to take a view on this issue.

Productivity and the Economic Cycle
References Aghion, P. et al. (2005) ‘Competition and innovation: An inverted-U relationship’, Quarterly Journal of Economics, 120, 2, pp. 701-728
Aghion, P. et al. (2004) 'Entry and productivity growth: Evidence from micro-level panel data', Journal of the European Economic Association, Vol. 2, 2-3, pp. 265-276
Aiginger, K. (2007) ‘Industrial Policy: A Dying Breed or a Re-Emerging Phoenix’, Journal of Industrial Competition and Trade, Vol. 7, pp. 297-323
Arrow, K.J. (1962) ‘Economic Welfare and the Allocation of Resources for Inventions’, in R.R. Nelson (Ed.), The Rate and Direction of Inventive Activity, Princeton, NJ Princeton University Press
Arthur, W.B. (1989) ‘Competing Technologies, Increasing Returns, and Lock-in by Historical Events’, Economic Journal, Vol. 99, pp. 116-131
Bailey, D., Harte, G. and Sugden, R. (1994) Transnationals and Governments: Recent Policies in Japan, France, Germany, the United States, and Britain, Routledge, London
Barba Navaretti G. and Venables A.J. (2004) Multinational Firms in the World Economy, Princeton University Press, Princeton
Bartelsman, E.J. and Doms, M. (2000) 'Understanding Productivity: Evidence from Longitudinal Microdata', Journal of Economic Literature, Vol. 38, pp. 569-594
Baumol, W.J. and Gomory, R.E. (2000) Global trade and conflicting national interests, MIT Press, Cambridge MA
Baumol, W. J. and Gomory R.E. (2004) ‘Globalization: prospects, promise, and problems’, Journal of Policy Modelling, Vol. 26, pp. 425-438
BCC (2010) 'Reconnecting Britain: A Business Infrastructure Survey'
BCC (2007) 'UK Skills: Making the Grade'
Bergek A., Jacobsson, S., Hekkert M. and Smith K. (2007) ‘Functionality of Innovation Systems as a Rationale for and Guide to Innovation Policy’, RIDE/IMIT Working Paper, 84426-006
Bernsen, J. (1987) ‘Design in Action’, in Design Management in Practice, Danish Design Council, Copenhagen
BIS (2010) 'UK Innovation Survey 2009: Science and Innovation Analysis' (and Statistical Annexe to the survey available at http://www.bis.gov.uk/policies/science/science-innovation-analysis/cis)
89

Productivity and the Economic Cycle
BIS (2010, March) 'Skills for Growth: the National Skills Strategy'', Economic Paper, No. 4
Borensztein, E. and Lee, J.-W. (2002) 'Financial Crisis and Credit Crunch in Korea: Evidence from Firm-Level Data', Journal of Monetary Economics, Vol. 49, 4, pp 853-875
Cantwell J. (Ed. 2004) Globalization and the location of firms, Edward Elgar, Cheltenham
Carlsson B. and Jacobsson S. (1997) ‘In Search of Useful Public Policies: Key Lessons and Issues for Policy Makers’ in Carlsson, B. (Ed.) Technological Systems and Industrial Dynamics, Kluwer Academic Publishers, Dordrecht
Caves, R.E. (2007) Multinational Enterprise and Economic Analysis, 3rd Edition, Cambridge University Press, Cambridge
CBI (2010) 'London business survey: Midyear review'
CBI (March 2010) 'Tackling Congestion, Driving Growth: A New Approach to Roads Policy'
CBI (2009) 'Enterprise Policy Framework', SME Council paper
CEC (2009) ‘Design as a Driver of User-Centred Innovation’, Commission Staff Working Document, SEC 501 final
Egert, B., et al. (2009) 'Infrastructure and Growth: Empirical Evidence', CESIFO working paper, no. 2700
Chaminade, C. and Edquist C. (2006) ‘From Theory to Practice: The Use of the Systems of Innovation Approach for Innovation Policy’, in J. Hage and M. Meeus (Eds.), Innovation, Science and Institutional Change, Oxford University Press, Oxford
Cowling, K. (1999) Industrial policy in Europe: theoretical perspectives and practical proposals, Routledge, London
Cowling, K. and Sugden R. (1999) ‘The Wealth of Localities, Regions and Nations: Developing Multinational Economies’, New Political Economy, Vol. 4, pp. 361-378
Cox, G. (2005) Cox Review of Creativity in Business, HMT, London
Craft, N. (2009) 'Transport Infrastructure Investment: Implications for Growth and Productivity' Oxford Review of Economic Policy, Vol. 25, 3, pp. 327-343
Dasgupta, P. (1987) ‘The Economic Theory of Technology Policy’, in P. Dasgupta and P. Stoneman (Eds.), Economic Policy and Technological Performance, Cambridge University Press, Cambridge
Dasgupta, P. (1988) ‘The Welfare Economics of Knowledge Production’, Oxford Review of Economic Policy, Vol. 4, pp. 1-12
90

Productivity and the Economic Cycle
David, P.A. (1985) ‘Clio and the Economics of QWERTY’, American Economic Review, Vol. 75, pp. 332-336
Davies, S., et al., (2004) 'The Benefits from Competition: Some Illustrative UK Cases', DTI economics paper, No. 9
Design Council website, http://www.designcouncil.org.uk/
Design Council (1995) Definitions of Design, Design Council, London
Design Council (2009) Design Bugs Out, Design Council, London
DIUS (2008) Annual Innovation Report 2008,
Dobrinsky, R. (2009) ‘The Paradigm of Knowledge-Oriented Industrial Policy’, Journal of Industrial Competition and Trade, forthcoming (published online, 8th May 2009)
DTI (2005) ‘Creativity, Design and Business Performance’, Economics Paper, No. 15
DTI (2006) 'UK productivity and competitiveness indicators', Economics paper, no. 17
DTI & KPMG (June 2007) 'Peer review of competition policy'
Dunning, J.H. (ed. 1997) Governments, Globalization and International Business, Oxford University Press, Oxford
Dunning, J.H. and Lundan S.M. (2008) Multinational enterprises and the global economy, 2nd Edition, Edward Elgar Publishing
Dyson, J. (2010) Ingenious Britain: Making the UK the Leading High Tech Exporter in Europe, The Conservative Party
Edquist, C. (1997, Ed.) Systems of Innovation, Technologies, Institutions and Organisations, Pinter, London
Edquist, C. (2001) ‘Innovation Policy: a Systemic Approach’, in Archibugi D. and Lundvall, B.-Å. (Eds.) The Globalizing Learning Economy, Oxford University Press, Oxford
Encyclopaedia Britannica (1968) ‘Design’, Encyclopaedia Britannica, Volume 7, William Benton Publisher, Chicago
Felstead, A. et al., (2007) Skills at Work, 1986 to 2006, SKOPE and ESRC, Oxford
Felstead, A. and Green, F. (1996) 'Training implications of regulation compliance and business cycles', in Booth, A. and Snower, D. (Eds.) Acquiring Skills, Cambridge University Press, pp. 257-283
Fernald, J. G., (1999) 'Roads to Prosperity? Assessing the Link Between Public Capital and Productivity', American Economic Review, Vol. 89, pp. 619-638
91

Productivity and the Economic Cycle
Fiorito, R. and Kollintzas, T. (1994) 'Stylized Facts of Business Cycles in the G7 from a Real Business Cycle Perspective', European Economic Review, Vol. 38, pp. 235-269
Foxon, T. (2006) ‘The Rationale for Policy Interventions from an Innovation Systems Perspective’, in J. Murphy (Ed.) Governing Technology for Sustainability, Earthscan, London
Freeman, C. (1987) Technology and Economic Performance: Lessons from Japan, Pinter Publishers, London
Görg, H. and Strobl E. (2003) ‘Footloose Multinationals?’, The Manchester School, Vol. 71, 1–19
Granovetter, M. (1983) ‘The Strength of Weak Ties: A Network Theory Revisited’, Sociological Theory, Vol. 1, pp. 201-233
Granovetter, M. (1985) ‘Economic Action and Social Structure: The Problem of Embededness’, American Journal of Sociology, Vol. 91, pp. 481-510
Greenpeace (n.d.) A Greener Apple, http://www.greenpeace.org/apple/
Hauknes, J. and Nordgren L. (1999) Economic Rationales of Government Involvement in Innovation and the Supply of Innovation-Related Services, STEP Report R-08, Step Group, Oslo
Hauser, H. (2010) The Current and Future Role of Technology and Innovation Centres in the UK, BIS
HMG (2007) The Race to the Top: A Review of Government’s Science and Innovation Policies, by Lord Sainsbury of Turville
HMT (2010) ‘Budget 2010’
HMT (October 2010) ‘National Infrastructure Plan’
HMT & BIS (2010) 'Financing a private sector recovery’
HMT (2009) ‘Budget 2009: Building Britain’s Future’
HMT and BERR (2008) 'Enterprise: Unlocking the UK’s Talent'
HMT and DfT (2006) 'The Eddington Transport Study'
HMT (2005) 'Cox Review of Creativity in Business: Building on the UK’s Strengths'
Hood, N. and Young S. (1997) ‘The United Kingdom’, In Dunning, J.H. (Ed.), Governments, Globalization and International Business, Oxford University Press, Oxford
92

Productivity and the Economic Cycle
House of Commons Business and Enterprise Committee (2008-2009), 'Enterprise Finance Guarantee Scheme, Tenth Report of Session 2008-09'
Janis, I. (1972) Victims of Groupthink, Houghton Mifflin, Boston
Janis, I. (1982) Groupthink: Psychological studies of policy decisions and fiascos, 2nd edition, Houghton Mifflin, Boston
Jiménez, G., Lopez, J.A. and Saurina, J. (2007) 'How Does Competition Impact Bank Risk Taking?', Federal Reserve Bank of San Francisco Working Paper, No. 2007-23
Koopman, G.J. and Szekely I.P. (2009), ‘The financial crisis and potential growth: Policy challenges for Europe,’ ECFIN Economic Brief, Issue 3
Leahy, D. and Neary J.P. (1996) ‘International R&D Rivalry and Industrial Strategy without Government Commitment’, Review of International Economics, Vol. 4, pp. 322 – 338
Leahy, D. and Neary J.P. (2001) ‘Robust Rules for Industrial Policy in Open Economies’, CEPR Discussion Paper, No. 2731. Available at SSRN: http://ssrn.com/abstract=266621
Lundvall, B.-Å. (1992) National Systems of Innovation: Towards a Theory of Innovation and Interactive Learning, Pinter Publishers, London
Lundvall, B.-Å. (2001) ‘Innovation Policy in the Globalizing Learning Economy’, in D. Archibugi and B.-Å. Lundvall (eds.) The Globalizing Learning Economy, Oxford University Press, Oxford, pp. 273-292
Lundvall, B.-Å. (2007) ‘National Innovation Systems: Analytical Concept and Development Tool’, Industry and Innovation, Vol. 14, pp. 95-119
Lundvall, B.-Å. and Borras S. (1997) The Globalising Learning Economy: Implications for Innovation Policy, Report Based on Contributions from Seven Projects under the TSER Programme DG XII, Commission of the European Union, Available at: ftp://ftp.cordis.lu/pub/tser/docs/globeco.doc
Lundvall, B.-Å. and Borras S. (2004) ‘Science, Technology and Innovation Policy’, in J. Fagerberg, D.C. Mowery and R.R. Nelson (Eds.), The Oxford Handbook of Innovation, Oxford University Press, Oxford
Lynn, J. and Jay A. (1983) Yes Minister, Vol. 3, BBC, London
Malerba, F., Nelson, R., Orsenigo L. and Winter S. (1999) ‘History-Friendly Models of Industry Evolution: The Computer Industry’ Industrial and Corporate Change, Vol. 8, pp. 3-40
Malerba, F. (2009) ‘Increase Learning, Break Knowledge Lock-ins and Foster Dynamic Complementarities: Evolutionary and System Perspectives on Technology Policy in Industrial Dynamics’ in D. Foray (Ed.) The New Economics of Technology Policy, Edward Elgar Publishing, Cheltenham
93

Productivity and the Economic Cycle
Metcalfe, J.S. (1994) ‘Evolutionary Economics and Technology Policy’, The Economic Journal, Vol. 104, pp. 931-944
Metcalfe, J.S. (1995a) ‘Technology Systems and Technology Policy in an Evolutionary Framework’, Cambridge Journal of Economics, Vol. 19, pp. 25-46
Metcalfe, J.S. (1995b) ‘The Economic Foundations of Technology Policy: Equilibrium and Evolutionary Perspectives’, in P. Stoneman (Ed.), Handbook of the Economics of Innovation and Technological Change, Blackwell Publishers, Oxford
Metcalfe, J.S. (2003) ‘Equilibrium and Evolutionary Foundations of Competition and Technology Policy’ in Pelikán P. and Wegner G. (Eds.) The Evolutionary Analysis of Economic Policy: New Horizons in Institutional and Evolutionary Economics, Edward Elgar Publishing, Cheltenham
Metcalfe, J.S. and Georghiou L. (1997) ‘Equilibrium and Evolutionary Foundations of Technology Policy’, CRIC Discussion Paper No. 3, Centre for Research on Innovation and Competition, University of Manchester
Moultrie J. and Livesey F. (2009) International Design Scoreboard: Initial Indicators of International Design Capabilities, Design Council, London
Mytelka, L. and Smith K. (2002) ‘Policy Learning and Innovation Theory: An Interacting and Co-Evolving Process’, Research Policy, Vol. 31, pp. 1467-1479
Navarro, L. (2003) ‘Industrial Policy in the Economic Literature: Recent Theoretical Developments and Implications for EU Policy’, European Commission Enterprise Papers, No. 12,
Nelson, H.G. and Stolterman, E. (2003) ‘The Design Way: Intentional Change in an Unpredictable World : Foundations and Fundamentals of Design Competence’, Educational Technology Publications, Englewood Cliffs, NJ
Nelson, R.R. and Winter S.G. (1982) 'An Evolutionary Theory of Economic Change, Harvard University Press, Cambridge Mass
Nelson, R.R. (Ed., 1993) National Innovation Systems. A Comparative Analysis, Oxford University Press, Oxford
Nelson, R.R. (2009) ‘Building Effective Innovation Systems Versus Dealing With Market Failures as Ways of Thinking about Technology Policy’ in D. Foray (Ed.) The New Economics of Technology Policy, Edward Elgar Publishing, Cheltenham
NESTA (2009) The Innovation Index: Measuring the UK’s Investment in Innovation and Its Effects
OECD (2006) Infrastructure to 2030: Telecom, Land Transport, Water and Electricity
OECD (2009) Economic Surveys: United Kingdom
OECD (2009) Innovation in Firms: A Microeconomic Perspective, Paris
94

Productivity and the Economic Cycle
OECD (2003) The Sources of Economic Growth in OECD Countries
OFT (October 2008) Anticipated Acquisition by Lloyds TSB plc of HBOS plc: Report to the Secretary of State for Business Enterprise and Regulatory Reform
OFT (2007) Productivity and Competition: An OFT Perspective on the Productivity Debate
Olins, W. (1989) Corporate Identity: Making Business Strategy Visible Through Design, Thames and Hudson, London
Pack, H. and Saggi K. (2006) ‘The Case for Industrial Policy: a Critical Survey’, The World Bank Research Observer, Vol. 21, pp. 267-297
Parisi, M.L., Schiantarelli, F. and Sembenelli, A. (2006) 'Productivity, Innovation and R&D: Micro Evidence from Italy', European Economic Review, Vol. 50, 8, pp. 2037-2061
Pelikán, P. and Wegner G. (Eds. 2003) The Evolutionary Analysis of Economic Policy: New Horizons in Institutional and Evolutionary Economics, Edward Elgar Publishing, Cheltenham
Reimer, J.J. and Stiegert K.W. (2006) ‘Evidence on Imperfect Competition and Strategic Trade Theory’, Department of Agricultural and Applied Economics, University of Wisconsin-Madison, Staff Paper, No. 498,
Rodrik, D. (2004) ‘Industrial Policy for the Twenty-First Century’, CEPR Discussion Paper, No. 4767. Available at SSRN: http://ssrn.com/abstract=666808
Rogoff, K. and Reinhardt, C.M. (2009) 'The Aftermath of Financial Crises', American Economic Review, Vol. 99, pp. 466-472
Romer, P. (1986) ‘Increasing Returns And Long-Run Growth,’ Journal of Political Economy, Vol. 94, pp. 1002-1037
Romer, P. (1990) ‘Endogenous Technological Change’, Journal of Political Economy, Vol. 98, S71-S102
Ruskin, J. (1996) The Works of John Ruskin: The Library Edition, (Edited by Cook E.T. and Wedderburn, A.) Cambridge University Press, Cambridge
Scarpetta, S. et al. (2002) 'The Role of Policy and Institutions for Productivity and Firm Dynamics: Evidence from Micro and Industry Data', OECD Economic Department Working Paper, No. 329
Schröter, A. (2009) ‘New Rationales for Innovation Policy? A Comparison of the Systems of Innovation Policy Approach and the Neoclassical Perspective’, Jena Economic Research Paper, No. 2009-033, Max Planck Institute of Economics, Jena
95

Productivity and the Economic Cycle
Schubert, C. (2009) ‘Is Novelty always a good thing? Towards an Evolutionary Welfare Economics’, Papers on Economics and Evolution, No. 0903, Max Planck Institute of Economics, Jena
Simon, H.A. (1996) The Sciences of the Artificial, 3rd Edition, MIT Press, Cambridge, MA
Smith, K. (1992) ‘Innovation policy in an evolutionary context’, in Saviotti, P. and Metcalfe, J. S. (Eds.) Evolutionary Theories of Economic and Technological Change: Present Status and Future Prospects, Harwood Academic Publishers, Reading
Smith, K. (1997) ‘Economic Infrastructures and Innovation Systems’, in Edquist C. (Ed.) Systems of Innovation, Technologies, Institutions and Organisations, Pinter, London
Smith, K. (2000) ‘Innovation as a Systemic Phenomenon: Rethinking the role of Policy’, Enterprise and Innovation Management Studies, Vol. 1, pp. 73-102
Spencer, B.J. and Brander J.A. (1983) ‘International R&D rivalry and industrial strategy’, Review of Economic Studies, Vol. 50, pp. 707-722
Starbuck, W.H. (n.d.) ‘Organizational Research Should Involve Design, and Design Should be Discovery’, http://www.forskarskolan-mit.nu/mit/files/documents/seminarier/Design.pdf
Stoneman, P. (1987), The Economic Analysis of Technology Policy, Oxford University Press, Oxford
Swann, G.M.P. (1990) ‘Product Competition and the Dimensions of Product Space’, International Journal of Industrial Organisation, Vol. 8, pp. 281-295
Swann, G.M.P. (2000) The Economics of Standardization, Department of Trade and Industry, Oxford
Swann, G.M.P. (2003) ‘Funding Basic Research: When is Public Finance Preferable to Attainable Club Good Solutions?’ in Geuna, A. Salter A. and Steinmueller W.E. (Eds.) Science and Innovation: Rethinking the Rationales for Funding and Governance, Edward Elgar Publishing, Cheltenham
Swann, G.M.P. (2006) Putting Econometrics in its Place, Edward Elgar Publishing, Cheltenham
Swann, G.M.P. (2009) The Economics of Innovation: An Introduction, Edward Elgar Publishing, Cheltenham
Swann, G.M.P. and Birke D. (2005) ‘How do Creativity and Design Enhance Business Performance? A Framework for Interpreting the Evidence’, DTI Strategy Unit ‘Think Piece’
Tassey, G. (1982a) ‘Infratechnologies and the Role of Government’, Technological Forecasting and Social Change, Vol. 21 (2), pp. 163-180
96

Productivity and the Economic Cycle
97
Tassey, G. (1982b) ‘The Role of Government in Supporting Measurement Standards for High-Technology Industries’, Research Policy, Vol. 11, pp. 311-320
Tassey, G. (1992) Technology Infrastructure and Competition Position, Kluwer, Norwell, MA
Tassey, G. (2005) ‘Underinvestment in Public Good Technologies’, Journal of Technology Transfer, Vol. 30 (1), pp. 89–113
Tassey, G. (2008) ‘Modelling and Measuring the Economic Roles of Technology Infrastructure’, Economics of Innovation and New Technology, Vol. 17, pp. 615–629
Tassey, G. (2009) ‘Rationales and Mechanisms for Revitalizing U.S. Manufacturing R&D Strategies’, Unpublished Paper, National Institute of Standards and Technology
Teubal, M. (1997), ‘A catalytic and evolutionary approach to horizontal technology policies’, Research Policy, Vol. 25, pp. 1161-1188
Tomer, J.F. (1999) Human Firm: A Socioeconomic Analysis of its Behaviour and Potential in a New Economic Age, Routledge, London
UKCES (2010) 'Skills for Jobs: Today and Tomorrow', Vol. 2
UNCTAD (2003) World Investment Report: FDI Policies for development: National and International Perspectives, United Nations, New York
UNCTAD (2005) World Investment Report: Transnational Corporations, and the Internationalization of R&D, United Nations, New York
UNCTAD (2008) World Investment Report: Transnational Corporations, and the Infrastructure Challenge, United Nations, New York
Van den Bergh J.C.J.M. and Kallis G. (2009) ‘Evolutionary Policy’, Papers on Economics and Evolution, No 0902, Max Planck Institute of Economics, Jena
Van Leuvensteijn, M. et al., (2008) 'Impact of Bank Competition on the Interest Rate Pass Through in the Euro Area', European Central Bank, Working Paper, No. 885
Wegner, G. (1997) ‘Economic Policy from an Evolutionary Perspective: A New Approach’ Journal of Institutional and Theoretical Economics, Vol. 153, pp. 485–509
Woolthuis, R.K., Lankhuizen M. and Gilsing V. (2005) ‘A System failure Framework for Policy Design’, Technovation, Vol. 25, pp. 609-619

Productivity and the Economic Cycle
BIS Economics Papers BIS places analysis at the heart of policy-making. As part of this process the Department has decided to make its analysis and evidence base more publicly available through the publication of a series of BIS Economics Papers that set out the thinking underpinning policy development. The BIS Economics series is a continuation of the series of Economics papers, produced by the former Department for Business, Enterprise and Regulatory Reform (BERR) which analysed issues central to business and industry.
The main series is complemented by a series of shorter Occasional papers including literature reviews, appraisal and evaluation guidance, technical papers, economic essays and think pieces. These are listed below:
Main BIS Series
11. The economic consequences for the UK and the EU of completing the Single Market, February 2011
10B Manufacturing in the UK: Supplmentary analysis, December 2010
10A. Manufacturing in the UK: An economic analysis of the sector, December 2010
9. Economic Growth, November 2010
8. UK trade performance: Patterns in UK and global trade growth, November 2010
7. Understanding local growth, October 2010
6. Learning from some of Britains sucessful sectors: An historical analysis of the role of government, March 2010
5. Learning from Britain’s successful sectors, March 2010
4. Supporting analysis for “Skills for Growth: The national skills strategy”, March 2010
3. The space economy in the UK: An economic analysis of the sector and the role of policy, February 2010
2. Life Sciences in the UK - Economic analysis and evidence for ‘life sciences 2010: Delivering the Blueprint’, January 2010
1. Towards a low carbon economy – economic analysis and evidence for a low carbon industrial strategy, July 2009
98

Productivity and the Economic Cycle
99
Main BERR Series
6. The globalization of value chains and industrial transformation in the UK, February 2009
5. China and India: Opportunities and Challenges for UK Business, February 2009
4. Regulation and Innovation: Evidence and Policy Implications, December 2008
BIS Occasional Papers
2. The economic rationale for a national design policy, August 2010
1. Research to improve the assessment of additionality, October 2009
BERR Occasional Papers
3. Impact of Regulation on Productivity, September 2008
2. Evaluation of Regional Selective Assistance (RSA) and its successor, Selective Finance for Investment in England, March 2008
1. Cross-Country Productivity Performance at Sector level: the UK compared with the US, France and Germany, February 2008
Copies of these papers can be obtained from the BIS publications orderline at http://www.bis.gov.uk/publications or telephone 0845 015 0010.
These papers are also available electronically on the BIS Economics website at http://www.berr.gov.uk/Policies/economics-statistics/economics.
Further information on economic research in BIS can be found at http://www.bis.gov.uk/policies/economics-statistics/economics/bis-research . This site includes links to the various specialist research areas within the Department.
Evaluation reports are available on the BIS evaluation website at http://www.berr.gov.uk/Policies/economics-statistics/economics/evaluation.
The views expressed within BIS Economics Papers are those of the authors and should not be treated as Government policy. We welcome feedback on the issues raised by the BIS Economics Papers, and comments should be sent to [email protected].

© Crown copyright 2011
You may re-use this information (not including logos) free of charge in any format or medium, under the terms of the Open Government Licence. To view this licence, visit http://www.nationalarchives.gov.uk/doc/open-government-licence/ or write to the Information Policy Team, The National Archives, Kew, London TW9 4DU, or e-mail: [email protected].
This publication is also available on our website at http://www.bis.gov.uk Any enquiries regarding this publication should be sent to: Department for Business, Innovation and Skills 1 Victoria Street London SW1H 0ET Tel: 020 7215 5000 If you require this publication in an alternative format, email [email protected], or call 020 7215 5000. U RN 11/772