Embed Size (px)
Citation preview

University of Nebraska - LincolnDigitalCommons@University of Nebraska - Lincoln
Papers in Natural Resources Natural Resources, School of
3-6-2014
Productivity and Carbon Dioxide Exchange ofLeguminous Crops: Estimates from Flux TowerMeasurementsTagir GilmanovSouth Dakota State University, [email protected]
John M. BakerUniversity of Minnesota, [email protected]
Carl J. BernacchiUniversity of Illinois, [email protected]
David P. BillesbachUniversity of Nebraska-Lincoln, [email protected]
George G. BurbaAdvanced R.D., [email protected]
See next page for additional authors
Follow this and additional works at: http://digitalcommons.unl.edu/natrespapers
Part of the Natural Resources and Conservation Commons, Natural Resources Management andPolicy Commons, and the Other Environmental Sciences Commons
This Article is brought to you for free and open access by the Natural Resources, School of at DigitalCommons@University of Nebraska - Lincoln. Ithas been accepted for inclusion in Papers in Natural Resources by an authorized administrator of DigitalCommons@University of Nebraska - Lincoln.
Gilmanov, Tagir; Baker, John M.; Bernacchi, Carl J.; Billesbach, David P.; Burba, George G.; Castro, Saulo; Chen, Jiquan; Eugster,Werner; Fischer, Marc L.; Gamon, John A.; Gebremedhin, Maheteme T.; Glenn, Aaron J.; Griffis, Timothy J.; Hatfield, Jerry L.; Heuer,Mark W.; Howard, Daniel M.; Leclerc, Monique Y.; Loescher, Henry W.; Marloie, Oliver; Meyers, Tilden P.; Olioso, Albert; Phillips,Rebecca L.; Prueger, John H.; Skinner, R. Howard; Suyker, Andrew E.; Tenuta, Mario; and Wylie, Bruce K., "Productivity and CarbonDioxide Exchange of Leguminous Crops: Estimates from Flux Tower Measurements" (2014). Papers in Natural Resources. 516.http://digitalcommons.unl.edu/natrespapers/516

AuthorsTagir Gilmanov, John M. Baker, Carl J. Bernacchi, David P. Billesbach, George G. Burba, Saulo Castro, JiquanChen, Werner Eugster, Marc L. Fischer, John A. Gamon, Maheteme T. Gebremedhin, Aaron J. Glenn,Timothy J. Griffis, Jerry L. Hatfield, Mark W. Heuer, Daniel M. Howard, Monique Y. Leclerc, Henry W.Loescher, Oliver Marloie, Tilden P. Meyers, Albert Olioso, Rebecca L. Phillips, John H. Prueger, R. HowardSkinner, Andrew E. Suyker, Mario Tenuta, and Bruce K. Wylie
This article is available at DigitalCommons@University of Nebraska - Lincoln: http://digitalcommons.unl.edu/natrespapers/516

Agronomy Journa l • Volume106 , I s sue2 • 2014 545
crop ecology & Physiology
ProductivityandCarbonDioxideExchangeofLeguminousCrops:EstimatesfromFluxTowerMeasurements
TagirG.Gilmanov,*JohnM.Baker,CarlJ.Bernacchi,DavidP.Billesbach,GeorgeG.Burba,SauloCastro,JiquanChen,WernerEugster,MarcL.Fischer,JohnA.Gamon,MahetemeT.Gebremedhin,AaronJ.Glenn,
TimothyJ.Griffis,JerryL.Hatfield,MarkW.Heuer,DanielM.Howard,MoniqueY.Leclerc,HenryW.Loescher,OliverMarloie,TildenP.Meyers,AlbertOlioso,RebeccaL.Phillips,JohnH.Prueger,
R.HowardSkinner,AndrewE.Suyker,MarioTenuta,andBruceK.Wylie
Published in Agron. J. 106:545–559 (2014)doi:10.2134/agronj2013.0270Copyright © 2014 by the American Society of Agronomy, 5585 Guilford Road, Madison, WI 53711. All rights reserved. No part of this periodical may be reproduced or transmitted in any form or by any means, electronic or mechanical, including photocopying, recording, or any information storage and retrieval system, without permission in writing from the publisher.
ABstRActNet CO2 exchange data of legume crops at 17 � ux tower sites in North America and three sites in Europe representing 29 site-years of measurements were partitioned into gross photosynthesis and ecosystem respiration by using the nonrectangular hyperbolic light-response function method. � e analyses produced net CO2 exchange data and new ecosystem-scale ecophysiological parameter estimates for legume crops determined at diurnal and weekly time steps. Dynamics and annual totals of gross photosynthesis, ecosystem respiration, and net ecosystem production were calculated by gap � lling with multivariate nonlinear regression. Comparison with the data from grain crops obtained with the same method demonstrated that CO2 exchange rates and ecophysiological parameters of legumes were lower than those of maize (Zea mays L.) but higher than for wheat (Triticum aestivum L.) crops. Year-round annual legume crops demonstrated a broad range of net ecosystem production, from sinks of 760 g CO2 m–2 yr–1 to sources of –2100 g CO2 m–2 yr–1, with an average of –330 g CO2 m–2 yr–1, indicating overall moderate CO2–source activity related to a shorter period of photosynthetic uptake and metabolic costs of N2 � xation. Perennial legumes (alfalfa, Medicago sativa L.) were strong sinks for atmospheric CO2, with an average net ecosystem production of 980 (range 550–1200) g CO2 m–2 yr–1.
T.G. Gilmanov, Dep. of Natural Resource Management, South Dakota State Univ., Brookings, SD 57007; J.M. Baker, USDA Soil and Water Management Unit and Dep. of Soil, Water and Climate, Univ. of Minnesota, 1991 Upper Buford Circle, St. Paul, MN, 55108; C.J. Bernacchi, USDA-ARS Photosynthesis Research Unit and Dep. of Plant Biology, Univ. of Illinois, 1201 W. Gregory Drive, Urbana, IL 61801; D.P. Billesbach, Biological Systems Engineering Dep., 157 L.W. Chase Hall, Univ. of Nebraska, Lincoln, NE 68583-0726; G.G. Burba, Advanced R.D., LI-COR Biosciences, Lincoln, NE 68504; S. Castro and J.A. Gamon, Dep. of Earth and Atmospheric Sciences and Dep. of Biological Sciences, 1-26 Earth Sciences Building, Univ. of Alberta, Edmonton, AB, Canada T6G 2E3; J. Chen, Dep. of Environmental Sciences, Univ. of Toledo, Toledo, OH 43606; W. Eugster, Institute of Agricultural Sciences, ETH Zurich, LFW C55.2, Universitätsstrasse 2, CH-8092 Zurich, Switzerland; M.L. Fischer, Sustainable Energy Systems Group, Environmental Energy Technologies Division, Lawrence Berkeley National Lab., MS 90K-125 1 Cyclotron Rd., Berkeley, CA 94720; M.T. Gebremedhin, Science and Engineering Alliance Inc., 4301 Connecticut Ave. NW, Washington, DC 20008; A.J. Glenn, Science and Technology Branch, Agriculture and Food Canada, Brandon, MB, Canada R7A 5Y3; T.J. Griffi s, CoDGS, Land and Atmospheric Science, Dep. of Soil, Water, and Climate, 1991 Upper Buford Circle, Univ. of Minnesota, St. Paul, MN, 55108, USA; J.L. Hatfi eld
Abbreviations: GPP, gross primary production; LUE, light use effi ciency; NEP, net ecosystem production; RE, ecosystem respiration; VPD, vapor pressure defi cit.
Agriculturalcropsdiff er from each other with respect to their contribution to the global CO2 exchange, as demonstrated by ecosystem-scale measurements at fl ux towers (Gilmanov et al., 2010, 2013). A number of grass crop species are recognized as strong sinks for atmospheric CO2 and are widely cultivated as food, forage, and biofuel crops (Long et al., 1992; Hollinger et al., 2005; Suyker et al., 2005; Stella et al., 2009; Endres et al., 2010; Skinner and Adler, 2010; Zeri et al., 2011; Gilmanov et al., 2013). Considerably more uncertainty exists in evaluation of the source/sink activity of leguminous crops. On the one side, there are data indicating high photosynthetic and yield potentials of legume
crops (Platt and Bassham, 1978; Specht et al., 1999). Th omas and Hill (1949) reported maximum daily gross photosynthesis of experimental plots of alfalfa at 56 g dry matter m–2 d–1. Ludwick (2000) reported maximum yields of 54 Mg ha–1 (24.1 t acre–1) on irrigated alfalfa fi elds in California. On the other hand, based on year-round CO2 exchange measurements on legume fi elds, some researchers have come to the conclusion that legume fi elds (e.g., soybean [Glycine max (L.) Merr.]) are near CO2 neutral or even act as net sources for atmospheric CO2 (Baker and Griffi s, 2005; Verma et al., 2005; Hernandez-Ramirez et al., 2011; Gebremedhin et al., 2012).
and J.H. Prueger, National Lab. for Agriculture and the Environment, 2110 Univ. Blvd., Ames, IA 50011; M.W. Heuer, NOAA/Air Resources Lab., Atmospheric Turbulence and Diff usion Division, 456 South Illinois Avenue, Oak Ridge, TN 37830, and Oak Ridge Associated Univ., Oak Ridge, TN 37830; D.M. Howard, Stinger Ghaff arian Technologies, U.S. Geological Survey, Center for Earth Resources Observation and Science (EROS), 47914 252nd Street, Sioux Falls, SD 57198; M.Y. Leclerc, Lab. for Environmental Physics, Univ. of Georgia, 1109 Experiment Street, Griffi n, GA 30223; H.W. Loescher, National Ecological Observatory Network Inc., 1635 38th St., Boulder, CO 80301, and Institute of Alpine and Arctic Research, Univ. of Colorado, Boulder, CO 80301; O. Marloie, INRA, URFM-UR 629 (Écologie des Forêts Méditerranéennes), 84914 Avignon, Cedex 9, France; T.P. Meyers, NOAA/ATDD, P.O. Box 2456, Oak Ridge, TN 37831-2456; A. Olioso, INRA, EMMAH-UMR1114 (Environnement Méditerranéen et Modélisation des AgroHydrosystèmes), 84914 Avignon, Cedex 9, France; R.L. Phillips, Landcare Research, Riddet Road, Massey Univ., Palmerston North 4442, New Zealand; R.H. Skinner, USDA-ARS, Pasture Systems and Watershed Management Unit, University Park, PA 16802; A.E. Suyker, School of Natural Resources, 806 Hardin Hall, Univ. of Nebraska, Lincoln, NE 68583-0978; M. Tenuta, Dep. of Soil Science, Univ. of Manitoba, 13 Freedman Crescent, Winnipeg, MB, Canada R3T 2N2; and B.K. Wylie, U.S. Geological Survey, Center for Earth Resources Observation and Science (EROS), 47914 252nd Street, Sioux Falls, SD 57198. Received 6 June 2013. *Corresponding author ([email protected]).
Published March 6, 2014

546 Agronomy Journa l • Volume106, Issue2 • 2014
Legume crops (mostly soybean, alfalfa, and peanut [Arachis hypogaea L.]) occupy >20% of the cultivated land of the United States, playing a significant role in shaping the C balance of North America. A number of site-specific studies analyzing CO2–exchange processes and their C budget implications for legume crops of the region have been published (Baldocchi et al., 1981a, 1981b, 1983; Hollinger et al., 2005; Baker and Griffis, 2005; Verma et al., 2005; Bernacchi et al., 2005, 2006; Fischer et al., 2007; Glenn et al., 2010; Pingintha et al., 2010; Hernandez-Ramirez et al., 2011; Gebremedhin et al., 2012). In these studies, including legume crops with different physiology and agronomy, annuals and perennials, the researchers used various methods based on either direct integration of net CO2 exchange data or various models for C budget components. Nevertheless, the productivity, respiration, and ecophysiological parameters of legume crops derived from flux-tower measurements have not
yet been subjected to comparative analysis and synthesis. We present a unified approach based on partitioning of the flux-tower data into photosynthesis and respiration components by using a standardized method based on the nonrectangular hyperbolic model (Thornley and Johnson, 2000) to obtain new measurement-based estimates of CO2 exchange of leguminous crops and facilitate comparability of the results from different sites and crops. The same technique was recently applied to cereals of midcontinent North America as the major agricultural crops (Gilmanov et al., 2013), and the present study expands the analysis to legumes, as the second significant crop type of the region. Quantification of the CO2 exchange and ecophysiological parameters presented here will provide agriculturalists with valuable information to optimize the economic and sustainability aspects of the production of various leguminous crops.
Fig.1.Flux-towersitesinlegumecropsandOmernikLevel3ecoregionsofNorthAmerica.

Agronomy Journa l • Volume106, Issue2 • 2014 547
Table1.Eddycovariancetow
ersitesusedinthestudy.
No.
Site
Crop
Latitude
Longitude
Elevation
Year
T air†
PCPN
‡
Thermal
grow
ing
season§
Tsum5¶
Principal
investigator
Partitioning
method#
——
——
— °
——
——
—m
°Cm
m y
r–1
d°Cd
1Edmonton,AB,Canada
alfalfa
53.4964
–113.5524
650
2010
4.18
381
189
1545
J.A.Gam
onQ
–Ts–VPD
2TraceGasManitoba,M
B,Canada
fababean
49.6453
–97.1579
235
2007
2.88
463
192
1887
M.Tenuta
Q–T
s–VPD
3Oensingen-2,Switzerland
pea
47.2865
7.7338
452
2010
8.39
1142
238
1996
W.Eugster
Q–T
s–VPD
4MandanH5,NorthDakota
alfalfa
46.7753
–100.9516
592
2010
5.34
605
206
2088
R.L.Phillips
Q–T
s–VPD
5Rosem
ountalternative,Minnesota
soybean/rye
44.7217
–93.0893
260
2004
7.31
766
219
2288
J.M.Baker
Q–T
s–VPD
6Rosem
ountconventional,Minnesota
soybean
44.7143
–93.0898
260
2004
7.31
766
219
2288
J.M.Baker
Q–T
s7
Rosem
ountconventional,Minnesota
soybean
44.7143
–93.0898
260
2006
9.20
669
214
2548
J.M.Baker
Q–T
s–VPD
8Avignon,France
pea
43.9165
4.8785
312005
14.01
491
298
3476
O.M
arloie
Q–T
s–VPD
9Lennox,SD
soybean
43.2408
–96.9020
386
2012
10.47
336
239
2999
T.P.Meyers
Q–T
s–VPD
10KelloggBiologicalStation,Michigan
alfalfa
42.4099
–85.3757
286
2006
10.05
1156
233
2496
J.Chen
Q–T
s–VPD
11BrooksField-10,Iowa
soybean
41.9749
–93.6914
313
2008
7.78
1179
212
2538
J.H.Prueger
Q–T
s–VPD
12Fermiagriculturalsite,Illinois
soybean
41.8593
–88.2227
225
2007
9.92
1166
231
2940
R.M
atam
ala
Q–T
s–VPD
13Fermiagriculturalsite, Illinois
soybean
41.8593
–88.2227
225
2009
8.02
1162
226
2429
R. M
atam
ala
Q–T
s–VPD
14Ames,IA
soybean
41.72
–93.41
300
2003
9.01
718
225
2688
J.H.Prueger
Q–T
s15
Meadrainfed,Nebraska
soybean
41.1797
–96.4396
363
2002
10.71
544
234
2958
A.E.Suyker
Q–T
s–VPD
16Meadrainfed,Nebraska
soybean
41.1797
–96.4396
363
2004
10.35
670
248
2919
A.E.Suyker
Q–T
s–VPD
17Meadirrigatedrotation,Nebraska
soybean
41.1649
–96.4701
362
2002
10.55
831
231
2911
A.E.Suyker
Q–T
s18
Haller,PA
alfalfa
40.8632
–77.8406
346
2003
8.87
1193
239
2383
R.H.Skinner
Q–T
s19
BorgoCioffi,Italy
alfalfa
40.5238
14.9574
202002–2003
16.31
787
356
3933
V.Magliulo
Q–T
a–VPD
20Bondville, IL
soybean
40.0061
–88.2919
300
1998
12.55
930
266
3290
T.P. Meyers
Q–T
s21
Bondville,IL
soybean
40.0061
–88.2919
300
2000
10.71
582
249
3051
T.P.Meyers
Q–T
s22
Bondville,IL
soybean
40.0061
–88.2919
300
2002
11.65
704
244
3063
T.P.Meyers
Q–T
s–VPD
23Bondville,IL
soybean
40.0061
–88.2919
300
2004
11.31
1010
266
3046
T.P.Meyers
Q–T
s–VPD
24Bondville,IL
soybean
40.0061
–88.2919
300
2006
11.83
1025
262
2887
T.P.Meyers
Q–T
s–VPD
25LamontA
RMmain,Oklahom
a††
soybean
36.6058
–97.4888
314
2006
16.46
486
313
4385
M.Torn
Q–T
s–VPD
26WinfredThomasARS,Alabama
soybean/winterwheat
34.8943
–86.5672
191
2007
17.60
567
314
4806
M.T.Gebremedhin
Q–T
s27
WinfredThomasARS,Alabama
soybean/winterwheat
34.8943
–86.5672
191
2008
16.20
1310
307
4312
M.T.Gebremedhin
Q–T
s28
WinfredThomasARS,Alabama
soybean/winterwheat
34.8943
–86.5672
191
2009
16.78
1383
307
4381
M.T.Gebremedhin
Q–T
s29
Vienna,GA
peanut
32.1308
–83.6770
122
2005
16.77
1265
323
4386
M.Leclerc
Q–T
s–VPD
†Meanannualairtem
perature.
‡Annualprecipitation.
§ Num
berofdayswithmeandailyairtem
perature³5°
C.
¶Tsum
5=S
365 1
t=max{0,[
air
T(t)–5]}.
# Q
–Tsm
ethodtakesintoaccountcom
binedeffectsoflightandsoiltem
perature(Eq.[2]);
Q–T
s–VPD
methodtakesintoaccountcom
binedeffectsoflight,soiltemperature,andvaporpressuredeficit(VPD
)(Eq.[3–4]);
Q–T
a–VPD
method
takesintoaccountcom
binedeffectsoflight,airtemperature,andvaporpressuredeficit.
††Exampleofalow-productioncropyear:duetoanunfavorablewaterregime,thebeanyieldwasonly5bushelsacre–1=0.34Mgha
–1.

548 Agronomy Journa l • Volume106, Issue2 • 2014
MAteRIAls And MethodsWe have compiled a data set of year-round net CO2 exchange
measurements at flux-tower stations in legume fields covering a geographic range from Alberta, Canada, to Georgia and from Oklahoma to Pennsylvania to quantitatively compare gross photosynthesis, ecosystem respiration, and ecophysiological parameters of legume crops in North America (Fig. 1). For comparison, we have also included measurements from three existing European flux towers on legume crops. The data set includes flux towers in all major legume crops: 20 site-yr of soybean; 5 site-yr of alfalfa; 2 site-yr of pea (Pisum sativum L.); 1 site-yr of faba bean (Vicia faba L.); and 1 site-yr of peanut (Table 1).
Flux towers in the data set covered a wide range of climatic conditions, with mean annual temperatures from 2.9 to 17.6°C, annual precipitation totals from 336 to 1380 mm, growing seasons (5°C) from 189 to 356 d, and the sum of daily temperatures >5°C from 1545 to 4806 degree days (Table 1). All sites in the data set had eddy-covariance instrumentation, with measurements following the Ameriflux/CarboEurope/Fluxnet protocol (Meyers and Hollinger, 2004; Aubinet et al., 2012), except for the Trace Gas Manitoba site, where the flux gradient micrometeorological technique was used (Glenn et al., 2010).
Partitioning of net carbon dioxide Flux data into Photosynthesis and Respiration
Using ecophysiological sign convention, where CO2 flux from the atmosphere to the ecosystem is positive, gross photosynthesis, Pg, and total ecosystem respiration, Re, are considered as process rates, combined in the conservation equation with signs corresponding to their contribution to the respective processes. In non-forest terrestrial ecosystems with insignificant canopy CO2 storage (Loescher et al., 2006), the net CO2 flux, F (mg CO2 m–2 s–1), provided by flux-tower measurements represents the difference between gross photosynthesis and ecosystem respiration:
g eF P R= - [1]
In general, factors controlling photosynthesis and respiration at the crop level are not the same (although they overlap), and the patterns of their response to a given factor are not identical (Thornley and Johnson, 2000). Therefore, decomposition of the F data into photosynthesis and respiration (Eq. [1]) is recognized as an essential part of flux-tower data processing. While in the earlier period of flux data analysis partitioning was usually based on estimation of daytime respiration from nighttime fluxes, more recently derivation of daytime respiration from daytime measurements has become the dominant approach (Gilmanov et al., 2003, 2013; Reichstein et al., 2005; Lasslop et al., 2010). Analysis of tower CO2 exchange data from a wide range of grassland and crop ecosystems demonstrated that the modified nonrectangular hyperbolic equation provides a robust and flexible tool for partitioning of the eddy-covariance net CO2 exchange data into gross photosynthesis and ecosystem respiration components (Stoy et al., 2006). In temperate and humid climates, the partitioning equation in the form (Gilmanov et al., 2007)
( )
( )
( )
max
2max max
0 s
,1
2
4
exp T
F Q T
Q A
Q A A Q
r k T
=
éa +ëqù
- a + - a q úúû
-
[2]
may be used, where Q is photosynthetically active radiation, T is the temperature, a is the initial slope (apparent quantum yield), Amax is the plateau (photosynthetic capacity) of the light response, q is the convexity parameter (Thornley and Johnson, 2000), and r0 and kT are the coefficients of the exponential temperature response [r0 = Re(0)]. Under conditions of pronounced water stress, partitioning based on Eq. [2] may lead to overestimation of the daytime respiration and gross photosynthesis because reduction of daytime flux under water stress may not only occur due to the increase in temperature but may also reflect the decrease in photosynthesis due to stomatal regulation (Gilmanov et al., 2010; Pingintha et al., 2010). In such cases, a modification of Eq. [2] is used (Gilmanov et al., 2013):
( )( )
( )
( )
s
max
2max max
0 s
, , VPD
VPD2
4
exp T
F Q T
Q A
Q A A Q
r k T
=
j éa +ëqù
- a + - a q úúû
-
[3]
( )cr
2
crcr
VPD
1, VPD VPD
VPD VPD VPDexp , VPD VPD
ì £ïïïï é ùï æ öj =í -ê ú÷çï ÷- >çê ú÷ï ç ÷çï sè øê úï ë ûïî
[4]
where Ts is soil temperature, and the normalized vapor pressure deficit (VPD) response function j(VPD) depends on two parameters: the critical VPD value, VPDcr, below which water deficit doesn’t affect photosynthesis (j = 1 for VPD £ VPDcr) and the curvature parameter, sVPD (1 £ sVPD £ 30), with lower values describing a strong water-stress effect and higher values indicating a weak effect (Gilmanov et al., 2013). Although, generally speaking, the values of the VPDcr parameter may vary among crops and ecosystems, following El-Sharkawy et al. (1984), Lasslop et al. (2010), and Pingintha et al. (2010), we accepted a critical value VPDcr = 1 kPa and considered a one-parameter VPD response function in the form
( ) 2
VPD
1, VPD 1
VPD VPD 1exp , VPD 1
ì £ïïïï é ùï æ öj =í -ê ú÷çï ÷- >çê ú÷ï ç ÷çï sè øê úï ë ûïî
[5]
estimation of the ParametersThe parameter estimation and gap-filling methods used in
this study followed procedures in the parallel study for the grain crops (Gilmanov et al., 2013), where they were described in detail. The parameters a , Amax, q , r0, kT, and sVPD (when

Agronomy Journa l • Volume106, Issue2 • 2014 549
necessary) of the functions Eq. [2–5] were numerically estimated for every day of the growing season using available Q, Ts, VPD, and F data. Using the optimization tools of the Mathematica system (Wolfram Research), for every day’s {Q(i), Ts(i), VPD(i), F(i), i = 1, 2, …, n} data set of n £ 48 records with a 30-min time step, we identified best-fit parameter values {a , Amax, q, sVPD, r0, kT} of Eq. [2–5]. The series of graphs in Fig. 2 (specifications in Table 2) show examples of the response functions for several sites for the period of active photosynthesis. The data in Tables 3 and 4 illustrate parameter estimates using the models of Eq. [2] and [3–5], respectively.
The rate of ecosystem respiration, re (mg CO2 m–2 s–1), was described by an exponential function of soil temperature:
( ) ( )e s 0 sexp Tr T r k T= [6]
where, during the growing season, parameters r0 = re(0) and kT were estimated by fitting Eq. [2] or [3] to 30-min {F,Q,Ts,VPD} data for individual measurement days, while outside the period of photosynthetic activity, r0 and kT were estimated by fitting Eq. [6] to pooled 30-min {F,Ts} data for moving (typically, 9-d-wide) windows centered at the day of measurements.
Fig.2.Light–soiltemperature–vaporpressuredeficit(VPD)responsefunctionsforlegumecropsatseveralsitesduringtheperiodofactivephotosynthesis:(A)fababean,Manitoba,Canada;(B)soybean,Minnesota;(C)alfalfa,Michigan;(D)soybean,Iowa;(E)soybean,Illinois-1;(F)soybean,Nebraska;(G)alfalfa,Pennsylvania;and(H)soybean,Illinois-2.Oneachpanel,theleftgraphshowsasimplelight-responseplotandafittedlightcurve,thelight–soiltemperature–VPDresponseisshownontheright(light–soiltemperatureresponseforG).

550 Agronomy Journa l • Volume106, Issue2 • 2014
Vapor Pressure Deficit Limitation of Photosynthesis
The significance of the VPD as a factor controlling the net CO2 flux may be determined by consideration of the whole array of estimated curvature parameter sVPD values for a given site-year. The sVPD values typically lie in the interval from 2 to 30 kPa, the lower range characterizing a strong VPD effect (rapid decrease of F with VPD increasing to values >>1 kPa), while higher values of sVPD describe functions j(VPD) that decrease only gradually with increasing aerial drought. A detailed characteristic of the VPD limitation of crop photosynthesis may be provided by a graph of the cumulative distribution of the number of days with curvature coefficient sVPD £ s (Fig. 3). Nevertheless, in comparing ecosystems, a simpler parameter may be used, e.g., the number of days for which sVPD £ 4 kPa and the maximum vapor pressure deficit VPDmax ³ 1 kPa (DVPD).
gap Filling and calculation of Annual totals of Production and Respiration
Estimates of half-hourly rates of gross photosynthesis, Pg, and ecosystem respiration, Re, for days with missing flux data were obtained by use of the assimilation and respiration terms of Eq. [2] or [3], respectively, with parameter estimates for the missing calendar days obtained by smooth interpolation across the data set of available parameters {a(tj), Amax(tj), q(tj), r0(tj), kT(tj), sVPD(tj)}. Daily totals of gross photosynthesis, Pg(t) (g CO2 m–2 d–1), daytime ecosystem respiration, Rday(t)
(g CO2 m–2 [light period]–1), and nighttime ecosystem respiration, Rnight(t) (g CO2 m–2 [light period])–1), for calendar days t = 1, 2, …, 365 were obtained by numerical integration of half-hourly rates over corresponding periods of the day. The total 24-h ecosystem respiration Re(t) (g CO2 m–2 d–1) and the net 24-h ecosystem CO2 exchange, F(t), were calculated as
( ) ( ) ( )e day nightR t R t R t= + [7]
( ) ( ) ( )g eF t P t R t= - [8]
Finally, the annual totals of gross primary production (GPP) and ecosystem respiration (RE) were calculated as annual sums:
( )365
g1
GPPt
P t=
=å [9]
and
( )365
e1
REt
R t=
=å [10]
while the annual net ecosystem production (NEP) was obtained as
NEP GPP RE= - [11]
Table4.Numericalvaluesandthegoodness-of-fitcharacteristicsoftheparametersapparentquantumyield(a),photosyntheticcapacity(Amax),convex-ityofthelightresponse(qratio),respirationrateatzerotemperature(r0),theexponentialtemperaturecoefficient(kT),andthecurvatureparameterofthevaporpressuredeficitresponse(sVPD)ofEq.[3–4]forDayoftheYear223attheMeadrainfedsoybeansite,2002.
Parameter a Amax qratio r0 kT sVPDmgCO2 mmol–1 mgCO2 m
–2s–1 mgCO2 m–2s–1 °C–1 kPa
Value 0.00192 1.748 0.718 0.108 0.0404 3.246SE 0.00013 0.097 0.107 0.027 0.0098 0.114
tvalue 14.90 18.09 6.72 3.98 4.2 28.47
pvalue 0 0 3.69´10–8 2.68´10–4 1.74´10–4 0
Table3.Numericalvaluesandthegoodness-of-fitcharacteristicsoftheparametersapparentquantumyield(a),photosyntheticcapacity(Amax),convex-ityofthelightresponse(qratio),respirationrateatzerotemperature(r0),andtheexponentialtemperaturecoefficient(kT)inEq.[2]forDayoftheYear179attheHalleralfalfasite,2003.
Parameter a Amax qratio r0 kTmgCO2 mmol–1 mgCO2 m
–2s–1 mgCO2 m–2s–1 °C–1
Value 0.00134 1.541 2.567´10–8 0.0964 0.0688
SE 0.00038 0.142 0.0938 0.0707 0.0301
tvalue 3.554 10.85 2.736´10–7 1.364 2.286
pvalue 0.0017 1.6´10–10 1.0 0.186 0.032
Table2.SpecificationsforgraphsinFig.2.
Symbol Site Crop Year DayoftheyearA TraceGasManitoba,MB,Canada fababean 2007 201B Rosemountconventional,Minnesota soybean 2006 184C KelloggBiologicalStation,Michigan alfalfa 2006 182D BrooksField10,Iowa soybean 2008 216E Fermiagriculturalsite,Illinois soybean 2007 182F Meadrainfed,Nebraska soybean 2002 223G Haller,PA alfalfa 2003 179H Bondville,IL soybean 2002 215

Agronomy Journa l • Volume106, Issue2 • 2014 551
We found that for comparative purposes, it was useful to introduce additional parameters of average daytime respiration rate, rday(t), and average nighttime respiration rate, rnight(t), calculated as
( )( )
( ) ( )day
day2 1
1000R tr t
t t=
t -t [12]
( )( )
( ) ( )night
night2 1
100086, 400
R tr t
t t=
é ù- t -të û
[13]
where t1(t) and t2(t) are the moments of sunrise and sunset for the tth calendar day respectively (measured in seconds to obtain rday and rnight in milligrams of CO2 per square meter per second if Rday is in grams of CO2 per square meter per light period and Rnight is in grams of CO2 per square meter per dark period).
Photosynthetic Light-Use Efficiency
Light-use efficiency characteristics are often used as important tools of comparative ecological analysis. From a number of coefficients suggested for this purpose, we used the coefficient of gross photosynthetic light-use efficiency, LUE, defined as a ratio of daily gross photosynthesis Pg to daily incoming of photosynthetically active radiation Q (Cooper, 1970; Gilmanov et al., 2005):
gLUEPQ
= [14]
While the coefficient of apparent quantum yield (initial slope of the light response), a, characterizes the potential physiological light-use efficiency, LUE is a measure of ecologically realized photosynthetic productivity, making comparison of the a and LUE values an important tool of comparative ecological analysis.
Results And dIscussIonThe modified nonrectangular hyperbolic model with VPD
limitation in the form of Eq. [3–5] proved to be an adequate tool for describing tower-based net CO2 exchange measurements in legume crops and partitioning them into photosynthesis and respiration components. Figure 2 illustrates application of the
model: Fig. 2A–2F and 2H show models with VPD limitation (Eq. [3–5]), while Fig. 2G illustrates the model driven only by the light and soil temperature factors (Eq. [2]). The left graph on each panel shows a simple light-response scatterplot fitted by nonrectangular hyperbolae F(Q) with daytime respiration constant during the day; the surface on the right panel shows the (Q,Ts) response described by Eq. [3–5] with the average daily VPD value; the blue dots at the right show the original measured F values and the red dots show actual model predicted F(Q,Ts,VPD) accounting for VPD variability.
To illustrate parameter estimation procedures, Table 3 shows estimated values and the goodness-of-fit characteristics for the model of Eq. [2] fitted for Day 179 of the 2003 season at the Haller alfalfa site (Fig. 2G) when no substantial VPD limitation was observed (mean daily VPD = 1.0 kPa, VPDmax = 2.1 kPa). The model shows a significant temperature-response coefficient kT = 0.069 °C–1, with the value close to van’t Hoff’s Q10 = 2.0. For this case, the close-to-zero estimate of the convexity parameter q should also be noted, indicating that the light response for this day may apparently be described by a rectangular hyperbola, characterized by q = 0.
The data in Table 4 illustrate the parameters of Eq. [3–5] fitted for Day 223 of 2002 at the Mead soybean site. As can be seen on the light-response diagram of Fig. 2F, this day at this site was marked by a substantial decrease in net CO2 uptake (VPD reached 3.4 kPa in the afternoon hours), resulting in a hysteresis-like loop on the (Q,F) diagram. The model reflects this fact by generating highly significant (high t values) estimates of all the parameters, including the parameters of temperature response, r0 and kT, and VPD limitation, sVPD (Table 4).
Ecosystem-scale ecophysiological parameters generated by the partitioning method described above exhibited pronounced seasonal dynamics, which reflects physiological and phenological changes of the biota in the field, as well as changes in biomass and leaf area characteristics. To facilitate comparison of parameters among sites and years, we found it useful to calculate weekly means and the errors of the means for each site-year. The data in Fig. 4 provide an example of seasonal patterns of parameters at the weekly time scale, demonstrated by the soybean field at the Fermi agricultural site in 2007.
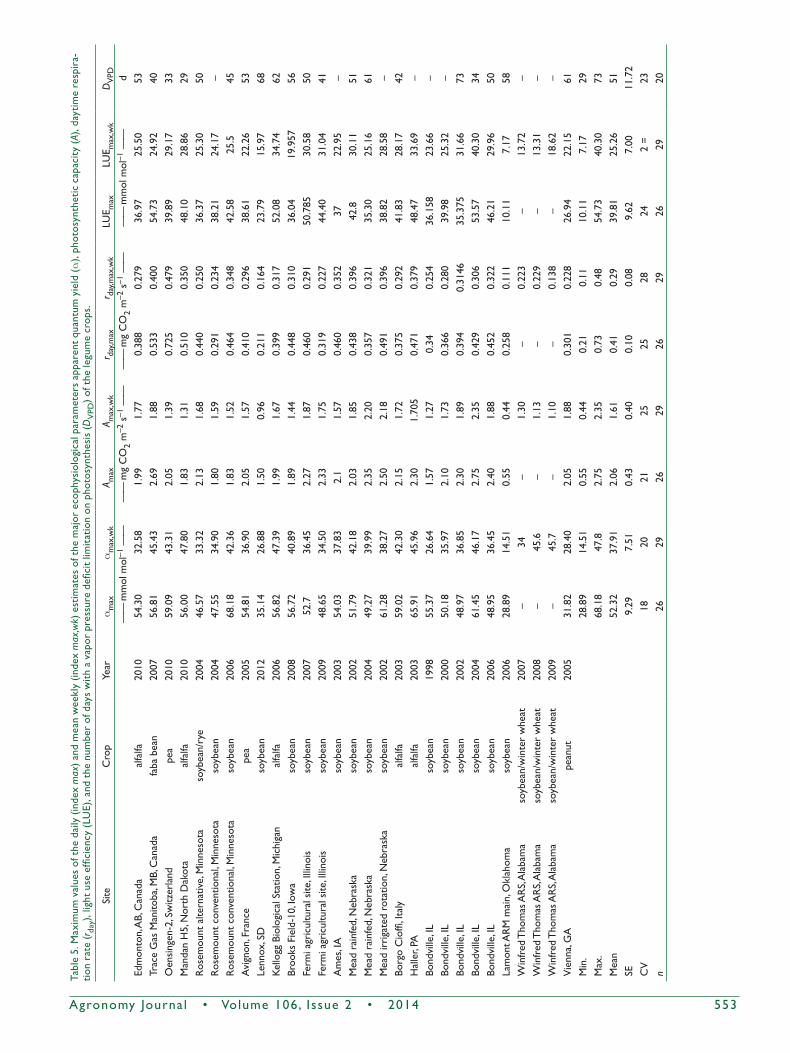
Maximum daily and maximum mean weekly values of the ecophysiological parameters of legume crops for the site-years of
Fig.3.Cumulativedistributionfunctionsofthedailyvaporpressuredeficit(VPD)responsecurvatureparametervalues,sVPD,for:(A)afababeancropattheTraceGasManitobasite,2007;and(B)asoybeancropattheBondvillesite,2002.ThedashedarrowsillustratedeterminationoftheDVPDparameterasthenumberofdayswhenthecurvatureparameteroftheVPD-dependentfactor(Eq.[5])waslessthanorequaltothecriticalvaluesVPD=4kPa.

552 Agronomy Journa l • Volume106, Issue2 • 2014
this study are summarized in Table 5. These data illustrate the magnitudes and variability of the parameters among leguminous crops as well as for different years at the same crop site. They may also be compared with corresponding parameters for grain crops. The maximum mean weekly apparent quantum yield for legumes, 47 to 48 mmol mol–1 achieved for the alfalfa crop at the Kellogg Biological Station in 2006 and Mandan in 2010, is less than the value of 50.30 mmol mol–1 estimated for a maize crop at the Bondville site in 2003 but higher than 37.23 mmol mol–1 recorded for the hard red spring wheat field at the Trace Gas Manitoba site in 2008 (Gilmanov et al., 2013). Our estimate of the maximum daily photosynthetic capacity, Amax = 2.3 mg CO2 m–2 s–1, for alfalfa at the Haller site compares well with the estimate of Amax = 2.4 mg CO2 m–2 s–1 for alfalfa reported by Asseng and Hsiao (2000) using the BREB/CO2 gradient technique. The maximum mean weekly Amax,wk = 2.35 mg CO2 m–2 s–1 for legumes recorded at the soybean field of the maize–soybean rotation at Bondville in 2004 is smaller than 3.63 mg CO2 m–2 s–1 estimated for the irrigated maize crop of the same rotation at the Mead site in 2003 but higher than 2.02 mg CO2 m–2 s–1 found for the spring wheat crop from the Trace Gas Manitoba site in 2008.
The maximum mean weekly respiration rate of 0.48 mg CO2 m–2 s–1 registered in the pea field of the Oensingen site
in 2010 is lower than 0.63 mg CO2 m–2 s–1 measured in the maize field at the Fermi agricultural site in 2006 but higher than the 0.27 mg CO2 m–2 s–1 estimated for the winter wheat crop of the Ponca City site in 1999 (Gilmanov et al., 2013).
For the peanut crop at the Vienna site with LAImax = 3.8 m2 m–2, we estimated amax,wk = 28.4 mmol mol–1, Amax,wk = 1.88 mg CO2 m–2 s–1, and rday,max,wk = 0.23 mg CO2 m–2 s–1. This compares well with the values amax,wk = 43.8 mmol mol–1, Amax,wk = 2.75 mg CO2 m–2 s–1, and rday,max,wk = 0.23 mg CO2 m–2 s–1 obtained by Pingintha et al. (2010) for a much more productive peanut crop in Georgia with much higher LAImax (7.6 m2 m–2).
The maximum daily values and maximum mean weekly parameter values presented in Table 5 show the ranges of variability of the ecophysiological parameters of legume crops, demonstrating coefficients of variation from 18 to 28%. Comparison of the ecophysiological parameters of legumes with the corresponding parameters estimated for grain crops in North America, summarized by Gilmanov et al. (2013) using the same methods, demonstrate (Table 6) that both the daily and the weekly maximums of the apparent quantum yield (amax) of legumes are not significantly different from those of maize but are significantly higher than for wheat fields. The photosynthetic
Fig.4.SeasonaldynamicsofmajorecophysiologicalparametersofthesoybeancropsattheFermiagriculturalsite,2007:(A)apparentquantumyield,a;(B)photosyntheticcapacity,Amax;(C)grossphotosyntheticlight-useefficiency,LUE;and(D)daytimeecosystemrespirationrate,rday.Dotsshowweeklymeansoftheparametersandtheerrorbarsshowstandarderrorsofthemean.
Agronomy Journa l • Volume106, Issue2 • 2014 553
Table5.Maximum
valuesofthedaily(index
max)andmeanweekly(index
max
,wk)estimatesofthemajorecophysiologicalparam
etersapparentquantum
yield(a),photosyntheticcapacity(A),daytimerespira-
tionrate(rday),lightuseefficiency(LU
E),andthenum
berofdayswithavaporpressuredeficitlim
itationonphotosynthesis(D
VPD)ofthelegumecrops.
Site
Crop
Year
amax
amax,wk
A max
A max,wk
r day,max
r day,max,wk
LUE m
axLU
E max,wk
DVPD
——
mm
ol m
ol–1
——
——mgCO2
m–2s–1
——
——mgCO2
m–2s–1
——
——
mm
ol m
ol–1
——
dEdmonton,AB, Canada
alfalfa
2010
54.30
32.58
1.99
1.77
0.388
0.279
36.97
25.50
53TraceGasManitoba,M
B,Canada
fababean
2007
56.81
45.43
2.69
1.88
0.533
0.400
54.73
24.92
40Oensingen-2, Switzerland
pea
2010
59.09
43.31
2.05
1.39
0.725
0.479
39.89
29.17
33MandanH5,NorthDakota
alfalfa
2010
56.00
47.80
1.83
1.31
0.510
0.350
48.10
28.86
29Rosem
ountalternative, Minnesota
soybean/rye
2004
46.57
33.32
2.13
1.68
0.440
0.250
36.37
25.30
50Rosem
ountconventional,Minnesota
soybean
2004
47.55
34.90
1.80
1.59
0.291
0.234
38.21
24.17
–Rosem
ountconventional,Minnesota
soybean
2006
68.18
42.36
1.83
1.52
0.464
0.348
42.58
25.5
45Avignon,France
pea
2005
54.81
36.90
2.05
1.57
0.410
0.296
38.61
22.26
53Lennox, SD
soybean
2012
35.14
26.88
1.50
0.96
0.211
0.164
23.79
15.97
68KelloggBiologicalStation,Michigan
alfalfa
2006
56.82
47.39
1.99
1.67
0.399
0.317
52.08
34.74
62BrooksField-10, Iowa
soybean
2008
56.72
40.89
1.89
1.44
0.448
0.310
36.04
19.957
56Fermiagriculturalsite,Illinois
soybean
2007
52.7
36.45
2.27
1.87
0.460
0.291
50.785
30.58
50Fermiagriculturalsite,Illinois
soybean
2009
48.65
34.50
2.33
1.75
0.319
0.227
44.40
31.04
41Ames,IA
soybean
2003
54.03
37.83
2.1
1.57
0.460
0.352
3722.95
–Mead rainfed,Nebraska
soybean
2002
51.79
42.18
2.03
1.85
0.438
0.396
42.8
30.11
51Meadrainfed,Nebraska
soybean
2004
49.27
39.99
2.35
2.20
0.357
0.321
35.30
25.16
61Meadirrigatedrotation,Nebraska
soybean
2002
61.28
38.27
2.50
2.18
0.491
0.396
38.82
28.58
–BorgoCioffi,Italy
alfalfa
2003
59.02
42.30
2.15
1.72
0.375
0.292
41.83
28.17
42Haller, PA
alfalfa
2003
65.91
45.96
2.30
1.705
0.471
0.379
48.47
33.69
–Bondville,IL
soybean
1998
55.37
26.64
1.57
1.27
0.34
0.254
36.158
23.66
–Bondville,IL
soybean
2000
50.18
35.97
2.10
1.73
0.366
0.280
39.98
25.32
–Bondville,IL
soybean
2002
48.97
36.85
2.30
1.89
0.394
0.3146
35.375
31.66
73Bondville, IL
soybean
2004
61.45
46.17
2.75
2.35
0.429
0.306
53.57
40.30
34Bondville,IL
soybean
2006
48.95
36.45
2.40
1.88
0.452
0.322
46.21
29.96
50LamontA
RMmain,Oklahom
asoybean
2006
28.89
14.51
0.55
0.44
0.258
0.111
10.11
7.17
58WinfredThomasARS,Alabama
soybean/winterwheat
2007
–34
–1.30
–0.223
–13.72
–WinfredThomasARS,Alabama
soybean/winterwheat
2008
–45.6
–1.13
–0.229
–13.31
–WinfredThomasARS,Alabama
soybean/winterwheat
2009
–45.7
–1.10
–0.138
–18.62
–Vienna,GA
peanut
2005
31.82
28.40
2.05
1.88
0.301
0.228
26.94
22.15
61Min.
28.89
14.51
0.55
0.44
0.21
0.11
10.11
7.17
29Max.
68.18
47.8
2.75
2.35
0.73
0.48
54.73
40.30
73Mean
52.32
37.91
2.06
1.61
0.41
0.29
39.81
25.26
51SE
9.29
7.51
0.43
0.40
0.10
0.08
9.62
7.00
11.72
CV
1820
2125
2528
242 =
23n
2629
2629
2629
2629
20

554 Agronomy Journa l • Volume106, Issue2 • 2014
capacity (Amax) of the legume crops at both daily and weekly scales is significantly lower than that of maize and significantly higher than for wheat crops. The metabolic parameter of daytime respiration rate (rday) of legumes is significantly different from both maize and wheat, being lower than for maize but higher than for wheat. Maximum daily values of LUE of legumes are not significantly different from those of maize (which is in agreement with the apparent quantum yield, amax, data in Table 6), but mean weekly LUE data for legumes are significantly lower than in maize. Compared with wheat, the maximum daily LUE values for legumes are significantly higher, but this is not true for the weekly values. Thus, high physiological potentials of the legumes are not always realized in long-term (weekly) performance, resulting in LUEmax,wk values for legumes significantly lower than for maize and not significantly higher than for wheat (Table 6).
For comparison of the extent of VPD limitation between sites and years for those sites for which the model of Eq. [3–5] with VPD dependence of the CO2 exchange was applied, we used the DVPD parameter calculated from the cumulative distribution of the curvature parameter, sVPD, of Eq. [5] as the total number of days for which VPDmax ³ 1 kPa and sVPD £ 4 kPa (Fig. 3). We found that the number of days when an atmospheric water deficit was affecting the productivity of the legume crops varied from 29 to 73 d (Table 5), with a trend of increasing from north to south, most closely correlating with the sum of temperatures >5°C [correlation coefficient r(Tsum5, DVPD) = 0.37].
source–sink Activity of the legume crop Fields
Time series of daily values of photosynthesis Pg(t), respiration Re(t), net daily CO2 flux F(t), and its cumulative sum, the cumulative net ecosystem production, iNEP(t), provide a comprehensive description of the dynamics of the CO2 exchange in the legume crop fields. Examples in Fig. 5 show that the legume crops exhibited a variety of patterns of the integrated net ecosystem production curves iNEP(t), from predominantly accumulative, demonstrated by alfalfa crops (Fig. 5C and 5G) through nearly equilibrium, recorded in the faba bean crop cultivated for forage and in highly productive soybean crops (Fig. 5A, 5E, and 5H), to the negative net CO2 balance observed on other soybean fields (Fig. 5B, 5D, and 5F).
The annual integrals of gross primary production, total ecosystem respiration, and the net ecosystem production calculated according to Eq. [3–5], with Pg(tj) and Re(tj) for missing days tj gap-filled using interpolated parameters, are
presented in Table 7 along with the maximum annual values of daily Pg,max, Re,max, and Fmax. The maximum daily rate of photosynthetic assimilation of the legume crops, Pg,max, in Table 7 was 71.1 g CO2 m–2 d–1 recorded for the soybean crop at the Bondville site in 2004, which is lower but comparable to the maximum of 82 g CO2 m–2 d–1 obtained from the Thomas and Hill (1949) estimate of Pg,max = 56 g dry matter m–2 d–1 for an experimental alfalfa crop (assuming 40% C content of the dry matter). This Pg,max = 71.1 g CO2 m–2 d–1 for legumes is lower than 110 and 79 g CO2 m–2 d–1 established at the maize and wheat flux tower sites, respectively, of midcontinent North America (Gilmanov et al., 2013). At the same time, the maximum daily respiration Re,max = 62.6 g CO2 m–2 d–1 for legumes was higher than 32 g CO2 m–2 d–1 established for wheat fields and comparable to 64 g CO2 m–2 d–1 for maize fields (Gilmanov et al., 2013).
Our estimates of the Pg,max, Re,max, and Fmax in legume fields are consistent with data of other researchers who used different methods. Suyker et al. (2005) estimated Pg,max = 66 and Re,max = 44 g CO2 m–2 d–1 for the soybean rotation of the irrigated Mead site in 2002, which compares with our estimates of 59 and 41 g CO2 m–2 d–1 for the same site-year. Peng and Gitelson (2012) estimated the error of the daily soybean Pg values for the same site as SE = ±8.3 g CO2 m–2 d–1. Applying this error value to statistically compare both daily photosynthesis and respiration maxima, the difference between the estimates of Suyker et al. (2005) and our estimates lies within the ±2 SE range and therefore may be considered not significant. According to Verma et al. (2005) and Peng and Gitelson (2012) for the rainfed soybean crop at the Mead site in 2002, Pg,max = 53.9 g CO2 m–2 d–1 and Fmax = 23.8 g CO2 m–2 d–1, which are also rather close to our estimates for the same site-year of Pg,max = 55.7 g CO2 m–2 d–1 and Fmax = 26.2 g CO2 m–2 d–1.
In terms of the annual totals, which reflect not only the intensive physiological parameters of species and cultivars but also such extensive parameters as length of the period of active photosynthesis during the year, the situation is as follows: the mean annual GPP (Eq. [9]) from flux-tower sites in maize fields was 4480 g CO2 m–2 yr–1, in wheat fields it was 2393 g CO2 m–2 yr–1 (Gilmanov et al., 2013), and in legume fields it was 3056 g CO2 m–2 yr–1 (this study). The corresponding values for ecosystem respiration RE (Eq. [10]) are 3269 for maize, 2276 for wheat, and 3159 g CO2 m–2 yr–1 for legume crops. As a result, the mean annual net ecosystem production NEP (Eq. [11]) amounts to 1211 g CO2 m–2 yr–1 for maize, 116 g CO2 m–2 yr–1 for wheat
Table6.Meanecophysiologicalparametersofthemaximumdaily(indexmax)andweekly(indexmax,wk)apparentquantumyield(a),photosyntheticcapacity(A),daytimerespirationrate(rday),andlightuseefficiency(LUE)forlegume,maize,andwheatcropsestimatedfromflux-towermeasurements(maizeandwheatdataaccordingtoGilmanovetal.,2013).
Crop Parameter amax amax,wk Amax Amax,wk rday,max rday,max,wk LUEmax LUEmax,wk—— mmol mol–1 —— ——mgCO2 m
–2s–1 —— ——mgCO2 m–2s–1 —— —— mmol mol–1 ——
Legumes avg. 52.3 37.9 2.06 1.61 0.41 0.29 39.8 25.3n 26 29 26 29 26 29 26 29
Maize avg. 49.4ns 39.8ns 2.93*** 2.62*** 0.51* 0.37** 44.1ns 34.3***n 17 17 17 17 17 17 17 17
Wheat avg. 35.9*** 29.7** 1.7* 1.34* 0.31** 0.23* 29.7** 20.8nsn 9 9 9 9 9 9 9 9
*Formaize,hypothesisthatmaizemean>legumemeanissignificantatp £0.05;forwheat,hypothesisthatwheatmean<legumemeanissignificantatp £0.05;ns,notsignificant.**Formaize,hypothesisthatmaizemean>legumemeanissignificantatp £0.01;forwheat,hypothesisthatwheatmean<legumemeanissignificantatp £0.01.***Formaize,hypothesisthatmaizemean>legumemeanissignificantatp £0.001;forwheat,hypothesisthatwheatmean<legumemeanissignificantatp £0.001.

Agronomy Journa l • Volume106, Issue2 • 2014 555
Fig.5.SeasonaldynamicsofgrossphotosynthesisPg,ecosystemrespirationRe,netecosystemCO2exchangeF,andaccumulatednetecosystemproductioniNEPinselectedlegumefields:(A)fababean,TraceGasManitoba,2007;(B)soybean,Rosemountconventional,2006;(C)alfalfa,KelloggBiologicalStation,2006;(D)soybean,BrooksField10,2008;(E)soybean,Fermiagriculturalsite,2007;(F)soybean,Meadrainfed,2002;(G)alfalfa,Haller,2003;and(H)soybean,Bondville,2002.

556 Agronomy Journa l • Volume106, Issue2 • 2014
Table7.Thedailymaximaofgrossphotosynthesis(Pg,max), ecosystemrespiration(Re,max), andnetecosystem
exchange(Fmax)andtheannualtotalsofphotosyntheticproduction(GPP),respiration(RE),andneteco-
system
production(NEP)forthesite-yearsofthestudy.
Site
Crop
Year
T air†
PCPN
‡LG
S5§
Tsum5¶
P g,max
R e,max
F max
GPP
RE
NEP
°Cm
m y
r–1
d°Cd
————gCO2
m–2d–1
——
——
————gCO2
m–2
yr–1
——
——
Edmonton,AB,Canada
alfalfa
2010
4.18
381
189
1545
56.31
29.74
35.56
3460
2300
1160
TraceGasManitoba,M
B,Canada
fababean
2007
2.88
464
192
1887
62.83
43.08
38.95
2503
2470
32Oensingen-2,Switzerland
pea
2010
8.39
1142
238
1996
67.98
62.58
28.52
3174
5240
–2066
MandanH5,NorthDakota
alfalfa
2010
5.34
605
206
2088
56.25
39.61
37.58
4332
3419
913
Rosem
ountalternative,Minnesota
soybean/rye
2004
7.31
766
219
2288
50.97
36.90
30.09
3228
2983
245
Rosem
ountconventional,Minnesota
soybean
2004
7.31
766
219
2288
41.90
24.16
24.73
2070
2434
–364
Rosem
ountconventional,Minnesota
soybean
2006
9.20
669
214
2548
53.75
37.89
25.59
2710
3041
–331
Avignon,France
pea
2005
14.01
491
298
3476
60.72
34.56
32.43
1966
2578
–612
Lennox,SD
soybean
2012
10.47
336
239
2999
40.15
17.82
23.62
1360
2032
–672
KelloggBiologicalStation,Michigan
alfalfa
2006
10.05
1156
233
2496
48.87
33.38
30.52
4932
3845
1086
BrooksField-10,Iowa
soybean
2008
7.78
1179
212
2538
42.74
37.15
19.33
1961
2495
–534
Fermiagriculturalsite,Illinois
soybean
2007
9.92
1166
231
2940
53.53
37.81
36.31
3288
3250
38Fermiagriculturalsite,Illinois
soybean
2009
8.02
1162
226
2429
44.26
26.53
26.65
2131
2826
–695
Ames,IA
soybean
2003
9.01
718
225
2688
49.40
38.30
22.02
2353
3159
–806
Meadrainfed,Nebraska
soybean
2002
10.71
544
234
2958
55.73
36.91
26.19
2964
3483
–519
Meadrainfed,Nebraska
soybean
2004
10.35
670
248
2919
52.74
30.47
29.95
2913
3244
–331
Meadirrigatedrotation,Nebraska
soybean
2002
10.55
831
231
2911
58.84
41.04
24.62
3165
3277
–112
BorgoCioffi,Italy
alfalfa
2002–2003
16.31
787
356
3933
53.80
31.97
31.77
6771
5596
1175
Haller,PA
alfalfa
2003
8.87
1193
239
2383
48.98
37.16
35.11
5219
4673
546
Bondville,IL
soybean
1998
12.55
930
266
3290
40.61
27.76
26.87
2063
2712
–649
Bondville, IL
soybean
2000
10.71
582
249
3051
52.95
29.01
36.75
2724
3014
–291
Bondville,IL
soybean
2002
11.65
704
244
3063
57.42
32.12
30.83
2998
2821
177
Bondville,IL
soybean
2004
11.31
1010
266
3046
71.09
37.77
45.38
4032
3269
763
Bondville, IL
soybean
2006
11.83
1025
262
2887
55.36
33.67
30.53
3251
3394
–143
Lamont A
RMmain,Oklahom
a#soybean
2006
16.46
486
313
4385
15.09
19.93
12.58
389
985
–596
WinfredThomasARS,Alabama
soybean/winterwheat
2007
17.60
567
314
4806
36.09
21.23
16.07
2725
3096
–371
WinfredThomasARS,Alabama
soybean/winterwheat
2008
16.20
1310
307
4312
35.90
22.37
13.23
3364
3494
–130
WinfredThomasARS,Alabama
soybean/winterwheat
2009
16.78
1383
307
4381
33.75
27.75
14.33
3997
3925
72Vienna, GA††
peanut
2005
16.77
1265
323
4386
46.34
24.59
25.89
2591
2554
37Min.
2.88
336
189
1545
15.09
17.82
12.58
389
985
–2066
Max.
17.6
1383
356
4806
71.09
62.58
45.38
6771
5596
1175
Mean
10.78
838
252
2997
49.81
32.87
28.00
3056
3159
–103
SE3.87
308
43837
11.35
8.83
7.98
1231
914
697
CV
3637
1728
2327
2940
29N/A
n29
2929
2929
2929
2929
29†Meanannualairtem
perature.
‡Annualprecipitation.
§LG
S5–numberofdayswithmeandailytem
perature>5°
C.
¶Annualsum
ofdailymeantemperatures>5
°C.
# ProductivityandrespirationcharacteristicsforLamontA
RMmainsitearegivenfortheJuly–D
ecem
berperiod,w
hensoybeanwascultivatedasthesecondcropafterwinterwheatharvestedinJune.
††Out-of-seasonrespirationestim
atedusingrespiration–temperaturerelationship.

Agronomy Journa l • Volume106, Issue2 • 2014 557
(Gilmanov et al., 2013), and –103 g CO2 m–2 yr–1 for legume crops. Within the legume group, the data show that perennial legumes (alfalfa) were on average a strong sink, with mean NEP of 976 g CO2 m–2 yr–1 (range 546–1175 g CO2 m–2 yr–1), while annual legumes demonstrated a moderate to strong source activity, with mean NEP of –327 g CO2 m–2 yr–1 (range –2066 to 763 g CO2 m–2 yr–1), although it should be borne in mind that ecosystem respiration for annual legumes definitely includes decomposition of the net production (e.g., root residue) of the previous crop (Gebremedhin et al., 2012).
Our estimates of the GPP and RE for the rainfed (2964 and 3483 g CO2 m–2 yr–1) and irrigated rotation (3165 and 3277 g CO2 m–2 yr–1) soybean crops at the Mead station in 2002 (Table 7) may be compared with tower-based estimates by Suyker et al. (2005) and model-based data by Grant et al. (2007). Suyker et al. (2005) obtained GPP and RE values of 3109 and 3175 g CO2 m–2 yr–1 and 3542 and 3670 g CO2 m–2 yr–1 for the rainfed and irrigated fields, respectively, showing differences ?10% in magnitude from our estimates, which are mostly due to differences in the estimation of daytime ecosystem respiration. Nevertheless, those differences are much smaller than the >30% differences between tower-based estimates by Suyker et al. (2005) cited above and estimates of 4257 and 4290 g CO2 m–2 yr–1 and 4653 and 4763 g CO2 m–2 yr–1, respectively, obtained by Grant et al. (2007) using the mechanistic simulation model. Gebremedhin et al. (2012) also observed the change in sink–source status of rainfed legumes (soybean): in a year with favorable atmospheric precipitation, the soybean crop was a sink, with a seasonal NEP = 242 g CO2 m–2, while in a year with extreme drought (Palmer drought index = –4), the soybean crop acted as a CO2 source, with seasonal NEP = –154 g CO2 m–2.
To graphically describe the general pattern of the source–sink activity of legume fields in comparison with cereals as another dominant group of North American crops (cf. Gilmanov et al., 2013), consider the (GPP, RE) diagram presented in Fig. 6. The advantage of this diagram is that for every point corresponding to a given site-year of measurements, it simultaneously shows all three components of the NEP = GPP – RE equation: GPP as the abscissa, RE as the ordinate, and NEP as the algebraic distance in the horizontal direction from the main diagonal to the point under consideration (positive to the right, negative to the left). For example, for the point A corresponding to the legume crop with the highest NEP, the Borgo Cioffi alfalfa field in 2010, GPP = 6771 and RE = 5596 g CO2 m–2 yr–1. With correction for the organic matter input to the field by liquid sewage in the amount of 1 Mg ha–1 yr–1 = 367 g CO2 m–2 yr–1, point A moves to point A¢, corresponding to respiration of RE¢ = 5229 g CO2 m–2 yr–1. Because the point A¢ lies to the right of the main diagonal, the distance from the diagonal to A¢ in horizontal direction is positive, and NEP = 6771 – 5229 = 1542 g CO2 m–2 yr–1. The point B, describing the pea field at Oensingen in 2010 with GPP = 3174 and RE = 5240, has the lowest uncorrected NEP = –2066 g CO2 m–2 yr–1, as shown by the negatively directed horizontal vector from the diagonal to point B; however, this high respiration (and the resulting low NEP) value includes ?1600 g CO2 m–2 yr–1 from mineralization of the 10 Mg ha–1 of dry manure (7.4% water content, 47.4% C content) applied on the field in spring. With this correction, the modified NEP of the Oensingen pea
crop in 2010 becomes only –466 g CO2 m–2 yr–1, moving the corresponding point B¢ on the diagram much closer to the major cluster of legume crops.
Even though agronomically there are many phenological stages within a crop’s cycle (emergence, vegetative production, reproduction, grain filling, senescence, fallow), we partitioned the annual CO2 exchange from the legumes into two distinct periods: a relatively short period from emergence to harvest, when the curve of accumulated NEP is monotonically increasing (legume growing season), and the considerably longer period after harvest until the emergence of a new crop during the next year (fallow). Overall in Fig. 6, only six of the 29 legume points (including, not surprisingly, five alfalfa plots) are located significantly to the right of the diagonal, indicating strong CO2 sink activity, while 14 (including 11 soybean crops) are clearly to the left of the diagonal, being net sources of CO2 on an annual basis. Nine of the points lie close to the 1:1 line, indicating a zero C balance with respect to atmospheric CO2 exchange. One of the reasons for the negative net ecosystem production in many annual legumes is their shorter growing season compared with cereals or perennial legumes grown for forage (according to the data in Table 5, ecophysiological parameters for alfalfa are not significantly different from annual legumes). Another reason is that legumes are usually cultivated in rotation or as the second seasonal crop following grain and/or cover crops, so that part of the NEP of the first crop is being metabolized during legume cultivation. The third reason, apparently applicable to all legumes, may be associated with the metabolic costs of symbiotic N2 fixation. According to Werner (1992), fixing 1 g of N requires 12 g of carbohydrates. Assuming the average N2 fixation rate as 125 kg N ha–1 yr–1 in soybean fields (Salvagiotti et al., 2008) and 250 kg N ha–1 yr–1 in alfalfa fields (Stacey et al., 1992), the annual CO2 cost of N2 fixation might be estimated as 220 to 440 g CO2 m–2 yr–1. Taking into account that N2 fixation costs are not the only reason for additional ecosystem respiration in
Fig.6.Flux-tower-basedestimatesofannualgrossprimaryproduction(GPP)andtotalrespiration(RE)ofvariousagroecosystems.Solidsymbolsshowlegumecrops;opensymbolsarecereals(Gilmanovetal.,2013),presentedforcomparison.

558 Agronomy Journa l • Volume106, Issue2 • 2014
legume fields, at the qualitative level, these numbers compare well with the shift of ?800 g CO2 m–2 yr–1 of the legume points to the left relative to the cereal points, as shown in Fig. 6, where the mean NEP for maize is 1211 g CO2 m–2 yr–1, 116 g CO2 m–2 yr–1 for wheat, and –135 g CO2 m–2 yr–1 for legumes. In contrast to annual legumes, perennial legume crops (alfalfa) demonstrated pronounced CO2 sink activity, with corresponding points on the GPP–RE diagram located to the right of the main diagonal. Nevertheless, on average, they also are shifted to the left compared with maize crops (Fig. 6), apparently reflecting the metabolic costs of N2 fixation.
conclusIons1. Ecosystem-scale physiological parameters of apparent quan-
tum yield, photosynthetic capacity, ecosystem respiration, and photosynthetic light-use efficiency of the legume crops of North America estimated from flux-tower measurements using light-response function methods have intermediate values between the higher values for maize and lower values for wheat crops.
2. During the growing period, the parameters of quantum yield, photosynthetic capacity, respiration rate, and light-use efficiency exhibited pronounced patterns of seasonal varia-tion, reflecting combined changes in intensive (physiologi-cal and phenological state) and extensive (biomass and leaf area) characteristics of the plant canopy, which have strong implications for the “light-use efficiency-based” models of ecosystem CO2 exchange.
3. In periods of strong limitation of plant productivity due to water deficit, it is necessary to modify the classical nonrect-angular hyperbolic equation of the canopy CO2 exchange by introduction of VPD-dependent control of photosynthetic uptake. The curvature coefficient of the VPD response, sVPD (Eq. [5]), and characteristics derived from it, like the number of days when sVPD < 4 and VPDmax ³ 1.0 kPa, may be used to quantify the level of VPD limitation of CO2 exchange for comparative purposes.
4. Perennial legume crops (alfalfa) perform as strong sinks for atmospheric CO2, with mean NEP of 980 (maximum 1200) g CO2 m–2 yr–1, but remain less productive than maize crops, with mean NEP of 1200 (maximum 2100) g CO2 m–2 yr–1, reduction in the alfalfa NEP being compa-rable to the costs of symbiotic N2 fixation estimated at 220 to 440 g CO2 m–2 yr–1.
5. Annual RE controls a larger fraction of the GPP for annual legume crops than for cereals (Fig. 6), also reflecting gener-ally lower NEP values and the potential for CO2–source activity, particularly for soybean and pea crops. This conclu-sion has four far-reaching implications. First, metabolic ex-penditures for N2 fixation combined with the comparatively short growing season(s) may be among the factors contribut-ing to lower annual NEP. Second, any management activity that affects C exchange during the period when legumes are not present can greatly change the annual C balance. These activities range from prolonging the fallow period (increas-ing the likelihood of an annual source) to multicropping systems (increasing the sink capacity), or other management activities, e.g., increased irrigation or fertilizer use. Third, any change in the abiotic drivers that affect the process rates (e.g.,
temperature, water availability, or light) will in turn affect the source–sink strength of these legume crops. A change in these drivers can be in the magnitude, quality, and periodic-ity, as well as the timing of seasonal changes, e.g., phenology, early-onset spring, or early-onset summer drought. Lastly, in-teractions among natural drivers, management choices, and agronomic economies are likely to change local to regional C balances of future legume cropping—but also bound within the ecophysiological parameters presented here.
AcknoWledgMents
This work used eddy covariance data acquired by the FLUXNET community and in particular by the following networks: AmeriFlux (USDOE, Biological and Environmental Research, Terrestrial Carbon Program [DE-FG02-04ER63917 and DE-FG02-04ER63911]), CarboEuropeIP, Fluxnet‐Canada (supported by CFCAS, NSERC, BIOCAP, Environment Canada, and NRCan), Canadian Foundation for Innovation, iCORE (Alberta Innovates Technology Futures) and NSERC. The USGS Land Change Science Program funded flux partitioning and analysis as well as remote sensing components of the work. We acknowledge the financial support to the eddy covariance data harmonization provided by the USDA-ARS, CarboEuropeIP, the National Science Foundation (NSF), and the USDOE and the database development and technical support from Berkeley Water Center, Lawrence Berkeley National Lab., Microsoft Research eScience, Oak Ridge National Lab., Univ. of California–Berkeley, CARBOEUROPE-IP and the CARBOFRANCE project funded by the European FP7 Program (GOCECT-2003-505572) and the French Ministry in charge of Environment (GICC programme). Financial support was also provided by the USDOE, Office of Science (DE-FCO2-07ER64494) and Office of Energy Efficiency and Renewable Energy (DE-ACO5-76RL01830), the NSF LTER Program (DEB 1027253), and MSU AgBioResearch. The data for the southeastern plains was provided by the Alabama Agricultural and Mechanical University, Winfred Thomas Agricultural Research Station. Henry W. Loescher acknowledges the NSF (EF-102980) for their ongoing support. This article has been peer reviewed and approved for publication consistent with USGS Fundamental Science Practices (http://pubs.usgs.gov/circ/1367/); opinions, findings, and conclusions or recommendations expressed herein do not necessarily reflect the views of the other support agencies.
ReFeRencesAsseng, S., and T.C. Hsiao. 2000. Canopy CO2 assimilation, energy balance,
and water use efficiency of an alfalfa crop before and after cutting. Field Crops Res. 67:191–206. doi:10.1016/S0378-4290(00)00094-0
Aubinet, M., T. Vesala, and D. Papale, editors. 2012. Eddy covariance: A practical guide to measurement and data analysis. Springer, Dordrecht, the Netherlands.
Baker, J.M., and T.J. Griffis. 2005. Examining strategies to improve the carbon balance of corn/bean agriculture using eddy covariance and mass balance techniques. Agric. For. Meteorol. 128:163–177. doi:10.1016/j.agrformet.2004.11.005
Baldocchi, D.D., S.B. Verma, and N.J. Rosenberg. 1981a. Mass and energy exchange of a soybean canopy under various environmental regimes. Agron. J. 73:706–710. doi:10.2134/agronj1981.00021962007300040034x
Baldocchi, D.D., S.B. Verma, and N.J. Rosenberg. 1981b. Environmental effects of CO2 flux and CO2–water flux ratio of alfalfa. Agric. Meteorol. 24:175–184. doi:10.1016/0002-1571(81)90042-X
Baldocchi, D.D., S.B. Verma, N.J. Rosenberg, B.L. Blad, A. Garay, and J.E. Specht. 1983. Influence of water stress on the diurnal exchange of mass and energy between the atmosphere and a soybean canopy. Agron. J. 75:543–548. doi:10.2134/agronj1983.00021962007500030029x

Agronomy Journa l • Volume106, Issue2 • 2014 559
Bernacchi, C.J., S.E. Hollinger, and T. Meyers. 2005. The conversion of the corn/soybean ecosystem to no-till agriculture may result in a carbon sink. Global Change Biol. 11:1867–1872.
Bernacchi, C.J., S.E. Hollinger, and T. Meyers. 2006. Corrigendum: The conversion of the corn/soybean ecosystem to no-till agriculture may result in a carbon sink. Global Change Biol. 12:1585–1586. doi:10.1111/j.1365-2486.2006.01195.x
Cooper, J.P. 1970. Potential production and energy conversion in temperate and tropical grasses. Herb. Abstr. 40:1–13.
El-Sharkawy, M.A., J.H. Cook, and A.A. Held. 1984. Water use efficiency of cassava: II. Differing sensitivity of stomata to air humidity in cassava and other warm-climate species. Crop Sci. 24:503–507. doi:10.2135/cropsci1984.0011183X002400030018x
Endres, L., J.V. Silva, V.M. Ferreira, and G.V.D.S. Barbosa. 2010. Photosynthesis and water relations in Brazilian sugarcane. Open Agric. J. 4:31–37.
Fischer, M., D. Billesbach, J. Berry, W. Riley, and M. Torn. 2007. Spatiotemporal variations in growing season exchanges of CO2, H2O, and sensible heat in agricultural fields of the Southern Great Plains. Earth Interact. 11:1–21. doi:10.1175/EI231.1
Gebremedhin, M.T., H.W. Loescher, and T.D. Tsegaye. 2012. Carbon balance of no-till soybean with winter wheat cover crop in the southeastern United States. Agron. J. 104:1321–1335. doi:10.2134/agronj2012.0072
Gilmanov, T.G., L. Aires, L. Belelli, Z. Barcza, V.S. Baron, J. Beringer, et al. 2010. Productivity, respiration, and light-response parameters of world grassland and agro-ecosystems derived from flux-tower measurements. Rangeland Ecol. Manage. 63:16–39. doi:10.2111/REM-D-09-00072.1
Gilmanov, T.G., J.F. Soussana, L. Aires, V. Allard, C. Ammann, M. Balzarolo, et al. 2007. Partitioning European grassland net ecosystem CO2 exchange into gross primary productivity and ecosystem respiration using light response function analysis. Agric. Ecosyst. Environ. 121: 93–120. doi:10.1016/j.agee.2006.12.008
Gilmanov, T.G., L.L. Tieszen, B.K. Wylie, L.B. Flanagan, A.B. Frank, M.R. Haferkamp, et al. 2005. Integration of CO2 flux and remotely-sensed data for primary production and ecosystem respiration analyses in the Northern Great Plains: Potential for quantitative spatial extrapolation. Global Ecol. Biogeogr. 14:271–292. doi:10.1111/j.1466-822X.2005.00151.x
Gilmanov, T.G., S.B. Verma, P.L. Sims, T.P. Meyers, J.A. Bradford, G.G. Burba, and A.E. Suyker. 2003. Gross primary production and light response parameters of four Southern Plains ecosystems estimated using long-term CO2-flux tower measurements. Global Biogeochem. Cycles 17:002003. doi:10.1029/2002GB002023
Gilmanov, T.G., B.K. Wylie, L.L. Tieszen, T.P. Meyers, V.S. Baron, C.J. Bernacchi, et al. 2013. CO2 uptake and ecophysiological parameters of the grain crops of midcontinent North America: Estimates from flux tower measurements. Agric. Ecosyst. Environ. 164:162–175. doi:10.1016/j.agee.2012.09.017
Glenn, A.J., B.D. Amiro, M. Tenuta, S.E. Steward, and C. Wagner-Riddle. 2010. Carbon dioxide exchange in a northern prairie cropland system over three years. Agric. For. Meteorol. 150:908–918. doi:10.1016/j.agrformet.2010.02.010
Grant, R.F., T.J. Arkebauer, A. Dobermann, K.G. Hubbard, T.T. Schimelfenig, A.E. Suyker, et al. 2007. Net biome productivity of irrigated and rainfed maize–soybean rotations: Modeling vs. measurements. Agron. J. 99:1404–1423. doi:10.2134/agronj2006.0308
Hernandez-Ramirez, G., J.L. Hatfield, T.B. Parkin, T.J. Sauer, and J.H. Prueger. 2011. Carbon dioxide fluxes in corn–soybean rotation in the midwestern U.S.: Inter- and intra-annual variations, and biophysical controls. Agric. For. Meteorol. 151:1831–1842. doi:10.1016/j.agrformet.2011.07.017
Hollinger, S.E., C.J. Bernacchi, and T.P. Meyers. 2005. Carbon budget of mature no-till ecosystem in North Central Region of the United States. Agric. For. Meteorol. 130:59–69. doi:10.1016/j.agrformet.2005.01.005
Lasslop, G., M. Reichstein, D. Papale, A.D. Richardson, A. Arneth, A. Barr, et al. 2010. Separation of net ecosystem exchange into assimilation and respiration using a light response curve approach: Critical issues and global evaluation. Global Change Biol. 16:187–208. doi:10.1111/j.1365-2486.2009.02041.x
Loescher, H.W., B.E. Law, L. Mahrt, D.Y. Hollinger, J.L. Campbell, and S.C. Wofsy. 2006. Uncertainties in, and interpretation of, carbon flux estimates using the eddy covariance technique. J. Geophys. Res. 111:D21S90. doi:10.1029/2005JD006932
Long, S.P., M.B. Jones, and M.J. Roberts, editors, 1992. Primary productivity of grass ecosystems of the tropics and sub-tropics. Chapman and Hall, London.
Ludwick, A.E. 2000. High yield alfalfa: 24 tons irrigated … 12 tons non-irrigated. Better Crops 84:18–19.
Meyers, T.P., and S.E. Hollinger. 2004. An assessment of storage terms in the surface energy balance of maize and soybean. Agric. For. Meteorol. 125:105–115. doi:10.1016/j.agrformet.2004.03.001
Peng, Y., and A.A. Gitelson. 2012. Remote estimation of gross primary productivity in soybean and maize based on total crop chlorophyll content. Remote Sens. Environ. 117:440–448. doi:10.1016/j.rse.2011.10.021
Pingintha, N., M.Y. Leclerc, J.P. Beasley, Jr., D. Durden, G. Zhang, C. Senthong, and D. Rowland. 2010. Hysteresis response of daytime net ecosystem exchange during drought. Biogeosciences 7:1159–1170. doi:10.5194/bg-7-1159-2010
Platt, S.G., and J.A. Bassham. 1978. Photosynthesis and increased production of protein. Adv. Exp. Med. Biol. 105:195–247. doi:10.1007/978-1-4684-3366-1_12
Reichstein, M., E. Falge, D. Baldocchi, D. Papale, R. Valentini, M. Aubinet, et al. 2005. On the separation of net ecosystem exchange into assimilation and ecosystem respiration: Review and improved algorithm. Global Change Biol. 11:1424–1439. doi:10.1111/j.1365-2486.2005.001002.x
Salvagiotti, F., K.G. Cassman, J.E. Specht, D.T. Walters, A. Weiss, and A.R. Dobermann. 2008. Nitrogen uptake, fixation and response to fertilizer N in soybeans: A review. Field Crops Res. 108:1–13. doi:10.1016/j.fcr.2008.03.001
Skinner, R.H., and P.R. Adler. 2010. Carbon dioxide and water fluxes from switchgrass managed for bioenergy production. Agric. Ecosyst. Environ. 138:257–264. doi:10.1016/j.agee.2010.05.008
Specht, J.E., D.J. Hume, and S.V. Kumudini. 1999. Soybean yield potential: A genetic and physiological perspective. Crop Sci. 39:1560–1570. doi:10.2135/cropsci1999.3961560x
Stacey, G., R.H. Burris, and H.J. Evans, editors. 1992. Biological nitrogen fixa-tion. Springer, New York.
Stella, P., E. Lamaud, Y. Brunet, J.-M. Bonnefond, D. Loustau, and M. Irvine. 2009. Simultaneous measurements of CO2 and water exchanges over three agroecosystems in south-west France. Biogeosci. Discuss. 6:2489–2522. doi:10.5194/bgd-6-2489-2009
Stoy, P.C., G.G. Katul, M.B.S. Siqueira, J.-Y. Juang, K.A. Novick, J.M. Uebelherr, and R. Oren. 2006. An evaluation of models for partitioning eddy covariance-measured net ecosystem exchange into photosynthesis and respiration. Agric. For. Meteorol. 141:2–18. doi:10.1016/j.agrformet.2006.09.001
Suyker, A.E., T.J. Arkebauer, S.B. Verma, and G.G. Burba. 2005. Gross primary production and ecosystem respiration of irrigated maize and irrigated soybean during a growing season. Agric. For. Meteorol. 131:180–190. doi:10.1016/j.agrformet.2005.05.007
Thomas, M.D., and G.R. Hill. 1949. Photosynthesis under field conditions. In: J. Franck and W.E. Loomis, editors, Photosynthesis in plants. Iowa State College Press, Ames. p. 19–52.
Thornley, J.H.M., and I.R. Johnson. 2000. Plant and crop modelling: A mathematical approach to plant and crop physiology. Blackburn Press, Caldwell, NJ.
Verma, S.B., D.T. Walters, J.M. Knops, T.J. Arkebauer, A.E. Suyker, G.G. Burba, et al. 2005. Annual carbon dioxide exchange in irrigated and rainfed maize-based agroecosystems. Agric. For. Meteorol. 131:77–96. doi:10.1016/j.agrformet.2005.05.003
Werner, D. 1992. Physiology of nitrogen-fixing legume nodules: Compartments and functions. In: G. Stacey et al., editors, Biological nitrogen fixation. Chapman and Hall, New York. p. 399–431.
Zeri, M., K. Anderson-Teixeira, G. Hickman, M. Masters, E. DeLucia, and C.J. Bernacchi. 2011. Carbon exchange by establishing biofuel crops in central Illinois. Agric. Ecosyst. Environ. 144:319–329. doi:10.1016/j.agee.2011.09.006