Embed Size (px)
Citation preview

Production Possibilities Curve/Frontier Model

Bik
es
Computers
14
12
10
8
6
4
2
0
0 2 4 6 8 10
A
B
C
D
E
G
Inefficient
Unattainable (given current resources)
Efficient
A B C D E F
14 12 9 5 0 0
0 2 4 6 8 10
Bikes
Computers
F
Each point
represents a specific
combination of goods that
can be
produced given full
employment of resources.
Production Possibilities Table

PRODUCTION POSSIBILITIES CURVE/FRONTIERA production possibilities curve (PPC) is a model that graphically demonstrates efficiency, opportunity costs, and economic growth.
Key Assumptions
•Only two goods can be produced
•Full employment of resources
•In the short-run, resources and technology are fixed
3

TWO TYPES OF EFFICIENCY
Productive Efficiency
•Full employment of resources, no missed opportunities
•This is any point ON the PPC
Allocative Efficiency
•The products being produced are the ones most desired by society
•This optimal point on the PPC depends on what consumers want

Bik
es
Computers
14
12
10
8
6
4
2
0
0 2 4 6 8 10
A
B
C
D
F
E
G
5
Productively efficient combinations are A through D
Allocative efficient combinations depend on the
wants of society
What if this represents a country with no electricity?
WHICH POINTS ARE PRODUCTIVELY EFFICIENT?WHICH ARE ALLOCATIVELY EFFICIENT?

Size 20
running shoes
Size 10 running shoes
A Yes and no. It is productively efficient
but mostly likely not the combination
society would need.
IS COMBINATION “A” EFFICIENT?

2 Bikes
2.The opportunity cost of moving from b to d is…
4.The opportunity cost of moving from f to c is…
3.The opportunity cost of moving from d to b is…
7 Bikes
4 Computers
0 Computers
5.What can you say about point G?
Unattainable
1. The opportunity cost of moving from a to b is…
Opportunity CostThe slope of the PPC is equal to the opportunity cost.
7

PIZZA 0 1 2 3 4
CALZONES 4 3 2 1 0
• List the opportunity cost of moving from a-b, b-c, c-d, and d-e.
• Constant Opportunity Costs- resources are easily adaptable for producing either
good.• Result is a straight line PPC (not common)
A B C D E
8
Constant Opportunity Cost

Blue Jeans 20 19 16 10 0
Fire Engines 0 1 2 3 4
• List the opportunity cost of moving from a-b, b-c, c-d, and d-e.
• Increasing Opportunity Costs- as more of one good is produced, it's opportunity cost rises because well-suited inputs are used up and less adaptable input must be used instead.
• Result is a bowed out (concave to the origin) PPC
A B C D E

Constant vs. Increasing Opportunity Cost
Corn
Wheat
Cactus
Pineapples
Identify which good will have a straight line PPC
and which will be bowed out?

PER UNIT OPPORTUNITY COST
1 Bike
2.The PER UNIT opportunity cost of moving from b to c is…
4.The PER UNIT opportunity cost of moving from d to e is…
3.The PER UNIT opportunity cost of moving from c to d is…
1.5 (3/2) Bikes
2 Bikes
2.5 (5/2) Bikes
= Opportunity Cost
Units Gained
1. The PER UNIT opportunity cost of moving from a to b is…
How much each marginal unit costs
11

PPC AND ECONOMIC GROWTH Economic growth is when an
economy can produce more of both goods (the PPC shifts
outward).
12

13
Key Assumptions Revisited
•Only two goods can be produced
•Full employment of resources
BUT in the long-run, resources and technology change.
How can a country move beyond their current PPC and achieve
economic growth?
3 Shifters of the PPC1. Change in resource quantity or quality
2. Change in technology
3. Change in trade

Ro
bo
ts
Pizzas14
What happens if there is an
increase in the labor force?

Ro
bo
ts
Pizzas
An increase in the labor
force will shift the PPC outward.

Ro
bo
ts
Pizzas
What if there is a technology
improvement in pizza ovens?

Ro
bo
ts
Pizzas
A technology improvement in
pizza ovens will only increase the production of pizzas.

Panama Mexico capital goods > consumer goods
Consumer goods
Cap
ital
Go
od
s
Current
PPC
Future
PPC
Consumer goodsC
ap
ital
Go
od
s
Future
PPC
Current
PPC
18
Countries that produce more capital goods will have
more growth in the future.
CONSUMER GOODS- CREATED FOR DIRECT CONSUMPTION
CAPITAL GOODS- GOODS THAT ARE USED TO PRODUCE OTHER GOODS

PPC Practice
Pizza and Robots
1. New robot making technology
2. Decrease in the demand for pizza
3. Mad cow disease kills 85% of cows
Consumer goods and Capital Goods
4. BP Oil Spill
5. Faster computer hardware
6. The unemployment rate is 10%
7. Post-secondary education rates rise
WHAT HAPPENS TO THE PPC WHEN THE FOLLOWING EVENTS OCCUR?
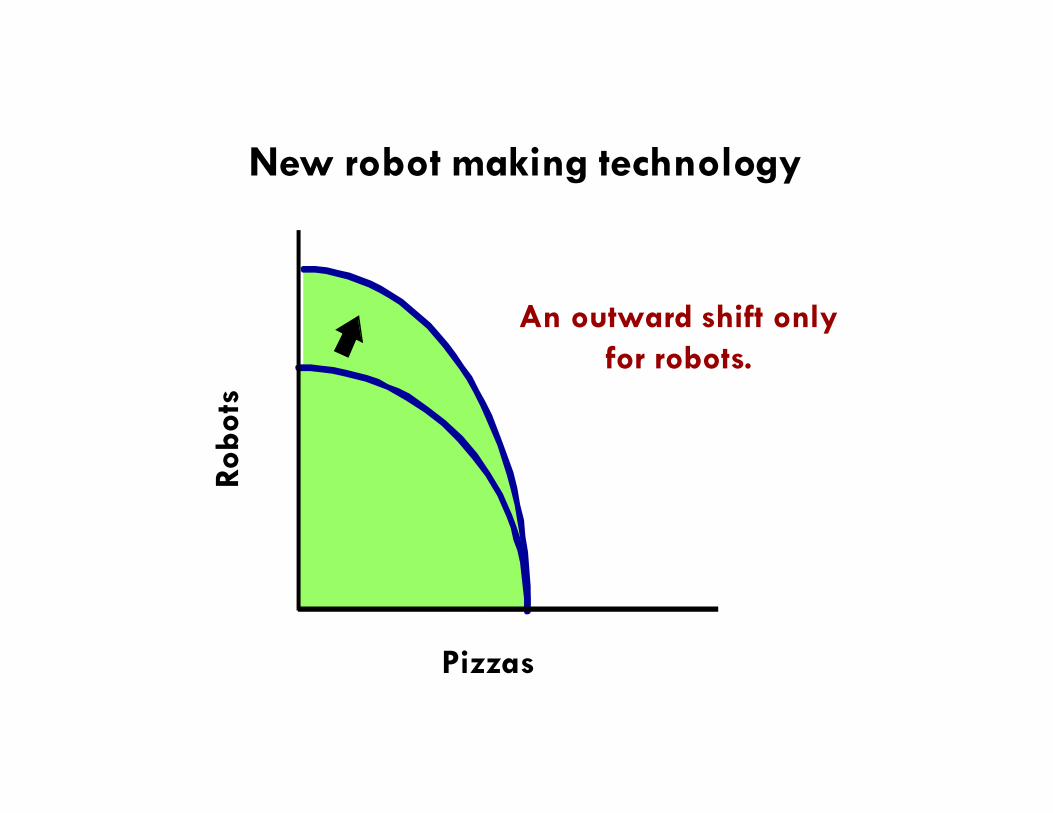
New robot making technology
Ro
bo
ts
Pizzas
An outward shift only
for robots.

Decrease in the demand for pizza
Ro
bo
ts
Pizzas
The curve doesn’t shift!
A change in demand
will only change the
combination of goods
produced.

Mad cow disease kills 85% of cows
Ro
bo
ts
Pizzas
An inward shift only for
pizzas.

BP Oil Spill
Ca
pit
al G
oo
ds
Consumer Goods
A decrease in resources
will decrease production
possibilities for both
goods.

Faster computer hardware
Ca
pit
al G
oo
ds
Consumer Goods
The quality of a resource
improves allowing the
nation to produce more
of both goods.

The unemployment rate is 10%
Ca
pit
al G
oo
ds
Consumer Goods
The curve doesn’t shift!
Less than full
employment of the labor
force is a point in the
inside of the PPC.

Post-secondary education rates rise
Ca
pit
al G
oo
ds
Consumer Goods
The quality of labor improved
resulting in an outward shift.


Absolute advantage: the ability of an individual/firm/nation to produce a good/service more efficiently than others.
Comparative advantage: the ability of an individual/firm/nation to produce a good/service at a lower opportunity cost.
PPC: ECONOMIC GROWTH AND TRADE

29
� The "output method" provides data on the amount of output that can be
produced with a given amount of an input.
� To find the opportunity cost of producing corn, the Q of sunscreen
goes over the Q of corn.
Output Questions:
OOO=
Output: Other goes Over
DETERMINING COMPARATIVE ADVANTAGE OUTPUT METHOD
If Mexico produces corn, the
opportunity cost is
150 = 1
300 2
For every bushel of corn Mexico produces, it gives up
the production of 0.5 gallon
of sunscreen.

30
Both/Neither
Canada
Japan
Canada
Output Questions:
OOO=
Output: Other goes Over

31
� The "input method" provides data on the amount of resources needed to
produce one unit of output.� To find the opportunity cost of
producing a TV, the amount of resources it takes to produce a computer goes
under the amount of resources that it takes to produce a TV.
DETERMINING COMPARATIVE ADVANTAGE (INPUT METHOD)
Input Questions:
IOU=
Input: Other goes Under
1 TV 1 Computer
Redland 18 hours 6 hours
Blueland 16 hours 4 hours
If Redland produces a TV,
the opportunity cost is
18 = 3
6
For every TV Redland produces, it gives up the
production of 3 computers.

32
Both/Neither
U.S. – only took 2 hours to produce a bushel of corn
France
U.S.
Input Questions:
IOU=
Input: Other goes Under

Input or Output Question?Number caught per day
Deer Antelope
Henry 4 6
John 24 12
Months to produce one
Car Plane
Canada 8 10
Japan 15 12
Acres to produce 100 bushels
Corn Rice
Henry 9 3
John 8 2
OOO
IOU
IOU

Number caught per day
Deer Antelope
Henry 4 6
John 24 12
Months to produce one
Car Plane
Canada 8 10
Japan 15 12
Acres to produce 100 bushels
Corn Rice
Henry 9 3
John 8 2
OOO
IOU
IOU
Absolute Advantage?

Comparative Advantage?Number caught per day
Deer Antelope
Henry 4 6
John 24 12
Months to produce one
Car Plane
Canada 8 10
Japan 15 12
Acres to produce 100 bushels
Corn Rice
Henry 9 3
John 8 2
OOO
IOU
IOU

Comparative Advantage?Number caught per day
Deer Antelope
Henry 4 (1D=3/2A) 6 (1A =2/3D)
John 24 (1D=1/2A) 12(1A=2D)
Months to produce one
Car Plane
Canada 8 10
Japan 15 12
Acres to produce 100 bushels
Corn Rice
Henry 9 3
John 8 2
OOO
IOU
IOU

Comparative Advantage?Number caught per day
Deer Antelope
Henry 4 (1D=3/2A) 6
John 24 (1D=1/2A) 12
Months to produce one
Car Plane
Canada 8 (1C=4/5P) 10 (1P=5/4C)
Japan 15(1C=5/4P) 12 (P=4/5C)
Acres to produce 100 bushels
Corn Rice
Henry 9 3
John 8 2
IOU

Comparative Advantage?Number caught per day
Deer Antelope
Henry 4 (1D=3/2A) 6
John 24 (1D=1/2A) 12
Months to produce one
Car Plane
Canada 8 (1C=4/5P) 10
Japan 15(1C=5/4P) 12
Acres to produce 100 bushels
Corn Rice
Henry 9 (1C=3R) 3 (1R = 1/3C)
John 8 (1C=4R) 2 (1R = 1/4C)
IOU

•First- Identify if it is a output or input question •Second-Identify who has the ABSOLUTE ADVANTAGE
•Third-Identify who has a COMPARATIVE ADVANTAGE
1. Sara gives 2 haircuts or 1 perm per hour. Megan gives 3 haircuts or 2 perms per hour.
2. Justin fixes 4 flats or 8 brakes per day. Tim fixes 1 flats or 5 brakes per day.
3. Hannah takes 30 minutes to wash dishes and 1 hour to vacuum the house. Kevin takes 15 minutes to wash dishes and 45 minutes to vacuum.
4. Americans produce 50 computers or 50 TVs per hour. Chinese produce 30 computers or 40 TVs per hour.
COMPARATIVE ADVANTAGE PRACTICE
39

1.Output.
Absolute: Megan in both.
Comparative: Sarah in haircuts and Megan in perms.
2.Output
Absolute: Justin in flats. Tim and Justin share in breaks.
Comparative: Justin in flats and Tim in breaks.
3.Input
Absolute: Kevin in both.
Comparative: Kevin in dishes. Hannah in vacuuming.
4.Output.
Absolute: Americans in both.
Comparative: Americans in computers and Chinese in T.V.s
ANSWERS
40

THEORY OF COMPARATIVE ADVANTAGEA nation should specialize in the production of a good for which it has a lower opportunity cost and trade to obtain those goods for which its opportunity cost is higher.
Which country will produce pineapples? Radios?
Kenya
India
Pineapples Radios
30
40
10
40
(1P = 1/3R)
(1P = 1R)
(1R = 3P)
(1R = 1P)

1. Which nation has an absolute advantage in producing corn?
2. Which nation has an absolute advantage in producing sunscreen?
3. Which nation has a comparative advantage in producing corn?
4. Which nation has a comparative advantage in producing sunscreen?
5. Should Mexico specialize in corn or sunscreen?
6. Should France specialize in corn or sunscreen?
PRACTICE = 1/2 = 2
= 3/4 = 4/3

Country A Country B
Wheat 200 (1 = ½) 100 (1 = 1.5)
Textiles 100 (1 = 2) 150 (1 = 2/3)

TERMS OF TRADE
= 1/2 = 2
= 3/4 = 4/3
150
300
200
Mexico will produce
corn and import sunscreen from
France. France will
produce sunscreen and import corn from
Mexico
Select the good/service with the easier numbers. For this example, the opportunity cost of producing sunscreen
has one fraction while the opportunity cost of corn has two fractions, making sunscreen the easier good to use
when determining the terms of trade.
Using the sunscreen column, we can see that
• France will import corn and will not be willing to accept less than 1.33 bushels of corn since 1 sunscreen = 1.33
corn.
• Mexico produces corn and will not be willing to give up more than 2 bushels of corn since 1 sunscreen = 2 corn.• Therefore the exchange for corn must be between 1.333 and 2 bushels of corn to benefit both countries.
• An acceptable terms of trade would be 1 sunscreen for 1.5 bushels of corn.
- rate of exchange of one product for another when two countries trade.

The differences in opportunity costs define the limits of a trade in which both parties will benefit. The acceptable terms of trade must lie in the range of opportunity costs.
= 1/2 = 2
= 3/4 = 4/3
150
300
200
Would an exchange of 1 sunscreen for 1.5 corn benefit both countries?If Mexico were to exchange all its corn for sunscreen, it would have 200 gallons of
sunscreen (300/1.5). If France were to exchange all of its sunscreen for corn, it would have 225 bushels of corn (150 x 1.5). This terms of trade benefit both countries and increase
both their PPCs.
Mexico will produce corn and import sunscreen from France.
France will produce sunscreen and import corn from Mexico

Su
gar
(to
ns)
Su
gar
(to
ns)
45
40
35
30
25
20
15
30
25
20
15
10
5 10 15 20 25 30 5 10 15 20Wheat (tons) Wheat (tons)
USA
Brazil
Wheat Sugar
30 30
10 20
(1W costs 1S) (1S costs 1W)
(1W costs 2S) (1S costs 1/2W)
1. Which country should EXPORT Sugar?
2. Which country should EXPORT Wheat?
3. Which country should IMPORT Wheat?
4. What should the terms of trade be?
46

Su
gar
(to
ns)
Su
gar
(to
ns)
45
40
35
30
25
20
15
10
5
0
30
25
20
15
10
5
0
5 10 15 20 25 30 5 10 15 20
AFTER TRADE
AFTER TRADE
Wheat (tons) Wheat (tons)
International Trade
47
USA Brazil
TRADE SHIFTS
THE PPC!
Trade: 1 Wheat for 1.5 Sugar

TERMS OF TRADE PRACTICE Suppose that in a year an American worker can produce 20 computers or 100 shirts, while a Chinese worker can produce 10 computers or 100 shirts.
1. Graph the PPC for the two countries.
2. Suppose that without trade the workers in each country spend half of their time producing each good. How much would they produce of each good? Show this on your graph.
3. Give a terms of trade that would be acceptable to both countries.

Shirts Computers
American 100 (1S = 1/5 C) 20 (1c = 5S)
Chinese 100 (1S = 1/10C) 10 (1C = 10S)

Terms of Trade = 1C: 6-9s
1C = 6S Shirts Computers
American 100 120 20
Chinese 100 10 16.6
1C = 9S Shirts Computers
American 100 180 20
Chinese 100 10 11.1

TERMS OF TRADE PRACTICE A average worker in Brazil can produce an ounce of soybeans in 20 minutes and an ounce of coffee in 60 minutes, while an average worker in Peru can produce an ounce of soybeans in 50 minutes and an ounce of coffee in 75 minutes.
1. Who has absolute advantage?
2. Who has comparative advantage in coffee?
3. If the two countries specialize and trade with each other, who will import coffee?
4. Assume that the two countries trade and that the country importing coffee trades 2 ounces of soybeans for 1 ounce of coffee. Explain why both countries will benefit from this trade.

1. Brazil has absolute advantage in both soybeans and coffee.
2. Peru has comparative advantage in coffee.
3. Brazil will produce soybeans and import coffee.
4.
soybeans coffee
Brazil 20 mins (1S = 1/3C) 60 mins (1C =3S)
Peru 50 mins (1S = 2/3C 75 mins (1C = 1.5S)
2S = 1C soybeans coffee
Brazil 3 1 1.5
Peru 1.5 2 1


![€œ”DD !D B !D $ !D ‹ !D ‘ ! D %†A%B‡%†‡%‡# $%& #‹%$# &%$# $%B# ‹%A# A$%B A AA%DAA$%&AA‡%‡A‡&%†AA†%† ]^ ‹D%‘‹$%‰‹B%A‹B%‰‹‰%‹ Z’‚](https://img.dokumen.tips/doc/110x75/5b9dc26e09d3f2443d8cc5b9/dd-d-b-d-d-d-d-ab-b.jpg)