Embed Size (px)
Citation preview
Pc
Qa
b
a
ARRAA
KGFTMH
1
vthpah
cabiiaa
o
h0
Geothermics 62 (2016) 131–142
Contents lists available at ScienceDirect
Geothermics
jo ur nal home p ag e: www .e lsev ier .com/ locate /geothermics
roduction optimization in fractured geothermal reservoirs byoupled discrete fracture network modeling
uan Gana,b,∗, Derek Elswortha
Department of Energy and Mineral Engineering, EMS Energy Institute and G3Center, Pennsylvania State University, University Park, PA, USADepartment of Petroleum Geology & Geology, School of Geosciences, University of Aberdeen, UK
r t i c l e i n f o
rticle history:eceived 22 September 2015eceived in revised form 3 April 2016ccepted 15 April 2016vailable online 26 April 2016
eywords:eothermal reservoirracturehermal breakthroughanifold stimulation
a b s t r a c t
In this work, a stimulation then heat production optimization strategy is presented for prototypicalEGS geothermal reservoirs by comparing conventional stimulation-then-production scenarios againstrevised stimulation schedules. A generic reservoir is selected with an initial permeability in the rangeof 10−17–10−16 m2, fracture density of ∼0.09 m−1 and fractures oriented such that either none, one, orboth sets of fractures are critically stressed. For a given reservoir with a pre-existing fracture network,two parallel manifolds are stimulated that are analogous to horizontal wells that allow a uniform sweepof fluids between the zones. The enhanced connectivity that develops between the injection zone andthe production zone significantly enhances the heat sweep efficiency, while simultaneously increasingthe fluid flux rate at the production well. For a 10 m deep section of reservoir the resulting electricpower production reaches a maximum of 14.5 MWe and is maintained over 10 years yielding cumulative
eat transfer energy recoveries that are a factor of 1.9 higher than for standard stimulation. Sensitivity analyses forvaried fracture orientations and stimulation directions reveal that the direction of such manifolds usedin the stimulation should be aligned closely with the orientation of the major principal stress, in order tocreate the maximum connectivity. When the fractures are less prone to fail, the output electric power isreduced by a decrease in the fluid flux rate to the production well.
© 2016 Elsevier Ltd. All rights reserved.
. Introduction
Enhanced geothermal reservoirs (EGS) have been shown to be aiable resource for the recovery of thermal energy. However, due toheir intrinsic characteristics of low permeability and porosity theyave been proved intractable in developing sufficient fluid through-ut by stimulation. The principal challenge has been in developingdequate permeability in the reservoir that also retains sufficienteat transfer area (Tester et al., 2006).
Numerical simulation is an essential approach to investigateoupled multi-physics processes (Thermal-Hydraulic-Mechanical)nd to better understand the fundamental mechanisms and feed-acks that occur in geothermal reservoirs. This is particularly
mportant due to the intense pressure-sensitivity of fractures
n the coupling of permeability and heat transfer area (Taronnd Elsworth, 2009). From previous studies, thermal quenchingnd resulting contractile strains may substantially unload the∗ Corresponding author at: Department of Petroleum Geology & Geology, Schoolf Geosciences, University of Aberdeen, UK.
E-mail address: [email protected] (Q. Gan).
ttp://dx.doi.org/10.1016/j.geothermics.2016.04.009375-6505/© 2016 Elsevier Ltd. All rights reserved.
reservoir and increase both fracture aperture and permeability viacreep or by induced seismicity and fault reactivation (Gan andElsworth, 2014a,b; Segall and Fitzgerald, 1998). This may occurclose-in to the wellbore at early times and at later times in thefar-field when larger features and faults may be affected (Elsworthet al., 2010; Taron and Elsworth, 2010a). For discretely fracturedrock masses, there are two major approaches to simulate theinfluence of randomly distributed fractures. One approach is torepresent the fractured mass as a continuum where the aggre-gate response is represented (Taron and Elsworth, 2010b) andan alternative is a discontinuum approach (Ghassemi and Zhang,2006; McClure and Horne, 2013; Min and Jing, 2003; Pine andCundall, 1985) where individual fractures are discretized and theirindividual response followed. Continuum methods have the advan-tage of effectively simulating behavior at large (field) scale andfor the long-term due to the lower computational requirements.The behavior of fractures is implicitly included in the equivalentconstitutive models for both deformation and transport. The cen-
tral effort in developing the equivalent continuum approach is theincorporation of crack tensor theory (Oda, 1986). This is differentin behavior from the application of discrete fracture network mod-els (DFNs) where the behavior of individual fractures is explicitly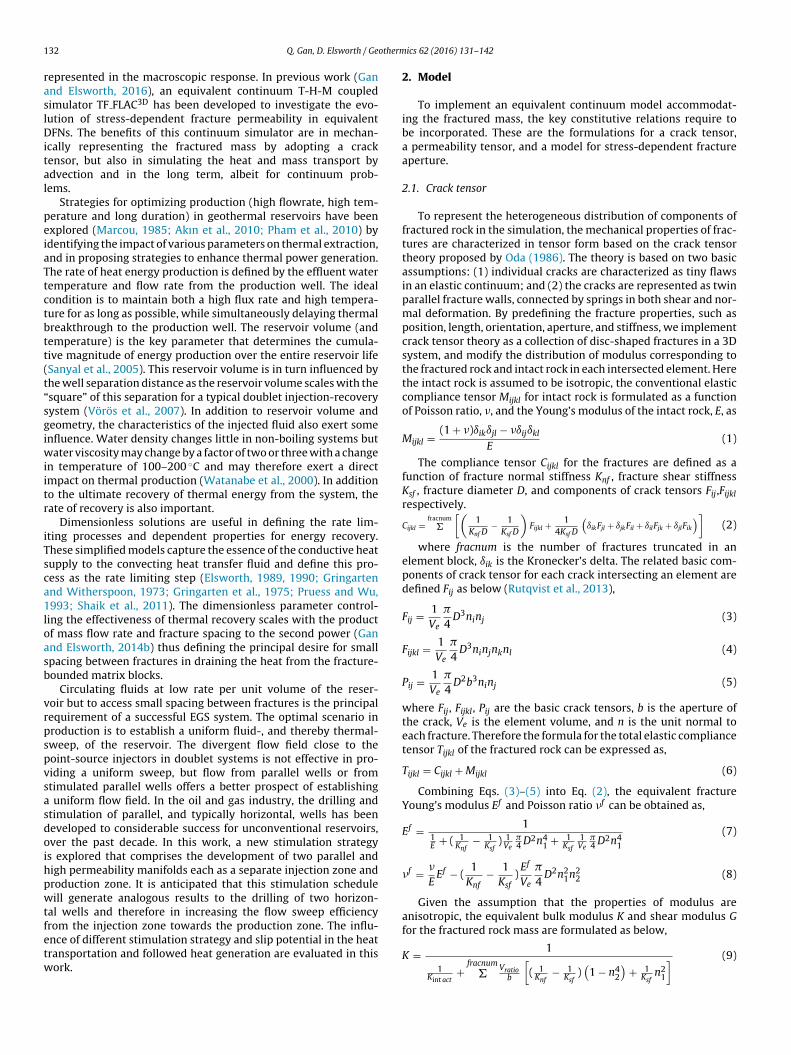
1 otherm
raslDital
peiaTtctbtt(t“sgiwiitr
iTsca1loasb
vrpspvsasdoihpwtfetw
32 Q. Gan, D. Elsworth / Ge
epresented in the macroscopic response. In previous work (Gannd Elsworth, 2016), an equivalent continuum T-H-M coupledimulator TF FLAC3D has been developed to investigate the evo-ution of stress-dependent fracture permeability in equivalentFNs. The benefits of this continuum simulator are in mechan-
cally representing the fractured mass by adopting a crackensor, but also in simulating the heat and mass transport bydvection and in the long term, albeit for continuum prob-ems.
Strategies for optimizing production (high flowrate, high tem-erature and long duration) in geothermal reservoirs have beenxplored (Marcou, 1985; Akın et al., 2010; Pham et al., 2010) bydentifying the impact of various parameters on thermal extraction,nd in proposing strategies to enhance thermal power generation.he rate of heat energy production is defined by the effluent wateremperature and flow rate from the production well. The idealondition is to maintain both a high flux rate and high tempera-ure for as long as possible, while simultaneously delaying thermalreakthrough to the production well. The reservoir volume (andemperature) is the key parameter that determines the cumula-ive magnitude of energy production over the entire reservoir lifeSanyal et al., 2005). This reservoir volume is in turn influenced byhe well separation distance as the reservoir volume scales with thesquare” of this separation for a typical doublet injection-recoveryystem (Vörös et al., 2007). In addition to reservoir volume andeometry, the characteristics of the injected fluid also exert somenfluence. Water density changes little in non-boiling systems but
ater viscosity may change by a factor of two or three with a changen temperature of 100–200 ◦C and may therefore exert a directmpact on thermal production (Watanabe et al., 2000). In additiono the ultimate recovery of thermal energy from the system, theate of recovery is also important.
Dimensionless solutions are useful in defining the rate lim-ting processes and dependent properties for energy recovery.hese simplified models capture the essence of the conductive heatupply to the convecting heat transfer fluid and define this pro-ess as the rate limiting step (Elsworth, 1989, 1990; Gringartennd Witherspoon, 1973; Gringarten et al., 1975; Pruess and Wu,993; Shaik et al., 2011). The dimensionless parameter control-
ing the effectiveness of thermal recovery scales with the productf mass flow rate and fracture spacing to the second power (Gannd Elsworth, 2014b) thus defining the principal desire for smallpacing between fractures in draining the heat from the fracture-ounded matrix blocks.
Circulating fluids at low rate per unit volume of the reser-oir but to access small spacing between fractures is the principalequirement of a successful EGS system. The optimal scenario inroduction is to establish a uniform fluid-, and thereby thermal-weep, of the reservoir. The divergent flow field close to theoint-source injectors in doublet systems is not effective in pro-iding a uniform sweep, but flow from parallel wells or fromtimulated parallel wells offers a better prospect of establishing
uniform flow field. In the oil and gas industry, the drilling andtimulation of parallel, and typically horizontal, wells has beeneveloped to considerable success for unconventional reservoirs,ver the past decade. In this work, a new stimulation strategys explored that comprises the development of two parallel andigh permeability manifolds each as a separate injection zone androduction zone. It is anticipated that this stimulation scheduleill generate analogous results to the drilling of two horizon-
al wells and therefore in increasing the flow sweep efficiencyrom the injection zone towards the production zone. The influ-
nce of different stimulation strategy and slip potential in the heatransportation and followed heat generation are evaluated in thisork.ics 62 (2016) 131–142
2. Model
To implement an equivalent continuum model accommodat-ing the fractured mass, the key constitutive relations require tobe incorporated. These are the formulations for a crack tensor,a permeability tensor, and a model for stress-dependent fractureaperture.
2.1. Crack tensor
To represent the heterogeneous distribution of components offractured rock in the simulation, the mechanical properties of frac-tures are characterized in tensor form based on the crack tensortheory proposed by Oda (1986). The theory is based on two basicassumptions: (1) individual cracks are characterized as tiny flawsin an elastic continuum; and (2) the cracks are represented as twinparallel fracture walls, connected by springs in both shear and nor-mal deformation. By predefining the fracture properties, such asposition, length, orientation, aperture, and stiffness, we implementcrack tensor theory as a collection of disc-shaped fractures in a 3Dsystem, and modify the distribution of modulus corresponding tothe fractured rock and intact rock in each intersected element. Herethe intact rock is assumed to be isotropic, the conventional elasticcompliance tensor Mijkl for intact rock is formulated as a functionof Poisson ratio, �, and the Young’s modulus of the intact rock, E, as
Mijkl = (1 + �)ıikıjl − �ıijıkl
E(1)
The compliance tensor Cijkl for the fractures are defined as afunction of fracture normal stiffness Knf , fracture shear stiffnessKsf , fracture diameter D, and components of crack tensors Fij ,Fijkl
respectively.
Cijkl =fracnum
�
[(1
Knf D− 1
Ksf D
)Fijkl + 1
4Ksf D
(ıikFjl + ıjkFil + ıilFjk + ıjlFik
)](2)
where fracnum is the number of fractures truncated in anelement block, ıik is the Kronecker’s delta. The related basic com-ponents of crack tensor for each crack intersecting an element aredefined Fij as below (Rutqvist et al., 2013),
Fij = 1Ve
�
4D3ninj (3)
Fijkl = 1Ve
�
4D3ninjnknl (4)
Pij = 1Ve
�
4D2b3ninj (5)
where Fij , Fijkl , Pij are the basic crack tensors, b is the aperture ofthe crack, Ve is the element volume, and n is the unit normal toeach fracture. Therefore the formula for the total elastic compliancetensor Tijkl of the fractured rock can be expressed as,
Tijkl = Cijkl + Mijkl (6)
Combining Eqs. (3)–(5) into Eq. (2), the equivalent fractureYoung’s modulus Ef and Poisson ratio �f can be obtained as,
Ef = 11E + ( 1
Knf− 1
Ksf) 1
Ve
�4 D2n4
1 + 1Ksf
1Ve
�4 D2n4
1
(7)
�f = �
EEf − (
1Knf
− 1Ksf
)Ef
Ve
�
4D2n2
1n22 (8)
Given the assumption that the properties of modulus areanisotropic, the equivalent bulk modulus K and shear modulus Gfor the fractured rock mass are formulated as below,
K = 1
1Kint act
+fracnum
�Vratio
b
[( 1
Knf− 1
Ksf)(
1 − n42
)+ 1
Ksfn2
1
] (9)
othermics 62 (2016) 131–142 133
G
wsode
2
idst
k
w
otceremmtw
�
Jatttnse
�
K
wtn
urtn
b
wbW
Fig. 1. Fracture normal dilation displacement evolution induced from the shear slipin fracture.
Q. Gan, D. Elsworth / Ge
= 1
1Gint act
+fracnum
�2Vratio
b
[( 1
Knf− 1
Ksf)(
n41 − n2
1n22
)+ 1
Ksfn2
1
] (10)
here Kint act is the bulk modulus of the intact rock, Gint act is thehear modulus of the intact rock and Vratio is the volumetric ratiof the truncated fracture over the element volume. The stress-ependent evolution of fracture aperture will in turn update thequivalent modulus of the fractured rock masses.
.2. Permeability tensor and aperture evolution
Considering that the randomly distributed fractures may bentersected by multiple elements in the reservoir gridding, theirectional fracture permeability is defined as a permeability ten-or kij , which is able to represent the orientation of fractures andhe explicit fracture volume intersecting any element block.
ij =fracnum
�1
12(Pkkıij − Pij) =
fracnum
�1
12(Vratio
binib3n2
kıij − Vratio
binib3ninj)
here bini is the initial aperture of fracture.The effect of stress has a direct impact in changing the evolution
f the fracture aperture, which will in turn change the complianceensor in the simulation loop. Prior models for stress permeabilityoupling include hyperbolic models of aperture evolution (Bandist al., 1983; Barton and Choubey, 1977), which can describe theesponse of fracture aperture in normal closure under the influ-nce of in-situ stress. The functionality of the hyperbolic model isediated by the parameters of initial fracture normal stiffness K0
nf,
aximum closure of the fracture aperture dn max, initial aperture ofhe fracture, bini, and the effective normal stress of the fracture �
′n,
hich is formulated as,
dn = dn max
1 +K0
nfdn max
�′n
(11)
A simplified Barton-Bandis hyperbolic model (Baghbanan anding, 2007) is adopted to model aperture evolution by introducing
new parameter—the critical normal stress �nc , which means thathe normal compliance Cn is reduced significantly when the aper-ure closure approaches the maximum closure. In order to simplifyhe hyperbolic solution it is assumed that the ratio of maximumormal closure dn max relative to initial fracture aperture bini is con-tant at 0.9. Given this assumption, the hyperbolic normal closurequation is transformed as,
′n = �nc�dn
10(0.9bini − �dn)(12)
and the normal stiffness is determined by the normal stress as,
nf = (10�′n + �nc)
2
9�ncbini(13)
here �nc(MPa) = 0.487bini(�m) + 2.51. This equation implies thathe larger the initial aperture, the larger drawdown gradient oformal stress.
Fracture shear slip and related dilation are included in the sim-lator by lumping the influence into the response of the matrixock being sheared. When the Coulomb failure criterion is reached,he shear displacement us will generate shear dilation bdila in theormal direction according to the equation (Fig. 1),
dila = us tan �d (14)
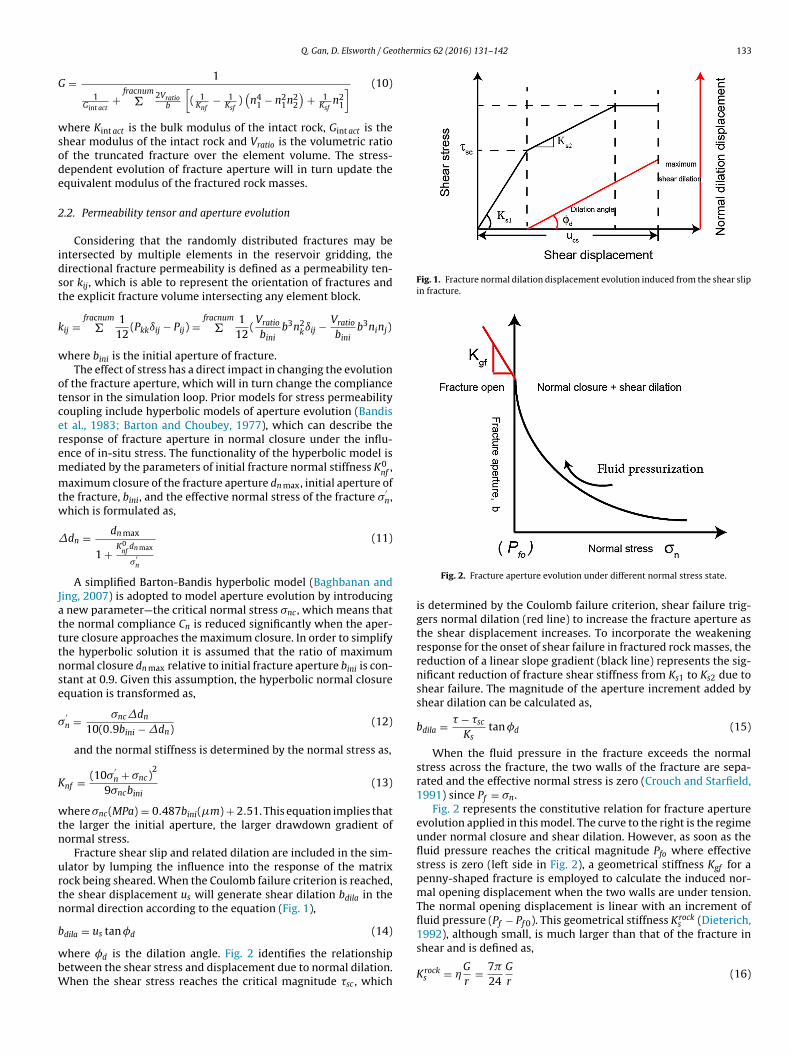
here �d is the dilation angle. Fig. 2 identifies the relationshipetween the shear stress and displacement due to normal dilation.hen the shear stress reaches the critical magnitude sc , which
Fig. 2. Fracture aperture evolution under different normal stress state.
is determined by the Coulomb failure criterion, shear failure trig-gers normal dilation (red line) to increase the fracture aperture asthe shear displacement increases. To incorporate the weakeningresponse for the onset of shear failure in fractured rock masses, thereduction of a linear slope gradient (black line) represents the sig-nificant reduction of fracture shear stiffness from Ks1 to Ks2 due toshear failure. The magnitude of the aperture increment added byshear dilation can be calculated as,
bdila = − sc
Kstan �d (15)
When the fluid pressure in the fracture exceeds the normalstress across the fracture, the two walls of the fracture are sepa-rated and the effective normal stress is zero (Crouch and Starfield,1991) since Pf = �n.
Fig. 2 represents the constitutive relation for fracture apertureevolution applied in this model. The curve to the right is the regimeunder normal closure and shear dilation. However, as soon as thefluid pressure reaches the critical magnitude Pfo where effectivestress is zero (left side in Fig. 2), a geometrical stiffness Kgf for apenny-shaped fracture is employed to calculate the induced nor-mal opening displacement when the two walls are under tension.The normal opening displacement is linear with an increment offluid pressure (Pf − Pf 0). This geometrical stiffness Krock
s (Dieterich,
1992), although small, is much larger than that of the fracture inshear and is defined as,Krocks =
G
r= 7�
24G
r(16)

1 otherm
wtt(co
b
fm
b
wtsc
2
itrweiwibaitetfttasc
34 Q. Gan, D. Elsworth / Ge
here G is the shear modulus of the intact rock, D is the frac-ure half length, and is a geometrical factor which depends onhe crack geometry and assumptions related to slip on the patchDieterich, 1992). In this study, is defined to represent a circularrack and is given as 7�
24 . Therefore the equation for the fracturepening displacement bopen is formulated as below,
open = Pf − Pf 0
Kgf= Pf − Pf 0
10Krocks
= (Pf − Pf 0)
10 × 7�24
Gr
(17)
To summarize, Eqs. (11), (15), and (17), represent the relationsor considering stress-dependent aperture change including nor-
al closure, shear dilation, and fracture opening is obtained as,
= bini − 9bini�′n
�nc + 10�′n
+ − sc
Kstan �d + (Pf − Pf 0)
10 × 7�24
Gr
(18)
here bini is the initial aperture of the fracture, bnormal is the reduc-ion of aperture due to the normal closure, �
′n is the effective normal
tress of the fracture, �nc is the critical normal stress, sc is theritical shear stress where shear failure happens.
.3. Reservoir model
We explore various stimulation strategies to determine thenfluence of stimulation direction relative to the fracture orien-ations on both the magnitude and longevity of thermal recoveryates, for a given reservoir with a defined pre-existing fracture net-ork. For these reservoirs, the fracture permeability of the network
volves subject to the influence of the change in stress state, includ-ng normal closure, shear dilation, and the potential for fracture
alls to lose contact. Thermal effect exerts a strong effect in chang-ng the fracture normal stress with a concomitant influence onoth fracture-normal dilation and on shear-slip-induced dilationnd ultimately modifying permeability. This work investigates thenfluence of an initial stimulation followed by a production phase −hroughout which permeability evolves in response to the evolvingffective stress regime. In particular, we explore the potential thathe stimulation may develop hydraulically-interconnected mani-olds along the axis of a supposed horizontal well (E-W direction)hat in turn may be used to develop a uniform flow field across
he reservoir (in the N-S direction)—to a second parallel manifoldlso aligned in the E-W direction (Fig. 3a). Another stimulationtrategy is to develop permeable manifolds in the N-S direction byonnecting the drilling wells in N-S direction (Fig. 3b). These twoFig. 3. Hydraulically-interconnected manifolds cr
ics 62 (2016) 131–142
behaviors will be different due to the directional characteristics ofboth the stress regime and the topology of the fracture network thatis overprinted on the well pattern. The influence of fracture stimu-lation direction is illustrated through a comparison of the differentdevelopment scenarios.
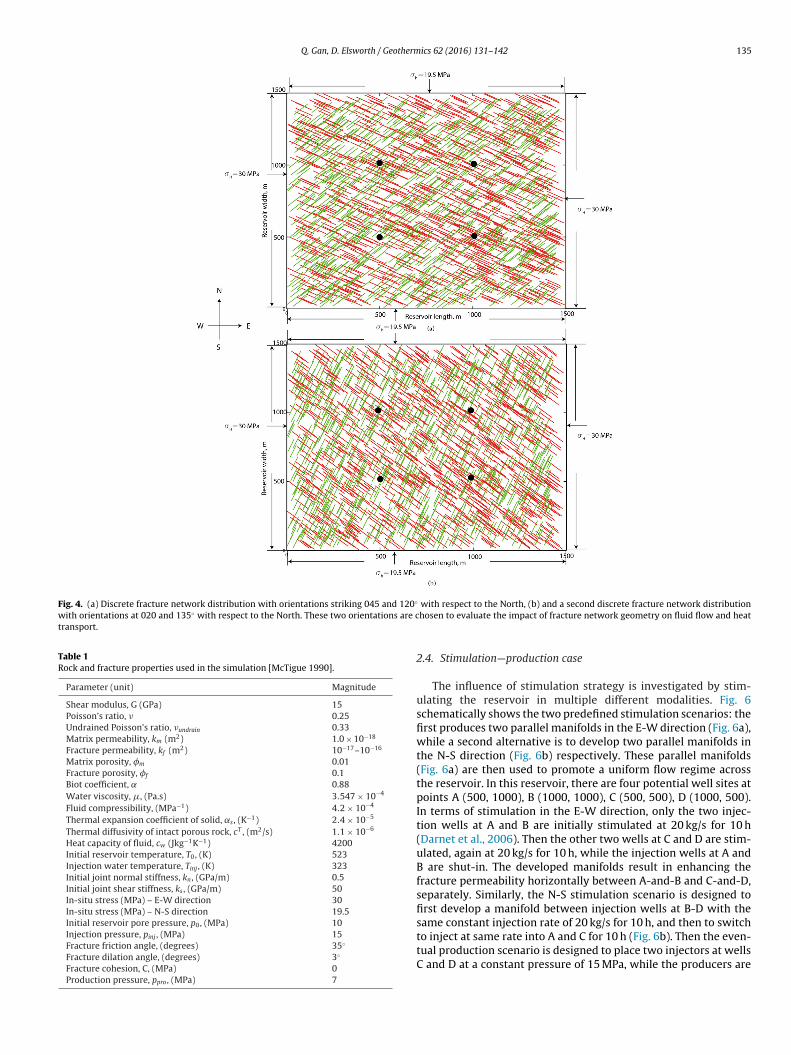
A reservoir containing two sets of fractures is created usingthe equivalent continuum simulator TF FLAC3D. Fig. 4a showsone scenario of the resulting fracture network in a reservoir1500 m × 1500 m × 10 m. The number of grid blocks are createdat 60 × 60 × 1, therefore the size for each block is uniform at25 m × 25 m × 1 m. The initial pressure distribution is uniform at10 MPa, and the initial homogenous rock temperature is 250C. Theminor principal stress is imposed at 19.5 MPa in the N-S direction,while the major principal stress is 30 MPa in the E-W direction. Thegeometries of the pre-existing fracture networks are presented inFig. 3. It is assumed that the networks are consisted by two sets offractures. There are 1000 fractures for each set. The initial perme-ability of the fracture network is in the order of 10−17–10−16 m2.The fractures in each fracture set are oriented at a uniform angle.Two fracture geometries are chosen. The first is where both setsof fractures are favorably oriented for slip and strike 045◦ and120 ◦Clockwise from the North (Fig. 4a) (Odling et al., 1999; Riahiand Damjanac, 2013). The second geometry is where one set is lessfavorably aligned for slip where the fractures strike 020◦ and 135◦
with respect to the North direction (Fig. 4b). The impact of fractureorientations and failure potential on thermal transport and heatrecovery is assessed through the comparison between these twofracture geometries (Table 1).
The length of fractures follows a lognormal distribution with amean length of 80 m (Fig. 4) (de Dreuzy et al., 2001). A power lawis implemented to correlate fracture trace length l with the initialfracture aperture bi (Olson, 2003) as (Fig. 5),
bi = 1.25 × 10⁻⁵ × l0.8 (19)
The fracture density �f (1/m) is expressed as the ratio of fracturesurface area to the volume of matrix rock, as,
�f =∑
Aif
Vrock
where Aif
is the surface area of the ith fracture, and Vrock is the totalrock volume. The fracture density in this particular case is equal to∼0.09 m−1.
eation from different stimulation strategies.
Q. Gan, D. Elsworth / Geothermics 62 (2016) 131–142 135
Fig. 4. (a) Discrete fracture network distribution with orientations striking 045 and 120◦
with orientations at 020 and 135◦ with respect to the North. These two orientations are ctransport.
Table 1Rock and fracture properties used in the simulation [McTigue 1990].
Parameter (unit) Magnitude
Shear modulus, G (GPa) 15Poisson’s ratio, � 0.25Undrained Poisson’s ratio, �undrain 0.33Matrix permeability, km (m2) 1.0 × 10⁻¹⁸
Fracture permeability, kf (m2) 10−17–10−16
Matrix porosity, �m 0.01Fracture porosity, �f 0.1Biot coefficient, 0.88Water viscosity, �, (Pa.s) 3.547 × 10⁻⁴
Fluid compressibility, (MPa−1) 4.2 × 10⁻⁴
Thermal expansion coefficient of solid, ˛s , (K−1) 2.4 × 10⁻⁵
Thermal diffusivity of intact porous rock, cT , (m2/s) 1.1 × 10⁻⁶
Heat capacity of fluid, cw (Jkg−1K−1) 4200Initial reservoir temperature, T0, (K) 523Injection water temperature, Tinj , (K) 323Initial joint normal stiffness, kn , (GPa/m) 0.5Initial joint shear stiffness, ks , (GPa/m) 50In-situ stress (MPa) – E-W direction 30In-situ stress (MPa) – N-S direction 19.5Initial reservoir pore pressure, p0, (MPa) 10Injection pressure, pinj , (MPa) 15Fracture friction angle, (degrees) 35◦
Fracture dilation angle, (degrees) 3◦
Fracture cohesion, C, (MPa) 0Production pressure, ppro , (MPa) 7
with respect to the North, (b) and a second discrete fracture network distributionhosen to evaluate the impact of fracture network geometry on fluid flow and heat
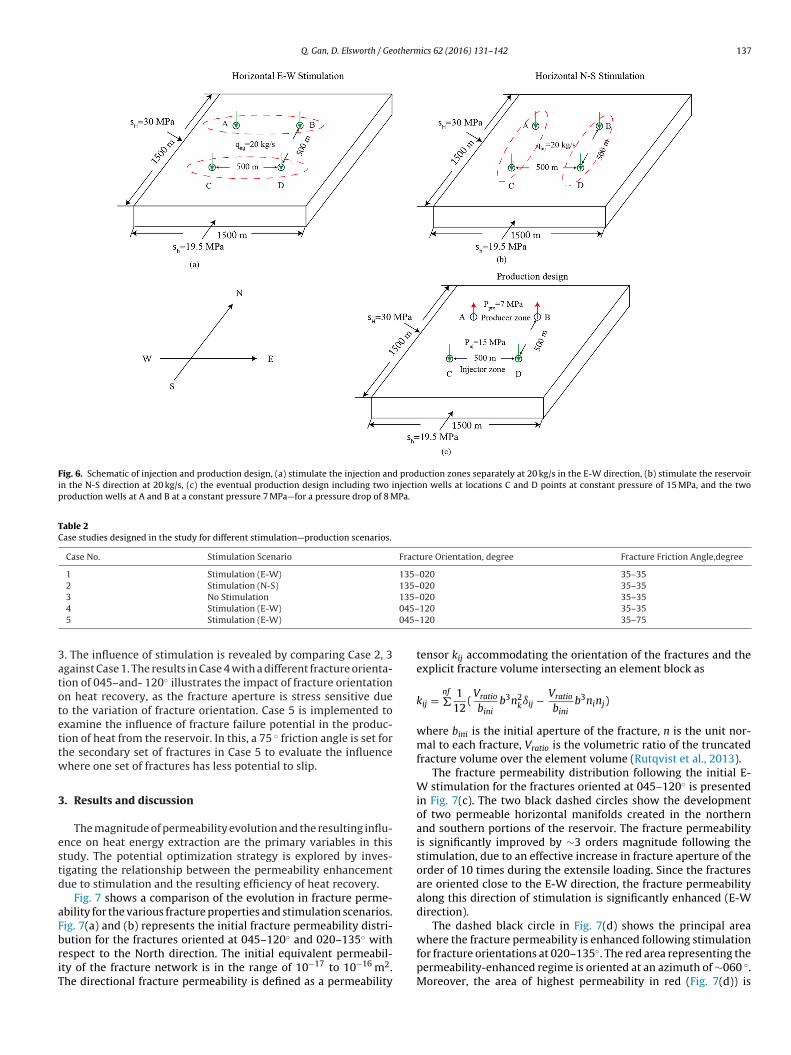
2.4. Stimulation—production case
The influence of stimulation strategy is investigated by stim-ulating the reservoir in multiple different modalities. Fig. 6schematically shows the two predefined stimulation scenarios: thefirst produces two parallel manifolds in the E-W direction (Fig. 6a),while a second alternative is to develop two parallel manifolds inthe N-S direction (Fig. 6b) respectively. These parallel manifolds(Fig. 6a) are then used to promote a uniform flow regime acrossthe reservoir. In this reservoir, there are four potential well sites atpoints A (500, 1000), B (1000, 1000), C (500, 500), D (1000, 500).In terms of stimulation in the E-W direction, only the two injec-tion wells at A and B are initially stimulated at 20 kg/s for 10 h(Darnet et al., 2006). Then the other two wells at C and D are stim-ulated, again at 20 kg/s for 10 h, while the injection wells at A andB are shut-in. The developed manifolds result in enhancing thefracture permeability horizontally between A-and-B and C-and-D,separately. Similarly, the N-S stimulation scenario is designed tofirst develop a manifold between injection wells at B-D with thesame constant injection rate of 20 kg/s for 10 h, and then to switch
to inject at same rate into A and C for 10 h (Fig. 6b). Then the even-tual production scenario is designed to place two injectors at wellsC and D at a constant pressure of 15 MPa, while the producers are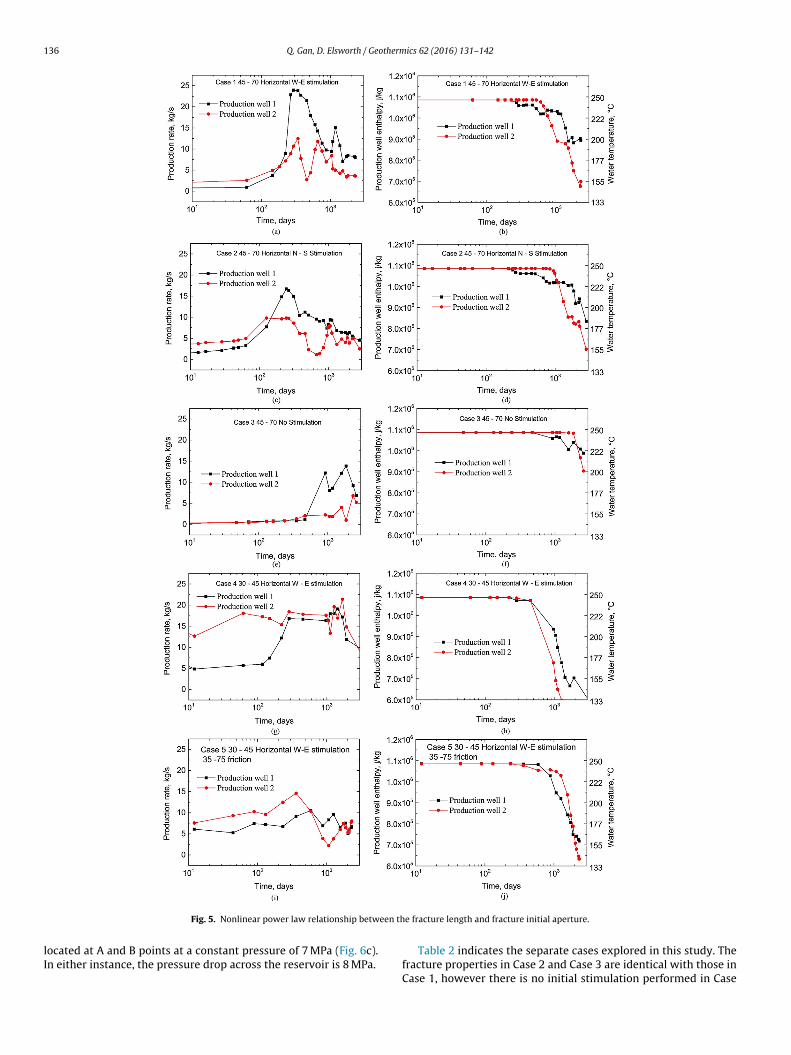
136 Q. Gan, D. Elsworth / Geothermics 62 (2016) 131–142
een th
lI
Fig. 5. Nonlinear power law relationship betw
ocated at A and B points at a constant pressure of 7 MPa (Fig. 6c).n either instance, the pressure drop across the reservoir is 8 MPa.
e fracture length and fracture initial aperture.
Table 2 indicates the separate cases explored in this study. Thefracture properties in Case 2 and Case 3 are identical with those inCase 1, however there is no initial stimulation performed in Case
Q. Gan, D. Elsworth / Geothermics 62 (2016) 131–142 137
Fig. 6. Schematic of injection and production design, (a) stimulate the injection and production zones separately at 20 kg/s in the E-W direction, (b) stimulate the reservoirin the N-S direction at 20 kg/s, (c) the eventual production design including two injection wells at locations C and D points at constant pressure of 15 MPa, and the twoproduction wells at A and B at a constant pressure 7 MPa—for a pressure drop of 8 MPa.
Table 2Case studies designed in the study for different stimulation—production scenarios.
Case No. Stimulation Scenario Fracture Orientation, degree Fracture Friction Angle,degree
1 Stimulation (E-W) 135–020 35–352 Stimulation (N-S) 135–020 35–35
135–045–045–
3atotettw
3
estd
aFbriT
3 No Stimulation
4 Stimulation (E-W)
5 Stimulation (E-W)
. The influence of stimulation is revealed by comparing Case 2, 3gainst Case 1. The results in Case 4 with a different fracture orienta-ion of 045–and- 120◦ illustrates the impact of fracture orientationn heat recovery, as the fracture aperture is stress sensitive dueo the variation of fracture orientation. Case 5 is implemented toxamine the influence of fracture failure potential in the produc-ion of heat from the reservoir. In this, a 75 ◦ friction angle is set forhe secondary set of fractures in Case 5 to evaluate the influencehere one set of fractures has less potential to slip.
. Results and discussion
The magnitude of permeability evolution and the resulting influ-nce on heat energy extraction are the primary variables in thistudy. The potential optimization strategy is explored by inves-igating the relationship between the permeability enhancementue to stimulation and the resulting efficiency of heat recovery.
Fig. 7 shows a comparison of the evolution in fracture perme-bility for the various fracture properties and stimulation scenarios.ig. 7(a) and (b) represents the initial fracture permeability distri-
ution for the fractures oriented at 045–120◦ and 020–135◦ withespect to the North direction. The initial equivalent permeabil-ty of the fracture network is in the range of 10−17 to 10−16 m2.he directional fracture permeability is defined as a permeability020 35–35120 35–35120 35–75
tensor kij accommodating the orientation of the fractures and theexplicit fracture volume intersecting an element block as
kij =nf
�1
12(Vratio
binib3n2
kıij − Vratio
binib3ninj)
where bini is the initial aperture of the fracture, n is the unit nor-mal to each fracture, Vratio is the volumetric ratio of the truncatedfracture volume over the element volume (Rutqvist et al., 2013).
The fracture permeability distribution following the initial E-W stimulation for the fractures oriented at 045–120◦ is presentedin Fig. 7(c). The two black dashed circles show the developmentof two permeable horizontal manifolds created in the northernand southern portions of the reservoir. The fracture permeabilityis significantly improved by ∼3 orders magnitude following thestimulation, due to an effective increase in fracture aperture of theorder of 10 times during the extensile loading. Since the fracturesare oriented close to the E-W direction, the fracture permeabilityalong this direction of stimulation is significantly enhanced (E-Wdirection).
The dashed black circle in Fig. 7(d) shows the principal area
where the fracture permeability is enhanced following stimulationfor fracture orientations at 020–135◦. The red area representing thepermeability-enhanced regime is oriented at an azimuth of ∼060 ◦.Moreover, the area of highest permeability in red (Fig. 7(d)) is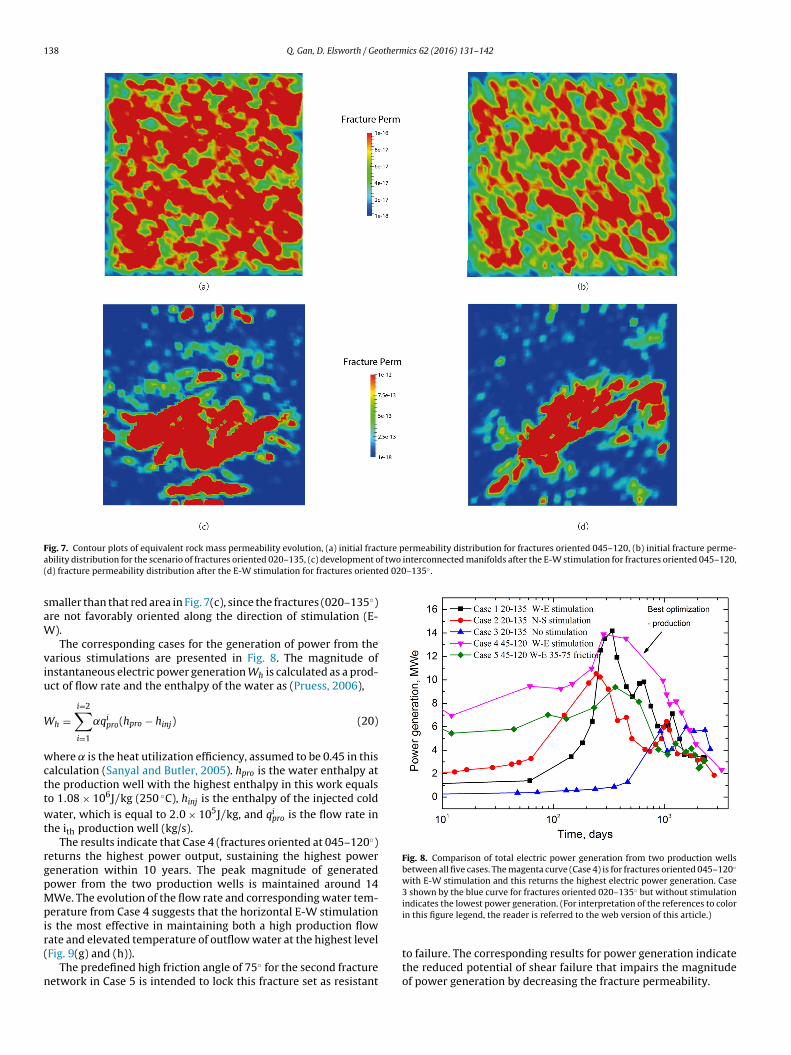
138 Q. Gan, D. Elsworth / Geothermics 62 (2016) 131–142
F ture permeability distribution for fractures oriented 045–120, (b) initial fracture perme-a f two interconnected manifolds after the E-W stimulation for fractures oriented 045–120,( ed 020–135◦ .
saW
viu
W
wcttwt
rgpMpir(
n
Fig. 8. Comparison of total electric power generation from two production wellsbetween all five cases. The magenta curve (Case 4) is for fractures oriented 045–120◦
with E-W stimulation and this returns the highest electric power generation. Case3 shown by the blue curve for fractures oriented 020–135◦ but without stimulation
ig. 7. Contour plots of equivalent rock mass permeability evolution, (a) initial fracbility distribution for the scenario of fractures oriented 020–135, (c) development od) fracture permeability distribution after the E-W stimulation for fractures orient
maller than that red area in Fig. 7(c), since the fractures (020–135◦)re not favorably oriented along the direction of stimulation (E-).The corresponding cases for the generation of power from the
arious stimulations are presented in Fig. 8. The magnitude ofnstantaneous electric power generation Wh is calculated as a prod-ct of flow rate and the enthalpy of the water as (Pruess, 2006),
h =i=2∑i=1
˛qipro(hpro − hinj) (20)
here is the heat utilization efficiency, assumed to be 0.45 in thisalculation (Sanyal and Butler, 2005). hpro is the water enthalpy athe production well with the highest enthalpy in this work equalso 1.08 × 10⁶J/kg (250 ◦C), hinj is the enthalpy of the injected coldater, which is equal to 2.0 × 10⁵J/kg, and qi
pro is the flow rate inhe ith production well (kg/s).
The results indicate that Case 4 (fractures oriented at 045–120◦)eturns the highest power output, sustaining the highest powereneration within 10 years. The peak magnitude of generatedower from the two production wells is maintained around 14We. The evolution of the flow rate and corresponding water tem-
erature from Case 4 suggests that the horizontal E-W stimulations the most effective in maintaining both a high production flow
ate and elevated temperature of outflow water at the highest levelFig. 9(g) and (h)).The predefined high friction angle of 75◦ for the second fractureetwork in Case 5 is intended to lock this fracture set as resistant
indicates the lowest power generation. (For interpretation of the references to colorin this figure legend, the reader is referred to the web version of this article.)
to failure. The corresponding results for power generation indicatethe reduced potential of shear failure that impairs the magnitudeof power generation by decreasing the fracture permeability.

Q. Gan, D. Elsworth / Geothermics 62 (2016) 131–142 139
Fig. 9. Evolution of flow rate and water temperature (enthalpy) in the two production wells. Plots in the left column (a, c, e, g, i) represent the flow rate evolution in the twoproduction wells for the five cases (1–5), plots in the right column (b, d, f, h, j) represent the evolution of water temperature in the two production wells respectively.
140 Q. Gan, D. Elsworth / Geothermics 62 (2016) 131–142
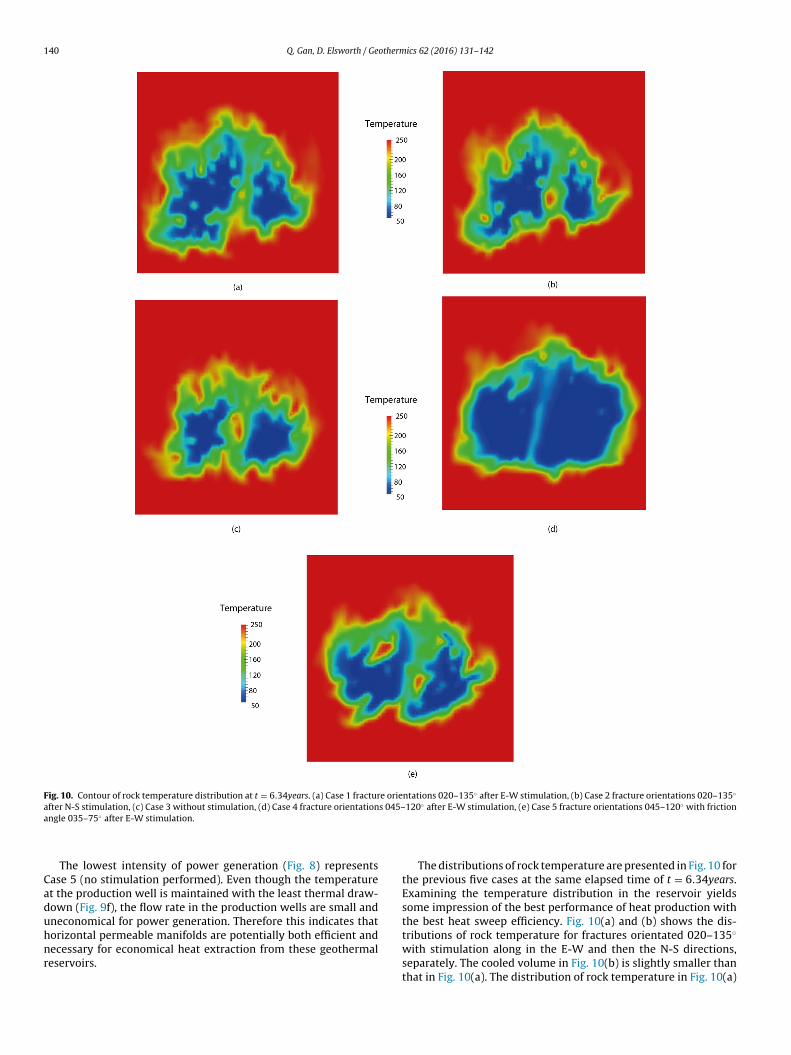
Fig. 10. Contour of rock temperature distribution at t = 6.34years. (a) Case 1 fracture orientations 020–135◦ after E-W stimulation, (b) Case 2 fracture orientations 020–135◦
a s 045– ◦ ◦
a
Caduhnr
fter N-S stimulation, (c) Case 3 without stimulation, (d) Case 4 fracture orientationngle 035–75◦ after E-W stimulation.
The lowest intensity of power generation (Fig. 8) representsase 5 (no stimulation performed). Even though the temperaturet the production well is maintained with the least thermal draw-own (Fig. 9f), the flow rate in the production wells are small andneconomical for power generation. Therefore this indicates that
orizontal permeable manifolds are potentially both efficient andecessary for economical heat extraction from these geothermaleservoirs.120 after E-W stimulation, (e) Case 5 fracture orientations 045–120 with friction
The distributions of rock temperature are presented in Fig. 10 forthe previous five cases at the same elapsed time of t = 6.34years.Examining the temperature distribution in the reservoir yieldssome impression of the best performance of heat production withthe best heat sweep efficiency. Fig. 10(a) and (b) shows the dis-
tributions of rock temperature for fractures orientated 020–135◦with stimulation along in the E-W and then the N-S directions,separately. The cooled volume in Fig. 10(b) is slightly smaller thanthat in Fig. 10(a). The distribution of rock temperature in Fig. 10(a)
otherm
at(mlcwmvchrCa
4
fsgim
nrsotptbzttffuftac
A
oiat
R
A
B
B
B
CD
d
Q. Gan, D. Elsworth / Ge
nd (b) indicate a sharper thermal front propagating from injectoro producer. The cooling regime for the case without stimulationFig. 10(c)) is the smallest among all the cases studied. The ther-
al extraction is limited to around the injection wells due to theow reservoir permeability. Fig. 10(d) shows the case with the mostomplete heat energy depletion in the reservoir for Case 4, whichas primarily contributed from the development of two parallelanifolds as injector zone and producer zone separately. The reser-
oir between the injection wells and the production wells has beenooled both significantly and uniformly − the rock temperatureas been cooled to the temperature of injected water. This coolingesponse reinforces the results for the largest heat generation fromase 4. If one set of fractures is less able to slip, then the coolingrea as shown in Fig. 6(e) would be less than the area in Fig. 6(d).
. Conclusions
The previous case studies focus on examining the impact ofracture orientation, stimulation strategy, and the fracture den-ity in enhancing the permeability and heat energy extraction fromeothermal reservoirs. The best production optimization strategys obtained from a series of simulations aimed to enhance both the
agnitude and longevity of thermal recovery rates.Reservoir stimulation is demonstrated to be efficient in sig-
ificantly enhancing the generated power, compared against theesults without stimulation. In this study, the eventual productionchedule is designed to generate a fluid sweep path in the directionf the minor principal stress (N-S direction). The best optimizationhat results in the highest power generation is to create two parallelermeable manifolds along the major principal stress direction—inhe example here, in the E-W direction. The parallel manifoldsecome hydraulically interconnected along the axis of the hori-ontal injection wells in the E-W direction, which are analogouso horizontal wells that allow a uniform sweep of fluids betweenhe zones. The long term production results verify that the mani-olds return an improved heat sweep efficiency. Furthermore, theracture orientation is either very important in influencing the stim-lation result. Fractures oriented at 045–120◦ result in the greatestracture permeability enhancement along the stimulation direc-ion. Therefore, the developed manifolds with fractures orientedt 045–120◦ are more permeable and conductive, compared to thease with fractures oriented at 020–135◦.
cknowledgements
This work is a partial result of support from the US Departmentf Energy under project DOE-DE-343 EE0002761. This supports gratefully acknowledged. The authors would like to thank thenonymous reviewers for their valuable comments and suggestionso improve the quality of the paper.
eferences
kın, S., Kok, M.V., Uraz, I., 2010. Optimization of well placement geothermalreservoirs using artificial intelligence. Comput. Geosci. 36 (6), 776–785.
aghbanan, A., Jing, L., 2007. Hydraulic properties of fractured rock masses withcorrelated fracture length and aperture. Int. J. Rock Mech. Miner. Sci. 44 (5),704–719, http://dx.doi.org/10.1016/j.ijrmms.2006.11.001.
andis, S.C., Lumsden, A.C., Barton, N.R., 1983. Fundamentals of rock jointdeformation. Int. J. Rock Mech. Min. Sci. Geomech. Abstr. 20 (6), 249–268,http://dx.doi.org/10.1016/0148-9062(83)90595-8.
arton, N., Choubey, V., 1977. The shear strength of rock joints in theory andpractice. Rock Mech. 10 (1–2), 1–54, http://dx.doi.org/10.1007/bf01261801.
rouch, S.L., Starfield, A.M., 1991. Bound Elem Solid Mechanics. Taylor & Francis.
arnet, M., Marquis, G., Sailhac, P., 2006. Hydraulic stimulation of geothermalreservoirs: fluid flow: electric potential and microseismicity relationships.Geophys. J. Int. 166 (1), 438–444.
e Dreuzy, J.-R., Davy, P., Bour, O., 2001. Hydraulic properties of two-dimensionalrandom fracture networks following a power law length distribution: 2.
ics 62 (2016) 131–142 141
Permeability of networks based on lognormal distribution of apertures. WaterResour. Res. 37, 2079–2095.
Dieterich, J.H., 1992. Earthquake nucleation on faults with rate-andstate-dependent strength. Tectonophysics 211 (1–4), 115–134, http://dx.doi.org/10.1016/0040-1951(92)90055-B.
Elsworth, D., 1989. Thermal recovery from a multiple stimulated HDR reservoir.Geothermics 18 (5), 761–774.
Elsworth, D., 1990. A comparative evaluation of the parallel flow and sphericalreservoir models of HDR geothermal systems. J. Volcanol. Geotherm. Res. 44(3), 283–293.
Elsworth, D., Taron, J., Faoro, I., Lee, D.-S., Liu, J., Niemeijer, A., Yasuhara, H., 2010,Evolution of Deformability and Transport Properties of Fractured Rocks Underthe Action of Stress and Chemistry, paper presented at EGU General AssemblyConference.
Gan, Q., Elsworth, D., 2014a. Analysis of fluid injection-induced fault reactivationand seismic slip in geothermal reservoirs. J. Geophys. Res. Solid Earth 119 (4),3340–3353.
Gan, Q., Elsworth, D., 2014b. Thermal drawdown and late-stage seismic-slip faultreactivation in enhanced geothermal reservoirs. J. Geophys. Res. Solid Earth119, 8936–8949, http://dx.doi.org/10.1002/2014jb011323.
Gan, Q., Elsworth, D., 2016. A continuum model for coupled stress and fluid flow indiscrete fracture networks. Geomech. Geophys. Geo Energy Geo Resour., 1–19.
Ghassemi, A., Zhang, Q., 2006. Porothermoelastic analysis of the response of astationary crack using the displacement discontinuity method. J. Eng. Mech.132 (1), 26–33.
Gringarten, A., Witherspoon, P., 1973. Extraction of heat from multiple-fractureddry hot rock. Geothermics 2 (3), 119–122.
Gringarten, A., Witherspoon, P., Ohnishi, Y., 1975. Theory of heat extraction fromfractured hot dry rock. J. Geophys. Res. 80 (8), 1120–1124.
Marcou, J.A., 1985. Optimizing Development Strategy for Liquid DominatedGeothermal Reservoirs. Doctoral dissertation, Stanford University.
McClure, M., Horne, R.N., 2013. Discrete Fracture Network Modeling of HydraulicStimulation: Coupling Flow and Geomechanics. Springer Science & BusinessMedia.
Min, K.-B., Jing, L., 2003. Numerical determination of the equivalent elasticcompliance tensor for fractured rock masses using the distinct elementmethod. Int. J. Rock Mech. Min. Sci. 40 (6), 795–816.
Oda, M., 1986. An equivalent continuum model for coupled stress and fluid flowanalysis in jointed rock masses. Water Resour. Res. 22 (13), 1845–1856, http://dx.doi.org/10.1029/WR022i013p01845.
Odling, N.E., Gillespie, P., Bourgine, B., Castaing, C., Chiles, J.P., Christensen, N.P.,Watterson, J., 1999. Variations in fracture system geometry and theirimplications for fluid flow in fractured hydrocarbon reservoirs. Pet. Geosci. 5(4), 373–384.
Olson, J.E., 2003. Sublinear scaling of fracture aperture versus length: an exceptionor the rule? J. Geophys. Res. Solid Earth 108 (B9), 1978–2012.
Pham, M., Ponte, C.K.C., Cabec as, R., Martins, R., Rangel, G., 2010.Production/Injection Optimization Using Numerical Modeling at RibeiraGrande, São Miguel, Azores, Portugal. In: Proc. World Geothermal Congress2010.
Pine, R.J., Cundall, P.A., 1985. Applications of the fluid-rock interaction program(FRIP) to the modelling of hot dry rock geothermal energy systems. In: Proc.Int. Symp. on Fundamentals of Rock Joints (pp. 293–302). Centek.
Pruess, K., 2006. Enhanced geothermal systems (EGS) using CO2 as workingfluid—a novel approach for generating renewable energy with simultaneoussequestration of carbon. Geothermics 35 (4), 351–367.
Pruess, K., Wu, Y.-S., 1993. A new semi-analytical method for numerical simulationof fluid and heat flow in fractured reservoirs. SPE Adv. Technol. Ser. 1 (2),63–72.
Riahi, A., Damjanac, B., 2013, February. Numerical study of hydro-shearing ingeothermal reservoirs with a pre-existing discrete fracture network. In:Proceedings of the 38th Workshop on Geothermal Reservoir Engineering,Stanford, CA (pp. 11–13).
Rutqvist, J., Leung, C., Hoch, A., Wang, Y., Wang, Z., 2013. Linked multicontinuumand crack tensor approach for modeling of coupled geomechanics, fluid flowand transport in fractured rock. J. Rock Mech. Geotechnol. Eng. 5 (1), 18–31.
Sanyal, S.K., Butler, S.J., 2005. An analysis of power generation prospects fromenhanced geothermal systems. Geother. Resour. Counc. Trans., 29.
Sanyal, S.K., Granados, E.E., Butler, S.J., Horne, R.N., 2005, An alternative andmodular approach to enhanced geothermal systems, paper presented at WorldGeothermal Congress.
Segall, P., Fitzgerald, S.D., 1998. A note on induced stress changes in hydrocarbonand geothermal reservoirs. Tectonophysics 289 (1–3), 117–128, http://dx.doi.org/10.1016/s0040-1951(97)00311-9.
Shaik, A.R., Rahman, S.S., Tran, N.H., Tran, T., 2011. Numerical simulation offluid-rock coupling heat transfer in naturally fractured geothermal system.Appl. Therm. Eng. 31 (10), 1600–1606.
Taron, J., Elsworth, D., 2009. Thermal–hydrologic–mechanical–chemical processesin the evolution of engineered geothermal reservoirs. Int. J. Rock Mech. Min.Sci. 46 (5), 855–864.
Taron, J., Elsworth, D., 2010a. Constraints on compaction rate and equilibrium in
the pressure solution creep of quartz aggregates and fractures: controls ofaqueous concentration. J. Geophys. Res. Solid Earth 115 (B7), 1978–2012.Taron, J., Elsworth, D., 2010b. Coupled mechanical and chemical processes inengineered geothermal reservoirs with dynamic permeability. Int. J. RockMech. Min. Sci. 47 (8), 1339–1348.

1 otherm
T
V
Presented at Proceedings of the Thirty-Second Workshop on GeothermalReservoir Engineering, Stanford, CA, USA.
42 Q. Gan, D. Elsworth / Ge
ester, J.W., Anderson, B., Batchelor, A., Blackwell, D., DiPippo, R., Drake, E.,Garnish, J., Livesay, B., Moore, M.C., Nichols, K., 2006. The Future of Geothermal
Energy: Impact of Enhanced Geothermal Systems (EGS) on the United States inthe 21st century. Massachusetts Institute of Technology, pp. 209.örös, R., Weidler, R., de Graaf, L., Wyborn, D., 2007. Thermal modelling of longterm circulation of multi-well development at the cooper basin hot fracturedrock (HFR) project and current proposed scale-up program. In: Paper
ics 62 (2016) 131–142
Watanabe, K., Niibori, Y., Hashida, T., 2000, Numerical study on heat extractionfrom supercritical geothermal reservoir, paper presented at Proceedings WorldGeothermal Congress.