Embed Size (px)
Citation preview
United StatesDepartment ofAgriculture
Forest Service
Guidelines for EstimatingVolume, Biomass, and SmokePacific Northwest
Research Station
General TechnicalReportPNW-GTR-364February 1996
Production for Piled SlashColin C. Hardy
This file was created by scanning the printed publication. Text errors identified by the software have been corrected; however, some errors may remain.

COLIN C. HARDY is a research forester, Intermountain Research Station, P.O.Box 8089, Missoula, MT 59807. The research and development for this paper wasdone when the author was a research forester with the Pacific Northwest ResearchStation, Forestry Sciences Laboratory, Seattle, WA.
Author
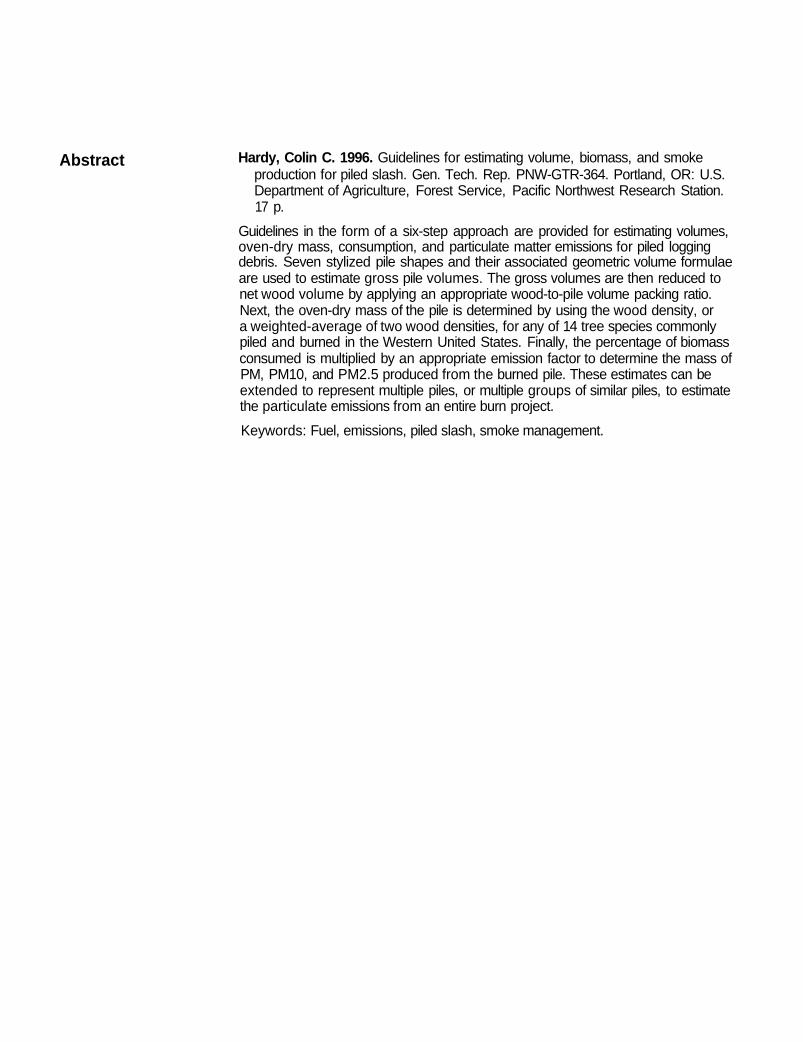
Hardy, Colin C. 1996. Guidelines for estimating volume, biomass, and smokeproduction for piled slash. Gen. Tech. Rep. PNW-GTR-364. Portland, OR: U.S.Department of Agriculture, Forest Service, Pacific Northwest Research Station.17 p.
Guidelines in the form of a six-step approach are provided for estimating volumes,oven-dry mass, consumption, and particulate matter emissions for piled loggingdebris. Seven stylized pile shapes and their associated geometric volume formulaeare used to estimate gross pile volumes. The gross volumes are then reduced tonet wood volume by applying an appropriate wood-to-pile volume packing ratio.Next, the oven-dry mass of the pile is determined by using the wood density, ora weighted-average of two wood densities, for any of 14 tree species commonlypiled and burned in the Western United States. Finally, the percentage of biomassconsumed is multiplied by an appropriate emission factor to determine the mass ofPM, PM10, and PM2.5 produced from the burned pile. These estimates can beextended to represent multiple piles, or multiple groups of similar piles, to estimatethe particulate emissions from an entire burn project.
Keywords: Fuel, emissions, piled slash, smoke management.
Abstract

1 Introduction
2 The Six-Step Process
3 Step One—Total Gross Volume of the Pile
10 Step Two—Net Volume of the Woody Biomass
10 Step Three—Density or Weighted-Average Density of the Wood
12 Step Four—Consumable (Oven-Dry) Mass of Wood
13 Step Five—Proportion of Mass Consumed
13 Step Six—Mass of Particulate Matter Produced
14 Recommendations and Guidance
15 Literature Cited
16 Appendix 1: A Hypothetical Example
18 Appendix 2: Full-Sized Copies of the Nomagrams
Contents

Introduction The guidelines in this document address the critical need to quantify both biomassconsumption and the air quality impacts from the burning of piled woody debris.Piling and burning of woody debris from activities such as timber harvesting, roadbuilding, and residential or commercial development has been a common practicefor as long as these activities have occurred. It is an especially common forestrypractice, where logging residue (slash) is piled on the site by bulldozers, and onthe terminus (landing) of yarding and skidding trails by bulldozers, cable-yardingequipment, and log loaders. Numerous objectives are met by piling and burning:reduction of on-site woody fuel loading and the resultant reduction in harvest-created fire hazard; scarification of the surface layer and exposure of mineral soilto enhance regeneration of trees; removal of woody and organic material fromroadbeds and structure sites to improve the integrity of the construction substrate;and sanitation disposal of stumps and roots infected by disease or pathogens. Insome cases, logging slash is piled in anticipation of subsequent use in nonlumbermarkets such as combustion for energy (hog fuel), pulp chips, and firewood.
On-site burning of piled slash has both negative and positive implications for smokemanagement Burning of woody biomass, regardless of its condition and distribution,creates products of incomplete combustion such as carbon monoxide, methane, andparticulate matter. A variety of research methods have produced much new knowl-edge about the quantity and characteristics of smoke emissions from vegetation fires(Ward and Radke 1993) and from piled slash (Ward and others 1989). Piling andburning of slash has positive smoke management implications as well. In contrastwith broadcast burning of the same material, piled slash bums more efficiently, withnotably less smoke produced per unit mass of fuel consumed (Ward and others1989). Further, piled slash can be burned under a broad range of weather conditions.This enables the burning of piles to be scheduled for periods of optimal dispersionand also during periods when the conflicts with impacts from other sources areminimized.
Smoke management programs in several Western States now actively encouragethe piling and burning of slash, where possible, instead of the more typical practiceof broadcast burning. Permitting and fee structures have created incentives for pilingand burning. The increased emphasis on the practice demands significant improve-ments in our ability to quantify preburn fuel loadings, fuel consumption, and emissionsproduction from burning piles.
1

Several previous efforts have led the way toward the methods and guidelinespresented here. Techniques for estimating weights of piles and stumps weredeveloped from a land clearing project in Washington (Mohler 1977). Relationsbetween easy-to-measure dimensions and woody fuel volumes were developed byMcNab (1980) for inventorying windrowed forest residues in the Southern UnitedStates. Results from these two methods were verified by Johnson (1981) whenhe compared them to results from destructive sampling. Little developed a methodfor estimating pile volumes using four stylized shapes and respective volumetricformulae.^ These shapes, when combined with a ratio estimator for reducing grosspile volume to net wood volume, provide an efficient, simple method for fieldestimation of woody fuel volumes in piles.
The initial steps in these guidelines use the methodology and generalized shapespresented by Little (see footnote 1). Three additional shapes are included, as arespecies-specific wood densities, a range of wood-to-pile volume ratios,2 and severalnomagrams intended to reduce the number of manual calculations required toestimate volumes, mass, and smoke emissions.
Six steps are required to estimate particulate emissions from a pile. The productfrom each step is both relevant in itself and a prerequisite parameter for completionof the next step.
Determine:
1. Total gross volume of the pile.
2. Net volume of the woody biomass.
3. Density or weighted-average density of the wood.
4. Consumable (oven-dry) mass of wood.
5. Proportion of mass consumed.
6. Mass of particulate matter produced (PM, PM10, PM2.5).
The Six-StepProcess
1 Little, S N. 1980. Estimating the volume of wood in large pilesof logging residue. Portland, OR U S. Department of Agriculture,Forest Service, Pacific Northwest Forest and Range ExperimentStation. 7 p. Administrative Report PNW-1 On file with' ForestrySciences Laboratory, P.O Box 3890. Portland, OR 97208-3890.
2 Hardy, Colin C , Vihnanek, R. Packing ratios for piled woodydebris. Manuscript in preparation. USDA Forest Service, PacificNorthwest Research Station, Seattle, WA 98105.
2

Step One—Total Gross A. Select a representative pile shape—A pile can be categorized into one ofVolume of the Pile the seven generalized shapes shown in figure 1. The number for each shape is its
"shape code." The dimensions required to compute volumes are shown in figure 1for each shape. Choose the shape most similar to your pile(s) from the followingdescriptions and figures and record the appropriate dimensions.
Figure 1—Five generalized pile shapes are used to represent the possibleconfigurations of piled woody debris. Each illustration is numbered by its"shape code" (see text).
3

Shape code 1: Half-section of a sphere—Truly half of a ball or sphere (fig. 2).The base is round, the width is twice the height, and the sides are well- andevenly-rounded. (Observe and record either height [h] or width [w].)
Figure 2—The half-section of a sphere is truly half a ball, with well-rounded sides
Shape code 2: Half-paraboloid—The base is round, but the sides are parabolic, notround. Three variations of the half-paraboloid shape are shown in figure 3: half-roundparaboloid, half-"tall" paraboloid, and half-"short" paraboloid. (Observe and recordheight [h] and width [w].)
Shape code 3: Half-cylinder—The pile is generally rounded side-to-side, with bothends of the pile approximately the same height and straight (fig. 1). Logs stackedparallel by a loader or crane can form this shape. (Observe and record width [w],height [h], and length [/].)
Shape code 4: Half-frustum of a cone—This shape is similar to a half-cylinder, butthe cylinder tapers lengthwise, so the heights of the ends are different (fig. 1). Thisshape is seen when logs are stacked parallel, with the tapers oriented in the samedirection. (Observe and record length [/] and heights or widths of the small and largeends [h1 or w1, and h2 or w2].)
Shape code 5: Half-frustum of a cone with rounded ends—Similar to shapecode 4, but the ends are rounded (fig. 1). In this case, the rounded ends causedby uneven stacking and mixed piece sizes can add considerable volume to the pile.(Observe and record length of straight section of the side [/] and width of the smalland large end [w1, w2].)
4

Figure 3—The base of the half-paraboloid is round but thesides are parabolic. Three variations of this shape use thesame volumetric formula (A) "round," (B) "tall," and (C) "flat'
5

Shape code 6: Half-ellipsoid—The pile is elongated, rounded side-to-side, withwell-rounded ends (fig. 4). This shape is typical of windrowed slash. (Observe andrecord height [h], total length [l], and width at the widest section [w].)
Figure 4—The half-ellipsoid shape represents a long, symmetric,tapering pile with well-rounded ends
Shape code 7: Irregular solid—This pile is irregularly shaped with straight butuneven sides (fig. 1). The dimensions for opposing sides are not necessarily equal.(Observe and record lengths [/1, /2], widths [w1, w2 ], and heights [h1, h2.].)
B. Calculate the gross volume—The gross volume for a pile represented by any ofthe seven shape codes can be calculated from the following volumetric formulae,
where: V = gross pile volume (cubic feet),
/, /1, /2 = length(s) in feet,
h, h1, h2 = height(s) in feet, and
w1, w1, w1, w2= width (s) in feet.
Look-up tables or nomagrams are provided for some of the shapes and arereferenced below with the respective formula.
Shape code 1—
Columns 1-3 of table 1 contain look-up data for this volume. Use either pile height(column 2) or pile height and width (column 1) to determine gross volume (column 3).
6
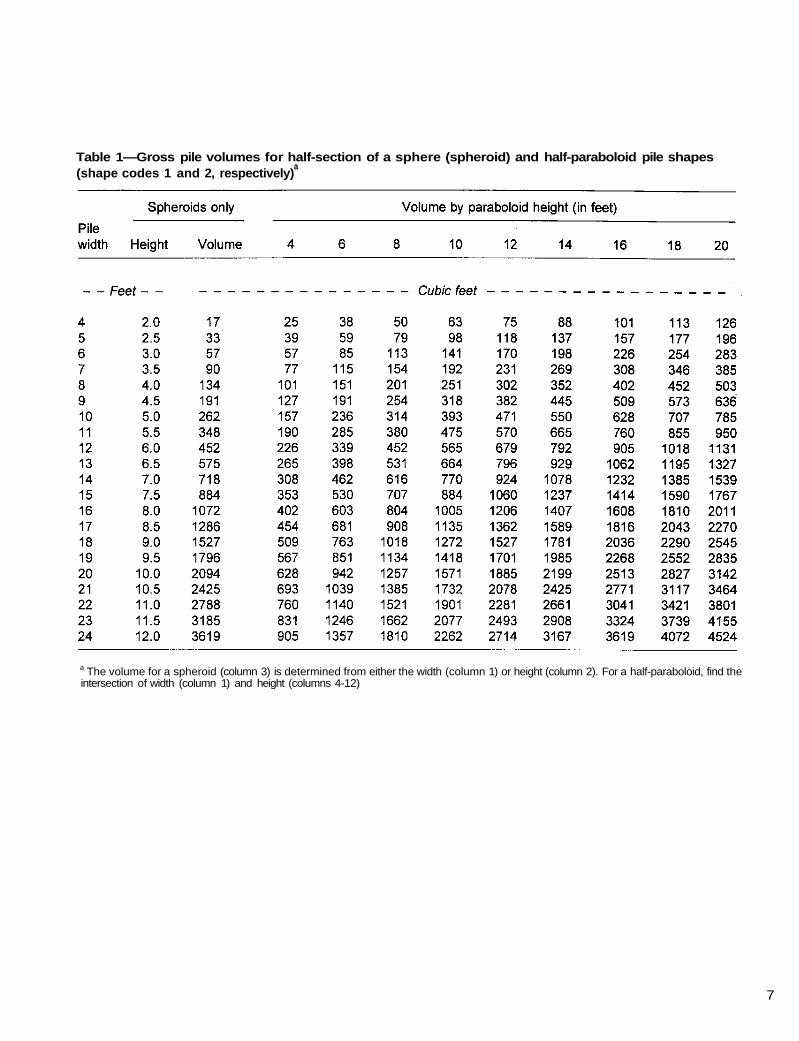
Table 1—Gross pile volumes for half-section of a sphere (spheroid) and half-paraboloid pile shapes(shape codes 1 and 2, respectively)
a
a The volume for a spheroid (column 3) is determined from either the width (column 1) or height (column 2). For a half-paraboloid, find theintersection of width (column 1) and height (columns 4-12)
7

Figure 5—The nomagram assists in determining gross pile volumes(X-axes at upper and lower right) for shape codes 6 and 3, respectively,by width (X-axis at lower left), height (diagonal lines at left), and length(diagonal lines at right).
Shape code 2—
The volume for any of the three variations of half-paraboloid is derived from the sameequation. Columns 1 and 4-12 of table 1 contain look-up data for this volume, wherethe intersection of width (column 1) and height (columns 4-12) contains the gross pilevolume.
Shape code 3—
Figure 5 is a nomagram for estimating gross volumes for shape codes 3 and 6 byusing width, height, and length.3
Begin at the X-axis (horizontal axis) labeled "width of pile"; go up from the correctwidth to the diagonal line for the correct height; go horizontally to the diagonal lineat the right for the correct length; go down to the right-hand X-axis (labeled "grossvolume") for shape code 3, half-elliptical cylinder, to determine the gross pile volume.
3 Full-page versions of all nomagrams are given in appendix 2.
8

Shape code 4—
Shape code 5—
Shape code 6—
Figure 5 is a nomagram for estimating gross volumes for shape codes 3 and 6 byusing width, height, and length.
Begin at the X-axis (horizontal axis) labeled "width of pile"; go up from the correctwidth to the diagonal line for the correct height; go horizontally to the diagonal lineat the right for the correct length; go up to the top right-hand X-axis (labeled "grossvolume") for shape code 6, half-ellipsoid, to determine the gross pile volume.
Shape code 7—
Some piles contain a significant amount of soil, whether entrained among the woodpieces or mounded beneath the pile. The net wood volume must be reduced by anestimate of the percent of the volume occupied by soil.
9

Much of the gross volume of a pile is occupied by air. The ratio of wood volumeto total pile volume is called the "packing ratio." The gross pile volume must bemultiplied by an appropriate packing ratio to determine the net volume of woodymaterial in a pile. Research on the packing ratio of piled slash has determined thatthe net wood volume can range from as low as 6 percent to as high as 26 percent(see footnote 2). These values represent extremes from 17 piles studied. Thevariation in packing ratio is due to numerous factors, including piling specifications,operator and machine performance, species content, and size class distribution. Onlyexpert judgment can be used to ultimately determine a packing ratio for a particularpile or group of similar piles. For the purpose of these guidelines, data from researchcan be used to suggest the following packing ratios:
• Piles with species content dominated by ponderosa pine, with mean diameters ofthe large woody fuel of less than 10 inches were found to have a mean packingratio of 10 percent (0.10).4
• Piles dominated by short-needled conifers had packing ratios ranging from15 percent (0.15) to 20 percent (0.20).
• Highly compacted, clean piles with larger logs (diameters greater than 10 inches),especially those built with a crane or loader, can have packing ratios as high as25 percent (0.25).
Multiply the gross pile volume determined in step one by an appropriate packing ratioto calculate net wood volume. The nomagram shown on the left side of figure 6 canbe used to make this calculation. Begin at the X-axis labeled "gross pile volume"; goup to a diagonal line representing an appropriate packing ratio for the pile(s); goleft to the Y-axis to determine the respective net wood volume. This step can becombined with step four if the nomagram is used.
The oven-dry density of wood is used to calculate mass of wood for fuel loading, fuelconsumption, and smoke production. Table 2 contains oven-dry densities for 14 treespecies commonly piled and burned in the Western United States. Use these valuesif the wood in a pile is predominately one species. If two species are identified, referto the nomagram in figure 7 to derive a weighted-average density for the pile.
First, find a line in figure 7 connecting the two species. Move from the end of the linerepresenting the dominant species towards the other species until the line intersectsthe correct percentage content (vertical lines labeled on the X-axis) for the dominantspecies; then move horizontally either left or right to the Y-axis to determine aweighted-average density for the two species.
Step Two—Net Volumeof the Woody Biomass
Step Three—Density orWeighted-AverageDensity of the Wood
4Scientific names for tree species are included in table 2.
10