Embed Size (px)
Citation preview

Treball realitzat per:
Karina Torres-Rivero Andrade
Dirigit per:
Joan de Pablo
Màster en:
Enginyeria Ambiental
Barcelona,
Departament de Camins y Ports de Barcelona
TR
EBA
LL F
INA
L D
E M
ÀST
ER
Production and optimization of an UO2 electrode by electrodeposition to perform
corrosion studies in hyper-alkaline conditions with calcium and silicium
electrolytes
I
Summary
The nuclear waste generated due to the production of electricity is confined into isolated
repositories. Because of the use of cement in the isolation barriers and also its use as
sealing material, it is important to study the effect of cementitious waters in contact with
the spent fuel, since these materials might play an important role as physical and
chemical barriers to the release of radionuclides into the far field. A review of the UO2
electrodeposition process was done to modify commercial electrodes (Dropsens),
subsequently to perform electrochemical experiments and therefore understand the
behavior of fuel matrix in hyper-alkaline conditions, with Ca and Si dissolutions. Two
deposition times were used, 15-min and 60-min; the most reproducible results were
shown by the 60-min electrodeposited electrode and this was used for the rest of the
experiments. Following this, cyclic-voltammograms were recorded using three types of
electrolytes: Na+Cl- 0,1 M; Na+Cl- 0,1 M, SiO3-2 0,001M; Na+Cl- 0,1 M, SiO3
-2 0,001M
and Ca2+ 0,0001 M, all with pH=12. Potentiostatic and corrosion potential experiments
were performed to determine the effect of the Ca and Si ions in the oxidation process.
The CVS showed six defined regions where oxidation and reduction process occurred;
the potentiostatics results revealed the highest current density was obtained for SiO3-2
and Ca2+, SiO3-2, and the lowest current density was obtained for Na+Cl-. The corrosion
potential value obtained for Na+Cl- was 42 mV, 40 mV for SiO3-2 and -2 mV for SiO3
-2,
Ca2+. These results exhibit that both ions reinforce the formation of protective corrosion
products on the surface electrode, working as inhibitors and/or blocking the fuel
corrosion process.
Resumen
Los residuos radioactivos generados debido a la producción de electricidad están
confinados en repositorios aislados. Puesto que el cemento es usado en las barreras de
aislamiento, así como material de sellado, es importante estudiar el efecto de las aguas
cementosas en contacto con el combustible usado ya que estos materiales pueden jugar
un rol importante como barreras químicas y física para la liberación de radionuclideo en
el entorno. Se realizó una revisión del proceso de electrodeposición del UO2 para
modificar electrodos comerciales (Dropsens). Ello permitió realizar experimentos
electroquímicos y así como comprender el comportamiento de la matriz de combustible

II
en condiciones hiper alcalinas con disoluciones de Ca y Si. Se usaron dos tiempos de
deposición: 15-min y 60-min; los resultados más reproducibles fueron obtenidos por el
electrodo electrodepositado en 60-min así que este fue usado para realizar el resto de los
experimentos. Se registraron ciclo-voltamogramas usando tres tipos de electrolitos:
Na+Cl- 0,1 M; Na+Cl- 0,1 M, SiO3-2 0,001M; Na+Cl- 0,1 M, SiO3-2 0,001M y Ca2+
0,0001 M, todos ellos a pH=12. Se realizaron experimentos potencioestáticos y de
potencial de corrosión para determinar el efecto de los iónes Ca y Si en el proceso de
oxidación. Los CVS mostraron seis regiones definidas donde ocurrieron los procesos de
oxidación y reducción, los resultados potencioestáticos revelaron que la densidad de
corriente más alta fue obtenida para el SiO3-2 y Ca2+, SiO3
-2, y la densidad de corriente
más baja fue obtenidapara el Na+Cl. El valor del potencial de corrosión obtenido para
Na+Cl- fue de 42mV, 40 mV para el SiO3-2 y -2 mV para el SiO3
-2 y Ca2+. Estos
resultados demuestran que ambos iones refuerzan la formación de productos de
corrosión protectores en la superficie del electrodo, actuando como inhibidores y/o
bloqueando el proceso de corrosión del combustible.

III
Acknowledgements
First, I would like to thank my thesis advisor, Joan de Pablo of the EEBE at UPC
Campus Diagonal-Bèsos. The door to to Prof. de Pablo was always open whenever I ran
into a trouble spot or had a question about my research or writing.
I would also like to thank to experts who were involved in the development of this
thesis: Dra. Alexandra Espriu-Gascón and Dr. Julio Bastos, without their participation
this investigation could not have been successfully conducted.
To my beloved husband, my unconditionally support. Thank you for all your patience
and love. I love you.
To my parents and my sister, for being there when I needed them. Thanks to them I’m
here doing what I like the most.
To my friends: Silvia, Júlia, Sònia, Ana Julia and specially Josep and Lulú for listening
to me when I needed the most. Without you, this master wouldn’t have been the same.
To God, for letting me have my precious family, husband all my friends to support me
in the most difficult times.

IV
Un ser sin estudios es un ser incompleto…
Simón Bolívar

V
Index
1. INTRODUCTION ........................................................................................................... 1
1.1 GENERAL OBJECTIVE ................................................................................................................. 4 1.2 SPECIFICS OBJECTIVES ............................................................................................................... 4
2. STORAGE AND DISPOSAL OF SPENT NUCLEAR FUEL AND HIGH LEVEL WASTE ................ 5 2.1 CLASSIFICATION BY TYPE AND LEVEL OF RADIOACTIVITY ........................................................... 6
1. High-level waste (HLW) ................................................................................................ 6 2. Spent Nuclear fuel (SNF) ............................................................................................... 6 3. Transuranic (TRU) ......................................................................................................... 6 4. Low-level waste (LLW) .................................................................................................. 6 5. Mill tailings ................................................................................................................... 6
2.2 GEOLOGICAL FORMATION................................................................................................... 8 2.3 SPENT NUCLEAR FUEL CHARACTERISTICS ............................................................................... 9
2.3.1 Processes controlling fuel Matrix Dissolution ...................................................... 10 2.3.2 Chemistry of UO2 dissolution................................................................................. 12 2.3.3 Radionuclides release mechanisms ...................................................................... 13
2.4 METAL CANISTER ............................................................................................................ 15 2.5 COMPACTED CLAY BARRIER .............................................................................................. 15 2.6 CEMENTITIOUS WATER AND ITS EFFECT IN NUCLEAR SPENT FUEL REPOSITORIES ......................... 16
2.6.1 The effect of Calcium present in cement barriers for nuclear waste ................... 17 2.6.2 The effect of Silicate present in cement barriers for nuclear waste .................... 18 2.6.3 The effect of Calcium and Silicate present in cement barriers for nuclear waste 18
2.7 MAIN URANIUM HEALTH EFFECTS ..................................................................................... 19
3. ANALYTICAL METHODS .............................................................................................. 21 3.1 SCANNING ELECTRON MICROSCOPY (SEM) .......................................................................... 21
3.1.1 Operating Principle of the SEM ............................................................................. 21 3.1.2 Applications ............................................................................................................... 23
3.2 X-RAY PHOTOELECTRON SPECTROSCOPY (XPS)..................................................................... 23 3.2.1 The principles of XPS.................................................................................................. 24
3.3 RAMAN SPECTROSCOPY .................................................................................................... 25 3.3.1 The principles of Raman Spectroscopy ..................................................................... 25
4. EXPERIMENTAL METHODOLOGY ................................................................................ 27 4.1 ELECTROCHEMICAL INSTRUMENTATION ............................................................................... 27
4.1.1 The Cell ....................................................................................................................... 27 4.1.2 The Electrolytes.......................................................................................................... 28 4.1.3 Dropsens Electrode .................................................................................................... 29
4.2 DROPSENS SURFACE MODIFICATION: DEPOSITION OF UO2 ..................................................... 31 4.2.1 SEM Images of deposited Dropsen® surface ............................................................ 31 4.2.2 Raman spectroscopy of deposited Dropsen® surface .............................................. 33
4.3 ELECTROCHEMICAL MEASUREMENTS .................................................................................. 35 4.3.1 Cyclic Voltammetry .................................................................................................... 35 4.3.2 Cyclic-voltammetry experiments .............................................................................. 37 4.3.3 Potentiostatic experiments ....................................................................................... 37 4.3.4 Open circuit potential measurements ...................................................................... 37
5. RESULTS AND DISCUSSION ......................................................................................... 38 5.1.1 Comparison between each electrolyte using electrode with no deposition ........... 38

VI
5.1.2 Comparison between 15-min and 60-min deposition modified electrode for Na+Cl- electrolyte ........................................................................................................................... 39 5.1.3 Comparison between 15-min and 60-min deposition modified electrode for SiO3
-2 electrolyte ........................................................................................................................... 40 5.1.4 Comparison between 15-min and 60-min deposition modified electrode for SiO3
-2, Ca2+ electrolyte.................................................................................................................... 41
6. CONCLUSIONS ........................................................................................................... 48
7. BIBLIOGRAPHIC REFERENCES ..................................................................................... 50
8. ANNEXES ................................................................................................................... 54 ANNEXE 8.1 PROCEDURES USED TO PERFORM THE ELECTROCHEMICAL STUDIES. ..................................... 54

VII
Acronym List
CTSF: Centralized temporary storage facility
CV: Cyclic voltammetry
DGR: Deep Geological Repository
FAC: Flow-assisted corrosion
HLW: High-level waste
IAEA: International Atomic Energy Agency
IASCC: Irradiation-assisted stress corrosion cracking
IRF: Instant release fraction
LLW: Low-level waste
LOAEL: Lowest
SCC: Stress corrosion cracking
SEM: Scanning electron microscopy
SNF: Spent Nuclear Fuel
SPEs: Screen printed electrodes
TEM: Transmission electron microscopy
TRU: Transuranic
XPS: X-ray photoelectron microscopy

VIII
Figure List
Figure 1. The nuclear fuel cycle. The complete process: from creation to disposal.
IAEA, 2011. .............................................................................................................. 1
Figure 2. Illustration of the microstructure of spent fuel and the distribution of actinides
and fission products following burn-up in a reactor. Red labels indicate
instantaneous release upon contact with water, blue indicates slower release rates.
Bruno et al. 2006 .................................................................................................... 10
Figure 3. Surface chemistry of UO2 oxidation/dissolution as a function of surface redox
conditions. Sunder et al. 1997. ............................................................................... 12
Figure 4. Surface chemistry of UO2 oxidation/dissolution as a function of surface redox
conditions. Shoesmith, 2007 ................................................................................... 13
Figure 5. Schematic diagram of a SEM with a CRT display. Egerton, 2005 ................ 22
Figure 6. The cell used to perform all the experiments. ................................................ 28
Figure 7. Dropsen used to perform all the experiments................................................. 30
Figure 8. SEM image of working electrode. Dropsens.com .......................................... 30
Figure 9. Deposition of UO2 on dropsen electrode surface ........................................... 31
Figure 10. SEM images from deposited electrode. (a) 3.00K X 15-min deposition time,
(b) 50.00K X 15-min deposition time, (c) 3.00K X 60-min deposition time, (d)
50.00K X 60-min deposition time .......................................................................... 32
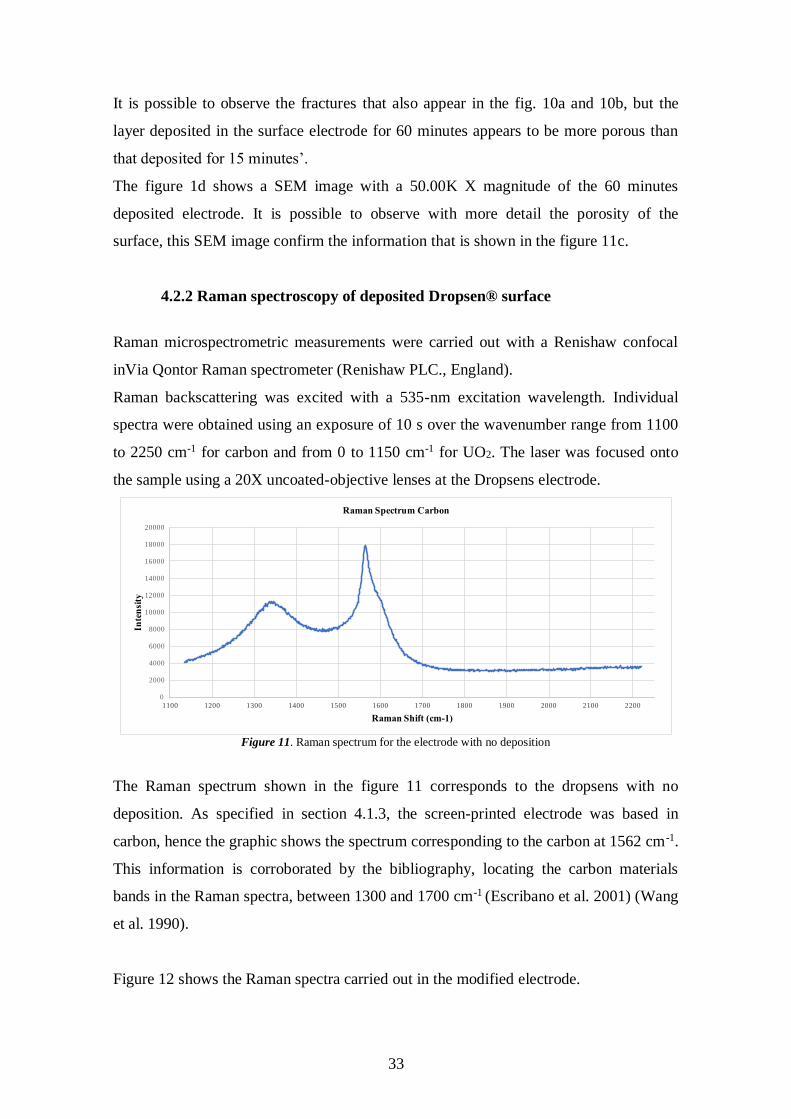
Figure 11. Raman spectrum for the electrode with no deposition ................................. 33
Figure 12. Raman spectrum for the electrode with deposition of UO2 ......................... 34
Figure 13. CV of a single electron oxidation-reduction. Quiroga, 2017 ....................... 35
Figure 14. Cyclic Voltammogram Excitation Signal. Quiroga, 2017 ........................... 36
Figure 15. Cyclic voltammogram recorded on Dropsen with no deposition for Na+Cl-
0,1 M pH=12; SiO3-2 0,001M pH=12 and SiO3
-2 0,001M Ca2+ 0,0001 M pH=12
electrolytes. ............................................................................................................. 38
Figure 16. Comparison between the Dropsen electrode with no deposition, 15-min and
60-min deposition of UO2 for the SiO3-2 0,001M pH=12 electrolyte. .................... 39
Figure 17. Comparison between the Dropsen electrode with 15-min and 60-min
deposition time for the SiO 0,1 M pH=12 electrolyte. ........................................... 41
Figure 18. Comparison between the Dropsen electrode with 15-min and 60-min
deposition time for the SiO3-2 0,001M, Ca2+ 0,0001 M pH=12. ............................. 42

IX
Figure 19. Cyclic voltammograms recorded on Dropsed with UO2 60 minutes’
deposition for Na+Cl- 0,1 M pH=12; SiO3-2 0,001M pH=12 and SiO3
-2 0,001M
Ca2+ 0,0001 M pH=12 electrolytes. ........................................................................ 44
Figure 20. Potentiostatic current versus time curve of the UO2 deposited electrode in
contact with Na+Cl- 0,1 M pH=12; SiO3-2 0,001M pH=12 and SiO3
-2 0,001M Ca2+
0,0001 M pH=12 electrolytes ................................................................................. 46
Figure 21. Ecorr (V vs. Ag/AgCl) results on the modified electrode with UO2 in contact
with the three different electrolytes. Na+Cl-(blue line), SiO3-2 (green line) and SiO3
-
2, Ca2+ (yellow line). ............................................................................................... 47
Figure 22. Electrodeposition procedure using NOVA software 2.1 coupled with the
Metrohm Autolab Potentiostat-Galvanostat M204................................................. 54
Figure 23. Cyclic-voltammogram procedure using NOVA software 2.1 coupled with
the Metrohm Autolab Potentiostat-Galvanostat M204. .......................................... 54
Figure 24. OCP procedure using NOVA software 2.1 coupled with the Metrohm
Autolab Potentiostat-Galvanostat M204. ............................................................... 55
Figure 25. Potentiostatic experiment procedure using NOVA software 2.1 coupled with
the Metrohm Autolab Potentiostat-Galvanostat M204. .......................................... 55

X
Tables List
Table 1. Comparison of radioactive properties of uranium isotopes (ANL, 2001) .......... 2
Table 2. Nuclear waste types and sources (Saling et al. 2001) ......................................... 7
Table 4. Proposed composition of backfilling mortar for use in containers (Gens,
2008)... ..................................................................................................................... 16
Table 4. Summary of electrolytes used to perform electrochemical studies .................. 29
Table 5. Carbon SPEs (Dropsens) characteristics. Dropsens.com .................................. 29
Table 6. Summary of Raman spectrum assignation for the uranium oxides (Elorrieta et
al. 2017) ................................................................................................................... 34

1
1. Introduction
Today nuclear fuels are mostly based on uranium. Through a series of steps an efficient
fuel to generate electricity is produced after the uranium enrichment by the conversion
of UF6 to UO2 (IAEA, 2011).
The nuclear power stations generate electrical energy from fission nuclear processes.
The nuclear fission releases heat and energy that is transformed in electricity. The waste
generated keeps its natural cycle of radioactive disintegration (Fernández, 2011).
It is considered nuclear waste all product or waste material which presents radioactivity
traces and for which it is not planned any use; it includes solids, liquids and residuals
polluted gases (Fernández, 2011).
The nuclear fuel cycle is shown in figure 1 which represents the progression of nuclear
fuel from creation to disposal.
The first step is the uranium recovery. This phase focuses on extracting natural uranium
ore from the Earth and concentrating that ore. The recovery operations produce a
product called, “yellowcake” (U3O8), which is then transported to a fuel cycle facility.
Figure 1. The nuclear fuel cycle. The complete process: from
creation to disposal. IAEA, 2011.

2
Most of the nuclear plants require fuel with U-235 enriched to a level of 3-5%, hence
uranium must be enriched to increase the concentration of U235. Because of that, the
yellow cake, is converted to uranium hexafluoride (UF6), here is where the uranium
conversion takes place.
The enrichment process is the following phase, where isotope separation takes place,
through a gaseous diffusion process. Because the smaller U-235 isotopes travel slightly
faster than U-238 isotopes, they tend to leak (diffuse) faster through the porous
membrane walls of a diffuser, where they are collected and concentrate (IAEA, 2011).
In the following table a comparison of radioactive properties of uranium isotopes is
shown.
Table 1. Comparison of radioactive properties of uranium isotopes (ANL, 2001)
Isotope Half-
Life
(years)
Natural
abundance
(%)
Specific
activity
(Ci/g)
Decay
mode
Radiation Energy (MeV)
Alpha
(α)
Beta
(β)
Gamma
(γ)
U-232 72 0 22 α 5,3 0,0017 0,0022
U-233 160000 0 0,0098 α 4,8 0,0061 0,0013
U-234 240000 0,0055 0,0063 α 4,8 0,013 0,0017
U-235 700
million
0,72 0,0000022 α 4,4 0,049 0,16
U-236 23
million
0 0,000065 α 4,5 0,011 0,0016
U-238 4.5
billion
≥99 0,00000034 α 4,2 0,010 0,0014
As the table 1 shows, the main isotopes of uranium have extremely long lifetimes
except for uranium 232, all of them are alpha emitters of 4 to 5 MeV of energy. The
columns referred to gamma radiation show the presence of a low energy gamma
radiation and rare decays beta. Specific activities (activities reduced to 1 gram) are
inversely proportional to half-lives (ANL, 2001).
Once the enrichment process is completed, the following process is the deconversion,
which consists in the chemically extraction of the fluoride atoms from the DUF6 and

3
replaces them with oxygen to produce uranium dioxide (UO2). Then the fuel fabrication
is the next step, where the fuel is created in the form of ceramic pellets. These are
formed from pressed UO2 at high temperature (over 1672 K). The pellets are then
encased in metal tubes of zircaloy to form fuel rods, which are arranged into a fuel
assembly ready for being introduced into a nuclear reactor for energy production.
Next, the interim storage takes place. Here, the spent nuclear fuel (SNF) is stored under
water, which provides both cooling and radiation shielding. A reprocessing step can
follow the interim storage, where the SNF is separated from the nuclear materials that
may be recycled. The final step is the disposition of high radioactivity level waste.
Disposal of nuclear wastes has been studied for long time under the auspices of
different American and European agencies. The main purpose of these organizations
was to design and construct facilities that would accept and start disposing of spent
nuclear fuel and high-level wastes.
Radioactive waste management is an integrated system that involves several activities:
accumulation, processing, handling, packaging, transportation, storage, disposal,
decontamination and decommissioning of the spent nuclear fuel (Saling et al. 2001).
In Spain, the nuclear waste management both from nuclear power stations and those
generated by other radioactive facilities such as hospitals and research centers, is
overseen by National Company of Radioactive Waste (ENRESA, for its acronym in
spanish). The way to dispose the nuclear waste is by classifying it by its level of
radioactivity.
There are two different management strategies for spent nuclear fuel (IAEA, 2006). In
the first one the fuel is reprocessed to extract usable material (uranium and plutonium)
for a new fuel. In the other one, the spent fuel is simply considered as a waste and is
stored in a temporary disposal and later in a final repository.
This thesis is focused on the second management strategy in order to study processes
involved in the spent nuclear fuel alteration under storage conditions where the waste is
confined. Also, concrete can be found in the repository as a barrier and it also can be
used as sealing material in the deep geological repository (DGR).
Assessing the performance of spent nuclear fuel in a potential future geological disposal
system requires the understanding and quantification of the important time-dependent

4
phenomena influencing its behaviour on a time-scale up to millions of years. Such a
demanding goal requires the development and qualification of models predicting the
spent fuel matrix dissolution.
This lead us to define the general objective and the specifics objectives of this thesis,
which are the following:
1.1 General Objective
Development and optimization of dioxide uranium electrodes for the electrochemical
characterization of spent nuclear fuel in order to develop a model for predicting the
behaviour of the fuel in the conditions expected in a final repository.
1.2 Specifics Objectives
• Surface modification of a commercial electrode (Dropsens) by UO2
electrodeposition.
• To perform electrochemical measurements by doing cyclic-voltammogram
analysis, pontenciostatic tests and corrosion potential measurements.
• To perform surface analysis by scanning electron microscopy (SEM), X-ray
photoelectron spectroscopy (XPS) and RAMAN spectroscopy

5
2. Storage and Disposal of spent nuclear fuel
and high level waste
The fundamental design objective of geological repositories is to confine the waste and
to isolate it from the environment.
Most of the countries, which must manage nuclear spent fuel, incorporate the following
basic technical principles to their developed disposal concepts (IAEA, 2006):
a.- Encapsulation of spent fuel or HLW in a tight canister with a very long expected
lifetime.
b.- Assurance that the conditions in the repository will allow the canister to remain
intact and tight for as long as possible. These conditions include: mechanical stability
stable geochemical conditions and very limited groundwater movement that could bring
corrosive agents in contact with the canister.
c.- Backfilling of the repository with appropriate materials and adequate geological
media.
The main characteristics of the spent fuel and high level waste disposal are the long-
lived radioactivity of the SNF and HLW (high level waste), its heat generation and its
radiation level (IAEA, 2006).
Normally, the heat generation determines the amount of waste that can be confined in a
determined volume of rock. Waste with high radiation levels requires to be shielded,
and depending of the amount of long-lived radioactivity isotopes, the safety of a
repository must be considered looking forward for tens to hundreds of thousands of
years.
In this section, we pretend to describe the characteristics of the spent nuclear fuel,
including the process that affect the dissolution of fuel matrix, chemistry and the release
process of the radionuclides. Also, the disposal concept, all the phases to confine
nuclear waste and its characteristics are described.

6
2.1 Classification by type and Level of Radioactivity
Nuclear spent fuel is defined as waste material that is contaminated with alpha-emitters
radionuclides of sufficiently long life (20 years) of elements with atomic number 92 or
larger and concentrations greater than 100 nanocuries per gram.
Spent nuclear can be classified according to the origin, the type of material present and
their level of radioactivity, as follows (Saling et al. 2001):
1. High-level waste (HLW) is the result from the reprocessing of spent fuel from a
defense or commercial reactor. The amount of plutonium and other heavy isotopes
remaining in the solutions is small, about 0,5% of original Pu and U; the residue
consists mainly of fission products.
2. Spent Nuclear fuel (SNF) discharged from the reactor may be stored at the reactor
site and eventually placed in a waste repository without reprocessing. SNF will be
treated as a HLW unless and until it is retrieved and reprocessed at a future time. In
this document, we are going to discuss primarily this type of radioactive waste. The
spent fuel contains uranium (96%), plutonium (1%) and high level waste products
(3%). The uranium, with less than 1% fissile U-235 (IAEA, 2011).
3. Transuranic (TRU) includes all transuranic nuclides except 238P and 241Pu and also
includes 233U and its daughter products (Jensen, 1983).
4. Low-level waste (LLW) this waste often has relatively little radioactivity and
contains practically no TRU elements. Most LLW requires little or no shielding,
may be handled by direct contact, and may be buried in near-surface facilities.
5. Mill tailings from uranium mills constitute another type of waste with a low level of
radioactivity, but they are not classified as LLW. The tailings contain elements such
as thorium and radium, which are by-products of the decay of 238U and are not
removed in the extraction of uranium.
Most of the radioactivity is associated with the commercially generated SNF and is
primarily generated in commercial reactors. The following table (table 2) shows a
summary of nuclear waste types and sources.

7
Table 2. Nuclear waste types and sources (Saling et al. 2001)
Source
Nuclear waste type
Spent
nuclear
fuel (SNF)
High-level
waste (HLW)
Transuramic
(TRU)
Low-level
waste
(LLW)
Commercial nuclear fuel
cycle operations
x X x
Institutions (hospitals,
universities, etc.)
x X x
Industrial users x X x
Decontamination and
decommissioning of fuel
cycle
X x
Defense-related activities x X X x
In Spain, the ultimate decision for nuclear waste treatment is made by the Government
based on the researches that have been made, which focus on (Fernández, 2011):
• Separation and transmutation. This method is known as closed cycle, which
permits to manipulate the spent fuel to separate and transmute certain long life
radionuclides; after this process, these can be reused as energetic materials,
reducing the waste inventory at the same time.
• The DGR: Deep Geological Repository. This method is open cycle, in which
the HLW and SNF are storage underground and deep, in a repository.
Nowadays, the Spanish Government has chosen for a Centralized Temporary Storage
Facility (CTSF) (ATC for its acronym in Spanish).
The CTSF is a storage system designed to house the SNF and HLW from nuclear power
plants for a given period. These facilities are located on the surface or at a depth of
relatively few meters, in consequence, they require continuous monitoring and control
measures. In this sense, the Centralized Temporary Storage Facilities are the most ideal
temporary solution from safety reasons, since they allow the monitoring measures to be
concentrated on a single facility. The research results show that this option can
guarantee the storage of spent fuel for a period of 50 years. In any case the temporary

8
facilities cannot be considered the definitive solution and cannot be extended
indefinitely (Consejo de Seguridad Nuclear, Gobierno de España, 2015).
Because of the previously reason, in Europe, the DGR option is the most considered
option as viable solution for nuclear waste long-term storage.
2.2 Geological Formation
The DGR is based on the multi-barrier principle, which consists in interposing a series
of artificial and natural barriers between the nuclear waste and the biosphere. Generally,
the SNF from the nuclear power plants is ceramic pellets with 95% of UO2 stables and
slightly soluble which is considered as a barrier itself (first barrier), due to its
physicochemical form. The residue is encapsulated in a carbon steel canister (second
barrier). The canister is introduced into the galleries and it is surrounded by a
compacted clay barrier, so-called, bentonite. The main purpose is to ensure that the
travel time of any stored radionuclide is long enough, so its radioactivity had decay and
cannot modify any natural radioactive level (Astudillo, 2001).
The repository should be placed in a stable geological formation; deep saline, granite a
clay formations should be considered. If the geological formation chosed is a clay
formation, it is necessary to introduce a concrete barrier which is going to act as a
structural support for the disposal facility (Fernández, 2011).
The nuclear waste must be store in a series of connected galleries, that would be
constructed at a depth between 300 and 1000 meters from the surface, in order to
prevent the flow of groundwater and ensure a safe distance to the biosphere.
The structure and composition of the various type of spent fuel have been investigated
from the perspectives of reactor operation and geologic disposal. At the end of the fuel’s
useful life in the reactor, about 95% of the spent nuclear fuel still consists in UO2
(Bruno et al. 2006).
In the assessment of the concept of the direct disposal of irradiated nuclear fuel, an
important objective is to predict the release rate of radionuclides from the fuel under the
conditions anticipated in a nuclear waste vault. Studies of the dissolution is initially
9
independent of matrix dissolution, with a small fraction of certain fission products (e.g.
137Cs) being released rapidly on exposure of the fuel to the water (Sunder et al. 1991).
2.3 Spent Nuclear Fuel Characteristics
For more than fifty years, uranium dioxide was world-wide used as the main fuel for
two generations of nuclear power plants. There are number of different types of fuel, but
they are predominantly uranium based, mainly UO2 or, in some cases, metallic U.
Chosen first as the most convenient uranium compound for easy fabrication of sintered
pellets, UO2 displayed in the long run an excellent combination of thermophysical
properties as well as an uncommon resistance to burn-up and radiation damage (Ronchi
et al. 2011). A high level of proficiency has been reached by using this type of fuel, but
certain preoccupation was originated after careful observations of the transformations in
the highly irradiated nuclear fuels (Jovani-Abril, 2014).
Prior to irradiation in a reactor, UO2 fuel consists of fine grained (3-10 m) pellets with
very high-density and high-purity of UO2 (Johnson and Werme, 1994).
After irradiation to burnups from 8 to 40 MW d/KgU (Jonhson and Werme 1994),
anywhere from 1 to 4% of the uranium will have been fissioned to produce a wide
variety of stable and radioactive fission products (Jonhson and Werme 1994).
Many of these products are insoluble in UO2 and can form precipitates within grains
and at grains boundaries. Another fraction of the products are gases, like Xe and Kr,
some elements that are volatile at fuel operating temperatures (eg., Cs and I) and metal
such as Tc, Mo, Ru, Rh and Pd. Also, it contains fission products that occur as oxide
precipitates of Rb, Cs, Ba an Zr; fission products that form solid solutions with the UO2
fuel, such as Sr, Zr, Nb, and the rare-earth elements; transuranium elements that
substitute for U in the UO2.
In figure 2, the microstructure of the spent fuel is shown. The high temperatures
experienced during in-reactor irradiation allow that the most insoluble species diffuse
out from the grains to the grain boundaries. A fraction of total content of noble gas and
volatile fission products accumulate there, and can be released to the periphery of the
fuel because of, the formation of fission gas tunnels at grain boundaries and cracks in
the pellets.

10
The fission products can be released from grain boundaries during in-reactor irradiation,
leading to their accumulation at the cooler gap between the fuel and the cladding.
Other microstructural features that may affect fission-product release include grain
growth in the hot central region of the fuel, and the subdivision of grains that occurs in
the cool outer region of the fuel.
The burn-up is also not uniform across the fuel pellet, higher burn-ups can increase
porosity and polygonization of the UO2 grains, reducing the size to 0,15 m, this is the
“rim effect” (Bruno et al. 2006).
Figure 2. Illustration of the microstructure of spent fuel and the distribution of actinides and fission products
following burn-up in a reactor. Red labels indicate instantaneous release upon contact with water, blue indicates
slower release rates. Bruno et al. 2006
It is important to study the microstructure of the spent fuel, in order to understand the
impact on the release of contained fission products, and the dissolution behavior of
spent fuel and of UO2, the principal constituent of the fuel (Johnson and Werme, 1994)
(Bruno et al. 2006).
2.3.1 Processes controlling fuel Matrix Dissolution
The performance assessment of the final disposal of the spent nuclear fuel in the DGR is
strongly dependent on the spent fuel matrix dissolution. (Casas, de Pablo y Rovira,
2014; Berner, 1992). Because of this, a description of the processes that affect the
dissolution of the UO2 in the fuel matrix is shown as following.

11
• Radiolysis of water by the alpha, beta and gamma radiation
The radiolysis of water by the alpha, beta and gamma radiation could reach the interface
between the fuel surface and aqueous solutions. Under an ambient with reducing
conditions, radiolysis can create oxidizing conditions at the surface of the fuel. While
under oxidizing conditions, radiolysis is much less important (Bruno et al. 2006).
Since alpha activity within spent fuel decays very slowly compared to gamma and beta
activity, there is a possibility that oxidative dissolution will be sustained by alpha
radiolysis for a long period of time (Shoesmith and Sunder, 1991).
• Oxidants produced during radiolysis
The oxidants produced under oxidizing conditions, have a strong tendency to oxidized
the surface of the UO2 to UO2+x. The oxidizing species are taken up by the fuel surface,
and additional oxygen atoms enter the UO2 structure as interstitial oxygens, in
consequence, the fuel reaches a composition of UO2+x (0,3x0,4) (Bruno et al. 2006).
This dissolution process is considered as a corrosion reaction, in which the oxidant is
consumed to convert the insoluble UIV (in UO2) to the much more soluble UVI (as
𝑈𝑂22+) (Shoesmith, 2007).
• The oxidized U(VI) at the fuel surface
The oxidized U (VI) at the fuel surface can be released by complexing compounds
present in groundwater. The initial composition of the groundwater can be modified due
to its concentration during evaporation or reaction with backfill and the metal waste
package.
Uranium (VI) has a strong tendency to form complexes in solution with oxygen-
containing ligands. In geological disposal conditions, the main oxygen-containing
ligands are HCO3- (bicarbonate) and hydroxide (OH-).
If the concentration of U(VI) increases and the water saturation is reached, secondary U
(VI) phases can precipitate under oxidizing conditions.

12
2.3.2 Chemistry of UO2 dissolution
The dissolution of UO2 has been studied under oxidizing conditions (Shoesmith, 1991;
de Pablo et al. 1996). In the presence of radiolytically decomposed water, many
reactions can occur on the fuel surface including oxidative dissolution, radical
combination, hydrogen peroxide decomposition, reduction of oxidized surface layers,
and radical recombination catalyzed by redox-active species in the surrounding
environment (Shoesmith, 1991).
The following figure (fig. 3) shows the chemistry of UO2 dissolution as a function of
electrochemical potential. The potential scale in this figure represents the redox
condition established at the UO2+x surface (0 x 1), not the redox potential in the near
environment solution. It is a measure of the kinetic balance between the anodic
(oxidation) and cathodic (reduction) reactions that can occur on the surface (Shoesmith,
1991).
Figure 3. Surface chemistry of UO2 oxidation/dissolution as a function of surface redox conditions.
Sunder et al. 1997.

13
Figure 4. Surface chemistry of UO2 oxidation/dissolution as a function of surface redox conditions.
Shoesmith, 2007
The figures above (fig. 3 and 4), show the composition of a UO2 surface as a function of
potential vs SCE. -400 mv is the potential threshold above which UO2 would be
expected to be subject to corrosion, and below which only chemical dissolution can
occur. The arrow A indicates the corrosion potential range predicted by a mixed
potential model to describe fuel corrosion due to the alpha radiolysis of water inside a
failed waste container (Shoesmith, 2007). The upper limit is supposed to be the
corrosion potential (Ecorr) if the container fails on emplacement, and the lower limit
correspond to the Ecorr predicted after 106 years (Shoesmith, 2007).
The stability of UO2 is very dependent on vault redox conditions. At reducing
conditions, which are expected in deep groundwater, the dissolution of UO2-matrix can
be explained in terms of solutions, while oxidizing conditions, the UO2 is
thermodynamically unstable.
2.3.3 Radionuclides release mechanisms
The release of more than 90% of radionuclides contained in the used fuel matrix will be
governed by the corrosion/dissolution of the UO2 matrix. It is possible to relate the rate
of this process with the solubility of uranium in the groundwater. Under DGR
conditions, groundwater is anoxic and any available oxygen will be rapidly consumed
by mineral and biochemical reactions in the surrounding clays (Shoesmith, 2007).
While groundwater entering to the failed container may be oxygen-free, its radiolysis
14
due to the residual radioactivity from the fuel will produce a variety of chemical species
including oxidants (Shoesmith, 2007) (Johnson et al. 1996).
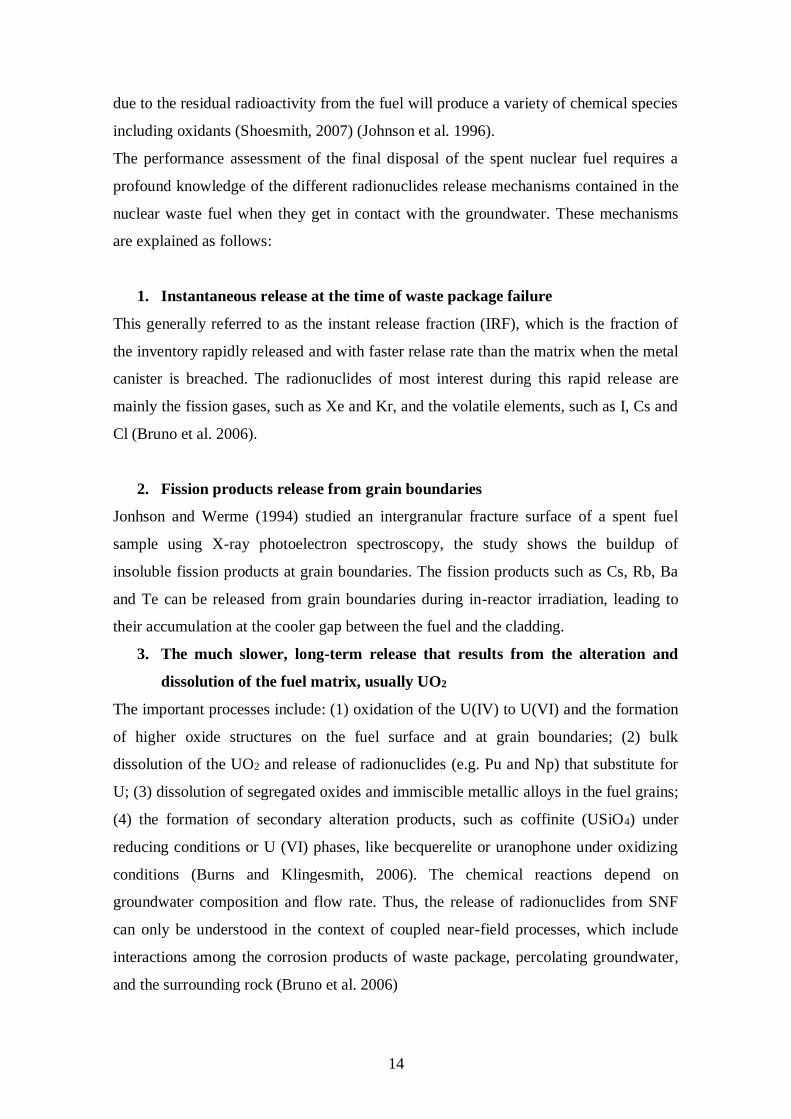
The performance assessment of the final disposal of the spent nuclear fuel requires a
profound knowledge of the different radionuclides release mechanisms contained in the
nuclear waste fuel when they get in contact with the groundwater. These mechanisms
are explained as follows:
1. Instantaneous release at the time of waste package failure
This generally referred to as the instant release fraction (IRF), which is the fraction of
the inventory rapidly released and with faster relase rate than the matrix when the metal
canister is breached. The radionuclides of most interest during this rapid release are
mainly the fission gases, such as Xe and Kr, and the volatile elements, such as I, Cs and
Cl (Bruno et al. 2006).
2. Fission products release from grain boundaries
Jonhson and Werme (1994) studied an intergranular fracture surface of a spent fuel
sample using X-ray photoelectron spectroscopy, the study shows the buildup of
insoluble fission products at grain boundaries. The fission products such as Cs, Rb, Ba
and Te can be released from grain boundaries during in-reactor irradiation, leading to
their accumulation at the cooler gap between the fuel and the cladding.
3. The much slower, long-term release that results from the alteration and
dissolution of the fuel matrix, usually UO2
The important processes include: (1) oxidation of the U(IV) to U(VI) and the formation
of higher oxide structures on the fuel surface and at grain boundaries; (2) bulk
dissolution of the UO2 and release of radionuclides (e.g. Pu and Np) that substitute for
U; (3) dissolution of segregated oxides and immiscible metallic alloys in the fuel grains;
(4) the formation of secondary alteration products, such as coffinite (USiO4) under
reducing conditions or U (VI) phases, like becquerelite or uranophone under oxidizing
conditions (Burns and Klingesmith, 2006). The chemical reactions depend on
groundwater composition and flow rate. Thus, the release of radionuclides from SNF
can only be understood in the context of coupled near-field processes, which include
interactions among the corrosion products of waste package, percolating groundwater,
and the surrounding rock (Bruno et al. 2006)
15
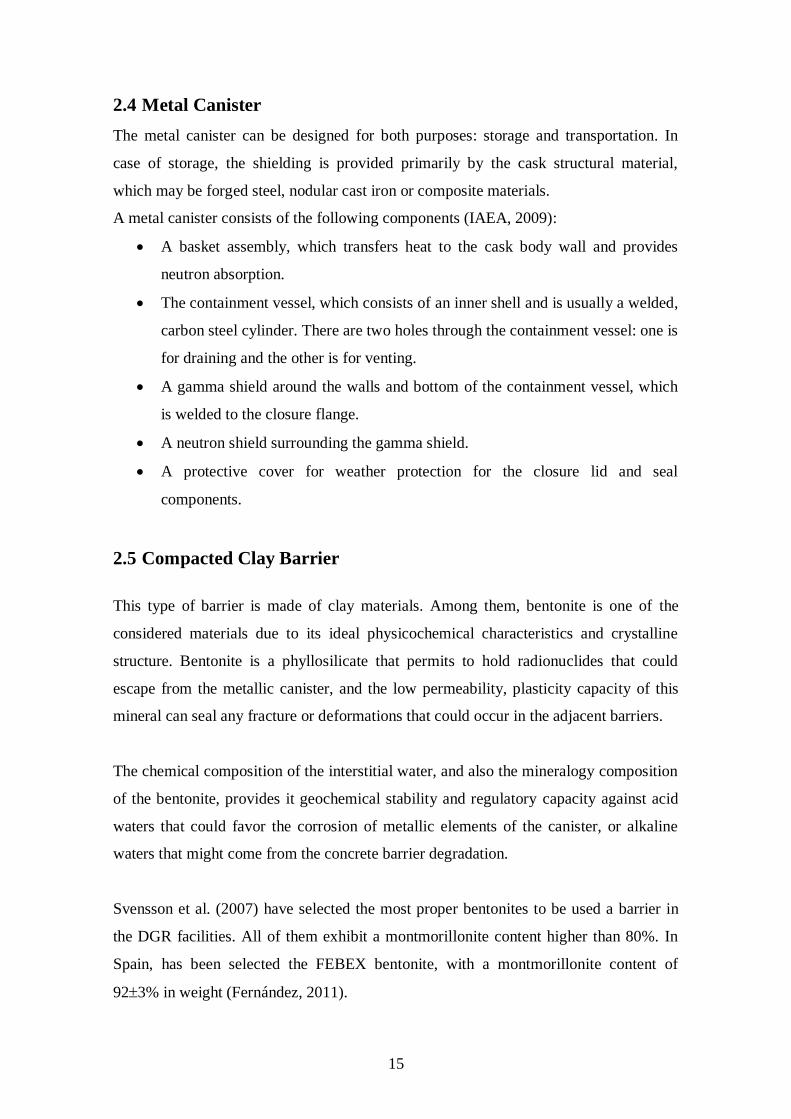
2.4 Metal Canister
The metal canister can be designed for both purposes: storage and transportation. In
case of storage, the shielding is provided primarily by the cask structural material,
which may be forged steel, nodular cast iron or composite materials.
A metal canister consists of the following components (IAEA, 2009):
• A basket assembly, which transfers heat to the cask body wall and provides
neutron absorption.
• The containment vessel, which consists of an inner shell and is usually a welded,
carbon steel cylinder. There are two holes through the containment vessel: one is
for draining and the other is for venting.
• A gamma shield around the walls and bottom of the containment vessel, which
is welded to the closure flange.
• A neutron shield surrounding the gamma shield.
• A protective cover for weather protection for the closure lid and seal
components.
2.5 Compacted Clay Barrier
This type of barrier is made of clay materials. Among them, bentonite is one of the
considered materials due to its ideal physicochemical characteristics and crystalline
structure. Bentonite is a phyllosilicate that permits to hold radionuclides that could
escape from the metallic canister, and the low permeability, plasticity capacity of this
mineral can seal any fracture or deformations that could occur in the adjacent barriers.
The chemical composition of the interstitial water, and also the mineralogy composition
of the bentonite, provides it geochemical stability and regulatory capacity against acid
waters that could favor the corrosion of metallic elements of the canister, or alkaline
waters that might come from the concrete barrier degradation.
Svensson et al. (2007) have selected the most proper bentonites to be used a barrier in
the DGR facilities. All of them exhibit a montmorillonite content higher than 80%. In
Spain, has been selected the FEBEX bentonite, with a montmorillonite content of
923% in weight (Fernández, 2011).

16
2.6 Cementitious Water and its effect in nuclear spent fuel repositories
As it is described in previous sections, DRG consists in the interposition of natural and
artificial barriers, between these nuclear wastes and the environment to isolate them
until its radioactive activity decay to inoffensive levels.
Since cement is used in the clay barrier to contain nuclear waste and also as a sealing
material, it is important to assess the effect of cementitious waters in contact with the
spent fuel, because these materials might play an important role as physical and
chemical barriers to the release of radionuclides into the far field. Therefore, the
knowledge of long-term diffusion and adsorption properties of concrete and mortar is
essential (Rojo et al. 2014). Large amounts of hydrated cement will determine the
chemical and physical properties of the repository near-field for a long period of time
(Berner, 1992).
Hydrated cement is largely defined by a system containing CaO, SiO2 and water among
other compounds (Berner, 1992) as it is shown in Table 4. The repositories for low and
intermediate level radioactive wastes will include large quantities of cement waste
matrices, construction elements and backfill materials.
Table 3. Proposed composition of backfilling mortar for use in containers (Gens, 2008)
Component Content
(kg/m3)
Content (weight
%)
CEM III/C 32.5 LA HSR LH 510 23,3
Silica fume 52 2.4
Calcareous aggregates (0/4) 1392 63,7
Water 223 10,2
Water/cement ratio 0,437
Superplasticiser (Rheobuild 1100 conc. 30%,
NSb type)
8,9 maximuma 0,406
a Could be adjusted downwards, depending on seasonal conditions
b Naphtalene sulphonate
As we can see at the table 4 due to the presence of silicate and calcium ions, most of the
components in hydrated cement can cause the increase of the pH of waters in contact
with it (Berner, 1992). Santos et al. (2006) studied the influence of pH on the corrosion

17
of SIMFUEL, an analogue of the SNF. The following oxidation mechanism at high pH
was proposed:
𝑈𝑂2 + 𝑥𝐻2𝑂 → 𝑈1−2𝑥𝐼𝑉 𝑈2𝑥
𝑉 𝑂2+𝑥 + 2𝑥𝐻+ + 2𝑥𝑒− (eq. 1)
𝑈1−2𝑥𝐼𝑉 𝑈2𝑥
𝑉 𝑂2+𝑥 + 3𝑂𝐻− → 𝑈𝑉𝐼𝑂2+𝑥(𝑂𝐻)3− + 2𝑒− (eq. 2)
The physical and chemical properties of deposits formed on fuel surfaces will be
determined by the combination of redox conditions, temperature and groundwater
composition. Buck et al. (1998), Santos et al. (2006) showed that a complicated range of
phases is possible as redox conditions evolve from oxidizing to eventually anoxic. The
incorporation of calcium and the formation of silicates are a common feature of these
phases, indicating that these groundwater constituents could exert an important
influence on fuel corrosion over long periods of time (Santos et al. 2006).
In many cases, the cement is used for stabilizing contaminated wastes. This technique is
one of the most popular solidification/stabilization (S/S) techniques prior to near-
surface or underground disposal. Mixing radioactive waste products with a cementitious
binder system improves the stabilization and the solidification of waste materials
(Harfouche et al. 2006).
As we said previously, cement is used to condition the waste material and to construct
the engineer barrier systems of the repository; more than 70 wt. % of the disposal
galleries consists of cementitious backfill materials (Nagra, 2002).
Because of this, in the following sections, we’re going to describe the effect of the
calcium and silicate in the cementitious backfill materials when it gets in contact with
the nuclear waste.
2.6.1 The effect of Calcium present in cement barriers for nuclear waste
Santos et al. (2006c) studied the effect of calcium presence. The study suggests that
Ca2+ does not influence the surface oxidation process 𝑈𝑂2 + 𝑥𝐻2𝑂 → 𝑈1−2𝑥𝐼𝑉 +
𝑈2𝑥𝑉 𝑂2+𝑥 + 2𝑥𝐻+2𝑥𝑒−, but impede the subsequent formation of surface UVI species
which are thought to form via dissolution as 𝑈𝑂22+-deposition as 𝑈𝑂3 ∙ 𝑦𝐻2𝑂 process.
The authors suggest that two possible explanations exist by which calcium adsorption
could suppress the formation of UVI surfaces species: blocking the O2- anion transfer

18
reaction from the fuel surface or the adsorption of Ca2+ on the UO2 surface that could
impede the fuel dissolution.
2.6.2 The effect of Silicate present in cement barriers for nuclear waste
Santos et al. (2006b) also studied the effect of silicate; the electrodes used in this study
were natural UO2 doped with non-radioactive elements to replicate the chemical effects
of CANDU reactor, and were anodically oxidized in a solution containing 0,1 M
NaSiO3 and 0,1 M NaCl at pH=9,5.
Santos et al. (2006b) concluded that the presence of silicate has little influence on the
oxidation of UO2 to produce an oxidized surface layer 𝑈1−2𝑥𝐼𝑉 𝑈2𝑥
𝑉 𝑂2+𝑥, nevertheless the
silicate does not impede its formation. Due to the accumulation of UIV on the
𝑈1−2𝑥𝐼𝑉 𝑈2𝑥
𝑉 𝑂2+𝑥 surface there is an increasing dominance of UVI at higher potentials.
Also, the study suggests the conversion of 𝑈1−2𝑥𝐼𝑉 𝑈2𝑥
𝑉 𝑂2+𝑥 → 𝑈𝑂3 ∙ 𝑦𝐻2𝑂 is inhibited
initially in silicate solution, possibly due to the adsorption of silicate on the fuel surface
since the precipitation of a uranium-silicate hydrated phase was observed at high
corrosion potentials (Shoesmith, 2007).
2.6.3 The effect of Calcium and Silicate present in cement barriers for
nuclear waste
Groundwater might contain calcium and silicate which could lead to the formation of
corrosion product deposits and the formation of insoluble UVI phases (Shoesmith,
2007).
Harfouche et al., (2006) studied the uptake of U(VI) by calcium silicate hydrates (C-H-
S) using X-ray absorption fine structure spectroscopy, for that C-H-S phases were
synthesized using two different procedures: one based on the mixing of CaO and SiO2
solids, and the other one is based on starting solutions of Ca and Si. The authors
reported that some similarities exist between the experimentally determined structural
parameters for U(VI)-doped with calcium silicate hydrates (C-S-H) and the structural
parameters for uranophane: a structural model for U(VI) uptake by C-S-H phases.
Kienzler et al., 2006 studied the effects of the NaCl and MgCl2 dissolutions in contact
with a cement monoliths doped with U(VI), they found that the dominant uranium
phase was uranophane in the corroded cement. Nevertheless, other possible uranium
phases could precipitate such as soddyite, metaschoepite and di-uranate.

19
2.7 Main Uranium Health Effects
The study of the alteration process of the UO2 helps to understand the behavior of the
SNF matrix, which has more than 90% of the radionuclides. If due to corrosion process,
the uranium is released to the groundwater, the contained radionuclides in the SFN
matrix will be released.
This released radionuclides can contaminate water bodies, in consequence, the water
that we ingest and cause major health problems.
The importance of controlling the waters that have been in contact with uranium is that
the more water-soluble compounds present, the highest toxicity in human health (Keith
et al., 2013).
When a contaminant is released from a large area such as an industrial plant or from a
container such as drum or bottle, it enters the environment. But such a release does not
always lead to exposure. Normally a person is exposed to a contaminant when he is in
contact with it. That contact and/or exposure can occur when a person breathes, eats,
drinks or touches that contaminant. However, since uranium is radioactive, someone
can also be exposed to its radiation.
Even if is this person is exposed to uranium, he or she might be not harmed. Whether
the person is harmed will depend on such factors as the dose (how much), the duration
(time of the exposure), and how the person happens to contact it. Harm might also
depend on whether the person has been exposed to any other chemicals or radioactive
materials, as well as age, sex, diet, family, traits, lifestyle, and state of health.
Uranium’s main target is the kidneys. Kidney damage has been in humans and animals
after inhaling or ingesting uranium compounds. Ingesting water-soluble uranium
compounds will result in kidney effects at lower doses than following exposure to
insoluble uranium compounds. Once the uranium is in the bloodstream, the compounds
are filtered by the kidneys, where they can cause damage to the kidney cells. Very high
uranium intakes (ranging from about 50 to 150 mg depending on the individual) can
cause acute kidney failure and death. At lower intake levels (around 25 to 40 mg),
damage can be detected by the presence of protein and dead cells in the urine, but there
are no other symptoms.

20
Renal effects have been observed in animals exposed to aerosols of soluble uranium
compounds at concentrations superiors of 0,13 mg U/m3 for intermediate durations.
However, no renal effects were observed in animals exposed to 1,0 mg U/m3 as
insoluble compounds, the LOAEL (lowest-observed-adverse-effect level) was 8,2 m
U/m3 (Keith et al., 2013). These data suggest that soluble compounds are at least five
times more toxic than insoluble compounds, as we said at the beginning of this text.
The available data on the oral and dermal toxicity of uranium are more limited than by
the inhalation route. The available studies suggest that inhalation and oral exposure to
low levels of uranium (doses or concentrations resulting in minimal renal effects),
toxicity is not strongly influenced by the duration of exposure (Keith at al., 2013)
Some studies have examined the toxicity of depleted uranium in a small number of
animals. These studies focused on renal toxicity and neurotoxicity. As with exposure to
natural uranium, alterations in renal function and histopathology (swollen glomeruli,
necrosis and fibrosis) were observed in rats exposed to depleted uranium. Acute
exposure to depleted uranyl acetate in drinking water resulted in increased motor
activity in male rats exposed to 28 mg U/Kg/day and female mice exposed to 6 mg
U/kg/day. Implantation of depleted uranium pellets in rats resulted in measureable
uranium in the brain at 6-18 months after the implantation, showing the
bioaccumulation of the uranium, at least in animals; and, this accumulation was
accompanied by electrophysiological changes in brain.

21
3. Analytical Methods
3.1 Scanning electron microscopy (SEM)
The scanning electron microscope permits the observation and characterization of
heterogeneous organic and inorganic materials on nanometer (nm) to micrometer (m)
scale. The SEM has the capability of obtaining three-dimensional-like images of the
surfaces of a very wide very wide range of materials (Goldstein et al. 2003). The major
use is to obtain topographic images in the magnification range 10-1000X.
The scanning electron microscope (SEM) uses focused beam of high-energy electrons
to generate a variety of signals at the surface of solid specimens. The signals that derive
from electron-sample interactions reveal information about the sample including
external morphology (texture), chemical composition, and crystalline structure and
orientation of materials (Swapp, 2017). In most applications, data are collected over a
selected area of the surface of the sample, and a 2-dimensional image is generated that
displays spatial variations in these properties. Areas ranging from approximately 1 cm
to 5 microns in width can be imaged in a scanning mode using conventional SEM
techniques (magnification ranging from 20X to approximately 30,000X, spatial
resolution of 50 to 100 nm). The SEM is also capable of performing analyses of
selected point locations on the sample; this approach is especially useful in qualitatively
or semi-quantitatively determining chemical compositions (using EDS), crystalline
structure, and crystal orientations (using EBSD) (Swapp, 2017).
3.1.1 Operating Principle of the SEM
The electron source used in the SEM can be tungsten filament, else a LaB6 or Schottky
emitter, or a tungsten field-emission tip. Axially-symmetric magnetic lenses are used
but they are also smaller than those employed in the TEM, for electrons of lower kinetic
energy, the pole pieces need not generate such a strong magnetic field.

22
Figure 5. Schematic diagram of a SEM with a CRT display. Egerton, 2005
Figure 5, shows that there are usually two or three lenses, which act like the condenser
lenses of a TEM. The incident beam in the SEM (also known as the electron probe)
need to be as small as possible: a diameter of 10 nm is typical and 1 nm is possible with
a field-emission source. The final lens that forms this very small probe is named the
objective, its performance (including aberrations) largely determines the spatial
resolution of the instrument, as does the objective of a TEM or a light-optical
microscope. In fact, the resolution of an SEM can never be better than its incident-probe
diameter (Egerton, 2005).
Whereas the conventional TEM uses stationary incident beam, the electron probe of a
SEM is scanned horizontally across the specimen in two perpendicular (x and y)
directions. The x-scan is relatively fast and is generated by a sawtooth-wave generator
operating at a line frequency fx. This generator supplies scanning current to two coils,
connected in series and located on either side of the optic axis, just above the objective
lens. The coils generate a magnetic field in the y-direction, creating a force on an
electron that deflects it in the x-direction. The y-scan is much slower and is generated by
a second sawtooth-wave generator running at a frame frequency. The entire procedure is
known as raster scanning and causes the beam sequentially to cover a rectangular area
on the specimen (Egerton, 2005).

23
3.1.2 Applications
SEM is routinely used to generate high-resolution images of shapes of objects (SEI) and
to show spatial variations in chemical compositions: 1) acquiring elemental maps or
spot chemical analyses using EDS, 2) discrimination of phases based on mean atomic
number (commonly related to relative density) using BSE, and 3) compositional maps
based on differences in trace element "activitors" (typically transition metal and Rare
Earth elements) using CL. SEM is also widely used to identify phases based on
qualitative chemical analysis and/or crystalline structure. Precise measurement of very
small features and objects down to 50 nm in size is also accomplished using SEM
(Swapp, 2017).
To conclude, the information that we can obtained from a scanning electron microscopy
inspection (SEM) is:
• Surface topography if low energy secondary electrons are collected.
• Atomic number or orientation information if higher energy backscattered
electrons are used for imaging.
• Differentiation between surface roughness, porosity, granular deposits, stress-
related gross microcracks.
• Observation of grain boundaries in unetched samples.
• Critical dimension measurements.
• Elemental analysis.
3.2 X-ray photoelectron spectroscopy (XPS)
X-ray photoelectron spectroscopy (XPS) is applied to a wide range of materials, in
order to obtain a variety of analytical information. Although XPS can be applied to
gases, liquids and solids. XPS is essentially a large area analysis (some mm2) with a
characteristic analysis depth of several nanometers. The main objective of the XPS is
the characterization of the surface or near surface regions of materials applied in areas
of materials science such as adhesion, polymer chemistry, corrosion and composite
materials (Watts, 1994).
24
XPS technique probes the energy distribution of electrons ejected from solids via
irradiation by X-rays and the photoelectric effect; the electrons contain information
regarding chemical oxidation state, electronic structure, and atomic composition the
analyte studied. Thus, surface composition as well as the electronic environment can
nondestructively be determined. X-ray photoelectron spectroscopy is also useful for
quantitative analysis, capable of probing ultrathin layers of material. Since the
photoelectrons analyzed come only from the topmost atomic layers of the solid surface
studied (100 Armstrong), the technique is an invaluable tool for studying interfacial
phenomena at the solid-solid and solid-gas boundaries (Chusuei and Goodman, 2002).
3.2.1 The principles of XPS
A surface is irradiated with X-rays (commonly Al K or Mg K) in vacuum. When an
x-ray photon hits and transfers this energy to a core-level electron, it is emitted from its
initial state with a kinetic energy dependent on the incident X-ray and biding energy of
the atomic orbital from which it originated. The energy and intensity of the emitted
photoelectrons are analyzed to identify and determine the concentrations of the elements
present in the sample; a photoelectron spectrum is recorded, as figure 10 shows, by
counting ejected electrons over a range of electron kinetic energies. Peaks appear in the
spectrum from atoms emitting electrons of a characteristic energy. The energies and
intensities of the photoelectron peaks enable identification and quantification of all
surface elements, except hydrogen. These photoelectrons originate from a depth of 10
nm therefore the information obtained is from within this depth (NPL, 2012)
As conclusion, the X-ray photoelectron spectroscopy is used for:
• Depth profiling on surfaces.
• Identification and measurement of surface contamination and organic over
layers e.g. to solve problems of adhesion of coatings on substrates.
• Analysis of nanoparticles.
• Silicon dioxide on silicon thickness measurement for the semiconductor
industry.
• Identification of counterfeit products.
• Catalysis and corrosion studies.

25
• Characterization of a wide range of materials such as paints, polymers, ceramics
and glasses.
3.3 Raman spectroscopy
Raman spectroscopy (RS) resolves most of limitations of other spectroscopic techniques
and can be used for both qualitative and quantitative purpose. Qualitative analysis can
be performed by measuring the frequency of scattered radiations while quantitative
analysis can be performed by measuring the intensity of scattered radiations (Bumbrah
and Sharma, 2015).
3.3.1 The principles of Raman Spectroscopy
Raman spectroscopy, as said in the previous paragraph, is a scattering technique. It is
based on Raman Effect: inelastic scattering of incident radiation through its interaction
with vibrating molecules (Settle, 1997) (Chalmers et al, 2012).
The sample is illuminated with a monochromatic laser beam which interacts with the
molecules of sample and originates a scattered light. The difference in frequency
between the scattered light and the incident light is used to create a Raman spectrum.
Raman spectra arise due to inelastic collision between incident monochromatic radiation
and molecules of sample. When a monochromatic radiation strikes at sample, it scatters
in all directions after its interaction with sample molecules (Bumbrah and Sharma,
2015). A small fraction of scattered radiation has a frequency different from frequency
of incident radiation and this constitutes Raman scattering. When the frequency of
incident radiation is higher than frequency of scattered radiation, Stokes lines appear in
Raman spectrum. But when the frequency of incident radiation is lower than frequency
of scattered radiation, anti-Stokes lines appear in Raman spectrum. Scattered radiation
is usually measured at right angle to incident radiation (Skoog et al. 2007) (Willard et
al. 1988).
A Raman spectrum is presented as an intensity-versus-wavelength shift. Raman spectra
can be recorded over a range of 4000-10 cm-1. Depending on spectrophotometer’s
design and optical components, typical Raman spectra cover the wavenumber region
between 400-5 cm-1 and 4000-400 cm-1 (Bumbrah and Sharma, 2015).

26
The Raman spectrometers consist of: one or more single colored light sources (light),
lenses: both to focus the light onto the sample and to collect the scattered light; filters to
purify the reflected and scattered light so only the Raman light is collected; a means of
splitting the light into its constituent colors (typically a diffraction grating or prism); a
very sensitive detector to detect the weak light and a device such as a computer to
control the whole system which displays the spectrum and enables the information so
the sample can be characterized.
Raman spectrophotometers can be dispersive or non-dispersive. Dispersive Raman
spectrophotometer uses an interferometer use prims or grating while non-dispersive
Raman spectrophotometer uses an interferometer such as Michelson interferometer in
Fourier Transform Raman spectrophotometer.
Normally, laser sources are used and provide stable and intense beam of radiation. Wide
range of lasers such as Argon ion laser (488 and 514,5 nm), Krypton ion laser (530,9
and 647,1 nm), Helium-Neon (He-Ne) (632,8 nm), Near Infrared (IR) diode lasers (785
and 830 nm), Neodymiun-Ytrium Aluminum Garnet (Nd:YAG) can be used as light
source in Raman spectrophotometers. Short wavelength sources such as argon ion and
krypton ion lasers can produce significant fluorescence and cause photodecomposition
of the sample (Bumbrah and Sharma, 2015).
In Raman microspectroscopy, Raman spectrophotometer is interfaced to an optical
microscope which enables both visual and spectroscopic examinations as either as
single point, mapping or imaging measurements. Microscope is used to focus the laser
beam onto the sample. Raman microspectrophotometry enables the visual inspection of
sample and facilities spectroscopic analysis of a limited amount of sample or a selected
small region within a sample (Bumbrah and Sharma, 2015).
Raman spectrophotometers can be categorized in two broad classes, depending on the
area of use: lab based spectrophotometers and in-field, in situ or down-field use Raman
spectrophotometers. The basic principle is same in each case and these systems are
differentiated by versatility of an instrument and size and relative cost of its
components. In this case was used a stand-off Raman spectrophotometer which are
available for on-site analysis and research purpose (Bumbrah and Sharma, 2015).

27
4. Experimental Methodology
4.1 Electrochemical instrumentation
Electroanalytical chemistry encompasses a group of quantitative analytical methods that
are based upon the electrical properties of an analyte solution when it is made part of a
cell. There are two general types of electrochemical methods: potentiometric (no
current, equilibrium potential) and voltammetric where current is measured as a
function of the applied potential.
An electrochemical cell consists of two electrodes: an anode, at which the oxidation
reaction occurs, and the cathode, the electrode at which the reduction reaction occurs.
The electrodes transport produced electrons from one half-cell to another, which
produce an electrical charge. In an electrochemical cell, we might find three types of
electrodes:
• Working electrode: the electrode at which the reaction of interest occurs.
• Counter electrode: the electrode, at which the other (coupled) reaction occurs.
• Reference electrode: an electrode that has an established electrode potential.
Finally, a solution is used as electrolyte, which allows the electron transfer between the
working electrode and the counter electrode. Additionally, it usually contains ions with
either positive or negative electrical charge.
4.1.1 The Cell
A Metrohm glass vessel of 50 ml (fig. 7) was used for the electrochemical
measurements. The dropsens electrode was connected through the USB connection
(DRP-CAC 71569) to the Metrohm Autolab Potentiostat-Galvanostat M204, and was
controlled by using the NOVA software 2.1 version.
With the Metrohm Autolab Potentiostat-Galvanostat we can perform measurements in
potentiostatic or galvanostatic mode. In the specific case of potentiostatic mode,
experiments are done at a fixed DC potential. A sinusoidal potential perturbation is
superimposed on the DC potential and applied to the cell; the resulting current versus
time is measured in this type of experiments.

28
The Dropsens electrodes were used as counter, working and reference electrode, their
characteristics are shown in following sections.
Figure 6. The cell used to perform all the experiments.
4.1.2 The Electrolytes
Three types of electrolyte were used to perform the electrochemical analyses.
The solutions were prepared using AppliChen Panreac, Fluka, Merck and Scharlau
chemicals. Milli-Q water 18,2 M. cm at 25ºC generated by a Millipore water
purification system was used for the preparation of the solutions.
First, a Na+Cl- 0,1 M pH=12 solution was used. This first solution worked as blank.
Then, a Na+Cl- 0,1 M, SiO3-2 0,001M pH=12 solution was used as second electrolyte,
and finally a Na+Cl- 0,1 M, SiO3-2 0,001M and Ca2+ 0,0001 M pH=12 was used as a
third electrolyte. The pH was adjusted in all cases with a pH meter from Hanna
instruments, model H12002-02 software version 1.08.
A Na+OH- solution 0,1 M was also used to adjust the pH when necessary.
These solutions were used to perform cyclo-voltammetric measurements and could
determine if silicate and calcium have any effect on the UO2 corrosion process.
Electrolyte
Cell
Electrode

29
Table 4. Summary of electrolytes used to perform electrochemical studies
pH First
Electrolyte
Second
Electrolyte
Third
Electrolyte
Na+Cl- (blank) 12 0,1 M 0,1 M 0,1 M
SiO3-2 12 - 0,01 M 0,01 M
Ca2+ 12 - - 0,001 M
4.1.3 Dropsens Electrode
The Dropsens electrodes are screen-printed electrodes (SPEs) based on carbon,
manufactured by Dropsens for electrochemical analysis in environmental, clinical or
agri-food areas. They are disposable, low cost devices specially designed to work with
micro volumes of sample or dip them in solutions.
The carbon SPEs characteristics are the following:
Table 5. Carbon SPEs (Dropsens) characteristics. Dropsens.com
Ceramic Substrate L33xW10xH0.5 mm
Electric contacts Silver
Electrochemical cell --
Working electrode Carbon 4 mm diameter
Auxiliary electrode Carbon
Reference electrode Silver
All potentials are specified or reported as the potential of the working electrode respect
to the reference electrode, in this case was Ag/AgCl.

30
On the following image, it is possible to locate the reference, working and counter
electrode on the surface of the carbon SPEs.
The following photo (figure 8) shows a SEM image of the Dropsen before performing
any experiment.
It is important to remark that all the experiments were performed under environmental
conditions, in contact with air. As a consequence, the oxygen concentration in solution
remains constant. The oxygen is never totally consumed by the oxidation of the working
electrode due to the oxygen diffusion from the atmosphere.
1 Counter Electrode
2 Working Electrode
3 Reference Electrode
a C.E. connection
b W.E. connection
c R.E. connection
1
2 3
a b
c
Figure 8. SEM image of working electrode. Dropsens.com
5 µm
Figure 7. Dropsen used to perform
all the experiments.

31
4.2 Dropsens surface modification: Deposition of UO2
The UO2 stripping was done by using the Autolab Potentiostat-Galvanostat M204, all
the conditions used to perform the experiment were specified in the NOVA software 2.1
version. Two types of electrodes with UO2 were prepared: one with deposition time of
15 minutes and another one with deposition time of 60 minutes.
The stripping procedure was performed using a dissolution of uranyl acetate with a
concentration of 0,06 M and pH 4,5 (fig. 9). Once the procedure was done, the electrode
was rinsed with sufficient Milli-Q water.
Figure 9. Deposition of UO2 on dropsen electrode surface
4.2.1 SEM Images of deposited Dropsen® surface
After the electrodeposition, a characterization with XPS and Raman spectroscopy was
performed to the modified electrodes.
The composition of the resulting surface of the electrode was characterized by SEM.
The analisys observations were performed at Barcelona Research Center for multiscale
science and engineering (BRCMSE), situated in UPC-Diagonal Besòs.

32
Figure 10. SEM images from deposited electrode. (a) 3.00K X 15-min deposition time, (b) 50.00K X 15-min
deposition time, (c) 3.00K X 60-min deposition time, (d) 50.00K X 60-min deposition time
The figure 10a shows a SEM image with a 3.00K X magnitude, of the surface of the
screen-printed electrode (Dropsens). As this image shows, the Dropsens surface was
substantially modified by the deposition of a solid phase.
The precipitate obtained has been deposited on the different layers that makes up the
carbon electrode surface, it will explain the presence of the fractures that are observed
in the image.
In figure 10b, it is possible to observe a SEM image with a 50.00K X magnitude,
corresponding at the same surface electrode deposited with UO2.
The SEM photograph shows with much clarity the fractures, also it is possible to
observe the porosity of fractures edges.
Following, the figure 10c shows a SEM image with 3.00K X magnitude of the screen-
printed electrode surface. This electrode has been deposited with UO2 for 60 minutes.
10 µm 200 nm
200 nm10 µm
ba
c d
33
It is possible to observe the fractures that also appear in the fig. 10a and 10b, but the
layer deposited in the surface electrode for 60 minutes appears to be more porous than
that deposited for 15 minutes’.
The figure 1d shows a SEM image with a 50.00K X magnitude of the 60 minutes
deposited electrode. It is possible to observe with more detail the porosity of the
surface, this SEM image confirm the information that is shown in the figure 11c.
4.2.2 Raman spectroscopy of deposited Dropsen® surface
Raman microspectrometric measurements were carried out with a Renishaw confocal
inVia Qontor Raman spectrometer (Renishaw PLC., England).
Raman backscattering was excited with a 535-nm excitation wavelength. Individual
spectra were obtained using an exposure of 10 s over the wavenumber range from 1100
to 2250 cm-1 for carbon and from 0 to 1150 cm-1 for UO2. The laser was focused onto
the sample using a 20X uncoated-objective lenses at the Dropsens electrode.
Figure 11. Raman spectrum for the electrode with no deposition
The Raman spectrum shown in the figure 11 corresponds to the dropsens with no
deposition. As specified in section 4.1.3, the screen-printed electrode was based in
carbon, hence the graphic shows the spectrum corresponding to the carbon at 1562 cm-1.
This information is corroborated by the bibliography, locating the carbon materials
bands in the Raman spectra, between 1300 and 1700 cm-1 (Escribano et al. 2001) (Wang
et al. 1990).
Figure 12 shows the Raman spectra carried out in the modified electrode.
0
2000
4000
6000
8000
10000
12000
14000
16000
18000
20000
1100 1200 1300 1400 1500 1600 1700 1800 1900 2000 2100 2200
Inte
nsi
ty
Raman Shift (cm-1)
Raman Spectrum Carbon
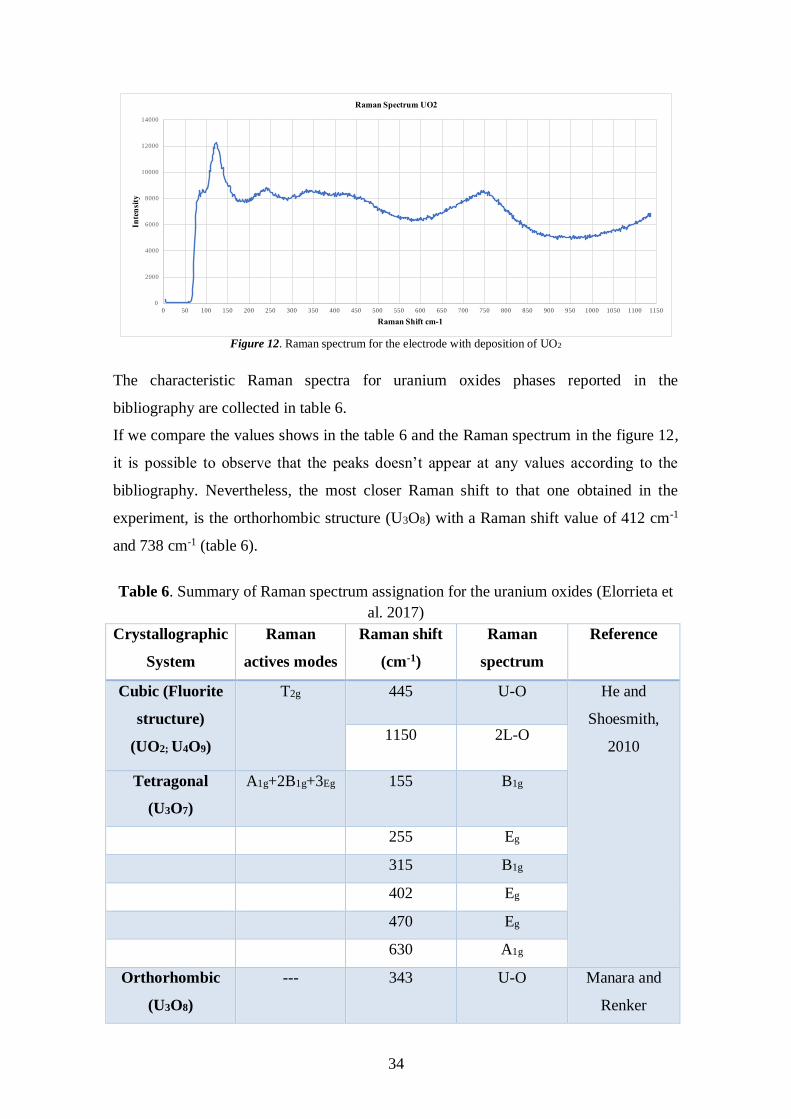
34
Figure 12. Raman spectrum for the electrode with deposition of UO2
The characteristic Raman spectra for uranium oxides phases reported in the
bibliography are collected in table 6.
If we compare the values shows in the table 6 and the Raman spectrum in the figure 12,
it is possible to observe that the peaks doesn’t appear at any values according to the
bibliography. Nevertheless, the most closer Raman shift to that one obtained in the
experiment, is the orthorhombic structure (U3O8) with a Raman shift value of 412 cm-1
and 738 cm-1 (table 6).
Table 6. Summary of Raman spectrum assignation for the uranium oxides (Elorrieta et
al. 2017)
Crystallographic
System
Raman
actives modes
Raman shift
(cm-1)
Raman
spectrum
Reference
Cubic (Fluorite
structure)
(UO2; U4O9)
T2g 445 U-O He and
Shoesmith,
2010 1150 2L-O
Tetragonal
(U3O7)
A1g+2B1g+3Eg 155 B1g
255 Eg
315 B1g
402 Eg
470 Eg
630 A1g
Orthorhombic
(U3O8)
--- 343 U-O Manara and
Renker
0
2000
4000
6000
8000
10000
12000
14000
0 50 100 150 200 250 300 350 400 450 500 550 600 650 700 750 800 850 900 950 1000 1050 1100 1150
Inte
nsi
ty
Raman Shift cm-1
Raman Spectrum UO2

35
412 U-O
483 U-O
738 O-U-O-U
811 U-O
4.3 Electrochemical Measurements
4.3.1 Cyclic Voltammetry
Cyclic voltammetry (CV) is an electrochemical technique which measures the current
that develops in an electrochemical cell under conditions while the potential applied
between the working electrode and the reference electrode changes with time.
A cyclic voltammogram is obtained by measuring the current at the working electrode
during the potential scans (Kissinger and Heineman, 1983). The following figure shows
a cyclic voltammogram resulting from a single electron reduction and oxidation
considering the following reversible reaction:
M++ e- M (eq. 3)
Figure 13. CV of a single electron oxidation-reduction. Quiroga, 2017

36
In fig. 13, the reduction process occurs from the initial potential (point a) to the
switching potential (point d). In this region, the potential is scanned negatively to cause
a reduction. The resulting current is called cathodic current (ipc). The corresponding
peak potential occurs at the point c, and is called the cathodic peak potential (Epc). The
Epc is reached when all the substrate at the surface of the electrode has been reduced.
After the switching potential has been reached (point d), the potential scans positively
from point d to point g. This results in anodic current (Ipa) and oxidation to occur
(Skoog et al. 2007). The peak potential at point f is called the anodic peak potential
(Epa), and is reached when all the substrate at the surface of the electrode has been
oxidized.
As figure 14 shows, the potential first starts at negative values (reducing potentials)
(point a) and it ends high positive potential (point d). The potential extrema (d) is call
the switching potential, and is the point where the voltage is enough to have caused the
oxidation of the analyte. The reverse scan occurs from the point d to the point g, where
the potential is negative again, closing the potential cycle. Figure 17 shows a typical
reduction occurring from the point d to point g and oxidation occurring from point a to
point d (Quiroga, 2017).
In the following sections, all the electrochemical experiments are explained. Before to
perform any experiment, the cell was washed, left overnight in a solution of HNO3 5%
to remove any ion that could affect the results, then was rinsed with Milli-Q water.
Figure 14. Cyclic Voltammogram Excitation Signal. Quiroga, 2017

37
4.3.2 Cyclic-voltammetry experiments
Cyclic-voltammogram experiments were performed to study the behavior of the
modified electrode in different types of electrolytes. The potential was scanned between
-1,4 V to +0,7 V vs. Ag/AgCl saturated reference electrode, the scan rate used was 0,01
V/s. The CV runs were done under oxidizing atmosphere.
For each CV study performed, new initial solution was used and a careful cleaning of
the cell to avoid the presence of ions that could affect the experiments and, as a
consequence, alter the results.
4.3.3 Potentiostatic experiments
To determine the effect of the presence of each ion and the reactions involved in the
corrosion process, potentiostatic experiments were performed. In this thesis, a
potentiostatic experiment was perfomed at a fixed potential of 245 mv for each type of
electrolyte (table 4). The electrode used in this case was the dropsen with a previous
deposition time of 60 minutes. The experimental time was about 1 hour. A graphic of
density current versus time was obtained.
4.3.4 Open circuit potential measurements
The open circuit potential, also referred to the corrosion potential, is defined as the
potential between the cathodic and the anodic electrodes at their corrosion current
density (Pérez, 2004). Experiments based on the measurement of the open circuit
potential are potentiometric experiments.
Here, the current applied was 0 A between the 60 minutes’ deposition electrode and the
counter electrode for 24 hours. Then, the evolution of the potentials as a function of
time was recorded. The electrolytes used are shown in table 4.

38
5. Results and Discussion
5.1 Cyclic-voltammetry results
5.1.1 Comparison between each electrolyte using electrode with no
deposition
In fig. 15 a three set of cyclic-voltammogram recorded on the electrode with no
deposition is detailed with each type of electrolyte: Na+Cl- 0,1 M pH=12; SiO3-2 0,001M
pH=12 and SiO3-2 0,001M and Ca2+ 0,0001 M pH=12. The scan rate used was 0,01 V/s
in each case, the studied region went from -1,4 V to 0,7 V.
Figure 15. Cyclic voltammogram recorded on Dropsen with no deposition for Na+Cl- 0,1 M pH=12; SiO3-2 0,001M
pH=12 and SiO3-2 0,001M Ca2+ 0,0001 M pH=12 electrolytes.
In Na+Cl- electrolyte, the current density increases following a linear tendency, as occur
in the other two cases (SiO3-2 and SiO3
-2, Ca2+ dissolutions) (region 1).
One oxidation peak, on the anodic region, is observed: at 0,5 V for each electrolyte
(region 2). The region 3 that occurs at the anodic limit of 0,7 V, the density current
increase due to the limit conditions that produces the water oxidation.
The cyclic-voltammograms recorded in SiO3-2 and Ca2+ electrolyte, are similar in the
anodic section. As mentioned before, the peak is also observed at 0,7 V. The value
1
2
3
4
5
NaCl electrolyte
NaCl+Si electrolyte
NaCl+Si+Ca electrolyte

39
reached for current is very similar for both Na+Cl- and SiO3-2 electrolyte 1,66x10⁻⁵ and
1,79x10⁻⁵ A.cm-2 respectively; while the reached value for current for Ca2+ is lower than
Na+Cl- and SiO3-2 electrolyte around 1,12 x10⁻⁵ A.cm-2.
On the cathodic region, region 4 and 5, one reduction peak is observed at -0,05 V. The
other reduction peak is observed at -0,46 V for Na-Cl+ and SiO3-2, Ca2+ electrolytes. For
SiO3-2, the reduction peak is observed at -0,55 V.
In the following section a comparison was done between 15-min and 60-min deposition
time of the modified electrode, in order to decide which electrode presented the most
stable and reproducible behavior to perform the future experiments.
5.1.2 Comparison between 15-min and 60-min deposition modified
electrode for Na+Cl- electrolyte
Figure 16. Comparison between the Dropsen electrode with no deposition, 15-min and 60-min deposition of UO2 for
the SiO3-2 0,001M pH=12 electrolyte.
Another comparison was done between the electrode with no deposition, 15 minutes’
deposition and 60 minutes’ deposition, to study the behavior of it for each electrolyte
Deposition 15 min
Deposition 60 minCV for Na+Cl-
electrolyte

40
and observe if it is any difference between them, according to the response in the
dissolution.
In the figure 16, it is possible to observe the presence of an immense oxidation peak for
the modified electrode, and there is no an important oxidation peak for the electrode
with no deposition
As it is observed in the figure 16, for the 15 minutes’ deposition time, an oxidation peak
is observed from -0,15 V to -0,15 V, it reached a density current value of 4,0x10⁻⁵
A.cm-2. As the image shows, this peak is less large compared to 60-min deposition. For
the 60 minutes’ deposition time, also an important oxidation peak occurs from the -1,00
V to 0,15 V which reaches its maximum at -0,49 V corresponding to the 6,89x10⁻⁵ A.
cm-2 density current value.
On the cathodic region, one reduction peak is observed that occurs at -0,48 V. The
behavior of the two modified electrodes is very similar.
The reverse scan shows a reduction peaks that correspond to the oxidation peaks
occurring in the cathodic region of the cyclic-voltammogram.
The very large current at more negative potentials is to be due to the reduction of H2O
to H2.
5.1.3 Comparison between 15-min and 60-min deposition modified
electrode for SiO3-2 electrolyte
In the following image (fig. 17), the behavior of the Dropsen with no deposition, 15 min
and 60 min deposition time in the SiO3-2 electrolyte was compared.
The cylic-voltamogramm for 60-min deposition time on the electrode presented two
oxidation peaks: the first at -0,70 V and 1,40x10⁻⁵ A.cm-2 value of current density and
the second one at -0,57 V and 1,09x10⁻⁶ A. cm-2. At the anodic limit of 0,70 V a peak is
observed due to the oxidation limit of the water.

41
Figure 17. Comparison between the Dropsen electrode with 15-min and 60-min deposition time for the SiO 0,1 M
pH=12 electrolyte.
As expected, based on the previous results, the cyclic-voltamogram for the electrode of
15-min shows the oxidation peaks in a voltage range similar to the 60-min deposition,
but the density current shows lower values: 5,65x10⁻⁵ A.cm-2 and 5,23x10⁻⁵ A.cm-2 for
each oxidation peak.
At the cathodic region, different reduction peaks are observed at more negatives
potentials for 60-min compare to 15-min deposition time.
5.1.4 Comparison between 15-min and 60-min deposition modified
electrode for SiO3-2, Ca2+ electrolyte.
The last comparison was done with the different deposited electrodes, using the SiO3-2,
Ca2+ electrolyte, the cyclic-voltammograms are shown in the following image (fig. 18).
Deposition 15 min
Deposition 60 min
CV for SiO3-2
electrolyte

42
Figure 18. Comparison between the Dropsen electrode with 15-min and 60-min deposition time for the
SiO3-2 0,001M, Ca2+ 0,0001 M pH=12.
Regarding the electrode with 60-min deposition time, two oxidation peaks are observed.
The first one occurs at -0,54 V, and the second one occurs at 0,14 V. As seen in
previous cases, a peak is observed at the anodic limit of 0,7 V, where we are
approaching to the water electrolysis.
The electrode with 15-min deposition time, shows a similar cyclic-voltammogram
respect to the 60 min-deposition. Just one oxidation peak is observed at -0,60 V,
approximately.
On the cathodic region, two reduction peaks are observed for both cases, the first peak
appears at -0,50 V and the second one appears at -0,85 V.
After several tests, the electrode with 60-min deposition showed a more stable and
reproducible behavior, in consequence, this modified electrode was used to perform the
following experiments.
Deposition 15 min
Deposition 60 min
CV for SiO3-2, Ca+2
electrolyte

43
5.1.5 Comparison between each electrolyte using electrode with 60-min
deposition time
A dropsen with deposition for 60 minutes was used to record a cyclic-voltammograms
in Na+Cl- 0,1 M pH=12; SiO3-2 0,001M pH=12 and SiO3
-2 0,001M, Ca2+ 0,0001 M
pH=12 electrolytes. The behavior of the electrode for each electrolyte was compared in
fig. 16.
5.1.5.1 Cyclic-voltammogram recorded for Na+Cl- electrolyte with
electrode of 60-min deposition time.
In region 1, current density increases in almost linear tendency until region 2,
where a grand oxidation peak is observed, between -1,00 V and 0,20 V, reaching a
current density value of 6,9x10⁻⁵ A. cm-2.
On the cathodic region, a reduction peak is observed in the reverse scan at
approximately at -0,48 V.
5.1.5.2 Cyclic-voltammogram recorded for SiO32- electrolyte with
electrode of 60-min deposition time.
The cyclic-voltamogramm recorded using a SiO3-2 electrolyte is shown (fig 16). In
region 1, an increase of the current density is observed until region 2, where two
oxidation peaks are shown, the first appears at -0,71 V and the second peak appears at -
0,4 V reaching a current density value of 3,0x10⁻⁵ A.cm-2 and 1,17x10⁻⁵ A.cm-2,
respectively. On the cathodic region, one reduction peak is observed at -0,75 V.
5.1.2.3 Cyclic-voltammogram recorded for SiO32-, Ca2+ electrolyte with
electrode of 60-min deposition time.
On the anodic region, the density current increases until an oxidation peak is observed
at -0,60 V (region 2). A second oxidation peak is observed at 0,13 V (region 3) with a
density current value of 1,25x10⁻⁵ A.cm-2.
On the cathodic region, two reduction peaks are observed, the first one occurs at -0,50 V
and the second one occurs at -0,85 V, approximately.

44
Figure 19. Cyclic voltammograms recorded on Dropsed with UO2 60 minutes’ deposition for Na+Cl- 0,1 M pH=12;
SiO3-2 0,001M pH=12 and SiO3
-2 0,001M Ca2+ 0,0001 M pH=12 electrolytes.
After the comparison of the electrode with 60-min deposition for each electrolyte was
done, 6 regions were identified for the modified electrode behavior in each solution.
1.- Santos et al., (2006) recorded cyclic-voltamograms using SIMFUEL in a dissolution
of NaCl 0,1 M at different pH values, including pH=13. They found a similar region,
where the current was no significant. In their case, the potential range was wider than in
our results because they used doped uranium. The presence of this region is due to the
oxidation of non-stoichiometric UO2+x.
2.- The presence of this peak might be due to the occurrence of several oxidation
process, dissolution and/or precipitation of UVI, probably concentrated at grain
boundaries (Shoesmith, 2000). Nevertheless, more corrosion studies have to be done, to
know what is happening in this region. As we can see in fig. 19, this process appears to
be mitigated by the presence of the Si and Ca dissolutions. The Ca and Si act as agents
that might be preventing the oxidation process.
Shoesmtih et al., (1989) studied solutions with high concentrations of dissolved oxygen.
The authors showed that a film growth on UO2 in two stages. The first stage is the
relatively rapid formation of a UO2+x surface layer, and the second stage of film growth
occurs more slowly.
CV for 60 min
deposition
Na+Cl- electrolyte
SiO3- electrolyte
Ca2+ SiO3-2 electrolyte
1
2
3
4
5
6

45
It appears that the SiO3-2 dissolution provides the conditions to a more rapid oxidation
and dissolution of these two layers.
3.- At 0,10 V, the SiO3-2, Ca2+ dissolution contributes to the dissolution and
accumulation of protective corrosion products deposits (Shoesmith, 2000), such as
soluble uranyl species, UO2+2, which have limited solubility at this pH (Grenthe et al.,
1992) leading to the formation of a UVI deposit (possibly UO3·yH2O) on the electrode
surface (Santos et al. 2006), which is reinforced by the presence of the Ca and Si
dissolutions.
4.- This region where potential is over 0,3 V, a rapid dissolution might be caused by the
development of local acidity causing grain boundary etching and pitting (Shoesmith,
2000).
5.- The presence of the reduction peak might be due to the presence of impurities in our
electrode with no deposition or the dissolutions. This conclusion is done, because this
same peak is observed in the cyclic-voltammograms recorded using non-deposited
electrodes. Nevertheless, tt is necessary to perform more electrochemical studies to
know with more detail the process related to the apparition of this peak.
6.- On the reverse cathodic scan the UO3·yH2OUO2+x reduction process is observed,
at the potential range from –0,80 V to -1,20 V. (Santos et al., 2006)
At more negative potentials, the reduction limit of wàter is observed.
5.2 Pontentiostatic results
The potentiostatic experiments were performed for the deposited electrode under the
indicated conditions in section 4.3.3.
Figure 20 shows current density versus time. The highest current density was obtained
for SiO3-2 and Ca2+, SiO3
-2, an overlap of both cases can be observed. The lower current
density was obtained for Na+Cl-.
This information is corresponding with that obtained in the cyclic-voltammogram,
because as it is shown in the figure 20 for a potential of 245 mV, the lowest density
current value is observed in the Na+Cl- electrolyte and the highest density current value
are observed in SiO3-2 and Ca2+, SiO3
-2 dissolutions.

46
Figure 20. Potentiostatic current versus time curve of the UO2 deposited electrode in contact with Na+Cl- 0,1 M
pH=12; SiO3-2 0,001M pH=12 and SiO3
-2 0,001M Ca2+ 0,0001 M pH=12 electrolytes
5.3 Ecorr results
Next the Ecorr results are shown. The system evolves from the cleaning cathodic
potential applied to the electrode (-1.4V) to reach the ending state.
In the figure 21, the behavior of the corrosion potential in the presence of the Na+-Cl-
electrolyte is very unstable, in the first 5,5 hours the potential increase, but in the
following hours the potential decreased reaching a value of 0 mV. In the last 2 hours of
experimental time, the potential reached a value of 42 mV approximately, but we cannot
assure a steady state potential value. This result can be compared with the one obtained
by Shoesmith et al., (1989) where the study of UO2 in O2-saturated atmosphere in a
NaClO4 0,1 M dissolution pH=9,5 was performed; XPS analyses showed that two films
formed. The first layer of UO2,33 formed in the first 10 h of exposure, the outer layers of
this film were converted, slowly, into hydrated UO3 over the 90 h of the experiment.
Under these conditions, the Ecorr reached a steady-state value of 49 mV vs. Ag/AgCl,
which is very close to the one obtained in the experiment.
Respect to the SiO3-2 electrolyte, in the first 3 hours the potential value decrease in
almost linear tendency. In the following hours, the behavior is unstable until the
1E-08
0.0000001
0.000001
0.00001
0.0001
0.001
0.01
0.1
1
1 10 100 1000C
urr
ent
den
sity
(A
*cm
-2
Time (s)
Si+Ca
NaCl
Si
Na+Cl- Electrolyte
SiO3-2 Electrolyte
Ca2+ SiO3-2 Electrolyte

47
potential reached a steady state value of 40 mV approximately. This value is very close
to the potential value obtained in the experiment with the Na+-Cl- electrolyte. According
to Shoesmith (2007) this might be due to a deposition of UVI on the fuel surface. This
deposit works as an insulator, it would be expected to block the fuel corrosion process
occurring on the underlying conductive UO2+x layer. It appears that de Si dissolution
contribute to this process.
Finally, the SiO3-2, Ca2+ dissolution exhibits a behavior similar to the SiO3
-2 dissolution,
but the potential value at the steady state is lower compared to the SiO3-2 value, -2 mV,
as it is shown in the figure 21. This can point to the oxidation, dissolution and the
accumulation of corrosion products deposits on the electrode surface, this process might
be reinforced by the presence of the Si and Ca in the dissolutions.
Figure 21. Ecorr (V vs. Ag/AgCl) results on the modified electrode with UO2 in contact with the three different
electrolytes. Na+Cl-(blue line), SiO3-2 (green line) and SiO3
-2, Ca2+ (yellow line).
Ecorr Na+Cl-
Ecorr SiO3-2
Ecorr SiO3-2, Ca2+
48
6. Conclusions
A review of the procedure for electrodeposition of the UO2 has been used to modify a
commercial electrode (Dropsens) surface.
After the UO2 stripping, a corrosion study has been performed under oxidizing
conditions in order to verify the behavior of the electrode modified. Three different
electrolytes were used simulating the cementitious water.
Scanning electron microscopy (SEM) was used to analyze the surface of the electrodes,
these images of the modified Dropsens exhibit differences between the 15 minutes’ and
60 minutes’ deposition time. For the first case, the surface was substantially modified, it
appears to be a fractured surface with porous edges. For the second case, the electrode
surface is very porous compare to the first case.
A Raman microscopy analysis was done to the modified surface of the electrode. The
spectrum shows some peaks in the 249 (cm-1) and 750 (cm-1) Raman shift, according to
the bibliography this spectrum is similar to the Raman spectrum exhibits by the U3O8
(Elorrieta et al. 2017).
Cyclic-voltammetry measurements showed that the electrode modified using 60 minutes
of deposition time exhibits the most reproducible behavior respect to the 15 minutes’
deposition time. As a consequence, the first modified electrode was used to perform the
rest of the experiments.
Also, the cyclic-voltammograms obtained were divided into 6 regions: in the first
region, the oxidation of non-stoichiometric UO2+x is observed on the modified
electrode. In the second region, the modified Dropsens exhibits a large oxidation that
might be caused by various oxidation processes, precipitacion of UVI. This oxidation
process might be mitigated by the presence of the Si and Ca dissolutions. The third
region exhibits a surface oxidation due to the accumulation of protective corrosion
products deposits, which is reinforced by the presence of the Si and Ca dissolutions.
The fifth region might be due to the presence of impurities and the final region, where
the UO3·yH2OUO2+x reduction process is observed.

49
The potentiostatic experiments show that the highest current density was obtained for
SiO3-2 and Ca2+, SiO3
-2, and the lower current density was obtained for Na+Cl-. This
information is corroborated by the cyclic-voltammograms results.
According to the Ecorr results, the steady state potential value obtained with the Na+Cl-
was 42 mV, very close to the value found by Shoesmith et al. (1989) under oxidizing
conditions: 49 mV vs. Ag/AgCl. Respect to the SiO3-2 electrolyte, the steady state value
was 40 mV, very close to the Na+Cl- value, due to a deposition of UVI on the fuel
surface, this layer works as an inhibitor, blocking the fuel corrosion process.
The SiO3-2, Ca2+ electrolyte had a corrosion potential value at the steady state of -2 mV.
At this potential, the presence of the Si and Ca dissolutions can reinforce the formation
of protective corrosion products on the surface electrode.

50
7. Bibliographic References
• ASTUDILLO, J. (2001). El almacenamiento geológico profundo de los residuos
radiactivos de alta actividad. Principios básicos y tecnología. ENRESA, Ed. ENRESA,
Madrid. pp: 200.
• Berner, U. R. (1992). Evolution of pore water chemistry during degradation of cement
in a radioactive waste repository environment. Waste Management, 12, 201-219.
• Burns PC, Klingensmith AL (2006). Uranium mineralogy and neptunium mobility.
Elements 2, 351-356.
• Bruno, J., Ewing, R. C. (2006). Spent Nuclear Fuel. Elements (2), 343-349.
• CHALMERS, J. M., EDWARDS H. G. M., HARGREAVES M. D. (2012). Infrared
and Raman Spectroscopy in forensic science. United Kingdom. John Wiley & Sons Ltd.
• Chusuei, C. C., Goodman, D. W. (2002). X-Ray Photoelectron Spectroscopy.
Encyclopedia of Physical Science and Technology 17, 921-938.
• Consejo de Seguridad Nuclear, Gobierno de España. (2015). El combustible nuclear y
su ciclo: Almacenamiento temporal centralizado.
https://www.csn.es/es/almacenamiento-temporal-centralizado.
• De Pablo, J., Casas, I., Giménez, J., Marti, V., & Torrero, M. E. (1996). Solid surface
evolution model to predict uranium release from unirradiated UO 2 and nuclear spent
fuel dissolution under oxidizing conditions. ELSEVIER Journal of Nuclear Materials,
232, 138–145.
• EGERTON, R. F. (2005). Physical Principles of Electron Microscopy: An introduction
to TEM, SEM and AEM. Alberta, Canada. Springer Science+Business Media Inc.
pp:125-153.
• Elorrieta, J. M., Bonales, L. J., Rodríguez, N., Gutiérrez, L., Cobos, J., & Baonza, V. G.
(2017). Estudio de la oxidación de la matriz del combustible irradiado en condiciones
de almacenamiento en seco, 8, 1–8.
• Escribano, R., Sloan, J. J., Siddique, N., Sze, N., & Dudev, T. (2001). Raman
spectroscopy of carbon-containing particles, 26, 179–186.
• Fernández, R. (2011). Technical Note: Engineered barriers for radioactive waste
confinement. Materiales de Construcción, 61(303), 485-492.
• Gens, R. (2008). Formulation of the concrete for the modules, concrete containers and
the cementitious backfill. NIROND 2007-1876.

51
• GOLDSTEIN, J., NEMBURY, D., JOY, D., LYMAN, C., ECHLIN, P., LIFSHIN, E.,
SAWYER, L., MICHAEL J. R. (2003). Scanning Electron Microscopy and X-ray
Microanalysis. Springer US. pp: 1-2.
• Electrochimica Acta, 51(16), 3278–3286. http://doi.org/10.1016/j.electacta.2005.09.019
• GRENTHE, I., FUGER, J., KONINGS, R. J., LEMIRE, R. J., MULLER, A. B.,
NGUYEN-TRUNG, C. and WANNER, H. (1992). Chemical thermodynamics of
uranium. Amsterdam, Holland.
• Harfouche, M., Wieland, E., Dähn, R., Fujita. T., Tits, J., Kunz, D. and Tsukamoto, M.
(2006). EXAFS study of U(VI) uptake by calcium silicate hydrates. Journal of colloid
and interface science, 303(1), 195-204.
• IAEA. (2006). Storage and Disposal of Spent Fuel and High Level Radioactive Waste.
Nuclear Energy, (February), 1–11. Retrieved from
https://www.iaea.org/About/Policy/GC/GC50/GC50InfDocuments/English/gc50inf-3-
att5_en.pdf
• IAEA. (2009). Costing of Spent Nuclear Fuel Storage. Nuclear Energy Series, (NF-T-
3.5).
• Jensen, R. T. (1983). Inventories and characteristics of transuranic waste. Nucl. Chem.
Waste management, 4(1), 19.
• Jonhson, L.H., Leneveu, King, F., D. M., Shoesmith, D. W., Kolar, M., Oscarson D. W.,
Sunder, S., Onofrei, C. and Crosthwaite, J.L. (1996). The disposal of Canada’s nuclear
fuel waste: A study of post closure safety of in-room emplacement of used CANDU
fuel in cooper containers in permeable plutonic rock volume 2: Vault model. Atomic
Energy of Canada Limited Report, AECL-11494-2, COG-95-552-2.
• Jonhson, L. H., Werme, L. O. (1994). Materials characteristics and dissolution behavior
of spent nuclear fuel. MRS Bulletin. pp: 24-27.
• JOVANI-ABRIL, R. (2014). Synthesis and characterization of nanocrystalline UO2
ceramics. Universidad de Santiago de Compostela (USC), Spain.
• Keith, S. K., Faroon, O., Roney, N. R., Scinicariello, F., Wilbur, S., Ingerman, L.,
Diamond, G. (2013). Toxicological Profile for Uranium. Toxicological Profiles,
(February), 1–526. http://doi.org/http://dx.doi.org/10.1155/2013/286524
• Kissinger, K., Heineman, W. (1983). Cyclic Voltammetry. Journal of chemical
education. 60(9), 702-706.

52
• Nagra, Project Opalinus Clay-Safety Report, Nagra Technical Report NTB 02-05,
Wettingen, Switzerland, 2002.
• PÉREZ, N. (2004). Electrochemistry and Corrosion Science. Boston, USA. Kluwer
Academic Publishers. pp: 1-6.
• RONCHI, C.; LOSILEVSKI, I.; YAKUB, E. (2011). Equation of State of Uranium
Dioxide: Data Collection. Berlin, Germany. Springer Science & Business Media. pp: 1-
2.
• Rojo, I., Rovira, M., De Pablo, J. (2014). Selenate Diffusion Trough Mortar and
Concrete. Environmental Engineering Science, 31(8), 469-473.
• SALING, J. H., FENTIMAN, A. W., TANG, Y. S. (2001). Radioactive waste
management Second Edition. Michigan, United States. Taylor & Francis.
• Santos, B. G., Noël, J. J., & Shoesmith, D. W. (2006). The effect of pH on the anodic
dissolution of SIMFUEL (UO2). Journal of Electroanalytical Chemistry, 586(1), 1–11.
http://doi.org/10.1016/j.jelechem.2005.09.021.
• Santos, B. G., Noël, J. J., Shoesmith, D. W. (2006b). The influence of silicate on the
development of acidity in corrosion product deposits on SIMFUEL (UO2). Corrosion
Science, 48, 3856-3868.
• Santos, B. G., Noël, J. J., Shoesmith, D. W. (2006c). The influence of calcium ions on
the development of acidity in corrosion product deposits on SIMFUEL (UO2). Journal
of Nuclear Materials, 350, 320-331.
• Swapp, S. (2017). Scanning Electron Microscopy (SEM). University of Wyoming,
United States. Recovered from:
http://serc.carleton.edu/research_education/geochemsheets/techniques/SEM.html.
• SETTLE, F. A. (1997). Handbook of instrumental techniques for analytical chemistry.
New Jersey. Prentice, Inc.
• Shoesmith, D. W. Sunder, S., Bailey, M. G., Wallace, G. J. (1989). The Corrosion of
nuclear fuel (UO2) in oxygenated solutions. Corrosion Science, 29(9), 1115–1128.
• SHOESMITH, D. W. (2007). Used fuel and uranium dioxide dissolution studies-
Review. Nuclear-Waste Management Organization. The University of Western Ontario.
Ontario, Canada.
• Shoesmith, D. W., & Sunder, S. (1991). Electrochemistry-based model for the
dissolution of UO2. Atomic Energy of Canada Limited, AECL (Report), (10488), 1–97.

53
• Shoesmith, D. W. (2000). Fuel corrosion processes under waste disposal conditions.
Journal of Nuclear Materials, 282(1), 1–31. http://doi.org/10.1016/S0022-
3115(00)00392-5.
• SKOOG, D. A., HOLLER, F. J., CROUCH, S. R. (2007). Principles of instrumental
analysis. Thomson Brooks/Cole.
• Sunder, S., Shoesmith, D. W., Lemire, R. J., Bailey, M. G., Wallace, G. J. (1991). The
effect of pH on the corrosion of nuclear fuel (UO2) in oxygenated solutions. Corrosion
Science, 32(4), 376-386.
• UK National Physical Laboratory. (2012). X-ray photoelectron spectroscopy: Surface
and nanoanalysis basics. Recovered from: http://www.npl.co.uk/science-
technology/surface-and-nanoanalysis/surface-and-nanoanalysis-basics/introduction-to-
xps-x-ray-photoelectron-spectroscopy.
• Wang, Y., Alsmeyer, D. C., & Mccreery, R. L. (1990). Raman spectroscopy of carbon
materials: Structural basis of observed spectra. Carbon, (10), 557–563.
• Watts, J. F. (1994). X-ray photoelectron spectroscopy. Vacuum 45(6), 653-671.
• WILLARD, H. H., MERITT Jr L. L., DEAN J. J., SETTLE Jr. F. A. (1988).
Instrumental methods of analysis. 7th ed. New Delhi, India. CBS Publisher &
Distributors.

54
8. Annexes
Annexe 8.1 Procedures used to perform the electrochemical studies.
Figure 22. Electrodeposition procedure using NOVA software 2.1 coupled with the Metrohm Autolab Potentiostat-
Galvanostat M204.
Figure 23. Cyclic-voltammogram procedure using NOVA software 2.1 coupled with the Metrohm Autolab
Potentiostat-Galvanostat M204.

55
Figure 24. OCP procedure using NOVA software 2.1 coupled with the Metrohm Autolab Potentiostat-Galvanostat
M204.
Figure 25. Potentiostatic experiment procedure using NOVA software 2.1 coupled with the Metrohm Autolab
Potentiostat-Galvanostat M204.