Embed Size (px)
Citation preview
¦ÉÉ®úiÉ ¨Éå xÉÉÊ®úªÉ±É EòÉ =i{ÉÉnùxÉ B´ÉÆ Ê´É{ÉhÉxÉ
KALPAVRIKSHA
TREE OF HEAVEN TREE OF ABUNDANCE
TREE OF LIFE KING OF PALMS
NATURES SUPER MARKET GODS GIFT TO MANKIND
¦ÉÉ®úiÉ ºÉ®úEòÉ®ú GOVERNMENT OF INDIA EÞòÊ¹É ¨ÉÆjÉÉ±ÉªÉ MINISTRY OF AGRICULTURE
EÞòÊ¹É +Éè®ú ºÉ½þEòÉÊ®úiÉÉ Ê´É¦ÉÉMÉ DEPARTMENT OF AGRICULTURE AND COOPERATION Ê´É{ÉhÉxÉ B´ÉÆ ÊxÉ®úÒIÉhÉ ÊxÉnäù¶ÉÉ±ÉªÉ DIRECTORATE OF MARKETING AND INSPECTION
(Ê´É{ÉÊhÉ +xÉÖºÉÆvÉÉxÉ B´ÉÆ ÊxɪÉÉäVÉxÉ EòIÉ)ù (MARKET RESEARCH AND PLANNNG CELL) |ÉvÉÉxÉ ¶ÉÉJÉÉ EòɪÉÉÇ±ÉªÉ BRANCH HEAD OFFICE xÉÉMÉ{ÉÖ®ú NAGPUR
2008

“Coconut is the king of vegetables with its sap,
Fruits, leaves, stem, root and all parts to feed, appease,
Shelter, cure and carry mankind” Joes Maria de Silva (LISBON)

PREFACE
The Directorate of Marketing and Inspection made reverend effort by publishing first report on Marketing of Coconut and Coconut Products in India, in the year 1943, to ascertain the role of coconut and its products, played in the agricultural economy of the country. Since then the production and marketing of coconut in India witnessed a significant development with regard to domestic production, consumption and industrial utilization of coconut and coconut products. Subsequently, the first report was revised and updated in the year 1962 to make appraisal of changes that had occurred in the plantation crop pattern, development of coconut trade and industries in the country. Subsequently, abundant research and development activities taken up by the Government and non-governmental agencies have not only resulted in increased production and productivity of coconut, but also made the beginning of development and diversification of coconut products and by-products for better marketability of coconut. The coconut is a benevolent tree, a nature’s gift to mankind, as it is a source of food, beverage, oilseed, fibres, timber, health products and also associated with mystery and omen in the life of people. The coconut tree provides clothing utensils and dwellings, therefore, is an important source of earning livelihood to the people of coconut growing states, especially in the coastal areas. The coconut tree therefore, is eulogized, reverently as “Kalpavruksha” or tree of life by the people. The coconut crop is grown in 12.5 million hectares of land which constituted about 0.7 per cent of net crop area of the world. The crop is grown in the coastal lowlands of continental South Asia and spread along the Indian and Pacific Ocean, the cultivation is mostly done by small and marginal farmers. According to FAO statistics 2007, about 57.9 billion nuts were produced, which was equivalent to 7.3 metric tonnes of oil. The coconut oil ranks sixth among the eight major vegetable oils of the world. India contributes about 15.46 per cent in area and 21 per cent in terms of production of coconut in the world. The coconut crop is grown in eighteen States and three Union Territories covering an area of 1.935 million hectares of land, with a production of 12,833 million nuts in the country. The major coconut crop acreage is concentrated on the West Coast region of the country comprising the states of Kerala, Karnataka and Maharashtra, followed by East Coast of Tamil Nadu, Andhra Pradesh, Orissa and Pondicherry. The coconut cultivation areas also traditionally located in the coastal region of Gujarat, Goa, West Bengal, Islands of Andaman & Nicobar and Lakshadweep. About 90 per cent of the area of coconut cultivation and equally the same per cent of production of coconut are from the four Southern states, viz. Kerala, Karnataka, Tamil Nadu and Andhra Pradesh. Kerala is considered as the land of coconut and holds the key for the development of coconut production and marketing in the country. In the present scenario the trend in processing of coconut products is slowly setting in the country, but the domestic market is not ready to lift the coconut in product form. Moreover, the coconut processing industries have to compete with the international market players in the world

market. Consequent to the globalization of Indian economy, the domestic coconut market economy has also been pushed towards a situation of competition, where coconut oil had to compete with the other low price vegetable oil and fats in the international market. In spite of the changes in international and domestic market, the price of coconut oil has been steadily increasing since 2002, and reached to record level of Rs.7224 per quintal at Kochi market, the price of milling copra in Alleppy market was also recorded at the premium price of Rs.4893 per quintals and the price of ball copra was at Rs.7500 per quintal in Tiptur market in the month of December, 2004. This favourable market behavior appeared to have been due to culmination of concerted efforts of the implementing agencies, developmental policy of the Government to provide minimum support price to copra and coconut oil and the future trade. Since, the production and marketing scenario of coconut in the country has witnessed a phenomenal development, particularly in the field of production such as development of improved high yielding dwarf varieties of crossbred coconut palm, traditional, non-traditional, commercial and industrial coconut product, it was decided to study the current status of developments that have taken place on production and marketing front of coconut and its products in the country. Therefore, a fresh survey on production and marketing of coconut and coconut product in India was undertaken. This report attempt to study the present scenario of coconut industry and the problems faced by the producers and traders involved in the marketing process of coconut and to focus on the inadequacies prevailing in the marketing system of coconut and coconut product in the country. The finding of the study may benefit producers, traders, consumers and other developmental agencies involved in formulating better strategy for development and transformation into a meaningful and rational marketing system for coconut and coconut product in the country. The completion of the report has been possible due to whole hearted cooperation of the field officers of the Directorate, Coconut Development Board, Kochi, State Governments and Private agencies engaged in production of marketing of coconut and coconut products. The field survey and drafting of the report was carried out by Dr.R.V.Kothe, Senior Marketing Officer and Dr.R.R.Karpate, Marketing Officer under the guidance of Late Shri H.P.Singh, the then Jt.Agricultural Marketing Adviser and the report was finally completed under the guidance and supervision of Shri Har Prasad & Dr J. Shanmugam, Jt. Agricultural Marketing Adviser, Branch Head Office, Nagpur The Government of India should not be regarded as assuming responsibility for any of the statements contained in this report. Faridabad Sd/-
Agricultural Marketing Adviser Dated : 02nd February 2009 to the Government of India

PRODUCTION AND MARKETING OF COCONUT IN INDIA
CONTENTS
PAGE NO.
1. INTRODUCTION 1 - 3
2. WORLD COCONUT SCENARIO 4 - 8
3. COCONUT SCENARIO IN INDIAN PERSPECTIVE: 9 - 36 SUPPLY AND DEMAND
4. COCONUT SITUATION IN TRADITIONAL AND 37 - 55
NON –TRADITIONAL COCONUT PRODUCING STATES AND UNION TERRITORIES
5. MARKETING PRACTICES 56 - 76
6. PRICES 77 - 101
7. COCONUT PRODUCT / BY PRODUCT: UTILIZATION 102 - 111
AND DIVERSIFICATION
8. STATUS OF FURTHER PROCESSED, VALUE ADDED 112 - 113 COCONUT PRODUCTS
9. SUMMARY AND CONCLUSION 114 - 119
10. RECOMMENDATION S 120 - 122
ANNEXURES
TABLES
PLATES
FIGURES
REFERENCES

LIST OF ANNEXURES
Annexure – I – WORLD AREA, PRODUCTION AND PRODUCTIVITY OF COCONUT
(FAO 2004)
Annexure – II – AREA, PRODUCTION AND PRODUCTIVITY OF COCONUT IN APCC
COUNTRIES
Annexure – III A, B, C – AREA, PRODUCTION AND PRODUCTIVITY OF COCONUT IN INDIA
(GROWTH RATE)
Annexure – IV A, B – STATE-WISE AREA AND PRODUCTION OF COCONUT IN INDIA
Annexure – V – ARRIVALS OF TENDER AND MATURED COCONUT IN DELHI
MARKET
Annexure – VI A – COCONUT GRADING AND MARKING RULES
Annexure – VI B – VEGETABLE OILS GRADING AND MARKING RULES
Annexure – VI C – VEGETABLE OIL CAKES (EXPRESSED OR SOLVENT EXTRACTED)
GRADING AND MARKING RULES
Annexure – VII A & B – SCENARIO OF COCONUT MARKETING IN INDIA
Annexure – VIII – MONTHLY AVERAGE PRICE OF COCONUT AT ARSIKERE MARKET
Annexure – IX – MONTHLY AVERAGE PRICE OF COCONUT AT KOZHIKODE MARKET
Annexure – X – MONTHLY AVERAGE PRICES OF COCONUT AT KANGAYAM
MARKET
Annexure – XI – MONTHLY AVERAGE PRICES OF COCONUT AT ALAPPUZHA
MARKET
Annexure – XII – MONTHLY AVERAGE PRICES OF COCONUT AT KOCHI MARKET
Annexure – XIII – MONTHLY WHOLESALE PRICE INDEX
Annexure – XIV – MONTHLY AVERAGE WHOLESALE PRICES OF UN-HUSKED
COCONUT IN INDIA
Annexure – XV – MONTHLY AVERAGE WHOLESALE PRICES OF SEMI-HUSKED
COCONUT IN INDIA
Annexure – XVI – MONTHLY AVERAGE WHOLESALE PRICES OF HUSKED COCONUT IN
INDIA
Annexure – XVII – MONTHLY WHOLESALE PRICES OF HUSKED AND UN HUSKED IN
SELECTED MARKETS
Annexure – XVIII – MONTHLY AVERAGE PRICE OF COCONUT (WITH HUSK) AT
THIRUVANANTHAPURAM MARKET
Appendix – XIX – MONTHLY AVERAGE PRICE OF COCONUT (WITH HUSK) AT QUILON
MARKET
(i)
Appendix – XX – MONTHLY AVERAGE PRICE OF COCONUT (WITH OUT HUSK) AT
ALAPPUZHA MARKET
Annexure – XXI – AVERAGE MONTHLY WHOLESALE PRICES OF DRY AND TENDER
COCONUT IN SELECTED MARKETS DURING THE YEAR 2002-03
Annexure – XXII – SEASONAL INDICES OF COCONUT PRICES AT SELECTED CENTERS
(QUINQUENNIAL AVERAGE)
Annexure – XXIII – MONTHLY AVERAGE PRICE OF COCONUT AT ARSIKKARE MARKET
Annexure – XXIV – MONTHLY AVERAGE PRICE OF COCONUT AT KOZHIKODE MARKET
Annexure – XXV – MONTHLY AVERAGE PRICES OF COCONUT AT KANGAYAM
MARKET
Annexure – XXVI – AVERAGE MONTHLY WHOLESALE AND RETAIL PRICES OF TENDER
COCONUT IN SELECTED MARKETS DURING 2002-03
Annexure – XXVII – YEARLY WHOLESALE PRICE INDEX OF COCONUT, COCONUT OIL
AND COPRA
Annexure – XXVIII – MONTHLY AVERAGE PRICE OF COPRA IN INTERNATIONAL MARKET
Annexure – XXIX – DOMESTIC PRICES OF COPRA IN JAVA- INDONESIA
Annexure – XXX – DOMESTIC PRICES OF COCONUT OIL IN PHILIPPINES
Annexure – XXXI – DOMESTIC PRICES OF COPRA IN SRILANKA
Annexure – XXXII – DOMESTIC PRICES OF COPRA IN INDIA
Annexure – XXXIII – MONTHLY AVERAGE PRICE OF MILLING COPRA AT KOZHIKODE
MARKET FOR THE LAST TEN YEARS
Annexure – XXXIV – MONTHLY AVERAGE PRICE OF MILLING COPRA AT KOCHI MARKET
Annexure – XXXV – MONTHLY AVERAGE PRICE OF MILLING COPRA AT ALLEPPEY
MARKET
Annexure – XXXVI – MONTHLY AVERAGE PRICE OF MILLING COPRA AT KANGHYAM
MARKET
Annexure – XXXVII – MONTHLY AVERAGE PRICE OF MILLING COPRA AT MANGLORE
MARKET
Annexure – XXXVIII – MONTHLY AVERAGE PRICE OF MILLING COPRA AT ALAPUZHA
MARKET
Annexure – XXXIX – MONTHLY AVERAGE PRICE OF BALL COPRA AT KOZHIKODE
MARKET
Annexure – XL – MONTHLY AVERAGE PRICE OF BALL COPRA AT TIPTUR MARKET
Annexure – XLI – MONTHLY AVERAGE PRICE OF BALL COPRA AT ARISEKERE
MARKET
(ii)

Annexure – XLII – MONTHLY AVERAGE PRICE OF EDIBLE GRADE COPRA (DILPASS
GRADE) AT KOZHIKODE MARKET
Annexure – XLIII – MONTHLY AVERAGE PRICE OF EDIBLE GRADE COPRA (RAJPUR
GRADE) AT KOZHIKODE MARKET
Annexure – XLIV – SEASONAL INDICES OF COPRA PRICES AT KOZHIKODE, KOCHI,
ALLEPPEY, KANGHYAM, MANGLORE AND ALAPUZHA MARKETS
(QUINQUENNIAL AVERAGE)
Annexure – XLV – MONTHLY WHOLESALE PRICE INDEX OF COPRA
Annexure – XLVI – INTERNATIONAL VEGETABLE OIL PRICES
Annexure – XLVII – INTERNATIONAL PRICE OF COCONUT OIL
Annexure –XLVIII – INTERNATIONAL PRICE OF SELECTED VEGETABLE OILS
Annexure –XLIX – DOMESTIC PRICES OF COCONUT OIL IN INDIA
Annexure – L – MONTHLY AVERAGE PRICE OF COCONUT OIL AT KOCHI MARKET
Annexure – LI – MONTHLY AVERAGE PRICE OF COCONUT OIL AT ALEPPEY MARKET
Annexure- LII – MONTHLY AVERAGE PRICE OF COCONUT OIL AT KOZHIKODE
MARKET
Annexure- LIII – MONTHLY AVERAGE PRICE OF COCONUT OIL AT KANGAYAM
MARKET
Annexure- LIV – MONTHLY WHOLESALE PRICE INDEX OF COCONUT OIL
Annexure – LV – YEARLY WHOLESALE PRICE INDEX OF COCONUT OIL
Annexure – LVI – SEASONAL INDICES OF COCONUT OIL PRICES AT SELECTED
CENTRES
Annexure- LVII – SEASONAL VARIATIONS OF COCONUT OIL PRICES
Annexure – LVIII – INTERNATIONAL: MONTHLY PRICES OF COPRA MEAL
Annexure – LIX – AVERAGE MONTHLY WHOLESALE PRICE OF COCONUT OIL CAKE
Annexure – LX – MONTHLY AVERAGE PRICE OF COCONUT OIL CAKE AT KOCHI
MARKET
Annexure – LXI – MONTHLY AVERAGE PRICE OF COCONUT OIL CAKE AT ALAPPUZHA
MARKET
Annexure – LXII – MONTHLY AVERAGE PRICE OF COCONUT OIL CAKE AT KOZHIKODE
MARKET
Annexure – LXIII – SEASONAL INDICES OF COCONUT OIL CAKE PRICES AT SELECTED
CENTRES
Annexure – LXIV – AVERAGE PRICE SPREAD OF COCONUT TRADING IN ORISSA
Annexure – LXV – COCONUT YIELD FOR ANNUM IN INDIA
Annexure – LXVI – STATE LEVEL INFORMATION (CULTIVATION)
(iii)

Annexure – LXVII – DIFFERENCE BETWEEN ANNUAL AVERAGE WHOLESALE PRICES
AND MINIMUM SUPPORT PRICES OF MILLING COPRA AND BALL
COPRA
Annexure – LXVIII – BALANCE OF PAYMENT IN INDIAN EXPORT AND IMPORT OF
COCONUT PRODUCTS
Annexure – LXIX – NUTRITION CONTENT OF TENDER COCONUT
(iv)

LIST OF TABLES
1. AREA, PRODUCTION AND YIELD OF COCONUT IN MAJOR COCONUT GROWING COUNTRIES IN THE
WORLD.
2. WORLD SCENARIO : AREA, PRODUCTION AND PRODUCTIVITY OF COCONUT
3. WORLD : PRODUCTION OF COPRA AND COCONUT OIL
4. STATE-WISE AREA, PRODUCTION AND PRODUCTIVITY OF COCONUT IN INDIA.
5. AREA UNDER COCONUT CULTIVATION IN INDIA
6. COCONUT PRODUCTION IN INDIA
7. SALIENT FEATURES OF RELEASED INDIAN COCONUT HYBRIDS.
8. HIGH DENSITY MULTISPECIES CROPPING SYSTEMS UNDER EVALUATION AT COORDINATION
CENTERS.
9. QUANTITY OF COCONUTS RETAINED BY PRODUCERS
10. ESTIMATED MARKETABLE SURPLUS OF COCONUT.
11. EXPORT OF COCONUT PRODUCTS FROM INDIA.
12. NET AVAILABLE SUPPLY.
13. ESTIMATED UTILIZATION OF AVAILABLE SUPPLY OF COCONUT IN INDIA.
14. FUTURE PRICE V/S. ACTUAL PRICE V/S DELIVERED PRICE OF COCONUT OIL AT KOCHI MARKET.
15. TOTAL VOLUME OF COCONUT OIL TRADED AND DELIVERED UNDER FUTURES TRADING.
16. AVERAGE WHOLESALE PRICES OF COCONUT AT ARISEAKARE, KOZHIKODE AND KANGAYAN
MARKETS
17. INTERNATIONAL PRICE OF SELECTED VEGETABLE OILS
18. MARKETING COST, MARGINS AND PRICE SPREAD OF COCONUT IN REGULATED AND
UNREGULATED MARKETING CHANNELS.
19. MARGINS AND COSTS OF VARIOUS INTERMEDIARIES FOR COCONUT MARKETING IN CENTRAL
KERALA.

LIST OF PLATES 1. COCONUT TREE.
2. COCONUT FRUIT.
3. COCONUT GROWING COUNTRIES IN THE WORLD.
4. COCONUT GROWING STATES IN INDIA.
5. CHOWGHAT ORANGE DWARF
6. MALAYAN YELLOW DWARF
7. DXT HYBRID.
8. TXD HYBRID.
9. MULTISTORIED CROPPING SYSTEM.
10. HIGH DENSITY MULTISPECIES CROPPING SYSTEM.
11. COCONUT HARVESTING.
12. TENDER COCONUT SALE.
13. TENDER COCONUT SALE.
14. TENDER COCONUT SALE.
15. TENDER COCONUT SALE.
16. BOTTLED TENDER COCONUT WATER.
17. PARTIALLY DEHUSKED TENDER COCONUT
18. PACKED TENDER COCONUT WATER.
19. SNOW BALL TENDER COCONUT.
20. EGG COCONUT.
21. COCONUT VINEGAR.
22. NATA-DE-COCO.
23. VIRGIN COCONUT OIL.

LIST OF FIGURES
1. WORLD SCENARIO IN AREA, PRODUCTION AND PRODUCTIVITY OF COCONUT.
2. TRIENNIUM AVERAGE OF AREA, PRODUCTION AND PRODUCTIVITY OF COCONUT IN INDIA.
3. AREA UNDER COCONUT CULTIVATION IN INDIA.
4. PRODUCTION OF COCONUT IN INDIA.
5. YEARLY WHOLESALE PRICE INDEX OF COCONUT
6. AVERAGE ANNUAL WHOLESALE PRICES OF COCONUT IN PRINCIPAL MARKETS OF INDIA.
7. AVERAGE ANNUAL WHOLESALE PRICES OF COCONUT IN SELECTED STATES IN INDIA.
8. MONTHLY WHOLESALE PRICES OF UNHUSKED AND HUSKED COCONUT IN SELECTED MARKETS
IN INDIA.
9. AVERAGE MONTHLY WHOLESALE PRICES OF DRY AND TENDER COCONUT IN SELECTED
MARKETS.
10. SEASONAL INDICES OF COCONUT PRICES AT SELECTED CENTRES IN INDIA.
11. SEASONAL VARIATION OF PRICES OF COCONUT IN SELECTED MARKETS IN INDIA.
12. AVERAGE MONTHLY WHOLESALE AND RETAIL PRICES OF TENDER COCONUT IN SELECTED
MARKETS.
13. YEARLY WHOLESALE PRICE INDEX OF COCONUT OIL, COPRA AND COCONUT
14. MONTHLY AVERAGE PRICES OF COPRA IN INTERNATIONAL MARKET.
15. YEARLY AVERAGE PRICES OF COPRA IN VARIOUS WORLD MARKETS.
16. YEARLY AVERAGE PRICES OF MILLING COPRA IN SELECTED MARKETS.
17. YEARLY AVERAGE PRICES OF BALL COPRA IN SELECTED MARKETS.
18. YEARLY AVERAGE PRICES OF DIFFERENT VARIETIES OF COPRA AT KOZHIKODE.
19. SEASONAL INDICES OF COPRA PRICES AT VARIOUS MARKETS.
20. COMPARISON OF PRICES OF COCONUT OIL WITH OTHER VEGETABLE OIL.
21. INTERNATIONAL PRICE OF COCONUT OIL.
22. QUINQUENNIAL AVERAGE PRICE OF SELECTED VEGETABLE OIL.
23. AVERAGE ANNUAL PRICE OF COCONUT OIL IN INDIA AND INTERNATIONAL MARKETS.
24. WHOLESALE PRICE INDICES OF COCONUT OIL
25. AVERAGE ANNUAL PRICE OF COCONUT OIL AT KOCHI, ALLEPPY, KOZHIKODE AND KANGAYAM
MARKETS.
26. SEASONAL INDICES OF COCONUT OIL PRICES.
27. INTERNATIONAL YEARLY PRICES OF COCONUT OIL CAKE.
28. AVERAGE YEARLY WHOLESALE PRICE OF COCONUT OIL CAKE.
29. YEARLY AVERAGE PRICE OF COCONUT OIL CAKE AT DIFFERENT MARKETS OF INDIA.
30. SEASONAL INDICES OF COCONUT OIL CAKE.

Production and Marketing of Coconut in India
Page 1 of 122
INTRODUCTION
1.1 Historically, in the medieval period the coconut was known as Nux indica, the Indian nut, during the same period it was also referred as Nargil tree, “the tree of life”. Plate – 1 Western literature mentioned the Malayalam name
“Tenga” for the coconut palm which related to Tamil ‘Tennai’ and believed to have been introduced from Shri Lanka. Its geographical dispersion around the world was aided by waves of sea, travelers migrating and trading between homeland countries and even to more distant islands, from Asia to American coasts. Botanically, the coconut palm is a monocotyledon and belongs to the order Arecaceae, family Palmae and the specie is known as Cocus nucifera Linn. 1.2 Since ancient times, coconuts are ceremonially associated with worship of Gods and Goddess in Hindu religion. Its antiquity in Indian mythology is well established from its mention in Kishkinda kand and
Coconut Tree Aranya kand in Valmiki Ramayana. References also have been mentioned on coconut in Raghuvansha of Kalidasa and Sangama literature. Coconut, in its natural form, decorated with gold or silver formed a part of offerings on many religious occasions and social gatherings. The coconut is a benevolent crop and a perfect gift to mankind. It has during the span of history represented not only the source of food, beverage, oil seed, fibers, timber and health products but also associated with magic, mystery, medicine and omen in the life of people. The coconut palm tree provides clothing, utensils and dwellings and therefore, remains an important source of earning livelihood to the inhabitants of the coconut producing states in costal areas. The inhabitants therefore, affectionately eulogized the coconut plant with reverence as “Kalpavriksha”, because of its manifold virtues. Even today the omen and mystery of coconut symbolism appears in day to day life of people and therefore this nature’s most precious gift continue to be explored, scientifically, economically and artistically in the world traditions to adorn coconut. 1.3 Among the oilseed palm trees, coconut palm hardly needs any emphasis on its multi-utility significance. The economic importance of this tree crop is evident from the fact that it is grown in more than 90 countries across the world in an area of 14.231 million hectares producing about 57.514 billion nuts or 10.52 million tonnes of copra.
Production and Marketing of Coconut in India
Page 2 of 122
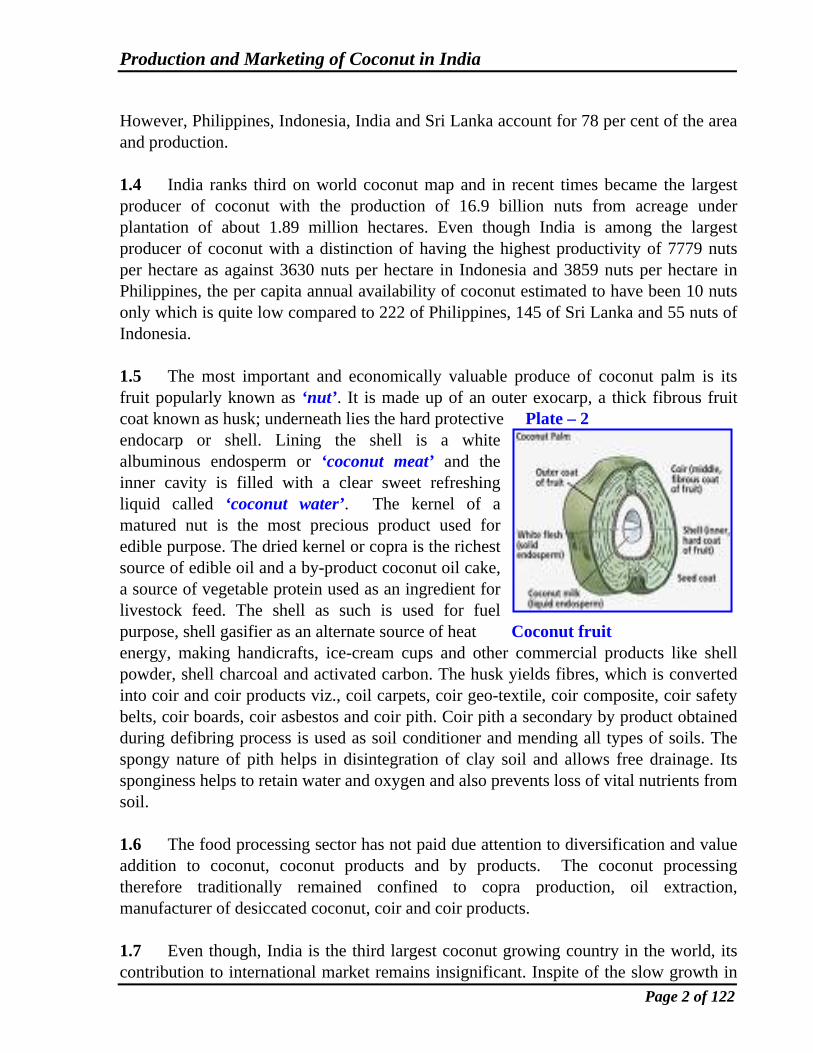
However, Philippines, Indonesia, India and Sri Lanka account for 78 per cent of the area and production. 1.4 India ranks third on world coconut map and in recent times became the largest producer of coconut with the production of 16.9 billion nuts from acreage under plantation of about 1.89 million hectares. Even though India is among the largest producer of coconut with a distinction of having the highest productivity of 7779 nuts per hectare as against 3630 nuts per hectare in Indonesia and 3859 nuts per hectare in Philippines, the per capita annual availability of coconut estimated to have been 10 nuts only which is quite low compared to 222 of Philippines, 145 of Sri Lanka and 55 nuts of Indonesia. 1.5 The most important and economically valuable produce of coconut palm is its fruit popularly known as ‘nut’. It is made up of an outer exocarp, a thick fibrous fruit coat known as husk; underneath lies the hard protective Plate – 2 endocarp or shell. Lining the shell is a white albuminous endosperm or ‘coconut meat’ and the inner cavity is filled with a clear sweet refreshing liquid called ‘coconut water’. The kernel of a matured nut is the most precious product used for edible purpose. The dried kernel or copra is the richest source of edible oil and a by-product coconut oil cake, a source of vegetable protein used as an ingredient for livestock feed. The shell as such is used for fuel purpose, shell gasifier as an alternate source of heat Coconut fruit energy, making handicrafts, ice-cream cups and other commercial products like shell powder, shell charcoal and activated carbon. The husk yields fibres, which is converted into coir and coir products viz., coil carpets, coir geo-textile, coir composite, coir safety belts, coir boards, coir asbestos and coir pith. Coir pith a secondary by product obtained during defibring process is used as soil conditioner and mending all types of soils. The spongy nature of pith helps in disintegration of clay soil and allows free drainage. Its sponginess helps to retain water and oxygen and also prevents loss of vital nutrients from soil.
1.6 The food processing sector has not paid due attention to diversification and value addition to coconut, coconut products and by products. The coconut processing therefore traditionally remained confined to copra production, oil extraction, manufacturer of desiccated coconut, coir and coir products.
1.7 Even though, India is the third largest coconut growing country in the world, its contribution to international market remains insignificant. Inspite of the slow growth in

Production and Marketing of Coconut in India
Page 3 of 122
coconut industry, all round efforts made for integrated development of coconut sector in the areas of production, processing and marketing after establishment of a statutory body, the Coconut Development Board, by the Government of India in the year 1981, are appreciable. During past two decades the coconut plantation crop has received ample research and development attention in the country and the result of these consorted efforts are well exhibited in terms of increased in area, production and productivity of coconut in the country. In view of the changed scenario in the coconut sector, it was felt necessary to revise the report on production and marketing of coconut and make fresh appraisal of the changing pattern of coconut production, trade and its ancillary industries. The present study was taken up as per the decision taken at the instance of the Steering Committee to monitor the progress of implementation of projects sanctioned under the Central Sector Scheme for Technology Mission for Coconut Development.

Production and Marketing of Coconut in India
Page 4 of 122
WORLD COCONUT SCENARIO
2.1 The coconut, having originated in South East Asia including Australasia appears to have dispersed eastwards towards the pacific and further in to America, towards the West, it moved to India and Madagascar over the calm tropical waters. Although, it was often considered as an ocean dispersed nut due to its sustenance viability in sea water for over 100 days, sea traveler were also responsible for worldwide introduction and propagation of Coconut plantation. This is significant from the fact that Spaniards introduced it into West Indies and Southern shores of the Caribbean sea, the Portuguese introduced it to Bahia and other parts of Brazil, Polynesians Sea-Farers further spread it to different Islands of pacific, the Arabs disseminated it on the African coasts and maritime Tamils together with the Mariners of the Bengal coast distributed it into the lands of the Indian Ocean. Plate – 3
Coconut Growing Countries in the World
2.2 The most eminent countries exploring coconut palms for commercial production are located in Asia, Oceania, West Indies, Central and South America, East and West Africa. According to FAO-2004 citation on coconut data (Annexure –I), the coconut crop is grown in about 90 countries across the World in an area of 14.231 million hectares producing 57.514 billion nuts or 10.52 million tons of copra. Out of World’s total area under coconut, 16 major coconut producing countries accounted for 93.75 per cent (Table-1). Among the Asian and Pacific Coconut Community (APCC), mainly six

Production and Marketing of Coconut in India
Page 5 of 122
countries i.e. Philippines, Indonesia, India, Sri Lanka, Thailand and Malaysia together accounted for 80.65 per cent of the total area under coconut cultivation and about 82 per cent of world production.
Table No.1
Area, Production and Yield of Coconut in Major Coconut growing Countries in the World
(Quinquennial Average, Year 1999 - 2003)
Sl. No.
Country Area (in 000
hectares)
PercentageShare
Production (M.T.)
Percentage Share
Productivity or Yield (kg./Ha.)
1. Philippines 3321812 30.65 13145372 25.48 4018 2. Indonesia 2648844 24.44 15394400 29.84 5806 3. India 1809620 16.70 9392200 18.20 5151 4. Shri lanka 443642 4.09 2054872 3.98 4632 5. Thailand 328184 3.03 1402901 2.72 4275 6. Papua New
Guinea 222000 2.05 779000 1.51 3455
7. Malaysia 188000 1.73 731520 1.42 3894 8. Vietnam 151300 1.40 943280 1.83 6254 9. Vanuatu 73600 0.68 224200 0.43 2049 10. Fiji Island 53888 0.48 170240 0.33 3159 11. Brazil 267256 2.47 2323833 4.50 8668 12. Ghana 54600 0.50 313120 0.60 5735 13. Jamaica 51000 0.47 170000 0.33 3333 14. Mexico 161642 1.50 1051800 2.04 6506 15. Mozambique 76200 0.70 298800 0.58 3900 16. Tanzania 310000 2.86 366000 0.71 1181 17. Others 675348 6.25 2833560 5.50 4196
WORLD TOTAL
10836916 100.00 51595098 100.00 4761
Source : F.A.O. Coconut Statistics 2004.

Production and Marketing of Coconut in India
Page 6 of 122
World Sceniario in Area, Production and Productivity of Coconut (1961-2000)
-20-15-10
-505
1015202530
1961-1965
1966-1970
1971-1975
1976-1980
1981-1985
1986-1990
1991-1995
1996-2000
Year
Perc
enta
ge In
crea
se
Area Production Productivity
2.3 During the last four decades, there has been tremendous expansion in area and production of coconut in the World. The increase in area under coconut since 1961 to Figure – 1 2003 was slow but steady.
The production also showed a steady trend of increase during the decade under reference. However, during the period between 1971 and 1980, there was a declining trend in production in spite of area expansion, due to declining trend in productivity. The productivity declined from 5,407 nuts per hectare in the
year 1901, to 4,545 nuts/hectares during the year 2000. There was an increase of 145.39 per cent in area and 106.29 per cent in production whereas during the period the productivity had a negative trend i.e. 15.94 per cent (Table-2 & Annexure –II).
Table No.2
World Scenario : Area, Production and Productivity of Coconut (1961 to 2000)
Percentage increase Sl.No. Period Area Production Productivity
1. 1961 – 1965 12.67 1.56 -9.88 2. 1966 – 1970 13.39 5.05 -7.35 3. 1971 – 1975 6.45 -7.75 -13.33 4. 1976 – 1980 14.69 -1.87 -14.43 5. 1981 – 1985 5.55 2.93 -2.48 6. 1986 – 1990 22.69 23.56 0.72 7. 1991 – 1995 7.42 17.70 9.57 8. 1996 – 2000 2.85 0.99 0.19
Growth over the period 1961-2000
145.39% 106.29 -15.94
Source : Coconut Development Board, ICJ, 2001.
2.4 Nearly 50 per cent of the World production of coconut is processed into copra, depending upon the consumption patterns the share of coconut processed into copra varies from country to country. In Philippines and some of the South Pacific countries, about 90 per cent of their coconut production is converted into copra, and in India and Sri Lanka, it ranges between 25-30 per cent.

Production and Marketing of Coconut in India
Page 7 of 122
Table No.3
World : Production of Copra and Coconut oil (Quinquennium Average for the period from 1970-74 - 1995-99)
COPRA COCONUT OIL Year Production In (M.T.)
Increased in (M.T.)
Increasedin %
Production in (M.T.)
Increased in (M.T.)
Increased in %
1970-74 3866200 -- -- 2436000 -- -- 1975-79 4735200 869000 22.47 2983176 547176 22.46 1980-84 4432722 - 302478 - 6.39 2629021 - 354155 - 11.87 1985-89 4726620 293898 6.63 2977770 348749 13.26 1990-94 4877318 150698 3.19 3072271 94501 3.17 1995-99 5030650 153332 3.14 3169310 97039 3.16
2.5 Coconut economy in the World is often susceptible to the pressure from cheaper oil seed and increased availability of cheap oil sources like palm oil, soybean oil and sunflower oil. Coconut oil being the source of lauric acid and myristic acid, which are considered as important item for industrial applications and always enjoy a premium price. However, substitutes from petro-chemicals have restricted the growth of industrial demand for coconut oil. The growth of edible oils viz. soybean oil, palm oil and mustard/rape seed oil industries have kept supply of vegetable oils more than adequate for domestic consumption and therefore, restricted the growth of coconut oil industries.
The present trend in world production of vegetable oils indicates that the total production of vegetable oil has increased to 93.66 million M.T. in 2001-2002 from the level of 38.19 million M.T. in 1980-81 with an increase of 145.25 per cent. Among the major vegetable oils, the growth in production of palm oil, rape seed oil and soybean oil was significantly higher due to low cost of cultivation. Countries like Indonesia, Malaysia, Papua, New Guinea, etc. have switched on to palm cultivation. As a result, the palm oil production has gone up substantially. Its share in the world production has significantly increased to 26.43 per cent from the level of 13.54 in 1980-81. However, the share of soybean oil remained stable during the same period in spite of increase in the production. The coconut oil, however, recorded the lowest rate of growth of 0.48 per cent only and the percentage share of coconut oil among the total vegetable oil pool reduced to 3.43 per cent in 2001-2002, from the level of 7.59 per cent during the same period. Thus, the coconut oil in the world has become a minor oil compared to other competitive oils and fats. Though, the production of vegetable oils has been increasing steadily, the supply of coconut oil remained constant due to inelastic demand in cosmetic, pharmaceuticals and paint industries on account of easy availability of cheaper vegetable oils.

Production and Marketing of Coconut in India
Page 8 of 122
2.6 The world-wide trend in value addition, product development and diversification in several coconut producing countries for international trade lead to establishment of copra processing facilities. As a result, the availability of copra for export declined resulting in increasing share of coconut oil in export market. The coconut producing countries realized that copra processing alone would not be economical in their interest. Accordingly they embarked upon product diversification and by-product utilization through value addition. The countries which were processing coconut shell charcoal graduated to activated carbon. Philippines and Indonesia commenced coco chemicals. The APCC countries have diversified in to processing of coconut cream, nata-de-coco, which has got demand in Japan and Taiwan. Export of fresh nut is becoming more lucrative than copra or oil. The traditional coir industry is finding geo-textiles, carpets and rugs fetch better price than mattress fibers. The thrust in product development value addition, product diversification and quality improvement gradually resulted in diversification of coconut market. Ironically due to increasing competition from substitutes, the demand for coconut oil and copra meal came down. Further, the malafide campaign against coconut oil and EEC regulations on aflatoxin contamination of animal feed, which include copra and copra meal resulted in decline in volume and value of these products in export market.

Production and Marketing of Coconut in India
Page 9 of 122
COCONUT SCENARIO IN INDIAN PERSPECTIVE: SUPPLY AND DEMAND
3.1 The coconut is not only significant in socio cultural needs of our society, but also has gained considerable importance in the national economy as a potential source of rural Plate – 4 employment and
income generation among the plantation crops. The countrywide demand for coconuts both for edible and non-edible purpose, the adaptability of coconut palm to grow under varying soil and climatic conditions has generated keen interest among the people of even non-traditional zones in the country to plant a few saplings in their homestead gardens. The coconut palm requires a warm climate without greater diurnal variation of temperature. The ideal mean temperature is usually at 270C and the average diurnal variation
Source : Maps of India between 50C and 70C. The palm grows best under a well distributed rainfall between 1,300 mm and 2,300 mm, throughout the year. Even higher precipitation up to 3,800 mm is tolerated, provided that soil drainage is good. The palm requires plenty of sunlight and does not flourish in cloudy regions. The young palms do grow under shades of old palm during replanting but requires sufficient room for roots and light for growth. Therefore, it makes desirable to remove old palms when palm trees attain the age of eighth year. The growth of palms towards the light or their heliotropism could be noticed on the seashore plantations. The coconut palms flourish well on sandy soils along the sea coast, but also grow on various types of soil, provided there is free-drainage and allow unrestricted root development and aeration, viz Alluvial soils (Godavari delta), Lateritic soils (Red loam) in West Coast. Based on climate, soil, physical and chemical characteristics and the length of

Production and Marketing of Coconut in India
Page 10 of 122
Triannium Average (2000-2003 of Area, Production and Productivity of Coconut in India)
5%
1%
1%
1%
19%
49%
1%
0%
2%
18%
0%
1%
1%
0%
0%
0%
0%
A nd hra P rad e s h A s s am Gujara tGo a Ka rnat aka Ke ra laM a haras ht ra N ag a land Oris s aTamil N a d u Trip ura We s t B e ng a lA nd a ma n N ic o b ar Is land Laks had w e e pP o nd ic he rry D iu
growing period, India is broadly delineated into 20 agro-eco regions, 60 eco sub regions. The coconut palms are grown in most of the zones, except sub tropic and temperate regions, which includes 19 states and 3 union territories in the country. However, they are favourably adapted to coastal Agro ecosystem-having coastline of 8129 km. and its Peninsular region bounded by the Arabian sea on the West, the Bay of Bengal on the east and Indian ocean on the south. Andaman and Nicobar Islands in the Bay of Bengal and Lakshadweep Islands in Arabian sea are unique inland eco-system where coconut plantation is widely grown. 3.2 The distribution of area under coconut cultivation shows that the major portion of coconut production in the country Figure – 2 rests with the Western plains and Ghat regions comprising the states of Kerala, Karnataka and Maharashtra followed by Eastern coast plain and hilly regions comprising Andhra Pradesh, Orissa, Tamil Nadu and Pondicherry. Andaman & Nicobar, Lakshadweep Island and states of Gujarat are the other traditional coconut growing areas. Certain tracts of Tamil Nadu, Karnataka and the states of Assam, Tripura, West Bengal, Bihar and Madhya Pradesh are the non-traditional areas where coconut cultivation has made in roads rapidly. In the North Eastern belts, state like Mizoram, Manipur, Nagaland Source : Table No.4 and Arunachal Pradesh are also experimenting coconut cultivation successfully. However, the triennium average for the year (2000-2001 to 2002-2003) showed that Kerala’s contribution to total area under coconut was 48.79 per cent, followed by Karnataka 18.90 per cent, Tamil Nadu 17.70 per cent and Andhra Pradesh 5.50 per cent, which together accounted for 91 per cent of the total area in the country.

Production and Marketing of Coconut in India
Page 11 of 122
Table No.4
State-wise Area, Production and Productivity of Coconut in India (Triennium Average 2000-2001 to 2002-2003)
(Area – ‘000’ Hectare, Production – Million Nuts, Productivity – Nuts / Hectare)
Sl. No.
State Area % of total Area
Production % of total Production
Productivity
1. Andhra Pradesh 104.0 5.50 1125.4 8.90 10821 2. Assam 21.1 1.11 154.4 1.22 7317 3. Gujarat 12.6 0.67 100.5 0.80 7976 4. Goa 25.0 1.32 124.1 0.98 4964 5. Karnataka 357.8 18.90 1587.1 12.57 4436 6. Kerala 923.6 48.79 5539.3 43.86 5997 7. Maharashtra 16.7 0.88 206.3 1.63 12353 8. Nagaland 0.9 0.05 3.8 0.03 4222 9. Orissa 38.1 2.01 174.5 1.38 4580 10. Tamil Nadu 335.1 17.70 3115.4 24.67 9297 11. Tripura 3.2 0.17 7.0 0.06 2187 12. West Bengal 24.8 1.31 326.3 2.58 13157 13. Andaman
Nicobar Island 25.2 1.33 91.1 0.72 3615
14. Lakshadweep 2.7 0.14 47.7 0.38 17666 15. Pondicherry 2.3 0.12 23.7 0.19 10304 16. Diu 0.1 Neg. 3.4 0.03 34000
All India 1893.2 100.00 12630.0 100.00 6671 3.3 The coconut palm indeed is a traditional plantation crop grown in India over the past 3000 years with longest mythological and historical record. In spite of the great antiquity attached to coconut crop in the country, organized efforts to develop the crop were made only about a century back and actual systematic efforts for development of coconut palm as a commercial crop begun in 1940s. The enquiry commission set up by the Government of India in 1943 recommended establishment of a statutory body at central level. The Indian Central Coconut Committee was formed in February, 1945, under the Indian Coconut Committee Act 1944, with the objective to encourage horticultural, technological and economically viable development of coconut industry through adoption of improved methods in coconut cultivation to enhance production, improvement in marketing of coconuts and coconut products in the country and abroad. The subsequent institutional arrangement made by the Government for development of coconut industry in the country included, creation of Directorate of Coconut Development with head quarter at Cochin under the Ministry of Agriculture, Department of Agriculture and Cooperation, Government of India in 1966. The Directorate carried forward the functions of planning, co-ordination of development programme for

Production and Marketing of Coconut in India
Page 12 of 122
production, processing and marketing of coconuts in the country. In 1966, the Indian Coconut Council, an advisory body was constituted to review coconut situation in the country and suggest measures to accelerate the growth of coconut industry.
3.4 In 1981, the Directorate of Coconut Development was abolished to pave the way for establishment of Coconut Development Board in the year 1981, under the Coconut Development Board Act. 1979 enacted by the Parliament. The major functions earmarked for the Coconut Development Board were adopting measures for the development of coconut industry, recommending measures for improving marketing of coconut and its products, imparting technical advice to those engaged in coconut cultivation and industry, providing financial and other assistance for expansion of area under coconut, encouraging adoption of modern technologies for processing coconut and its products, recommending measures for regulating imports and exports of coconut and its products, fixing grades, specifications and standards for coconut and its products, financing suitable schemes to increase the production of coconut, assisting, encouraging, promoting and financing agricultural, technological, industrial or economic research on coconut and its products, collecting statistics on coconut and its products and publishing, undertaking publicity activities and publishing books and periodicals on coconut and its products. Further, the Development Programme implemented by the Board are (i) Integrated Development of Coconut Industry in India and (ii) Technology Mission on Coconut which covers the following component programme: a) Development, demonstration and adoption of technologies for management of insect pest and disease affecting the coconut gardens. b) Development and adoption of technologies for processing and product diversification. c) Market research and promotion and d) Technical support, external evaluation and emergent requirements. 3.5 The developmental activity during the First Five Year (1951-56) was carried out by the Indian Central Coconut Committee as its normal developmental work. However, the coconut development programme received real impetus when at the first time, it was brought under the preview of 2nd Five Year Plan (1956-61). The distinguished achievements during this plan periods were the establishment of large number of coconut nurseries in some major coconut growing states, biological control laboratories for pest control, popularizing scientific methods of coconut cultivation and crop protection measures through publicity and extension programme. The developmental activities viz. production and distribution of seedlings, laying out demonstration plots in grower’s gardens, plant protection measures, etc., during the First Five Year Plan period resulted in increased production from 3282 million nuts in 1950-51 to 4224 million nuts in 1955-56 and area under crop increased from 626.5 thousand hectares to 647.6 thousand hectares.

Production and Marketing of Coconut in India
Page 13 of 122
3.6 The production and productivity oriented developmental projects implemented during 2nd Five Year Plan were expanded and continued during the 3rd Five Year Plan (1961-66). There was steady increase in area and production during this plan period i.e. 883.7 thousand hectares and 5035 million nuts respectively. The 3rd Five Year Plan period was followed by a plan break for three consecutive years up to 1968-69 in which programme were continued as annual plans, as result, coconut production touched the level 5546 million nuts and the area under coconut increased to 990 thousand hectares in 1968-69. 3.7 During the Fourth Plan (1969-70 to 1973-74) various short term and long term programme were envisaged to achieve an additional production of 1000 million nuts by the end of plan period. The short term measures included laying out demonstration plots, expansion of irrigation facilities and plant protection, the long term measures covered production and distribution of hybrid planting material in states of Kerala, Karnataka, Tamil Nadu and Andhra Pradesh, establishment of elite seed farm for Tall X Tall (TxT) progenies in Karnataka and subsidized supply of quality planting material in Gujarat. By the end of this plan period, the area under coconut increased to 1102 thousand hectares with production of 5851 million nuts. 3.8 The production and productivity improvements programme were continued during Fifth (1974-76 to 1979-80) and Sixth Five Year Plan (1980-81 to 1984-85). More emphasis was laid on hybrid planting material production and rejuvenation of the diseased coconut holdings affected due to root wilt disease. The formation of Coconut Development Board in 1981, coincided with commencement of Sixth Plan during 1980-81. The developmental programmes of coconut were given wider dimensions, by identifying thrust areas for development. A decade prior to the formation of Coconut Board, witnessed either declining trend in production and productivity with area under coconut cultivation remained almost stagnant. However, by the end of Sixth Plan period the area under coconut cultivation increased to 1.83 million hectares and the production to 6913 million nuts. Expansion of area under coconut cultivation to increase the future production potential, by extending coconut cultivation in the traditional and non-traditional states, technical guidance and liberal financial assistance to the tune of Rs.8000/- per hectare, were some of the measures adopted by the Coconut Development Board to achieve the goal after 1980. 3.9 The development programme further expanded during the Seventh Five Year Plan (1985-86 to 1989-90) by starting technology development center for coconut, laying more emphasis on development of new products like coconut cream, packed coconut water, coir pith briquette, timber utilization etc. With the concerted efforts made by all agencies, the area under coconut reached to the level of 1.47 million hectares and

Production and Marketing of Coconut in India
Page 14 of 122
Area under Coconut Cultivation in India (1980-1999)
0200400600800
10001200
Ker
ala
Kar
nata
ka
Tam
ilN
adu
And
hra
Prad
esh
Oth
ers
States
Are
a in
'000
' hec
tare
1980-81 1998-99Increase over the period Percentage increaseGrowth rate
production to 9359 million nuts as per the target. During this Plan period, an apex body in cooperative sector “KERAFED” came into existence in 1987, to implement an integrated coconut production, procurement, processing and marketing projects. Initially about 900 Primary Agricultural Credit Societies were brought under the purview of kerafed with financial assistance from National Cooperative Development Corporation. 3.10 In the Eighth Five Year Plan (1992-93 to 1996-97), the development programme for coconut received further boost with enhanced financial budget allocation to the tune of 79.29 crores, for implementing several production and productivity oriented programme. During this plan period, about 46,000 hectares was brought under the Area Expansion Programme. The development programme along with area expansion and Integrated Diseases Control Programme were continued in the Ninth Five Year Plan (1997-98 to 2001-2002). The production at Figure – 3 national level touched 14925 million nuts from an area of 1.91 million hectares by the year 1999-2000, due to harmonious efforts made by the institutional research and development work. Priority was given to bring additional area in traditional coconut growing belts and introduction of the crop in non-traditional areas. The productivity improvement Source : Table No.5. programme in coconut producing areas by introduction of disease eradication, weeding out unproductive diseased palms and replanting with quality seedlings, development of irrigation sources and micro-irrigation system, integrated farming in coconut holdings etc. resulted in increased productivity in coconut belts.
3.11 The impact was seen from the improvement in area, production and productivity by 1999-2000. The increase in area over the period of last 20 years was 0.82 million hectare i.e. from 1.08 million hectare in 1980-81 to 1.91 million hectare in 1998-99. The increase in production during this period was 8983 million nuts with a growth rate of 5.25 per cent raised the production to 14925 million nuts in 1998-99 from the base level of 5942 million nuts in 1980-81.
Production and Marketing of Coconut in India
Page 15 of 122
Production of Coconut in India (1980-1999)
010002000300040005000600070008000
Ker
ala
Kar
nata
ka
Tam
ilN
adu
And
hra
Prad
esh
Oth
ers
States
In M
illio
n N
uts
1980-81 1998-99Increase over the period Percentage increaseGrowth rate
Table No.5
Area under Coconut Cultivation in India (1980-1999) (Area in ‘000’ hectare)
Table No.6
Coconut Production in India (1980-1999) (in million nuts)
Source : Coconut Development Board.
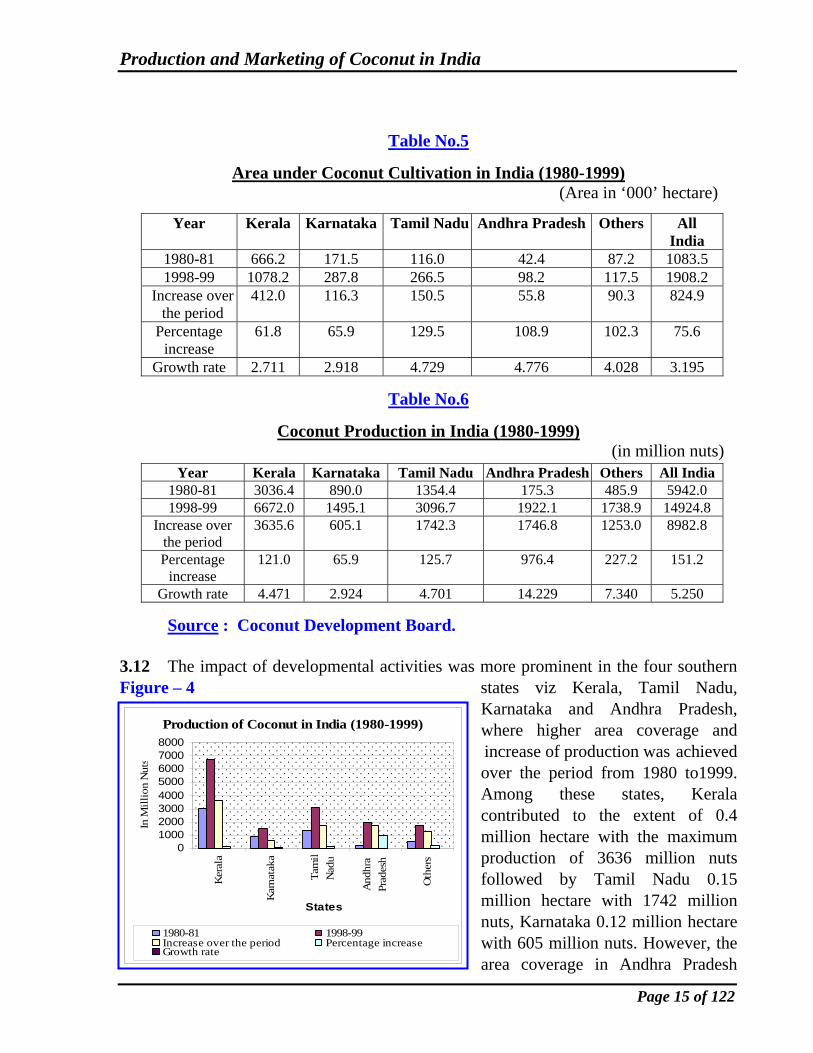
3.12 The impact of developmental activities was more prominent in the four southern Figure – 4 states viz Kerala, Tamil Nadu,
Karnataka and Andhra Pradesh, where higher area coverage and increase of production was achieved over the period from 1980 to1999. Among these states, Kerala contributed to the extent of 0.4 million hectare with the maximum production of 3636 million nuts followed by Tamil Nadu 0.15 million hectare with 1742 million nuts, Karnataka 0.12 million hectare with 605 million nuts. However, the area coverage in Andhra Pradesh
Year Kerala Karnataka Tamil Nadu Andhra Pradesh Others All India
1980-81 666.2 171.5 116.0 42.4 87.2 1083.5 1998-99 1078.2 287.8 266.5 98.2 117.5 1908.2
Increase over the period
412.0 116.3 150.5 55.8 90.3 824.9
Percentage increase
61.8 65.9 129.5 108.9 102.3 75.6
Growth rate 2.711 2.918 4.729 4.776 4.028 3.195
Year Kerala Karnataka Tamil Nadu Andhra Pradesh Others All India 1980-81 3036.4 890.0 1354.4 175.3 485.9 5942.0 1998-99 6672.0 1495.1 3096.7 1922.1 1738.9 14924.8
Increase over the period
3635.6 605.1 1742.3 1746.8 1253.0 8982.8
Percentage increase
121.0 65.9 125.7 976.4 227.2 151.2
Growth rate 4.471 2.924 4.701 14.229 7.340 5.250
Production and Marketing of Coconut in India
Page 16 of 122
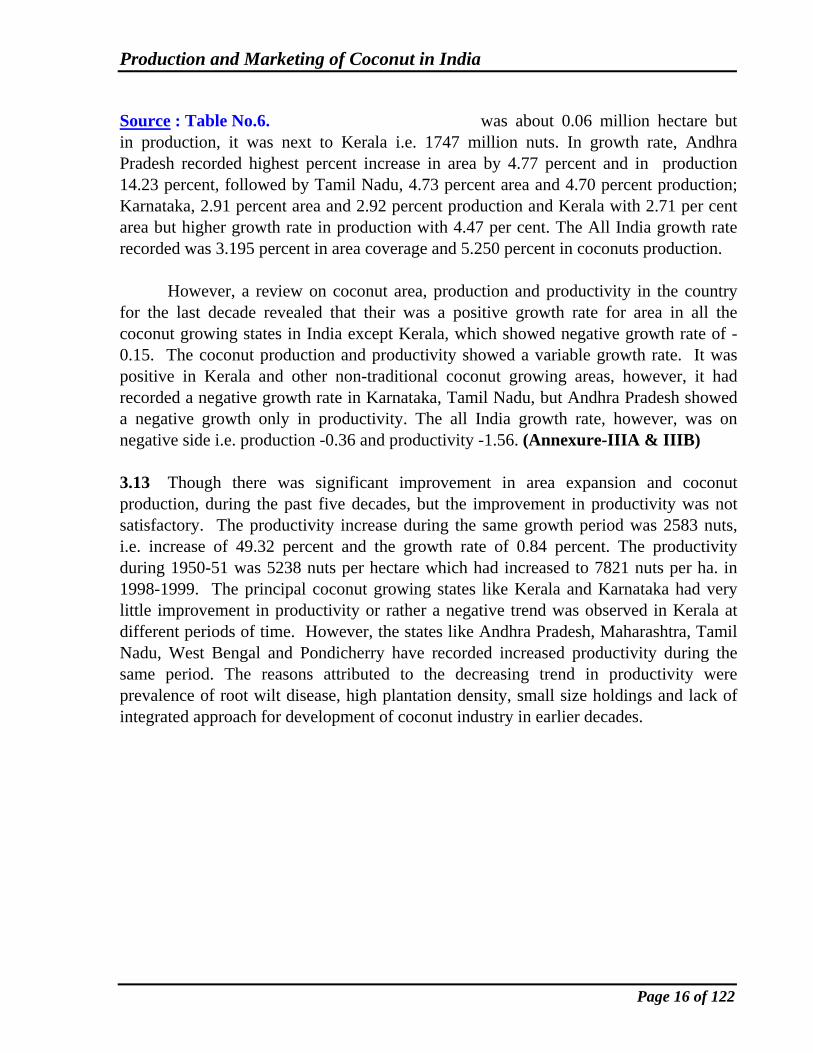
Source : Table No.6. was about 0.06 million hectare but in production, it was next to Kerala i.e. 1747 million nuts. In growth rate, Andhra Pradesh recorded highest percent increase in area by 4.77 percent and in production 14.23 percent, followed by Tamil Nadu, 4.73 percent area and 4.70 percent production; Karnataka, 2.91 percent area and 2.92 percent production and Kerala with 2.71 per cent area but higher growth rate in production with 4.47 per cent. The All India growth rate recorded was 3.195 percent in area coverage and 5.250 percent in coconuts production. However, a review on coconut area, production and productivity in the country for the last decade revealed that their was a positive growth rate for area in all the coconut growing states in India except Kerala, which showed negative growth rate of -0.15. The coconut production and productivity showed a variable growth rate. It was positive in Kerala and other non-traditional coconut growing areas, however, it had recorded a negative growth rate in Karnataka, Tamil Nadu, but Andhra Pradesh showed a negative growth only in productivity. The all India growth rate, however, was on negative side i.e. production -0.36 and productivity -1.56. (Annexure-IIIA & IIIB) 3.13 Though there was significant improvement in area expansion and coconut production, during the past five decades, but the improvement in productivity was not satisfactory. The productivity increase during the same growth period was 2583 nuts, i.e. increase of 49.32 percent and the growth rate of 0.84 percent. The productivity during 1950-51 was 5238 nuts per hectare which had increased to 7821 nuts per ha. in 1998-1999. The principal coconut growing states like Kerala and Karnataka had very little improvement in productivity or rather a negative trend was observed in Kerala at different periods of time. However, the states like Andhra Pradesh, Maharashtra, Tamil Nadu, West Bengal and Pondicherry have recorded increased productivity during the same period. The reasons attributed to the decreasing trend in productivity were prevalence of root wilt disease, high plantation density, small size holdings and lack of integrated approach for development of coconut industry in earlier decades.

Production and Marketing of Coconut in India
Page 17 of 122
3.14 Factor Affecting Production And Productivity : 3.14.1 Coconut Varieties and Hybrids Evolved for Commercial Cultivation: Since ancient times, the coconut palm is widely distributed and hence large number of Plate–5 varieties are classified on the basis of
characters such as Tall or Dwarf cultivars, early or late maturity, colour, size, shape of the fruit including other properties of the fruit like thickness of husk, shell, water content of tender nuts and kernel thickness of matured nuts, etc. 3.14.2 In spite of limitations in improving productivity of coconut crop due to its perennial nature, tall stature, long pre-bearing period, prolonged period for
Chawghat Orange Dwarf (COD) development of nuts, heterozygous nature and large area requirement for experimental research, a significant development in the coconut farming has been made in the country. The selective cross breeding has evolved hybrids from the tall and dwarf palm giving higher yield, combining the nut and kernel size or copra characteristics of tall with early maturity and fruit bearing characteristics of dwarf varieties. Primarily, there are two groups of coconut cultivars known as tall and the dwarf cultivars. Tall varieties are common type found Plate – 6 through out the world. The life spans of tall varieties extend from 60 to 80 years and grow to a height of 15 to 18 meter. Coconut palms attain bearing in 6-7 years and steady bearing in about 12 to 15 years. The nuts are medium to big in size with colour varying from green, greenish yellow to brown. Such coconut palm produces good quantity with quality copra with fairly high oil content as compared to dwarf cultivars. Dwarf Cultivars are shorter in stature and life span. It grows to the height of 5-7 m. with an average life span of 40 to 50 years and start bearing from 3-4 years after planting. The nuts are smaller and the copra is soft, leathery and low in oil content. The nuts of dwarf cultivars have orange, yellow Malayan Yellow Dwarf (MYD) or green colours. The tall palms are not true to type as they are cross pollinated, whereas dwarf palms are self pollinated and hence true to type.

Production and Marketing of Coconut in India
Page 18 of 122
3.14.3 The Central Plantation Crop Research Institute, Kasaragod has the World’s largest collection of germplasm of coconut consisting of 241 cultivars of which 101 are

Production and Marketing of Coconut in India
Page 19 of 122
exotic and 140 are indigenous types. The varieties of germplasms were evaluated for morphological, yield and quality characteristics, pest and disease resistance in multilocation trials at coordinating centers and All India Coordinated Research project on Palms. Based on their performance superiority, they are released for cultivation. Systematic evaluation and selective breeding over the past several years resulted in selection of four high yielding varieties viz Lakshadweep Ordinary, Benaulim Green Round, Philippine Ordinary and West Coast Tall for coconut growing tracts of India. 3.14.4 Selection of right variety and quality of seed material is important as the quality Plate – 7 of planting material has got a direct bearing on production
and productivity of coconut. The investment incurred by the farmers during the pre-bearing period and there after, would be in-fructuous, if the quality planting material is not made available to them. It was assessed that, there had always been dearth of quality planting material creating a huge gap between demand and supply of coconut seedling. The demand would further increase, when an integrated coconut farming system has to be implemented, in which cutting down disease affected coconut trees especially in root (wilt) affected areas and planting of fresh disease
DxT Hybrid resistant quality seedlings becomes a necessity. It is, therefore, necessary to select a consistently yielding elite variety of coconut seeds for plantation. 3.14.5 Varieties of Tall and Dwarf Coconut Cultivars : Sl. No. Cultivars General Characteristics
1. 2. 3. A Tall Variety i. West Coast
Tall (WCT) Extensively cultivated in the West Coast region. Life span 75 years. Regular bearer producing 12 inflorescences per year. Start bearing in about 6-7 years. Average annual yield 40 to 100 nuts per tree. Average copra content 176 gms. Oil content 68 per cent. Recommended for cultivation in coastal region of Kerala and Karnataka.
ii. East Coast Tall (ECT)
This is common cultivars grown extensively in the East Coast of India, morphologically similar to WCT. The palm takes 6-8 years to start bearing. The average annual yield is 70 nuts per palm. It has mean copra content of 125 gms. per nut and oil content of 64 per cent.

Production and Marketing of Coconut in India
Page 20 of 122
1. 2. 3. iii. Tipton Tall This is popular tall cultivars of Karnataka. Morphologically similar
to WCT. Average yield is 86 nuts per palm per year. Mean copra content of 178 gms. per nut with an oil content of 68 per cent.
iv. Benaulim Tall (Pratap)
Palms are predominantly occurring in Goa, Konkan region of costal Maharashtra. Morphologically similar in appearance to WCT but nuts are smaller and round and closely grow in heavy bunches. The variety starts bearing in about 7-8 years. Average annual yield is 150 nuts per palm with copra content of 152 gms. per nut and 64 percent oil content. The variety is cultivated by name Pratap in Maharashtra state.
v. Lakshadweep Ordinary (Chandra Kalpa)
The variety is indigenous to Lakshadweep Islands and resembles to WCT except in nut size which is smaller with prominent three ridges on triangular nuts. The palms are good source for tapping toddy. Average yield of 100 nuts per palm, copra content 176 gms. with 72 per cent oil content. The variety is released as Chandra Kalpa by CPCRI in 1985 for cultivation in Kerala, Karnataka and Andhra Pradesh.
vi. Andaman Ordinary
The variety is largely grown in Andaman & Nicobar Islands. The palms are tall massive and more vigorous than WCT in vegetative growth. The nuts are fairly large in size with average yield of 94 nuts per palm per annum. Copra content is 169 gms. per nut with 66 percent oil content.
vii. Sevvelanir This is a tall cultivar found in Pondicherry, tender nut water has high medicinal value. The nuts are green in colour, tender nut water is sweet in taste. The mean annual yield is 40 to 45 nuts per palm.
viii. Kamrupa The variety was originally known as Assam Green Tall, a selection from the local germplasms, one of the most promising cultivars of this region. It has high yielding capacity i.e. 106 nuts per palm per year. Copra yield: 16.34 kg. per palm per year, with oil content : 64.50 per cent. In tender nut the water content is 253 ml. Tolerant against major coconut pests and diseases commonly affecting coconut palm.
B. Exotic Cultivars i. Philippines
Ordinary As name indicates it is an exotic cultivars from Philippines, palms grow up to the height of 10-12 m. Annual average yield is 110 nuts, with copra content 183 gms. per nut and oil content 66 percent. The variety is found suitable for cultivation in the West Coast, Konkan region of Maharashtra, Andhra Pradesh and West Bengal.

Production and Marketing of Coconut in India
Page 21 of 122
1. 2. 3. ii. Philippines laguna. Annual average yield 88 nuts, per palm, per year, with copra
content of 258.9 g per nut and oil content 66.5 percent. iii. Fiji longtongan.
Annual yield of 104 nuts, per palm, per year, copra content 210.5 g per nuts and oil content 66 percent.
iv. Fiji tall.
Annual yield of 106 nuts, per palm, per year, copra content 199.1 g per nuts and oil content 65.2 percent.
v. S.S. Green. Annual yield of 108 nuts, per palm, per year, copra content 186 g per nuts and oil content 67 percent.
vi. Sanramon. Annual yield of 64 nuts, per palm, per year, copra content 349.6 g per nuts and oil content 68 percent.
C. Indigenous Dwarf Cultivars i. Chowghat Orange
Dwarf The variety is an indigenous dwarf cultivars particularly in Chavakkad area of Trissur district in Kerala. It is also known as Gaurigathram or Chenthengu and Kenthali in Karnataka. The palm has thin stem, small and compact crown with orange coloured leaf, petioles, inflorescence and nuts. The Palm starts bearing from 3-4 years. Average annual yield is 65 nuts per palm, mean copra content 150 g. with 66 percent oil content. The variety is ideal for Tender coconut water purpose. The variety is recommended for cultivation in Kerala and Karnataka.
ii. Chowghat Geen Dwarf
iii. Malayan Yellow Dwarf
iv. Malayan Orange Dwarf
v. Malayan Green Dwarf
vi. Ganga Bondam
These dwarf cultivars have one thing in common that they are shorter in statures and life span. They bear nuts with orange, yellow and green colours as in their names. Mostly cultivated for tender nuts, ornamental value and for production of hybrids.
vii. Kentholi Orange Dwarf
This cultivar is from Karnataka State, having high medicinal value for its tender nut water.
viii. Chitta Gangapani ix. Udha Gangapani
These dwarf cultivars are found in Arsikere and Tiptur area in Karnataka with green, medium sized round fruits. Tender nut water is very sweet.

Production and Marketing of Coconut in India
Page 22 of 122
3.14.6 Hybrid Varieties : Hybrids are evolved by artificial inter varietals crosses of Plate – 8 two morphological forms of coconut and they exhibit improved
inherited characteristics for which their parents were crossed such as early flowering, high yielding, higher quantity and better quality of copra and oil when compared to the parents. Hybrid vigor in coconut was reported for the first time in India by Patel in 1932 from artificial crossing West Coast Tall (WCT) as mother palms and Chowghat Green Dwarf (CGD) as male parent. In Dwarf x Tall (D x T) hybrids, Dwarf is the female and tall is the male parent and inter varietals hybrids like Tall x Tall and Dwarf x Dwarf are produced. More than 80 hybrid combinations have been evaluated over the years in India and so
TxD Hybrid far eleven coconut hybrids were released for commercial cultivation and establishing seed gardens.
Table No.7
Salient Features of Released Indian Coconut Hybrids
Sl. No.
Name of Hybrid
Parentage Yield No. of nuts per palm per
year
Copra mean
per nut (g)
Yield mean
per palm (kg)
Oil content
(per cent)
Name of state recommended for commercial
plantation 1. Chandra
shankara COD x WCT
222 215 24.9 68 Kerala
2. Kera shankara
WCT x COD
211 187 20.2 68 Kerala coastal -Maharashtra
coastal Andhra Pradesh
3. Chandra Laksha
LCOT x COD
171 195 21.3 69 Kerala
4. Laksha ganga
LCOT x GBGD
186 195 21.1 70 Kerala
5. Ananda Ganga
AODT x GBGD
95 216 20.5 68 Kerala
6. Keraganga WCT x GBGD
100 201 20.1 69 Kerala
7. Kerasree WCT x MYD
130 216 28.0 66 Kerala
8. Godavari ganga
ECT x GBGD
140 150 21.0 68 Andhra Pradesh
9. Kera Sowbhagya
WCT x SSA
116 196 22.7 65 Kerala
10. VHC-1 ECT x CDG 98 135 13.2 70 Tamil Nadu 11. VHC-2 ECT x MYD 107 152 16.3 69 Tamil Nadu 12. VH-3 ECT X MOD 156 25.2 Tamil Nadu
Production and Marketing of Coconut in India
Page 23 of 122
3.14.7 Prevalent Cultural Practices : Selection of appropriate varieties of hybrids for plantation depends on the agro climatic conditions prevailing in the area. The quality of the seed nuts is equally important when hybrid varieties are selected for commercial cultivation. If inferior seed nuts are used, the new plantation would be wasteful, causing considerable loss of time as well as finance to the farmers. The productivity of the coconut palms can be increased fourfold by regular manuring right from the first year of planting for good vegetative growth, early flowering and bearing. However, high yield of coconut productivity of palm is adversely affected when the plantation is neglected during early growth period. At later stage, even application of fertilizer would not help in achieving the expected higher level yield.
The coconut palms are prone to the effect of moisture stress which is reflected in the reduction of yield due to reduction in number of bunches, number of female flowers inflorescence bearings and shedding of tender nuts. The size of nut and copra content are also reduced due to water reduction stress on palms. Therefore, efficient irrigation system and water conservation is necessary to make adequate soil moisture available for the coconut palms. Depending upon the area, different methods of irrigation are applied to coconut crop. Drip irrigation has been found more efficient to economize and improve water holding in soil and found favourable in west coast conditions. Sprinkler or perfo irrigation system has more utility in coconut plantation with inter or mixed crops. Mulching with coconut husk, coir dust, green leaves and dried coconut leaves practices are followed to improve water retention in soil and reduce soil erosion. Saline water irrigation has also been found to be effective to enhance the yield of coconut. Use of mixture of sea water and fresh water in 1:2.5 ratio increases coconut yield by 15 per cent over no irrigation.
Cultural practices adopted by coconut growers do influence the growth and productivity of coconut palms. The findings of various research institutes suggested that treatment combinations of inter cultivation combined with organic and inorganic manuring has improved the productivity of coconut palms. Cover cropping has been practiced where a semi permanent vegetation of leguminous creepers are maintained in inter-spaces of palms. Cover cropping apart from helping in prevention of soil erosion and weed growth adds organic matter and acts as thick, much, which in turn improves soil fertility and water holding capacity. The leguminous cover crops enhance the nitrogen status of soil by virtue of nitrogen fixation in symbiotic association with root nodule bacteria Rhizobium.
3.14.8 It has been observed that coconut has been predominantly cultivated by the farmers with small and marginal holdings of the costal areas in the country. Coconut being a mono crop, does not utilize the basic resources such as soil and sunlight fully available on the farms / gardens. The adventitious rooting pattern of coconut palms

Production and Marketing of Coconut in India
Page 24 of 122
actually utilize 25 per cent of land area, therefore remaining area of the farm / garden is exploited for raising subsidiary crop which would co-exist with coconut palms economically and symbiotically. The plant/crops found favourable for raising as inter crops in coconut garden are tuber crops viz. tapioca, elephant foot yam, sweet potato, Rhizome spice crops viz Ginger, Turmeric. Cereals viz. some variety of rice, maize, verger grass, pear millet etc. vegetable viz snake gourd, ridge gourd, bottle gourd, bitter gourd, brinjal are some compatible inter-crops with coconut cultivation. Studies at Central Plantation Crop Research Institute, Kasargod, revealed that among cereals Rohini variety of rice, maize, pearl millet, finger millet and varagu (Paspalam scrobibulatum) performed well in inter-cropping with coconut plantation.
Leguminous pulses crops viz cowpea, black gram, green gram, bengal gram, red
gram and soybean gave satisfactory yield in intercropping with coconut. Papaya, Banana and Pineapple are most popular fruit crops grown as intercrops in coconut garden. Orchids, anthurium, cut flowers and ornamental nurseries can be successfully grown as inter-crop in coconut garden. Medicinal and aromatic plant viz lemon grass, kocholam, dioscorea, arrowroot, sida, thippali (long pepper) neela amari and adapathiyan are suitable as intercrops in coconut garden. In Kerala, perennial crops in association with coconut palm are preferred for mixed cropping. Cocoa, clove, nutmeg, cinnamon, pepper, betel vine, jackfruit and mango are often raised as mixed crops in coconut garden.
Different cropping combinations have been evolved for coconut based high
density multi cropping involving annuals, perennials and combination of both depending Plate – 9 upon the availability of resources like type of soils,
irrigation facilities, rainfall, labour, finance, farmers needs and market demand. These systems enabled farmers to utilize maximum inter-space, full solar energy and higher income from unit holding. Apart from the agro-based mixed farming in coconut, poultry, piscicultures have been successfully tried by farmers for higher returns. Multi-storied cropping in which cultivation of three or more crops
Multistoried Cropping System having different morphological characteristics in interspace of coconut palms, so as to intercept sunlight at different level and draw nutrition at different soil depths has been evolved. In this system intensive four crop combination which includes coconut, black pepper, cocoa and pineapple are cultivated in gardens where coconut palms are above 20 years old.

Production and Marketing of Coconut in India
Page 25 of 122
3.14.9 High Density Multispecies Cropping System (HDMSCS) : High density multispecies cropping system was established at CPCRI, Kasaragod in 1983. It involves growing of large number of crops to meet the diverse needs of the farmers having smaller holdings such as food, fuel, Plate – 10 timber, fodder and cash. The HDMSCS model was established in 1.2 hectare of 18 years old coconut plantation by interplanting 17 additional species crops. The crops selected were mango, breadfruit (Artocarpus communis), jackfruit, nutmeg clove, sapota, acidlime, guava, pepper, subabul, banana, pineapple, High Density Multispecies Cropping System papaya, coffee, elephant foot yam, coloasia and cassava. As the perennials grew and utilized more and more space, the annuals crops like acid lime, sapota, mango guava, pepper, subabul, papaya and coffee were withdrawn from the system. The HDMSCS systems now consist of clove, nutmeg, banana and pineapple in standing coconut crop. The coconut yield in this system has increased by 176 per cent as compared to the pre-experimental yield as a response to adoption of HDMSCS and irrigation. Some of the HDMSCS models are being evaluated in different coordinating centers in India.
Table No.8
High Density Multispecies Cropping Systems under Evaluation at Coordination Centers
Model-I Coconut + Pepper + Sapota + Banana + Clove + Lime + Pineapple.
1. Arsikere (Karnataka)
Model-II Coconut + Pepper + Nutmeg + Mango + Guava + Curry leaves + Potato.
Model-I Coconut + Pepper + Banana + Assam lemon + Pineapple + Ginger.
2. Kohikuchi (Assam)
Model-II Coconut + Betelvine + Banana + Assam lemon + Colocasia + Turmeric.
Model-I
Coconut + Nutmeg + Banana + Seedless lime + Elephant foot yam + Bitter gourd
Model-II
Coconut + Clove + Betelvine + Banana + Curry leaves + Colocasia
3. Veppankulam (Tamil Nadu) gourd.
Model-II
Coconut + Mango + Pepper + Banana + Seedless lime + Bhendi + Sirukizhangu

Production and Marketing of Coconut in India
Page 26 of 122
A field experiment was conducted at CPCRI Regional Station, Kayangulam to observe the impact of HDMSCS in root (wilt) affected garden on productivity and economic viability. The study revealed that in the system, productivity was higher and there was increase in the nut yield of coconut from 30 nuts per palm per year in pre-experimental period to 75.0 nuts per palm per year during 2000–2001. The inter-crops / mixed crops like banana, pineapple, pepper, nutmeg and tuber crop performed very well and provided additional income. The adoption of coconut based HDMSCS provided additional employment for the farming family, more stabilized gross income to coconut farmers even during lower price prevailing for the coconut. Moreover, the high density multi species cropping system was economically viable in root wilt affected area (Maheshwarappa, et. al., 2001).
3.14.10 Disease and Pest Management in Coconut : The coconut is considered as prime plantation crop is subjected to vagaries of nature. With modern agricultural practices, the incidence of diseases or pest infestation have been found to occur more frequently on coconut palms and causes substantial losses in their productivity and in some cases even loss of the palm. Though various control measures are used by farmers to tackle some of the major diseases, the efficient technological methods have to be integrated to derive greater benefit. The basic purpose of Integrated Disease Management (IDM) and Integrated Pest Management (IPM) is to involve utilization of different technologies in a compatible manner to reduce pest population or disease infestation below the economic damage level in coconut based cropping system.
MAJOR INSECT PESTS OF COCONUT IN INDIA
Sl.No. Pest Parts affected Photo Control Measures 1. 2. 3. 4. 5. 1. Rhinoceros
beetle (Oryctes
rhinoceros L.)
Spindle, leaves, Spathe,
destruction of inflorescence
Extraction of beetles using hooks during peak period of infestation (June-Sept.) from the crown of palms and treatments of all possible breeding sites of the beetle with 0.01 per cent corbaryl. Disposal of breeding grounds. Biological suppression using the microbial agents like Baculovirus of Oryctes and Metarhizium anisopliae.
1. 2. 3. 4. 5.

Production and Marketing of Coconut in India
Page 27 of 122
2. Red Plam Weevil (Rhynchophorus ferrugineus Fab.)
Terminal bud, upper
portion of trunk spindle, tender leaves
Avoid injuries on palm. Treat wounds with coal-tar+Carbaryl. Prophylactic crown treatment with 25 g. of Sevidol.8-G in 200 g. fine sand in May-September and December and curative treatment with 0.1 per cent endosulfan / dichorvos or 1 per cent carbaryl. Trapping of floating population of the weevil using coconut logs treatment with fermented toddy. Removal and burning of dead palms.
3. Leaf eating Caterpillar (Opisina
arenosella wik.)
Attack leaves, particularly lower leaves
surface during summer
months from February to
June
Disposal of badly infested outer leaves and leaflets by cutting and burning during out break of epidemic. Spraying Dichlorvos 0.02 per cent insecticide when the pest is in active larval stage and subsequent release of stage parasitoids like – Apanteles taragamae, Elasmus nephantidis. Brachymeria noscitoi and Xanthopimpla punctata. to control the job.
4. White grub (Leucopholis coneophora
Burm.)
Roots affected palms develop
sickly pale yellow leaves,
exhibits Button
shedding and tapering of
crown region.
Deep ploughing and digging of soil during pre and post monsoon period. Destroy adult beetles during peak emergence period in May – June. Application of insecticide phorate 10 G @ 100 g. per palm during the same period and September – October.
1. 2. 3. 4. 5.

Production and Marketing of Coconut in India
Page 28 of 122
5. Eriophyid mite (Aceria
guerreronis)
The mite infests the soft coconut by sucking sap from tissues of buttons. Triangular patches close to perianth due to sucking sap. The mite causes death of meristematic tissues resulting formation of brownish patches on the surface of nuts causing warting and longitudinal fissures. Prevents growth of nuts, reduction in shell and kernel. Affects quality and quantity of fiber content of husk.
Improve the nutritional status of coconut palm through application of fertilizer in two split application along with neem cake at 5 kg. per palm and organic manure (FYM) 50 kg. per palm. Spraying mixture of 2 percent neem oil, garlic and soap mixture and 1 percent Azadirachtin (Neemazal) @ of 4 ml. per litre of water or root feeding or stem injection at 7.5 ml. with same water proved beneficial in controlling infestation. Spraying of wetable Sulphur at 0.4 percent per litre of water Carbosulphan at 2 ml. per litre of water and Triazophos at 5 ml. per litre of water.
3.14.10.1 Like any other plantation crop, coconut palms are prone to many fungal, phytoplasma diseases and pest infestation which causes substantial loss in productivity of coconuts. Majority of coconut palm disease reported from various parts of the coconut growing areas are caused by fungi or phytoplasma viz Bud rot, Root (wilt), Leaf rot, Thanjavur wilt, Stem bleeding and Tatipaka causing significant decline in yield and even death of the palm. The incidence of diseases differs in different cropping system and eventually the disease control methods. The loss caused by the fungal diseases to coconut crop in the country ranges from 0.1 to 10 per cent in Kerala and upto 13 per cent in Tamil Nadu. The farmers are adopting available control measures in all the states such as observing phyto-sanitation for timely prophylactic and curative measures to prevent crop losses and to increase production and productivity.

Production and Marketing of Coconut in India
Page 29 of 122
Important Fungal Diseases Of Coconut
Sl. No.
Disease Causative Organism
Parts affected
Photo Control Measures
1. 2. 3. 4. 5. 6. 1. Bud-rot or
Fruit rot (Mahali)
Phytophthora Palmivora
Yellowing of younger leaves.
Withering of spindle.
(0.1 to 10% incidences)
Removal of infected tissues at early stage of infection. Application of Bordeaux paste 10%. Spray 1% Bordex mixture on spindle leaves and crown. Bordex mixture should not be used in Dwarf variety as they are sensitive to copper injury. 2-3 g. of Indofil.M..45 in perforated sachet is used to control bud rot in dwarf variety.
2. Basal stem rot or Thanjavur
wilt
Ganoderma lucidum
G.aplanatum
Decay of roots system, flaccidity of
spindle leaves
browning of outer leaves. Arrest fruit
setting, appearance of
bleeding patches on
basal region on the stem. Ultimately
death of diseased
palms. (2.6 to 13 %
incidences).
Isolation of disease palm. Application of neemcake and Auveofugin or Calixin (0.1%).

Production and Marketing of Coconut in India
Page 30 of 122
1. 2. 3. 4. 5. 6. 3. Stem
bleeding Thielaviopsis
paradoxa 8 – 9 per cent Exudation of dark reddish brown liquid from the longitudinal cracks in bark at the base of the trunk. The bleeding patches spread, dries and turns black due to necrosis of tissues. Leaves in outer whorl turns yellow at premature stage, drupes and dry. The trunk tapers at the apex and crown size becomes reduced. Production of bunches and nut fall is noticed.
Application of coal tar Bordeaux paste to affected part. Application of neem cake and / or 0.5% Calixin to the affected part.
4. Leaf rot Colletotrichum gloeosporioides
Exserohilum rostrafun
Fusarium solani
Blackening and shriveling of distal ends of leaflets in central spindle and younger leaves.
Removal of rotten portion of spindle. Spraying Hexa Consol (Contab 5EC) or Mancozeb (Indofil M-45) or Dithane (0.3%) Calixin 1%.
5. Leaf blight or
Grey leaf spot
Pestalotia palmarum
Necrosis of mature leaves causes extensive leaf blight leading to complete drying of leaf blade and shrivels off.
Spraying 1% Bordeaux mixture.

Production and Marketing of Coconut in India
Page 31 of 122
Important Phytoplasma and Viroid Disease of Coconut
Sl. No.
Disease Causative organism
Symptoms Photo Control measures
1. Root (Wilt)
Disease (Kerala)
Phytoplasma Transmitted by
Vector Stephanotis
typicus bug and plant hopper
proutista moesta.
Flaccidity bending of leaves, yellowing and marginal necrosis of leaflets. Smaller nuts and thin kernel.
Improved Integrated Management Practices of Coconut plantation. Eradication of affected palms.
2. Tatipaka disease (Andhra Pradesh)
Phytoplasma Development of abnormal large crown with dark green inner leaves and subsequent shrinking of crown producing shorter leaves. Affected trees produce smaller bunches with atrophied barren nuts.
Infected trees cannot be cured. Removal of affected palms and prohibiting use of planting seeds from affected area.
Deficiency Disease of Coconut Palm
Sl. No.
Disease Deficiency Symptoms Photo Control measures
1. Crown Choke Disease
(Assam & West
Bengal)
Acute deficiency of boron.
Deformed leaves
severe tip necrosis choked
appearance of frond.
Soil application of Borax @ 50 g. per palm at half yearly application (Feb.-March and August – Sept.)
3.14.10.2 Large number of insect pests also causes considerable losses to coconut crop. It has been reported that the losses in the yield due to Rhinoceros beetle infestation were to the extent of 5 to 10 per cent and about 10 per cent reduction in yield in Kerala State alone. The red palm weevil has damaged the coconut crop in Tamil Nadu up to 11 to 12 per cent and dropped the yield to the extent of 10 to 25 per cent.

Production and Marketing of Coconut in India
Page 32 of 122
The Eriophyid mite, a lately reported deadly pest, which is responsible for heavy damage in almost all coconut growing, states in India in recent years. The gravity of problems could be assessed from the study conducted at location in Coimbatore, Tamil Nadu, wherein it was observed that the estimated loss in copra was to the tune of 52.4 per cent in the infected nuts (Ramaraju et al 2005). 3.14.10.3 Besides, these disease causing etiological agents belonging to Fungi, Phytoplasma and the pests, the coconut palms are also damaged by rodents and nematodes. The damage caused by rats in India to coconut was estimated to be 5 to 10 per cent of the total production. House rats enter the crown of the palm, consume the water and soft meat of the nuts and thus damaged nuts fall from the trees. The burrowing rats bore through the root system and uproot the seedlings causing damage to young palms. It has been reported that about 15 to 20 per cent tender coconuts are damaged by house rats, the intensity of damage was even up to 28 to 30 per cent in coconut cocoa mixed cropping system. The rats can be controlled by using poison bait with zinc phosphate / warfarin. Entry of rats on the trunk can be prevented by fixing mechanical barriers up to 2 meter height from ground level using 40 cms sized galvanized sheets. Furrows should be fumigated using Aluminium phosphate tablets and by placing wax block containing poison bait.
Plant parasites belonging to Nematode species namely Radophol-us-similes a borrowing nematode and Meloidogyne incognita, root-knot attack roots of palms causing rotting of roots, loss of vigour, stunted growth, delayed flowering yellowing of leaves, button shedding and thus reduction in yield. The integrated management of nematodes in coconut plantation includes (i) Application of phorate 10 G @ 100 g per palm twice in a year during May- June and September-October months. (ii) Use of nematode free seedlings or tolerant cultivars or hybrids of coconut and intercrops in infested areas. (iii) Avoid use of banana as shade crop in coconut nurseries.
3.15 Harvesting Practices: Plate – 11
3.15.1 Coconuts are harvested at varying stages of development depending upon their consumption and commercial
utility in the producing states. The nuts must be fully matured when maximum quantity of good quality copra is to be obtained. It is desirable to allow the nuts to fall naturally, so as to have fully matured nuts for good quality ball copra and seed purpose. Besides, coconut oil, desiccated coconut is also an important commercial product for which fully ripped nuts are
Coconut Harvesting essential. Usually, 11 to 12 months old nuts are harvested at varying intervals in about 6 to 10 times in a year depending upon the yield of palms.

Production and Marketing of Coconut in India
Page 33 of 122
3.15.2 In southern states, particularly in the tracts where husk is utilized for manufacture of coir fibers, nuts which are 11 months old are harvested to meet the requirement of coir manufacturers. The best quality of coir fiber is obtained from the husks of green nuts i.e. nuts somewhat immature from the point of view of copra quality nuts. In the states like West Bengal, Assam and Orissa where coconuts are mainly harvested for consumption of coconut water for dinking purpose, the green coconuts or tender nuts are harvested at about 5 to 7 months old. However, in a study conducted to identify cultivars suitable for tender nut purpose in West Bengal, it was observed that at seventh or eighth month after fruit set in it was considered as the month of harvest for use as tender nut so as to get better volume of coconut water along with sugar and minerals. (Poduval et al 1998). With the increasing consumer demand for tender coconut, special care has to be taken while harvesting the tender nuts. The bunches from the tall palms required to be lowered to the ground with the help of rope by the skilled climbers. Since the natural, healthy and clean appearance of green nuts are appreciated and preferred by the elite consumers, it should be free from dirt, discolouration and patches due to injury. The maturity of the bunches has to be ascertained before harvesting. The tender coconuts when meant for water consumption, only 6 months old nuts are harvested. If gelatinous kernels are required along with water, the bunches of 7 months old nuts are harvested. The coconut bunches harvested at 8 months old maturity would provide both kernel and water preferred by some section of consumers. 3.15.3 The periodicity and frequency of harvesting coconuts vary from area to area, depends on the yield of the tree, variety and finally the purpose for which the crop is utilized. In highly productive gardens, nuts are harvested once in a month i.e. on west coast, harvesting of nuts may be possible 6 to 12 times a year. The gardens having low productivity usually harvest the coconuts only 6 times i.e. once in every two months. The areas where husk of nuts for retting is priority, in that area about 10 to 12 harvests are obtained. In Andhra Pradesh 8 to 10 harvests are common in Godavari belt and once in two months in Vishakhapattanam and adjoining districts. In Karnataka state the harvesting of coconut is carried out once in three months and major portion is harvested in the month of March and April every year. In Maharashtra and Gujarat states, matured nuts are harvested about 3 to 6 times in a year and tender nuts are harvested as and when required through out the year. In West Bengal traditionally 80 to 90 per cent of nuts are harvested as tender nuts in about 4 to 6 harvests. In Orissa, harvesting of matured nuts is carried out once in two month’s period i.e. 6 times in a year. 3.15.4 Usually all over the country, farmers practice conventional harvesting method in which coconuts are picked by specially trained, skillful and experienced climbers. Knife sickle or iron hook attached to the plucking end of long bamboo poles are also used for picking nuts. In some gardens in Kerala 2-3 meter long ladders are used for climbing

Production and Marketing of Coconut in India
Page 34 of 122
coconut palms for harvesting nuts. It has been reported that a simple coconut palm climbing device has also been used by the climbers for harvesting nuts. The climbers, on reaching the crown examines the maturity of the bunches and pick the mature ones. Power tiller operated telescopic ladder for coconut harvesting was developed by the College of Agricultural Engineering, Tamil Nadu Agricultural University Coimbatore.
3.16 Storage of Coconut : 3.16.1 Though the storage is an important function to create utility and regular supply of the commodity through out the year, due to variation in the consumption pattern of the coconut, there is wide variation in storage practices and that too for a short duration. The type of storage practiced in the coconut trade is actually for the seasoning and to facilitate husking, shelling, drying to reduce the moisture content of the kernel so as to get the desirable thickness of the meat (kernel) and to increase the yield of copra and oil content. The quality of copra produced after storage is also superior to that is obtained from the freshly harvested nut. The storage of harvested nuts is always beneficial when the nuts are fully ripe. Good quality of copra can only be harvested from fully matured green coconuts. The storage of coconuts which have been harvested, comparatively at immature stage may help in obtaining higher copra content per nut but such nuts are prone to spoilage on storage. 3.17 Supply: 3.17.1 Retention at Farm Level : The entire quantum of coconuts produced are not sold in the market. The farmers generally retain a portion of their farm produce for meeting seed requirement, direct consumption and payment of climber’s wages etc. The quantity of coconut converted to copra for milling purpose varies from state to state depending upon the consumption pattern of coconut and its products. It may be negligible in the coconut producing states, where coconuts are mainly harvested for consumption of tender coconut water and matured nuts for direct consumption as kernel. It may be 90 per cent in the Southern state where the coconuts are exclusively harvested for conversion to copra for extraction of coconut oil. The quantities and percentage share of coconuts retained for various purposes are furnished below.
Table No.9
Quantity of Coconuts retained by Producers (Quinquennial Average Year ending 2004-05)

Production and Marketing of Coconut in India
Page 35 of 122
Source : Field survey. 3.17.2 Marketable surplus: The marketable surplus of coconut after deducting quantities retained by the producers has been worked out and furnished in table No.10
Table No.10
Estimated Marketable Surplus of Coconut (Quinquennial average production Year ending 2004-05)
Quantity : Million Nuts.
Marketable Surplus Production Total retention Quantity Percentage of total
production 12537 1087 11450 91.33
3.17.3 Export/Import: The Export and Import of coconut products reveal grim situation in the country. However, it has been reported that India’s exports earning from coconut products is increasing at the compound growth rate of 20.71 percent per annum and the import of coconut and its products increases the trade deficit in the export earning of the country. Since the rate of growth on the import of Coconut products, during the same period was 33.50 percent per annum (Thomes, 2004), (Annexure - LXVIII).
Table No.11
Export of Coconut Products from India
(Quantity in Tones)
Year 2000-01 2001-02 2002-03 2003-04 2004-05 Average Export 319.93 247.33 473.45 610.32 935.34 517.27
Source : Directorate of General of Commercial intelligence and Statistics, Kolkata.
Sl. No. Purpose of retention Quantity (Million Nuts) Percentage 1. Total Production 12537 100.00 2. Retention for seed 267 2.13 3. Direct consumption 666 5.31 4. Oil Milling -- -- 5. Payment of Wages 154 1.23 Total Retention : 1087 8.67

Production and Marketing of Coconut in India
Page 36 of 122
In fact the increasing export trend of coconut products is on account of the export of the “Coir and Coir products”. However, coconut oil and other coconut product comprise a negligible share in the export market on account of large-scale domestic consumption of coconut and coconut products. However, owing to the medicinal and cosmetic value of coconut oil, virgin coconut oil and tender coconut water value addition to these products has bright future in the international markets. 3.17.4 Net Available Supply of Coconut: The net available supply consists of the total marketable surplus, supplemented by imports, less exports. The net available supply has been worked out on the basis of five years average production ending 2004-2005 (Table No.12)
Table No.12
Net Available Supply
Quantity : Million Nuts.
(* Quinquennium Average on year ending 2004-2005)
Source : Field survey. 3.17.5 Utilization: The entire coconut production in the country is utilized for internal consumption. However, very little quantity of coconut products are exported to other countries. The internal consumption comprises mainly for oil extraction, direct consumption for edible purpose, religious offerings and retention for seed purpose and negligible quantity for payment of wages to climber / pluckers. Thus, the estimated quantities of coconut available for utilization during the quinquennium ending 2004-05 is as given in table No.13.
Table No.13
Estimated Utilization of Available Supply of Coconut in India (Quinquennium average production ending 2004-05)
Quantity : Million Nuts.
Figures in parenthesis indicate the percentage.
Marketable Surplus Imports Exports Net Available Supply 11,450 Nil 3* 11,447
Supply Utilization Production + Import Seed
Purpose Direct consumption and other purpose
Oil Extraction
Export Total
12537 (100 + Nil)
267 (2.13)
820 (6.54)
11267 (89.87)
3 (0.02)
12537 (100)

Production and Marketing of Coconut in India
Page 37 of 122
3.17.6 Demand: The demand for coconuts in the country is mainly for the purpose for which they are utilized in the various form for consumption. It could be seen from the above table that the demand comprises of requirement for seed purpose, direct consumption for edible purpose and milling purpose for extraction of oil for the internal market. The demand for seed and for direct consumption comes to 2.13 per cent and 6.54 per cent per annum; however the bulk quantity, 89.87 per cent goes for milling for extraction of coconut oil and edible copra.

Production and Marketing of Coconut in India
Page 38 of 122
COCONUT SITUATION IN TRADITIONAL AND NON – TRADITIONAL COCONUT PRODUCING STATES AND
UNION TERRITORIES
4.1 The coconut palm being a small land holder’s plantation crop grown in 1.89 million hectare area in the tropical belt of the country extending from Kerala, Karnataka, Tamil Nadu, Andhra Pradesh in south, Gujarat, Maharashtra in west, Orissa and West Bengal in the east, Assam and Tripura in the North Eastern region of India and is a means of living for millions of people inhabiting in the traditional and non traditional coconut growing states and union territories. The islands of Andaman and Nicobar and Lakshadweep are other traditional coconut areas. Since the coconut crop has a national acceptance due to country wide demand either for edible, non-edible or religious purpose, it has triggered keen interest among people of even the non-traditional states to try few saplings in their home stead gardens.
The major socio-economic feature of this plantation crop is that it is
predominantly cultivated in small and marginal holding and with medium resource to poor farm environment having less marketable surplus. It has been reported that the national average productivity of coconut in India is very low i.e. around 40 nuts per palm per year. The low productivity of coconut crop in the country has been on account of several reasons, i.e. lack of adoption of scientific cultivation practices to enhance productivity, which helps in bringing down the cost of production. In most of the small coconut holdings, the soil nutrients and water are limiting factor in crop production. The unique nature of Indian coconut sector is the rain fed nature of crop cultivation coupled with practicing subsistence farming which often leads to low level returns from the holding. It can be seen in the foregoing paragraphs that there is distinct difference in the pattern of distribution of this crop in the country. Kerala, the southern most state situated along the West coast is a major coconut growing state. Except in Kerala and a few small states and union territories, coconut is not grown contiguously but limited to only congenial belts accounting to an insignificant portion of the total arable agricultural area. Kerala, Karnataka, Tamil Nadu and Andhra Pradesh are therefore the four major coconut producing state, sharing 90.8 per cent of the total area, whereas the contribution of other states / union territories is only 9.2 per cent. (Annexure-IVA & IVB)

Production and Marketing of Coconut in India
Page 39 of 122
4.2 Andhra Pradesh : Coconut is an important plantation crop in Andhra Pradesh grown along the coastal belt and adjoining districts. The major coconut growing districts are East Godavari, West Godavari, Sri-Kakulam, Vishakhapattanam, Vijyanagaram, Prakasm, Guntur, Chittore, Krishna Khamman, Nellore, Ananthapuram, Kurnool, Guddapah, Ranga Reddy and Medak. Andhra Pradesh is one of the major coconut growing state which accounts for 5.5 per cent in area and 9.5 per cent in production of coconut in the country. It is grown in an area of 1.053 lakh hectares with annual production of 1158 million nuts and productivity of 11003 nuts per hectare, which is significantly high when compared with other major coconut producing states in the country. East Godavari, West Godavari and Srikakulam alone contribute for 80 per cent of coconut production in the state. In Andhra Pradesh, coconut is grown mainly under irrigated conditions, and Godavari water is the main source for irrigation. Since the major areas under coconut production are irrigated lands, the productivity is on the higher side and higher productivity is mainly attributed to high density planting especially in coastal districts. The East Coast Tall (ECT) variety commercially called as “Desavali” is extensively grown in Andhra Pradesh. The other varieties which are grown are Ganga boundan which is a dwarf variety, Godavari Ganga (ECT x Ganga boundan) a semi dwarf variety, Laccadive-ordinary and Philippine ordinary. In Andhra Pradesh, coconut palms are infested by many pests and diseases. As a result, considerable reduction in yield was found, evidently by the attach of black headed caterpillar, Rhinoceros beetle, Red palm weevil, Eriophyid mite and diseases such as leaf-rot, stem-rot, stem bleeding, bud rot and Boron deficiency. Coconuts in Andhra Pradesh are marketed throughout the year as matured coconuts, which are used mainly for domestic consumption and religious purpose. However, about 20 to 25 per cent of production is consumed as tender coconuts and only 5–10 per cent of produce is converted to copra manufacturing. Even though Andhra Pradesh is one of the major producers of coconut, it is lagging behind in respect to production of various value added products. The milling units of coconut oil are small and unorganized in nature. There are no units producing packed tender coconut water, vinegar, milk powder and other value added products in the state. Some of the existing desiccated coconut powder manufacturing units are also non-functional, only few units are established for the coir manufacturing. 4.3 Andaman And Nicobar Islands : The Union Territory of Andaman and Nicobar Islands have longest history of coconut cultivation possibly next to the Kerala state in the country. The total area in Andaman and Nicobar Islands is about 24746 hectares with a

Production and Marketing of Coconut in India
Page 40 of 122
production of 86.56 million nuts. Though the major area under coconut is in Nicobar district, but it is mostly grown as self propagating crop rather than planned plantation. The climatic conditions in Andaman and Nicobar islands are congenial for cultivation of coconut but the production and productivity of the crop in these islands is very low. The productivity of coconut is about 3500 nuts per hectare, against 7821 nuts/per hectare, of the national average. Productivity of the crop has remained more or less stagnant since last three decades. The average productivity of 23 nuts per palm in the Union Territory is reported to be very low. It has been observed that factors responsible for the low yield in the coconut plantation in Andaman and Nicobar islands are due to unproductive and senile palms, inferior genetic base, poor soil conditions, rain fed nature of crop, high palm density, poor management and inadequate disease control measure. The local varieties of cultivars like Andaman Tall and Katchal Tall yield about 30 to 31 nuts per palm per year. The coconut crop has been grown in variety of soils in Andaman and Nicobar islands from costal sandy loams to black fertile soil. The coconut cultivation system observed in Andaman and Nicobar islands was individual holding having 0.37 hectare to 5 hectare land on which coconut is grown along with other horticultural crops. Cooperative societies have undertaken coconut cultivation on 475 to 500 hectares land and government coconut plantations have been leased out to tribal agencies on long term basis and mostly are located in Andaman district. The Nicobar district has coconut plantation owned by tribal head of the community known as chief or captain. Number of intercrops and mixed plantation are grown in coconut gardens. The common intercrops grown are vegetables like cowpea, snake gourd, radish, okhra, brinjal etc., sweet potato, yam, ginger, turmeric and chillies are cultivated as cash crops. Pepper, pineapple and banana are also planted as mixed crops. Post harvest processing of coconut in Andaman and Nicobar islands is confined to primary processing of coconuts into copra and manufacture of coconut oil by using traditional techniques. Copra is manufactured mainly in the unorganized way on home scale using sun drying process and local drying arrangements during rainy season. It has been reported that there could be nearly 500 small copra making units manufacturing about 7500 metric tones of copra annually. The quality of copra produced is very poor and does not fetch remunerative price. However, kiln types of copra units do manufacture a small quantity of quality copra. There were 17 coconut oil extraction units as per the record of the Directorate of Industries of which 4 units used expeller for oil extraction. The others were using rotary units or locally known as ‘ghani’. All units put together produced only 500 to 700 metric tones of coconut oil which is ¼th of the total capacity of these oil producing units. The reasons attributed for low production of oil are the non-availability of quality copra, at reasonable price, price fluctuation in the

Production and Marketing of Coconut in India
Page 41 of 122
market, low yield of oil on rotary type of units, lack of technical skill and inability to stock the raw material through out the year. 4.4 Bihar : Even though coconut palm is adaptable to wide range of soil and climatic conditions, Bihar was not considered favourable for coconut growing. However, Kosi region in North Bihar has gained momentum in 1987 which comprises places on either sides of the Kosi river. Coconut is grown upto the Nepal border in North Bihar mainly in Katihar, Krishanganj, Purnea, Fabisganj Araria, Madhepura, Saharsa, Khagaria and Supanl districts in Kosi belt. Coconut is grown in Muzzafarpur, Darbanga, Vaishali and Saran districts in North Bihar, situated outside Kosi region. Coconut is also grown in Patna, Gaya, Bhagalpur and Dhumka districts in South Bihar. It has been reported that the coconut is grown in 10,595 hectares producing 33 million nuts in the state. In Jharkhand state, the erstwhile South East Bihar, coconut is mainly grown in Chaibasha near Ranchi. According to Coconut Development Boards estimate nearly 50,000 hectares of potential area in Bihar is available for coconut cultivation, mainly in North Bihar and Ranchi areas of Jharkhand under irrigated condition. However, it has been observed that coconut cultivation on commercial scale is not advisable. Since the minimum temperature prevailing during winter season is not congenial for coconut plantation as it causes injury to inflorescence and leaves of coconut. However, considering the local demand for the nuts for religious and culinary purposes, coconut can be grown as home stead crop under proper care, as the coconut palms in many districts in Bihar and Jharkhand states have the potential to yield about 100 nuts per annum. 4.5 Goa : Goa is the smallest state situated in the Western Coast of Indian Peninsula having Terekhol river on the North-Western Ghat, Arabian Sea on the west. The humid warm climate with little variation in temperature (21-320 C) is favourable for the growth of coconut. The state is divided into North and South Goa. The main crop grown is coconut covering an area of 25068 hectare with annual nut production of 122 million nuts. The productivity of coconut in the state has been estimated at 4868 nuts per hectare and the state average per palm per year is about 30 nuts. The popular coconut cultivars of Goa are Benaulim, Calangut and Nadora. The Benaulim also known as Banawali is mostly cultivated in the southern part of Goa. The colours of fruit varies from yellow, green to red and therefore are known as Benaulim green round, Benaulim red round, Benaulim green long and Benaulim yellow long. The yield varies from 82 to 190 nuts with a mean of 151 nuts per year. The copra content is 143 gms. per nut, and the oil content of copra is about 65 percent. The Nadora cultivar has derived its name from Nadora, the village from where it has been originated. The palm is taller than Banaulim and reaches upto the height of about 9 to 10 meters, average yield is 104 nuts per palm with a range of 50 to 152 nuts per palm. The fruits are bigger than that of

Production and Marketing of Coconut in India
Page 42 of 122
Banaulim. The copra content is 174 gm. per nut and oil content of copra is 64.5 per cent. The Kallingut, like Nadora is grown mainly in Northern part of Goa. The fruits are oblong and green, with annual yield varying from 60 to 120 nuts per palm. The copra content is smaller than that Nadora but higher than that of Benaulim with 148.5 gm. per nut and the oil content in copra is 68 per cent. 4.6 Gujarat : Though Gujarat is traditional coconut growing state, its contribution in area, production and productivity of coconut has been insignificant compared to other major coconut producing states in the country. It contributes only 0.67 per cent area and 0.80 per cent in production at all India level. According to an estimate, Gujarat state has 369.8 thousand hectare land under coconut cultivation with total production of 2.4 million nuts and productivity of 2667 nuts per hectare was reported in the year 2002-03. Junagad, Valsad, Bhavnagar are the major coconuts producing districts in Sourashtra region. Jungagad also contributes 38.13 per cent in area and 37.90 per cent in total production of coconut, followed by Valsad 27.40 per cent in area and 27.09 per cent in production, Bhavnagar district 20.40 and 20.17 per cent, other major districts such as Porbander, Kutch, Surat, Navsari, Jamnagar, Amerely and Baroda also have coconut cultivation and contribute 13.8 per cent area under coconut cultivation and 14.62 per cent in coconut production. Important varieties of coconut grown in Gujarat state are West coast Tall, Pratap, Kamandala, Andaman Tall, Rangoon Khubhasi, etc. Manila, Panaora Tall, yields big size nuts. Cylone Tall, Harmania produces medium size nuts and varieties such as African Tall, schychellius Tall are also grown which produce small fruits. The average yield of coconut has been reported to be 60 to 70 nuts per tree for tall varieties, 100 to125 nuts in hybrid dwarf varieties.
Coconuts after harvesting are brought to the APMC/Markets for sale either
through cultivators or co-operatives societies. In some areas of Gujarat such as Navasari, Surat, etc., the cultivators do not bring their fruits to the markets. They directly sale the nuts outside the APMC yards. Producers who bring their coconuts for sale in the market yard dispose them through open auction system. There are no big units manufacturing coconut products in Gujarat. The units producing coconut products are very small in terms of production and sale of coconut by products. 4.7 Karnataka : Karnataka accounts for 15 per cent of area under coconut cultivation and 10 per cent of total production of coconut in the country. Coconut is the second largest and important horticultural crop of the Karnataka state, occupying 31 per cent of the total area under horticultural crop. The crop is grown in all the districts of the state. The total area under coconut in the state is around 3.33 lakh hectares and the annual production of coconut is 1754 million nuts. The productivity of coconut in the state is

Production and Marketing of Coconut in India
Page 43 of 122
considered as lowest when compared to other neighbouring states. The varieties which are grown are chowghat orange dwarf, chowghat green dwarf, Malayan green dwarf, Malayan orange dwarf, malayan yellow dwarf and Gangabondam. The dwarf variety is grown mainly for tender coconut purpose. The Tall varieties which are grown are West Coast Tall, Coconino, Laccadive ordinary, Laccadive micro, Tiptur Tall, Kappadam, Karradam, etc. Nearly 60 per cent of the coconut produced in the state is utilized as raw nuts for domestic culinary purposes, social cultural and religious purposes. About 25 per cent of the nuts are converted into edible ball copra, desiccated coconut powder and the remaining 15 per cent is utilized as tender coconut for drinking purpose. Prominently, 60–70 per cent of the arrival of coconut is exported to other states i.e. Uttar Pradesh, Punjab, Maharashtra, Rajasthan, Madhya Pradesh, Jammu & Kashmir, etc., about 60 per cent of coconut production in Karnataka is used in domestic items and remaining is dried as copra, most of the copra arriving to the markets is dispatched to other state, where the Karnataka copra is in great demand. The coconut utilized for commercial product preparation is only to the extent of 35-40 per cent, while 55-60 per cent is consumed for food and beverage purposes. Milling copra continues to be the major coconut product in Mangalore market. Where as Arisikere and Tiptur markets cater to the ball copra which is exported to North India. Maddur market is mainly trading the tender coconuts which are sent to other states for consumption of tender coconut water. The trade in tender coconut in the state is very popular, as tender coconuts have fairly good demand in most of the cities apart from the demand from the upcountry buyers. It has been observed that along the busy state highways and national highways like Bangalore – Mysore, Bangalore – Pune, etc, temporary retail sales outlets for tender coconut have been established at different points to meet the demand of tourist and other travelers. A large number of cycle hawkers are also involved in the retail selling of tender coconuts. Tender coconuts of Tiptur Tall variety is normally used for this purpose.
The coir industry is an important cottage industry in the rural areas of the state, providing gainful employment to many villagers. There are 330 units registered with coir board manufacturing coir products in Karnataka which are located in Tuymken, Chitoradnya, Bangalore, Hassan, Mandya. Out of these 330 units, 50 units are fibre extraction units, 30 units make curved ropes and 30 units make yarn, remaining units are manufacturing coir products. 4.8 Kerala : Kerala, literally meaning the land of coconut which alone occupies 50 per cent of the arable land and accounts for 44 per cent of production. Over a long period, there has been continuous expansion in area under coconut cultivation. During

Production and Marketing of Coconut in India
Page 44 of 122
the period 1981-82 to 1991-92, the acreage grew at a rate of 3.57 per cent per annum followed by an increase at a rate of 2.03 per cent per annum during 1991-92 to 2001-02. A distressing factor on the productivity front has been deceleration of yield at the rate of 0.25 per cent per annum in the nineties at the aggregate level. During the period 1991-92 to 2001-02, the yield improved slightly by 1 per cent per annum. However, its contribution of 44 per cent indicates low productivity as compared to National average. The largest coconut producing state occupies only the 9th place in terms of yield in the country. It is one third of the yield of 19667 nuts per hectare recorded in Lakshadweep which is placed in a similar agro climatic condition. Coconut is widely cultivated in all the 14 districts of the states. The concentration areas of production are the districts of Kozhikode, Thiruvantahapuram, Kannur, Malapuram, Thisiur, Kolliam, etc. During the year 2005-2006, the total area under coconut in the state was 900 thousand hectars with total production of 5895 million nuts per hectare and productivity was 40 nuts per palm per year.
The most popular varieties of coconut cultivated in Kerala are West Coast Tall
(WCT), TxD and DxT. Farmers in the state make use of both rain fed and irrigated systems in coconut plantation. However, a few progressive farmers follow irrigated farming and good management practices. Though the scientific recommendation is for 180 coconut trees per hectare, farmers generally plant more seedlings per hectare. Mixed farming practice is very common in Kerala. Inter cultivation practice, with Tapioca, sweet potato, yam, colocasia, ginger, turmeric, pulses, banana, pineapple, pepper, spices etc., is followed. Normally, farmers sell coconut immediately after harvest but few farmers store them for 2 to 3 months. It has been reported that the loss in storage is about 1 to 2 per cent due to sprouting and quality deterioration.
In Kerala, tender coconut harvesting is very less. It is estimated that less than 2 per cent of the total nuts produced are marketed as tender nuts. Major portion of tender coconut marketed in towns, cities, tourist and pilgrimage centers comes from Tamil Nadu and Karnataka, where special varieties suitable for tender nuts are cultivated commercially, which is not the practice in Kerala, and therefore, harvesting of tender coconut in Kerala is negligible.
Harvesting of matured coconut is a traditional practice in Kerala. Since, copra
making, oil extraction and coir making are principal activities of industrial importance. About 70 per cent of matured nuts are converted into copra and out of the total copra produced; about 85 per cent is milling copra and 15 per cent in the form of edible ball copra. About 30 per cent of the nuts are utilized for culinary and other purposes, including dispatches to other States. About 80 per cent of the milling copra is converted into oil and the rest along with the ball copra is dispatched to other States.

Production and Marketing of Coconut in India
Page 45 of 122
The coconut based economy of Kerala can expect a revival from the negative
impact of liberalized imports only when the profitability of coconut farming is declined from the price behavior of coconut oil. The average size of coconut holding in Kerala is only 0.25 hectare. Mono cropping models practiced do not support the livelihood security of the dependent families. It has been observed that Kerala has not achieved noticeable progress in the utilization of the multiple products of coconut palm for value addition both at the farm-household and community levels.
Possibilities are being explored by the authorities in Kerala state for the export of
nuts of Chughat Orange Dwarf variety. Demand for fresh tender coconut is also high in many states within the country. Marketing of tender coconut will create opportunities for enhancing on-farm income of farmers and employment at different levels. These products find acceptance not only in the markets of the respective countries but in the international markets too and shall constitute one of the major sources of export earnings. The coconut products made use of by skilled artisans are wood, shell, fibre and spate and some of the artifacts are valued for their aesthetic quality and also for their utility as household appliances. In Kerala many rural artisans are engaged in handicrafts for their livelihood. Although manufacture of coconut based handicraft has been in existence as a traditional activity in the State, its development into a viable and flourishing enterprise has been inhibited because of the absence of facilities for design, training and organized marketing. New designs in accordance with changing consumer preference and training in the production of modern artifacts are essential prerequisites for competing with quality products emanating from other countries. Equally important is the opportunity for marketing the products in the domestic and export markets.
The coconut products which show potential, for organized production in the State
are desiccated coconut, partially defatted coconut flour and coconut water and milk based products. Sweet toddy or `neera’ can be harvested / tapped as a health drink, the product is capable of fetching great monitory gain for the state. It has been reported by a local researcher that, even if just 1 per cent of the palms are subjected to tapping, it would give toddy worth Rs 10,000 crore. Introduction of canned fresh toddy for domestic and export marketing will prove to be a viable activity. Technologies for the canning of fresh toddy are available which are only to be pilot tested for adopting the most appropriate one under local situations. The farmers’ co-operatives, which organize toddy tapping and sugar production or even individual entrepreneurs, may be permitted to undertake the activity under proper control. In Kerala, income from coconut holdings will register a sharp increase with the direct involvement of registered farmers’ organizations in toddy tapping and the subsequent processing of sweet toddy. Apart from the production and marketing of different forms of sugar, these organizations could

Production and Marketing of Coconut in India
Page 46 of 122
also serve as the supply source of toddy to the local toddy parlours. Coconut cheese is another product made from skim milk in combination with non-fat dry dairy milk powder. This has already evoked consumer interest in the international markets and the opportunity could be exploited profitably by Kerala. Coconut oil has great economic importance for the state of Kerala but there is a declining trend of coconut oil production in the state from 1998–99 to 2002–2003. During 1998-99, the production of edible coconut oil was 34,000 thousand tonnes. During 2002-2003, it has declined to 28,900 thousand tonnes. Though copra is made out of coconuts and coconut oil from copra, the price of coconut is fixed on the basis of prices of coconut oil in the market and as such, the economy of coconut based farming in Kerala till date is mainly dependent on a single coconut product i.e. coconut oil.
Traditional industries manufacturing items as coir, handlooms, and handicrafts
which employ around one million people. Around 1.8 lakh small-scale industries provide employment to 909,859 Keralites, while some 511 medium-and-large-scale manufacturing firms are located in Kerala. Kerala, hails coconut as the `tree of heaven' but so far it has failed to exploit its most potential produce. The main reason for the comparatively low material balance of finished coconut products in Kerala is the small size of nuts and the low turn out of kernel of the West Coast Tall (WCT) variety which occupies over 85 per cent of the area in the state. 4.9 Lakshadweep : Lakshadweep, the smallest union territory of Indian Union, is a group of islands in the Arabic sea with a total area of 32 km. consisting 22 islands and 5 attached islets out of which only 10 are inhabited. These coral islands lie about 225-450 km. away from the Kerala coast. The climate in the island is almost similar to the west coast of Kerala with an average annual rainfall of 1600 mm and temperature varies from 240C to 300C. Coconut is an important plantation crop of all the islands since centuries. The islanders do not follow definite pattern for planting coconut seedlings as far as spacing is concerned. The farmers practice closed planting and strikingly plant more seedlings on the boundary of their field which has resulted in the over crowding of palms on the islands. It has been reported that on an average 400-500 palms of all ages are grown in 1 hectare of land as against 172-200 palms recommended for optimum yield. Andrott is the largest island inhabited with an area of 4.84 sq.km., of which 464 hectare are under cultivation. Coconut is a major crop grown in about 450 hectare of the cultivated area. On this islands coconut cultivation is practiced at a very high density of about 100-200 plants in an acre. The coconut palm population in Lakshadweep islands is about 0.6 million with production of about 30 million nuts per annum. The average annual yield per bearing palm in the island is about 58 nuts. The average per hectare

Production and Marketing of Coconut in India
Page 47 of 122
yield of nuts is estimated to be 12718. There are two varieties of coconuts cultivars widely grown in these islands i.e. Laccadive ordinary and Laccadive micro. The high density plantation affects the productivity and utility of coconut palm. The Laccadive ordinary variety gives an average yield of about 100-140 nuts per year and Laccadive micro variety yield about 280 nuts per year. Though Laccadive micro variety has high yield but has alternative bearing tendency and therefore, has low market value as compared to Laccadive ordinary. Therefore, the farmers are not keen about the palm of Laccadive micro variety owing to low productivity on account of alternative bearing. The situation could lead to low plantation of this variety from the existing bio-diversity of the island. Besides, these two varieties, green dwarf and yellow dwarf are the other cultivar grown in these islands. It has been reported that the use of chemical fertilizer has been banned in Lakshadweep islands to prevent chemical contamination of ground water. The emphasis is on the organic manuring of coconut palms. The products of coconut used by islander for their daily consumption are coconut oil, jaggery, vinegar, copra and sweet toddy. The common pest and diseases affecting these organically cultivated coconuts are Rhinoceros beetle, mealy bugs, nuts crinklier, and rats. Apart from these pests, coconut palms from the island are infested by the diseases like bud rots and stem bleeding diseases. Coconuts on islands are harvested during the seven months in the non-monsoon period from October to April. There is no definite time for harvest as in the case of main land where nuts are harvested once in 45 days. It has been observed that non availability of climbers could be the reason for irregular harvesting. Similarly, nuts are not harvested during the monsoon due to lack of facilities for drying the copra, However, during the dry season, 3 to 4 harvests are made and nuts are utilized for copra making by sun drying and taken to the main land for selling. 4.10 Maharashtra : Coconut is primarily a small holder’s plantation crop in Kokan region in Maharashtra State. It is cultivated as an allied crop in varied crop-mix. About 92 per cent of the total area in Konkan region is under coconut farming. The climate and the soil of the region favour abundant cultivation of coconut. The coconut crop is grown in cluster farming and not on a contiguous manner. In spite of agro climatic compulsion and cluster farming of coconut in Konkan region, Maharashtra ranks sixth in cultivation of coconut covering 0.02 million hectares of land which contribute 1.13 per cent of the total area under cultivation in the country, with an average yield of 11350 nuts per hectare and ranks second in yield per hectare. In Maharashtra State, Konkan region is the major coconut growing belt and about 92.34 per cent of the total area and production of coconut is concentrated in this region. Konkan region is the coastal plain of Maharashtra state in the Western India with Arabian sea on the West and Western ghats on the East. The region composes of

Production and Marketing of Coconut in India
Page 48 of 122
Ratnagiri, Raigad, Sindhudurg districts and greater Mumbai and has hilly terrain and extensive sea coast of 720 kms. Sindhudurg district accounts for 58.44 per cent of the total area under the coconut crop among the major four coconut growing districts, with 42.24 per cent production and stand 1st , whereas Ratnagiri stands second. It has been reported that though Sindhudurg and Ratnagiri district tops in area and production, the productivity of coconut in the region is highest in Thane followed by Raigad district. The productivity of coconut is 82 nuts per tree in Thane and only 45 nuts in Sindhudurg. The reason for higher productivity of coconut per tree in Thane district is attributed towards fertility of soil, assured irrigation and symbiotic benefit from complimentary inter-crops. Most of the established coconut plantations in Konkan region are of the variety West Coast Tall (WCT). However, on the basis of superior morphological, inflorescence and fruiting characteristics accompanied by high yield potential, the Konkan Krishi Vidyapeeth, Dapoli in Ratnagiri district released the cultivar ‘Banavali Green Round’ during the year 1987 named as ‘Pratap’ for commercial cultivation in the Konkan region. Since then the Pratap variety is cultivated on large scale in Ratnagiri, Sindhudurg, Raigarh and Thane districts. Besides these varieties, the dwarf varieties like Andaman Dwarf, Nicobar Dwarf Laccadive tall and dwarf, and hybrid varieties TxD, DxT and VHC-1 are also planted in the region. The other districts in Western Maharashtra state like Ahmednagar, Nasik, Dhule and Jalgaon district in North Maharashtra have also taken up coconut plantation on small scale, where canal water for irrigation is available. In the Marathvada and Vidarbha region of Maharashtra, the coconut palms are grown as an ornamental plant on very small scale. Matured coconuts are used for edible, social and religious purposes in the entire State, whereas 95 per cent of the total productions of coconut in Thane district alone goes for tender coconut consumption to Mumbai Market. The traders mostly from Malbar area of Kerala, take the plantation on lease basis for 15 months at one time contract. The nuts are harvested at 45 days interval and sold through their outlets in Mumbai. In Raigad and Ratnagiri districts about 80 per cent of the production is used as mature nuts for edible and socio-religious purpose and only 20 per cent as tender coconut water. Toddy tapping is also popular in the region for Mumbai market. The coconuts producer takes the produce to APMCs for sale. The cooperative societies are also functioning in the region and trade the coconuts in APMCs. Direct sale of coconut by the farmer has also been reported in the interior areas of the region. In APMC yards in these districts, open auction system is in vogue.

Production and Marketing of Coconut in India
Page 49 of 122
4.11 Orissa : Coconut is one of the most important plantation crops of Orissa. The area under coconut production in the State is about 43.3 thousand hectares producing 296.05 million nuts. The present productivity of the crop has been reported to be 8741 nuts per hectare. About 85 per cent of the area and production of coconut comes from the undivided coastal districts of Puri, Cuttack, Balasore and Gunjam. In coastal coconut growing belt of Orissa 17 full and dwarf varieties were identified based on size, shape and colour of nuts. Sakshigopal Tall, a distinct member of East Coast Tall group is found in most of the areas. The other important local variants are Bana reported to be superior yielding i.e. more than 80 nuts per palm per year. Oddisi Giant Dhila and Tahaji were recorded to be the largest and heaviest nut with higher husk percentage. Dhanei and Surya Bana are dwarf variety with ivory skin colour. The Sakshi Gopal Regulated Market for coconut in Puri district is the most important market for matured nuts and accounts for nearly 70 per cent of the total arrival of the matured nuts. However, recently Behrampur, Sambalpur, Raurkela, Bhubaneshwar and Balasore have also developed the independent assembling and marketing centre of coconut in the state. It has been reported that about 20 per cent of the total coconut product in the state are consumed as tender nuts and 5 per cent are retained by the farmers for household and seed nut purpose. About 42 per cent of the coconut production is consumed in the state itself and 33 per cent are exported out of the state to Bihar and Madhya Pradesh. Since, the tender nuts are available through out the year, they are sold all over the state along highway junction, bus stand, railway station and rural market centres. The demand increases to the maximum during March to June. It has been roughly estimated that about 52 to 200 nuts are sold by each retailer. The size of the tender nut is smaller as compared to the coconut produced in other states. However, tender coconut water is quite sweet and palatable. It has been observed that normally 4 to 6 month old nuts are harvested as tender nut in the state. Even though Orissa is a coconut producing state, it has been reported that there are no coconut oil producing unit operating in the state. However, there is a good market for coconut oil for toiletry use with annual consumption of about 8 thousand tonnes per year. Puri and Gunjan district have many small scale nut fibre and coir manufacturing unit in the state. There are about 30 small unit producing coir and coir products in Orissa. The consumption of edible copra is not much in the state and confined mainly to Cuttack, Bhubaneshwar and other industrial township. According to an estimate, around 500 tonnes of edible copra is consumed per annum. The demand is maximum during the festival season. The desiccated coconut is mainly consumed by the biscuits, bakery and sweets manufacturing industries. About 45 tonnes of desiccated coconut is consumed in the state. There are few manufacturing unit in private and cooperative sector located in Puri and Bhadrak district. Orissa has a very good potential for production and post harvesting processing of coconut in the state, but due to wide spread disease like aphid

Production and Marketing of Coconut in India
Page 50 of 122
mites has brought down the productivity of old plantation to a miserable situation. Moreover, lack of integrated development approach for production of coconut has stalled the further expansion and development of coconut industries in the state. 4.12 Tamil Nadu : Coconut is produced in all the 28 districts of Tamil Nadu state. The area under coconut in Tamil Nadu is about 3.52 lakhs hectares with a production of 4357 million nuts whereas, the productivity of coconut is 12382 nuts per hectare and stand next to West Bengal with 12601 nuts per hectare at the national level. Though the coconut is produced in all the district of Tamil Nadu, highest production has been reported in the districts of Coimbatoor (96072 hectare 828.7 million nuts), Tanjavur (24822 hectare, 307.9 million nuts), Dindigul (22801 hectare, 273.8 million nuts,), Kanayakumari (22589 hectare, 252.8 million nuts), Dharmpuri (21515 hectare. 218.9 million nuts).
Two distinguishable varieties of coconut i.e. tall and dwarf are cultivated in the state of Tamil Nadu because of cross-pollination in tall, variations do occur within the same variety. The varieties, which are more suitable for Tamil Nadu states, are East Cost Tall (ECT), West Coast Tall (WCT), Veppankulam - 3 (VPM-3), Andaman ordinary, a tall variety was released as VPM 3 during 1994 VHC-2 (ECT x MYD) a hybrid variety comes to bearing in 5 years (43 months - time taken to flowering).
For supply of quality coconut seedlings to the farmers, various coconut
development programme have been taken up in Tamil Nadu. twenty seven Coconut Nurseries to produce Tall and TxD seedlings and two mother palm gardens for the production of Tall nuts are functioning to fulfill the needs of farmers. The seedlings thus produced are sold to farmers @ Rs.12 per tall seedling and Rs.20 per TxD seedling. Area Expansion under Coconut scheme is implemented in the State with the aim to increase the area under Coconut plantation with 100 per cent assistance from the Coconut Development Board. The Coconut Development Board is providing a sum of Rs.4000/- per hectare as subsidy towards the cost of seedlings, digging pits, planting and other expenditure for establishing new plantations in the first year. In the second year another Rs.4000/- is provided to meet the cost of maintenance. Total Rs.8000/- per hectare is extended as subsidy for two years as direct funding by Coconut Development Board, Kochi. The Coconut Development Board has extended assistance for area expansion of 300 hectare with the financial allocation of Rs.18.60 lakhs during 2006-2007. To encourage establishment of private coconut nurseries in the state, the Coconut Development Board is also extending assistance at the rate of Rs.3.00 lakhs to small nurseries and Rs.6.00 lakhs for big nurseries. It has been reported that the assistance was being extended on need basis, this programme is proposed to be implemented directly by Coconut Development Board at a cost of Rs.17.00 lakhs during 2006-2007. In order to improve the productivity of Coconut plantation, a Centrally Sponsored scheme of

Production and Marketing of Coconut in India
Page 51 of 122
Integrated Farming in Coconut Holdings for Productivity Improvement is implemented with cent per cent assistance through Coconut Development Board in the state. The Component under the scheme envisages removal of senile and diseased trees, laying out demonstration plots and organic manure units. “Tamil Nadu Coconut Development Authority" has been established by the state to solve problems in production, development of value added products and to explore the export potentials.
According to the Coir Board, Tamil Nadu stands first in the production of brown
coir fibre in the country, accounting for 43 per cent, but its focus on value added products is almost negligible. The Coir Board grants financial assistance up to 25 percent of the cost of equipment and infrastructure facilities with a ceiling of Rs.1.5 lakh for setting up new Fibre/Spinning rope and Matting / Rubberized coir unit in the private sector. There are 5,567 coir units, 937 Coir marketing centers, 167 coconut oil production units, 2 desiccated coconut powder production units and one charcoal production center in Tamil Nadu. Co-operative organizations and Government agencies have also entered the field of processing and marketing of coconuts. The coconut Development Board is marketing limited quantity of coconut oil and non-traditional coconut based products through its sales counters.
Marketing of coconut, copra and coconut oil is mainly in the hands of private traders in Tamil Nadu. The Government agencies intervene in the market in times of price crash by procuring copra at the support price fixed by the Government of India. The Assistant Director of Agriculture, Department of Agriculture, and Government of Tamil Nadu in different districts/areas where coconut is largely cultivated are issuing identification cards to the coconut farmers. After proper verification and certification by the officials of the Department of Agriculture and Revenue Department the farmers are entitled to sell the copra to National Agricultural Co-operative marketing Federation (NAFED), Government of India through TANFED (Tamil Nadu Agricultural Federation). NAFED procures copra from the farmers through TANFED, which is assisted by other co-operative marketing societies in Tamil Nadu. The coconut farmers sell their dried copra to the NAFED. Quality and quantity of the copra is verified by the NAFED officials. Currently the copra is being procured by NAFED at six different places viz., Pollachi, Udumalpet, Palladam, Thiruppur, Avinashi and Kinathukadavu in Coimbatore district.
Thus increasing the productivity, reducing the cost of production, integrated
farming, farm level processing, proper value addition, product diversification and by-product utilization coupled with effective marketing strategies and market promotional activities can definitely make the coconut industry more competitive and sustainable in the state of Tamil Nadu.

Production and Marketing of Coconut in India
Page 52 of 122
4.13 Pondicherry : Union Territory of Pondicherry comprises of four districts, namely Pondicherry, Karaikal, Mahe and Yanam which lie scattered in the South India. Pondicherry, the capital of the Union Territory spread in 219 sq.km area, and bounded on the east by the Bay of Bengal and on three sides by Tamil Nadu. Karaikal is in the east cost spread over 161 sq.km area, Mahe is in the Malbar coast surrounded by Kerala with 9.89 sq.km area and Yanam with 205 sq.km area situated adjoining the East Godavari district of Andhra Pradesh. Nearly 40 per cent of the population of the Union Territory is engaged in agriculture and allied profession. Paddy is predominant crop cultivated in 80 per cent of the area followed by pulses. Though, coconut is not a major plantation crop in this region, it is cultivated as mixed crop alongwith arecanut, condiments and spices. Mahe region contributes major plantation wealth of this Union Territory. The total area under coconut plantation in Pondicherry is 2.3 thousand hectare with a production of 22.3 million nuts and the productivity of 9696 nuts/hectare. As far as the varieties are concerned, the tall and dwarf varieties are grown in Pondicherry. There were 66 registered units involved in the production of coir products but only 40 are functioning at present and two of them are de-fibre units. The Coir Development Board has selected Pondicherry as one the states for an interventional programme to promote and develop the coir industry under the central scheme. 4.14 West Bengal : West Bengal is an important coconut growing state in the eastern region and ranks fifth in terms of area, production and productivity of coconut in the country, having 0.02 million hectares of area under coconut cultivation in the state, i.e. 1.03 per cent of the total area and production of 3.24 million nuts i.e. 2.19 per cent of the total coconut production in the country. In West Bengal, coconut is mainly grown as homestead land crop and gradually gaining the status of plantation crop in the state. About eighty per cent of the coconut production is harvested as tender nuts due to age old habitual consumption habit of coconut water as natural drink by the inhabitants in general. The high intensity consumption of tender coconut water by the local population in West Bengal may be attributed to the realization of its medicinal and therapeutic uses by the commoners. The main coconut producing area in the state falls under districts of North 24 Paraganas, South 24 Paraganas, Murshidabad, Midnapore, Howrah, Burdwan, Hoogly and Nadia. The coconut plantation has also gained considerable importance in Jalpaiguri and Cooch Bihar districts in North Bengal. North Dingjpur, South Dinajpur and plain areas of Darjeeling in Northern part. Traditionally most of the homestead gardens have tall varieties of palm, viz. ECT, WCT, Philippines ordinary, Jamaica tall and hybrids Malayam yellow dwarf, Malayam orange, Dwarf (MGT). In recent times dwarf varieties are gaining popularity in the state because of there early bearing characteristic and dwarf stature of the palm.

Production and Marketing of Coconut in India
Page 53 of 122
4.15 Coconut in the North Eastern Region : North-Eastern region comprising states of Assam, Arunachal Pradesh, Tripura, Manipur, Meghalaya, Mizoram, Nagaland and Sikkim accounts for nearly eight per cent of the country’s geographical area. The topography of the region ranges from hills and mountain to reverine plains and plateaus. The climatic condition in the region varies from temperate to sub-tropical and tropical. The agro-climatic conditions of the region, varied soil types and abundant rainfall are favourable for cultivation of horticultural crops especially plantation crops. Coconut is one of the most popular crop grown for a long time especially in Assam state and in recent times in others N.E. states. The area and production which were 11,000 hectares and 60 million nuts, respectively, during 1985–86, have now increased to 40,000 hectares and about 178 million nuts, in the North Eastern Region. The cultivation which was confined to Assam, Tripura and to some extent in Manipur, has now spread to states like Nagaland, Mizoram, Arunachal Pradesh and Meghalaya due to efforts made by Coconut Development Board. 4.15.1 Assam : Assam is naturally enriched with favourable soil and climatic conditions for coconut plantation, yet the coconut is cultivated as homestead crop in the state. The homestead plantation of coconut has been observed on the northern bank of the river Bramhaputra and selected areas in the southern bank as a homestead crop in sporadic manner. Since coconut is ritually esteemed in the social and religious life of the people in the state, the nuts are used for religious purpose and for consumption as tender nuts.
In Assam coconut cultivation is mainly concentrated in Bramhaputra valley. The coconut production in the state has shown increasing trend in the last two decades. In 1999-2000 the production of coconut was 150.1 million nuts from an area of 20238 hectares, which further increased to about 161 per cent in production and 152 per cent in area as compared to 1985-1986. However by 2004-05, there was marginal increase in area i.e. 21.3 thousand hectares, with total production of 154.3 million nuts. The coconut palms are grown in almost all the twenty three districts of Assam. Among these districts, Nagaon leads in area with 5035 hectares and production of 60.72 million nuts which alone comes to 40 per cent of the total coconut production of the state. Kamrup and Nalbari districts are next to Nagaon in area under coconut plantation. Coconut plants are mainly grown as rain fed crop without much care or crop management system. The other districts in which the coconut cultivation is scattered are Nalbari, Barpeta, Morigaon, Darrang, Kamrup, Sonitpur, Karimganj and Cachar. The most adopted variety of cultivar grown in Assam is ‘Assam Green Tall’ named as Kamrupa variety. The other varieties released for cultivation in Assam are Assam Tall, Bengal Hazari, Bengal selected WCT, TxD hybrid ‘Chandrasankaran’ variety has also been recommended under the agro climatic condition of the state. Coconut being a monocrop is not economical; high-density-multi-species cropping
Production and Marketing of Coconut in India
Page 54 of 122
system is promoted among small holding farmers for maximizing return per unit area of land. Coconut crop in Assam is comparatively free of many diseases. The important disease affecting coconuts are bud rot and stem bleeding. Recently, Gonoderma wilt, has been reported from several parts of Assam. Major pest of coconut are Rhinoceros beetle and Red palm weevil. The Coconut Development Board had released subsidy for new plantation to about 17800 beneficiaries under the area expansion scheme covering 326 hectares. Further, from 1985-86 onwards, an incentive subsidy @ Rs.8000/- per hectare was provided to individual growers for new planting of coconut. In spite of the favourable agro-climatic condition for the coconut cultivation in Assam, the growth in this sector has been sluggish on account of planting of sub standard seedlings and non-availability of adequate ‘Kamrupa’ variety released by the Assam Agricultural University for planting, lack of scientific management practices by the farmers, improper nutrient management, lack of regular manuring and fertilizer application practices. Boron deficiency is very prominent in all the district of the state. Further the outbreak of ‘Gonoderma’ disease is epidemic in some district, lack of infrastructure for irrigation and absence of post harvest mangement infrastructure facilities for processing, marketing of coconut products, are some of the problems in the way of commercialization of coconut industry in Assam. 4.15.2 Arunachal Pradesh : Arunachal Pradesh is endowed with its undulating topography and varied agro-climatic conditions. The humid and hyperthermic climate in foothill region is quite suitable and congenial for growing coconut. The Coconut Development Board, under the area expansion programme brought an area of 300 hectares under coconut cultivation. The coconut area falls in parts of Changland, Teju and Passighat districts. Besides, these districts, certain area like Mahadevpur, Namsai, Bordumsa Deomali, Roing, Sonpura have been found comparatively suitable for coconut plantation. 4.15.3 Manipur : In Manipur, about 20,000 hectares has been estimated as potential area for coconut cultivation. It has been reported that some area of Chandel district near Moreh, Jiribam of Imphal East district, Tousem Sub-division of Tamenglong and parts of Kamjong and Ukhrul bordering Myanmar are suitable for growing coconut. In 1989-90 with the assistance of Coconut Development Board, 840 seedlings were planted covering 10 hectares of land in the state.

Production and Marketing of Coconut in India
Page 55 of 122
4.15.4 Meghalaya : Meghalaya, states do have certain tracts where coconuts are grown in homestead gardens. In Meghalaya, about 5000 hectares land estimated to have potential to grow coconut. The central plateau of Garo Hills and planes bordering Assam are the coconut growing zones. By the year 1999-2000, the state had 1.70 thousand hectare land under coconut plantation and production of 5.21 million nuts with productivity of 3065 nuts per hectare. 4.15.5 Mizoram : Mizoram has the lowest plantation of coconut i.e. 0.28 thousand hectares producing 0.64 million nuts with productivity of 2857 nuts per hectare. The total estimated potential area has been reported as 5,000 hectares. Parts of Aizwal and Lunglai districts adjoining Assam and Tripura are the coconut growing areas. 4.15.6 Nagaland : Nagaland is a non-traditional area for coconut cultivation, where coconut palms are found as an ornamental plant in the back yard plantation of the local population. The tropical climate in the foot hill area and temperate climate in the hilly region with abundant rainfall spread over seven months offers some scope for coconut cultivation as plantation crop. The foot hill belt of Nagaland bordering Assam state from Jalukie area in Kohima district to Tizid valley in Mon district, Wokha and Mokochang districts are identified as suitable zones for coconut cultivation. The Coconut Development Board has created awareness among the farmers of Nagaland and introduced area expansion scheme under coconut cultivation. In the year 1992-93, the area covered under the scheme was 642.94 hectares i.e.47.278 per cent of the total area estimated under coconut cultivation. The scheme covered 733 beneficiaries who received the subsidy or Rs.22.518 lakhs. The Coconut Development Board, Government of India was instrumental in establishing Regional coconut Nursery as State Horticultural Nursery at Dimapur to provide quality planting material to the farmers.
4.15.7 Tripura : Tripura is a hilly state in North Eastern Region of India having suitable soil, hot and humid climate for favourable growth of coconut palm. Coconut cultivation was initiated in the state as homestead garden and on the boundary bunds of ponds. Although, coconut thrives well in Tripura but the productivity is lowest in the country due to planting of poor quality seedlings and lack of adoption of scientific management practices. In Tripura during 1999-2000, the total area under coconut was estimated to 9100 hectares and production of 7.5 million nuts. The numbers of bearing and non-bearing palms were 786820 and 866428 respectively. The productivity of 824 nuts per hectare is lowest in the country. The coconut plantation in Tripura is comparatively free from common disease affecting the coconut palms. The major pests affecting coconuts are Rhinoceros beetle and Red palm weevil, termite, rat, squirrel and others are causing problems in different areas in Tripura.

Production and Marketing of Coconut in India
Page 56 of 122
The Coconut Development Board under the Ministry of Agriculture, Government of India has undertaken expansion of area under coconut in Tripura since 1982, under the programme minimum number of seedlings to be planted was 10 numbers and the maximum limit for availing subsidy was 4 hectares. The present rate of subsidy is Rs 8000 per hectares. The coconut grower, who plants minimum 10 seedlings, can get Rs.250 as a subsidy, in both first and second year. The area covered under expansion programme in 1985-86 was 54.686 hectares with number of beneficiaries 402 by 1994-95, the area covered increased to 172.2 hectares with number of beneficiaries as 2344, in the year 2000-01, in the area expansion programme, it covered 46.049 hectares with the number of beneficiaries as 616. Thus, the total area covered was 1098.694 hectares and the number of beneficiaries were 18,973 with total subsidy distributed was Rs.29, 03157.

Production and Marketing of Coconut in India
Page 57 of 122
MARKETING PRACTICES
5.1 Marketing of coconut like that of any other horticultural commodities, notionally has two aspects i.e. the ‘marketing activity’, in which sellers and buyers have mutual coordination in each other’s activities, where goods and services from producers move through certain channels by conscious application of marketing tools. The other aspect is the ‘marketing promotional activity’, which comprises of gathering information, data, compilation, analysis, interpretation of the data and passing the resulted valid information to farmers, traders, business organizations and other concerned agencies to facilitate marketing functions. The tools used for market promotional activities are marketing research, advertising and effective coordination between producers and consumers. While marketing promotional activities play supporting and strengthening role to the marketing activity, however, the later requires professional and commercial skill. 5.2 Marketing of coconuts differs from that of other fresh fruits due to natural durability of coconuts, which are sold as fresh tender nuts as well as matured water nuts and dry nuts. Since coconut is mainly cultivated in Southern states viz., Kerala, Karnataka, Tamil Nadu and Andhra Pradesh and nominally in coastal area of Maharashtra, Goa, Gujarat, Orissa and West Bengal etc., the Marketing practices followed are more or less similar in nature. It has been observed that they do not differ much except where the post harvest practices change on account of the form of the coconut and coconut products consumed in that area.
Indirect mode of disposal of coconuts as a strategy is more popular and widely adopted by coconut farmers. This indicates that channels, intermediaries play a major role in both assembling and equalization functions in marketing of coconuts. Coconut farmers who depend on direct channel are those who have comparatively better financial base than other categories of farmers, provided with infrastructure facilities and nearness to marketing centers. This further shows that coconut farmers with their own constraints are forced to depend on marketing intermediaries for disposal of coconuts. If they are to be encouraged to exert influence on the functions of equalization, organized marketing bodies should come forward to tackle the problems of farmers holistically through integrated measures.

Production and Marketing of Coconut in India
Page 58 of 122
5.3 Coconut farmers have two channels for disposal of their coconuts. One is the direct channel and the other one, an indirect channel. Indirect channel is the most prominent channel adopted among coconut farmers. Direct channel is very simple while the indirect channel is very complex. Based on their mode of disposal of coconuts, four types of coconut farmers have been observed. They include lesser farmer, opportune farmers and farmer adopting mixed practices. Nearly half of the coconut farmers in general and two third of marginal and small farmers in particular have been observed adopting leasing as the mode of disposal of their coconuts. The financial crises especially the need for money to redeem prior debts and to meet domestic expenses are the prime reasons for leasing coconut trees. The marginal as well as big coconut farmers with sound financial position are free from any such forces compelling them to lease coconut trees. Adoption of mixed practice for disposal of coconuts is found common among big farmers. Locational differences of the farm and differences in age and productivity of coconut trees are the reasons attributed for following mixed practices of marketing by farmers. Absence of lease holders, low productivity as well as poor protection to trees in the farm, seasonal harvesting etc. are some of the factors forcing coconut farmers to adopt mixed marketing practices. 5.4 Tender Coconut : 5.4.1 The tender coconuts are disposed off by the farmers immediately after harvesting, without giving any kind of dressing or grading. It has been observed that tender coconuts Plate – 12 are manually sorted out at the time of retail sale, where the
husk of the tender coconut is chopped off with a sharp sickle shape knife to make an opening of about 1 inch diameter to facilitate directly drinking of water. De-husking of tender coconut is very difficult due to high moisture content of the husk and delicate nature of immature shell. The discarded nuts are cut into halves before being disposed off by natural degradation.
Tender coconuts are sent to market within a day or
two after harvesting as there is no practice of storage for Tender Coconut Sale longer period. The tender coconuts are kept in shed on the farm till they are lifted by the wholesaler and/or retailer. The wholesalers and
retailers store the tender coconuts only for a few day or week, since, the interval between the harvesting and consumption does not exceed more than 10 to 15 days, even at the distant places of consumption. Moreover, prolonged storage makes the tender coconut water insipid and hence is disposed off for consumption at the earliest possible. Tender coconuts have great demand in most of the towns and cities all over the country.

Production and Marketing of Coconut in India
Page 59 of 122
Kolkata, Mumbai, Chennai, Bangalore and Delhi are the major consumer markets for tender coconuts. 5.4.2 The tender coconuts are sorted out at the retailer level according to their size. Since, bigger the coconut higher the price due to consumer preference and belief that it contain more quantity of coconut water. The assembling and distribution of tender coconut through out the country is almost uniform and involve producer, contractor, itinerary merchants, wholesalers, retailers and hawkers. Farmers of the main coconut growing areas generally sells tender coconuts at the farm or gardens to itinerary merchant, wholesaler or retailer. At some places, the producers take the tender coconut to nearby mandi or market. The itinerary merchant and wholesaler after procuring either through commission agent or even directly, sell to the retailers. The retailer may directly sell to the consumer or through hawker to consumer. The buyers transport the tender coconut nuts to nearby town and market hatts. In Assam and West Bengal, it has been observed that 90 per cent of the tender coconut production is handled by itinerary merchants. In Orissa, traditionally coconuts are used for religious purpose and for consumption; hence, harvesting of fully matured nuts has been seldom practiced. In most cases, nuts of six to seven months, attaining maturity are harvested. The marketing channel in Orissa state includes village merchants, commission agents / wholesalers, dealers / re-traders, retailers and consumers.
It has been noticed that the major assembly markets for the tender coconuts in the country are located at College Street Kolkata, West Bengal and Maddur in Karnataka State. Tender coconuts in substantial quantity are also marketed in the states of Tamil Nadu and Andhra Pradesh. Chennai, Madurai, Mumbai and Kolkata are the main consuming markets. In Andhra Pradesh, Elluru and Bhimavaram in West Godavari district are the main assembling markets. Though, Kerala is a major coconut growing state, consumption of tender coconut is negligible, but in recent times due to development of tourism industry in the state, large numbers of outlets selling tender coconut supplied from the neighboring Tamil Nadu State have come up in the Kerala State. 5.4.3 Increasing awareness among the consumers about the medicinal properties and health benefits of tender coconut water has increased the demand for tender coconuts. According to an estimate, about 6 to 8 million tender coconuts were in demand in Kolkata market alone. The College Street and other markets in Kolkata used to receive about 20 to 25 million tender nuts in early eighties, which has increased to about 30 million tender nuts per annum by 2000. The Plate – 13

Production and Marketing of Coconut in India
Page 60 of 122
reason attributed to this high volume of arrival was that, about 80 per cent of the total production of coconuts is consumed as tender coconuts in West Bengal and neighboring states of the Eastern region. The tender coconut market in College Street Kolkata functions only for 2 to 3 hours in early morning, since the market is held on footpath of the College Street and Shyam Bazar area. Bulk of the tender coconut supplies to these markets come from Bashirhat town of North 24 Paraganas district and small quantity from Diamond Harbour in South 24 Paraganas. The farmers Tender Coconut Sale and wholesalers transport the tender coconuts to College Street for auction through commission agent. The lots of tender coconut are unloaded from the vehicles and sorted out into the lots of 150, 200 and 250 nuts according to the size of the coconuts. The commission agent auction each lot and sells to the highest bidder in presence of the farmer or wholesaler. After auctioning the whole produce, the wholesaler or farmer is paid the amount after deducting the six per cent commission and other expenses incurred by the commission agent. During the summer months, nearly 45,000 to 50,000 tender coconuts per day are transacted in this market. The transaction drops to around 25,000 to 30,000 tender coconuts per day during rainy or winter season. However, it was gathered that the arrival in the market has been declined due to large quantities of tender coconuts were being exported to Delhi and other places directly from the villages in West Bengal.
5.4.4 Karnataka is another state where about 20 per cent of the total production of coconut is harvested in the form of tender coconuts. It has been reported
that nearly 50 to Plate – 14 60 per cent

Production and Marketing of Coconut in India
Page 61 of 122
of the coconut production in Mandya, Bangalore, Mysore and Hassan districts is harvested as tender nuts. In Karnataka state, tender coconut is a notified commodity in 14 regulated markets but actual trading is carried out in 6 markets only. Farmers in these districts lease out their gardens mostly to middlemen or sometimes traders and venders. Tender coconuts are traded in regulated markets of Maddur, Mandya, Channarayapatna, Holenarshimapur, Hosdurga and Kadur, but Maddur market is famous for daily trading of tender coconuts. Maddur market is an important regulated market exclusively for marketing of tender coconut. The Coconut sale at Maddur Market regulated market was established in Maddur town, Mandya district, Karnataka State in the year 1992, considering the magnitude of cultivation of coconut crop in Maddur region as the climate in this region is congenial to the production of quality tender coconuts. The market yard is spread over about 12 acre of land with essential infrastructure facilities required for the regulated market. Traders informed that the peak production of tender coconut begins from the month of November and continue up to February which co-inside with the winter season. On the contrary the peak demand is during the summer months of May to June when the supply becomes lean. The market caters to the needs of the coconut farmers cultivating in and around Maddur area. However, during off season tender coconuts do arrive from Kollegal and other surrounding area situated even at the distant places. On inquiry from the traders it was informed that there is no co-relation between quantum of arrival and prices offered by the wholesale traders in Maddur market. Similarly, the price of matured coconut and tender coconut are also unrelated to the seasonal variation. It was gathered that on an average there is demand of around 2 to 3 lakh nuts per day due to the constant demand from the up country market like, Mumbai, Tamil Nadu and Andhra Pradesh. However, among these upcountry markets Mumbai is the leading market with an average demand of around 2 lakhs nuts per day, during peak season. During peak season, about 20 trucks load amounting to about 1.5 lakh coconuts are sent to Andhra Pradesh alone. The quality i.e. size and maturity of tender coconuts differ with the demand from consuming markets i.e. coconut sent to Bangalore, Mumbai city are better in appearance compared to the coconut sent to other market places. The consumer in Andhra Pradesh and Mumbai preferred tender coconuts having better coconut jelly content over the coconuts with water only. It was observed that due to high cost of transport, the traders negotiate to safeguard the interest of consumer by offering competitive prices for the tender nuts. It was learnt that about 25 traders were active in the market. However, only 6 to 7 big traders control 70 per cent of the coconut trading in the market.
The sale in the market takes place through mutual negotiation immediately after entry of the commodity at the market gate and not by open auction system. The representatives of the commission agents offer their prices to seller for the tender coconut brought to the market. The market activities begin in the morning at 10 a.m. and continue till 6 to 7 pm, depending on the arrivals. The market authority collects market

Production and Marketing of Coconut in India
Page 62 of 122
charges @ 1.5 per cent of the turnover or Rs.300/- to Rs.350/- per truck which approximately contains 6000 nuts per truck. The commission agents charge Rs.5/- per 1000 nuts to the farmers-trader or traders. These markets cater to the demand of up country markets like Pune, Mumbai, Nagpur of Maharashtra, Gujarat and Delhi supplying about 8-12 truck loads, with the capacity to load 8000 to 10,000 tender nuts per day. In Bangalore, the wholesale market of tender coconut at Yeshvanthapur, transact about one lakh nuts daily and at Bommannalli market, nearly 200 to 250 farmers bring their supplies and participate in the auction conducted in the market yard with daily transaction of about 50,000 nuts. Tender coconuts from villages to the market are transported by trucks, tempos and matadors. Now days trucks are common means of transport as each truck load carry about 4000 to 10,000 coconuts. Tender coconuts are simply loaded in trucks or other carriers, retailers transport them to different retail centers in tempo, rickshaw cycles, hand carts or even head loads in the cities. 5.4.5 Delhi markets is also an important terminal market for tender and matured Plate – 15 coconuts. Arrival of both types of coconut
depend not only in the seasonal demand and consumption pattern in the Northern region but influence the supply from the markets in coconut producing areas. Study of the arrival of coconut in Delhi market for the triennium ending 2004-05 shows the arrival of matured coconut as 60.13 per cent compared to 39.08 per cent arrival of tender coconut. Arrivals of tender coconut has been proportionately
Tender Coconut Sale higher during March, April and May due to higher demand for tender coconut water during summer season and decline in arrival during monsoon months. However, arrival of matured coconut appeared higher during the summer and winter season i.e during August, September and October due to festival. Arrivals of tender and matured coconut in Delhi market during 2004-05 reported to have declined due to drop in coconut production in the country (Annexure – V) 5.4.6 The Coconut Development Board has sponsored the project of adopting integrated approach for marketing of minimally processed tender coconut to provide a sustainable and enhance income to coconut growers. In marketing practices of tender coconut, it has been observed that the supply chain of tender coconut is simple unlike matured coconut, copra and coconut oil but highly unorganized. In the marketing channel of tender coconut it could be observed that no organized efforts are made to ensure the availability of quality tender coconuts on a continuous basis to meet the consumer demand. A substantial share of coconut production could be traded as tender coconuts, if an integrated approach was adopted for marketing of tender coconuts with

Production and Marketing of Coconut in India
Page 63 of 122
the active participation of various stake holders. This would in turn help in reducing the dependence of coconut price being decided by trends in coconut oil market. (Thamban et al.2007) 5.4.7 It has been observed that on a very small scale, tender coconut water is being sold in bottled form, to serve in processed and chilled form. But the venture has not been so Plate – 16 popular on account of high cost involved in sophisticated
processing technology to preserve the natural taste and flavour of coconut water and establishing bottling plant. Scientists have suggested a viable option to adopt minimal processing technology of serving tender coconut in its natural container itself at a reasonable cost. In this process the bulkiness of husk on the tender nut is removed the partially Plate – 17 de-husked coconuts are dipped in a solution of 0.5 per cent
Bottled Tender Coconut water citric acid and 0.5 per cent potassium meta-bisulphate for three minutes to prevent discoloration of the outer covering. The partially de-husked and thus treated coconuts can be stored up to 24 days in refrigerated condition at 50C to 70C temperature without loss of white colour of the minimally processed outer most covering of the tender coconut, natural taste and flavour of tender nut water Partially Dehusked Tender Coconut inside. The tender coconut water can be served chilled like any other soft drink. These processed tender nuts would require plastic crates and insulated chill boxes for transporting and storage. This will facilitate distribution and marketing of tender coconut in different segments of market like, super malls, markets, hospitals, hotels, road side shops, kiosks and vending on railway stations and bus stands.
Integrated Way of Marketing of Partially Processed Tender Coconuts
Coconut Garden Homestead Garden
COCONUT FARMERS

Production and Marketing of Coconut in India
Page 64 of 122
Chilling and Storage at the cold storage infrastructure created in the
Agricultural Wholesale market
5.5 Matured Coconut : 5.5.1 Matured coconuts are generally disposed by farmers in unhusked form for want of nearby market place. However, farmers located near to market places, dehusk the coconuts and sell them as husked nuts. Farmers, from the areas where the husks is not utilized for retting and coir purpose, store the coconuts for two to three months, particularly the nuts harvested in the monsoon season. In Kerala, Karnataka and Andhra Pradesh farmers keep nuts for several months and sell them as dry nuts for making edible copra. The majority farmers sell the bulk crop as unhusked coconuts, still a considerable quantum of nuts are sold to consumers as husked nuts.
Harvesting Tender Coconuts from selected Palms by Climbers
Recycling Husk Recycling Husk
Minimal Processing, Partial Dehusking Tender Coconuts (Women SHG)
Transportation of Minimally Processed Tender Coconuts
Retail Outlets
CONSUMER

Production and Marketing of Coconut in India
Page 65 of 122
5.5.2 The nuts reaching markets are either partially husked or dehusked as per demand and requirement in distant markets. Coconuts meant for copra making sold in local markets are fully husked; coconuts meant for distant market places are left with some fibres covering the eyes or on all around nuts. Such partially husked coconut minimizes the breakage during transportation and posses’ longer keeping quality. In Maharashtra state, it has been observed that even when coconuts are fully husked a tuff of husk is left at the end of the nut over the eyes as it is considered to be auspicious and believed to preserve the nuts from spoilage. Some quantities of nuts are slightly husked, only the outer skin is removed and most of the husk is left over the nut- in-shell, and rests are completely husked. Different types of husking in preparation of dry nuts have been reported from the coconut producing areas of Andhra Pradesh, depending upon the trade demand from the consuming markets. The dry nuts which are completely husked except a tuft of fibers left over the eyes are meant for cities and towns of Maharashtra, Madhya Pradesh and some part of Uttar Pradesh and Bihar state. The dry nuts meant for some markets in Madhya Pradesh are typically husked where in three corners of matured coconuts are completely husked and from inter-space the husk is only partially removed to decorate the nuts meant for religious purpose. The nuts meant for Rajasthan market are partially husked, in some cases matured nuts are husked at the bottom only. The husking charges vary in different states and types of husking carried out in producing areas. Therefore, the wages paid to the labour used for husking widely differs from state to state. 5.5.3 The storage practice for matured coconut differs from place to place and in accordance with marketing practice i.e. by the producers, merchants or exporters. The farmers and local village merchants store coconuts in their houses. In markets, coconuts are stored in godowns owned by the wholesalers or commission agents. Since matured coconuts are meant for immediate consumption or crushing for oil, they are not warehoused for longer period. The matured nuts meant for copra making, are stored as unhusked nuts immediately after harvesting, and undergo further ripening to improve the quality of copra obtained. The husk obtained from such nuts losses the quality required for coir making purpose. In places where husks are used for retting and nuts are sold for milling purpose, the matured nuts are not stored but husked immediately after harvesting. The matured nuts meant for consumption of water and kernel, are stored for few weeks to three months by the farmers in their garden itself, as it fetch premium price when the colour of the nuts become brownish. The practice of this type of storage has been observed in some districts of Maharashtra, Karnataka and Kanyakumari district of Tamil Nadu.
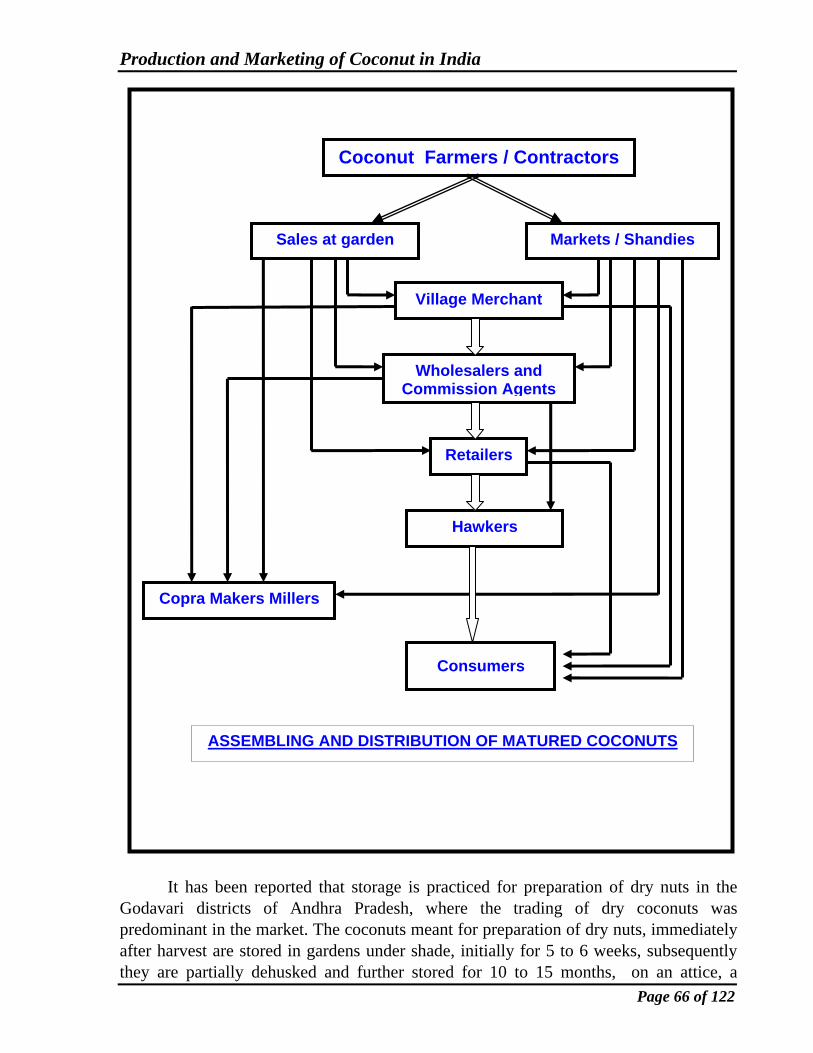
Production and Marketing of Coconut in India
Page 66 of 122
Coconut Farmers / Contractors
Sales at garden Markets / Shandies
Village Merchant
Wholesalers and Commission Agents
Retailers
Copra Makers Millers
Hawkers
Consumers
ASSEMBLING AND DISTRIBUTION OF MATURED COCONUTS
It has been reported that storage is practiced for preparation of dry nuts in the Godavari districts of Andhra Pradesh, where the trading of dry coconuts was predominant in the market. The coconuts meant for preparation of dry nuts, immediately after harvest are stored in gardens under shade, initially for 5 to 6 weeks, subsequently they are partially dehusked and further stored for 10 to 15 months, on an attice, a

Production and Marketing of Coconut in India
Page 67 of 122
specially made bamboo platform. The partially dehusked coconuts are dried by applying hot air passed through fire place or hearth underneath the drying platform, especially for the coconuts harvested during monsoon season. The nuts harvested during dry seasons are sun dried and converted into ball copra and cup copra accordingly. The nuts meant for making copra are also stored for 9 to 12 months before being subjected to sun drying on specially made bamboo platform in the Arcot district of Tamil Nadu.
The cost of storage varied from place to place, different conditions prevailing in the producing areas and the form in which coconuts are marketed. When the storage is on the farms the cost of storage might be almost nil. But when stored by the middlemen or wholesalers, near or in the market place, the handling charges and storage cost increase. Obviously, there are certain progressing losses in terms of quality factors and weight loss with the increased period of storage. The losses on storage are influenced by the quality of husk left on the nuts before marketing and processing. The loss in weight is more in unhusked nuts and minimum in completely dehusked nuts. 5.6 The personnel and agencies involved in marketing of coconuts and the marketing practices followed by them have been reported as follows. 5.6.1 Village merchant (Copra maker) : In Kerala State, the village merchants are the first purchaser of the nuts from the producers. Traditionally, the price of coconut is determined by the price of coconut oil prevalent in the market. The accepted norms followed in Kerala are that the price of one quintal of coconut oil is considered equivalent to the price of 1000 nuts i.e. the cost of single nuts is equivalent to 100 gms. of coconut oil. The Copra maker transacts the business on the basis of this conversion. In other part of the state, the prices of coconut are based on two important products of the coconut i.e. husk and the kernel, this practice is followed where the relevance of coir industry is much more and the loss in the sale of copra is compensated by the sales proceeds of husk. In some parts of Kerala, the price is also based on the estimated number of nuts required for making one candy of copra when crushed, assuming 62.5 per cent oil, 35 per cent oil cake and 2.5 per cent waste. The sale proceeds of husk and shell is added and cost of production and transportation of copra is deducted. The delivery of nuts is taken, by the village merchant after the sale, at the coconut gardens itself, generally on credit basis. The nuts are de-husked on the spot and the husk is sold to the netter to process it for coir fibre for the coir unit. 5.6.2 Middle man (Copra Merchant) : The middle men who are also merchants convert the coconut into copra on sun drying or kiln dry or by following both the methods. It takes around 7 days for producing standard quality of copra. In most of the cases, copra is sold at the stage when moisture level is 10 to 12 per cent, commonly known as ‘ghatti’, for which, corresponding amount is deducted by the traders compared

Production and Marketing of Coconut in India
Page 68 of 122
to the better quality of copra of 6 to 7 per cent moisture. The price of the copra is calculated on the following basis i.e. (a) The price of oil per candy (b) The price of cake per candy (c) Less Sales Tax crushing changes. Since the Marketing prices of coconut oil always fluctuate specially, the copra makers have to rush to manufacturer of copra by reducing the drying period. In some villages, where drying of copra is carried out in a crude form of copra-kiln, results in manufacture of inferior quality of copra. The small copra makers in village sell their lots to big processors and thus, there would be more than one intermediaries involved before it reaches to the millers. 5.6.3 Traders (Millers) : The copra thus procured is brought for further sale to millers by the traders. The transportation involved is either by country boats or bullock carts. Generally, traders are associated with particular miller but can go to other agency if they have not taken any advance payment from the miller. In Kerala state, most of the units are situated near to the back water, facilitating water transport. The trader take about 10 per cent of the copra procured as sample to the miller for approval and then bargaining starts. The trader moves from one miller to another for final settlement. The trader ultimately sale the product to miller, some times edging price for the copra or some times as a distress sale for crushing the whole thing into coconut oil. Since the major demand of coconut oil is from the up country markets, mainly meant for industrial purpose, specially for soap industry. In some cases, this process of the marketing channel is repeated on the same route on credit basis by paying the amount due for the last transaction. 5.6.4 Hatta System (Under cover) : Though dealing under cover is not a healthy marketing practice but still it is prevalent in copra trade. The copra makers take their produce to market and contact the broker with copra samples, commonly called “one eda”, in one basket and moves from one broker to another. The settlement of the price for the produce is determined in secret manner without uttering the price in open. The buyer and the broker engaged by the seller determine the price through pre-determined secret codes of price for every one of the five fingers of their left hand held and hidden under cover of the towel. They touch each finger alternatively by offering the price on their different parts of fingers and position known to both but not to the sellers. When the deal is finalized at the price arrived at secretly, after consultation by the broker with the seller both firmly hold their particular finger under the cover of towel. This practice was in vogue among the copra / coconut oil merchants in Travancore-Kochi. The copra merchant might not get the payment for copra immediately, but get the amount due for the previous consignment, when the next lot is brought to the market.

Production and Marketing of Coconut in India
Page 69 of 122
5.6.5 Deductions : The trader in the trade of matured nuts / copra, practices deductions for immature nuts, mouldy and dis-coloured copra, moisture content etc. The deductions are made arbitrarily by the traders. The same procedure is observed by the traders brining the lots to the millers and after bargaining with some millers at their site, the lots are sold to the millers. The lots are weighed on beam balance, at this stage also additional copra cups are taken for each weighment. Market charges such as sales tax, cess for coconut committee, brokerage, bonus to cart men / boatmen. Unloading, drying charges etc., are deducted arbitrarily. It has been reported that the growers and coconut processors are fully exploited by various trade practices such as additional nut for every 100 nuts, popularly known as “Vasi”, bunching of small nuts and counting at par with a single nut, besides irregular and insufficient payment, over estimation of allowances, quality disputes etc., are some of the ill practices prevailing in the market. 5.6.6 Grading : Wholesale traders adopt the practice of grading copra based on the quality factors prevailing in the trade. The coconuts are categorized in the two forms, fresh and dry, while copra into edible and milling. The edible copra is classified as ball copra and cup copra, depending on the quality, edible copra is further graded as copra from dry nuts, copra from semi-dry nuts and copra from fresh nuts. Each grade is again classified into different trade name. Such as Office Pass, Rassi, Rajpur, Moong etc. The office pass grade is generally used for milling purpose and sold to miller. The traders grade the copra in the order of its market value. The grading is mainly based on moisture content with maximum limit of 10 per cent, the foreign matter upto 2 per cent and black copra upto 5 per cent. However, the good quality copra ideally should have moisture upto 6 per cent, oil content 71 per cent, acid value 2.5 per cent, foreign matter 0.5 per cent, mouldy cups 5 per cent, wrinkled cups 5 per cent and black copra 1 per cent. The edible ball copra has different quality parameters to offer price even under price support scheme. (Annexure – VIA)
Edible Copra Milling Copra Size 75 mm (minimum) Foreign matter 0.2 % 1.0% Mouldy & black kernels 2.0 % 10.0% Wrinkled kernels 10.0 % 10.0% Chips 1.0% 10.0% Moisture 1.0% 6.0%
The edible copra is selected for export to North Indian states and other parts of the country for direct consumption or as an ingredient in spices or culinary preparations.

Production and Marketing of Coconut in India
Page 70 of 122
The demand for edible copra is seasonal and subjected to fluctuations. Therefore, grading is resorted to by traders depending on demand or even the edible copra is sold for crushing. Several grades and classification of edible copra are prevalent in the market. The ‘vadagara’ variety is referred to as ‘Calicut Gola’ in the trade. In ‘vadagara’, the balls are classified into 5 types according to the size. In Karnataka state, four grades of ball copra according to size are designated as “Mysore”, “Madras” “Ras” and “Barik”. The sizes of different grades are not defied in any measurable unit but the balls are classified into the different grades by visual assessment / observation only. Ball copra from Godavari district is referred to as Madras copra which is not as good as Karnataka or Vadagara varieties. The ball copra from vadagara and kozhikode areas is considered slightly inferior to that of Tiptur area of Karnataka. The three main grades of edible cup copra in Kozhikode are known as ‘Rajpur’, ‘Madras’ and ‘Dilpass’. “Rajpur” copra is considered as the best edible cup copra and is prepared by cutting the copra balls and further drying the halves in the sun for two to three days. It is sorted out into two or three grades according to the whiteness of the kernel. The Rajpur variety comes to the market from September to June. The Madras copra is some what inferior to the Rajpur copra and is prepared from nuts in which water has not been fully absorbed. Rejections from Rajpur quality also go as Madras. According to the colour of the skin (testa), Madras copra is classified into two grades. Dilpass is inferior to Madras variety in quality and is prepared from partially dried nuts, stored for three to four months or from fresh nuts.
In Alappuzha the best cups of sun dried copra with good colour and clean
appearance are separated out and classified as edible copra. There are different grades according to the size, colour and outer skin etc. which are locally known as Rai, Murgi, Dala etc.
In Kerala state, the best grade of milling copra is known as ‘office pass’. All other inferior quality copra is known ‘Rasi’. ‘Rasi’ is sometimes classified as ‘Thirurassi’ and ‘Kazhippu’. In Tiptur copra rejected from edible copra is called ‘kavathu’. Moisture is an important factor for judging the quality; hence millers sometimes differentiate copra on the basis of number of days taken for drying such as 4 day drying, 7 days drying etc. The term “cutter” dry is used to indicate fully dried copra. 5.7 It has been observed that presence of intermediaries at different stages of marketing of coconut, copra and coconut oil. The structure of coconut trade varies from traditional coconut growing state to non-traditional coconut growing state and region to region. It is a common practice among big farmers to pool his produce alongwith

Production and Marketing of Coconut in India
Page 71 of 122
produce of small farmers of his village/area, convert into copra and sell it to intermediaries or miller directly. The miller in turn sells it to wholesalers in terminal market or to upcountry buyers. Sometimes farmers sell their produce to converters cum traders, who directly sell copra to upcountry buyers for manufacturing of value added products. The number of intermediaries in the marketing channel critically differs in Kerala and Tamil Nadu state. The marketing channel for copra in Kerala is characterized by presence of intermediaries at multiple stages, which is conspicuously lesser in Tamil Nadu and Andhra Pradesh. It has been observed that some farmers sell coconuts to traders who in turn sell the coconut to composite mills, where conversion, drying of copra and its milling into coconut oil is carried out. The major coconut oil trading centers are functional in the zones where more number of coconut oil mills are located. They are mainly at Kochi (Cochin), Trichur and Trivandrum in Kerala; Kankeyam and Vellakovil in Tamil Nadu and North Kanara, Udupi and Mangalore in Karnataka. Though Kochi has been a terminal market, it has been reported that it has been experiencing decline in trading of coconut oil. The reasons attributed to this decline are high labour wages, grading and transportation cost. The traders in Kochi who have the capacity, started to pool the minimum quantity up to 50 drums of coconut oil in short period of 11 days to economize the loading, grading and transportation cost. The small traders in Kochi, unable to adopt pooling practice, have been suffering from a low turnover. Further, the buyers have been forced to accept substandard coconut oil deliveries with more than permissible impurities, which the dealer have to purify at their own cost and in their establishment before dispatching it to upcountry buyers or industrial end users. From the marketing practices followed in the coconut and coconut product trade, it has been revealed that in-numerable intermediaries, channels, functionaries, brokers, assemblers, traders, merchants, wholesalers, institutions and retailers are involved directly or indirectly in the movement of coconut from the point of production to the point of consumption, performing various activities in the flow process, enabling movement of coconut and its products until placed in the hands of consumers. The distribution systems in marketing channels differ from product to product due to difference in marketing environment, marketing composition and marketing situations. It is apparent that they perform one or all the functions of assembling, buying, selling, transportation, storage and warehousing. The auxiliary functions such as grading / standardization, market financing, market risk bearing and market intelligence/information are also performed by these functionaries.

Production and Marketing of Coconut in India
Page 72 of 122
COCONUT FARMERS / PRODUCERS
From small producer pools copra Coconut product
converters-cum-Traders
Traders
Convert coconut into copra Traders
Intermediaries or Millers
Terminal Markets
Upcountry Buyers
Wholesalers
Retailers
Upcountry Buyers
Value added products manufactures
Retailers
Composite Millers (Milling of copra) and Conversion
Coconut oil
Terminal Market
Wholesalers
Retailers
Consumer Consumer Consumer
MARKETING CHANNELS OF COCONUT AND COCONUT PRODUCTS

Production and Marketing of Coconut in India
Page 73 of 122
However, in the existing marketing system the functionaries, except the institutional agencies, have not fulfilled the objectives of effective marketing system, towards remunerative price realization, through sale of coconut and coconut products. The price realization reported to be lower than the direct sale by farmers or through farmer’s institutions. Even though every addition of marketing functionaries results in widening of the price spread, the dominance of marketing functionaries in the marketing channels of coconut and its products cannot be denied, due to certain limitations which directly or indirectly affect the farmers and producers / manufactures. Majority of the coconut farmers have small and marginal holding and have dearth of holding capacity due to financial crisis, lack of credit facilities from the financial or cooperative institution against coconut trees, compel them for forced sale. The coconut farmers are the worst sufferer in the present marketing practices as they need short term credit especially during off seasons and flush season i.e. during summer days. The farmers thus borrow advances from the middle men / traders, especially those who raise coconut palms in grove as monocrop even to meet their expenses for normal production and consumption. Moreover, they do not have storage facility and holding capacity. Fluctuation in prices of coconut forces them to sell these coconuts on farm immediately after harvest. The farmers are unable to take up value addition activities to their produce. This strikingly affects the effectiveness of marketing of coconut and coconut products. The structure of coconut trade varies from traditional coconut growing states to non-traditional coconut growing states and from one region to another, likewise the presence of intermediaries, at different stages of marketing of coconut, copra and the coconut oil (Annexure – VIIA & B). 5.8 Future Trading in Coconut : The centralized trading practice in coconut trading, where operating agents practice contracts with standardized specifications with flexibility in prices known as future trading and was in vogue till 1971. Futures’ trading of coconut oil was carried out under two recognized association in 1950’s viz; the Alleppey Oil Millers and Merchants Association, Alleppey and the Oil Merchant Association, Cochin. At Cochin, four consecutive bi-monthly contracts were permitted to recover concurrently according to the bye-law of the association for the purpose of hedging, the due data of the 1st bi-monthly contract being the 15th of the month and that of the second being the last day of the month. It was discontinued later to check excessive speculation in trading activities. However, it has been reintroduced in the last quarter of 2001 for coconut oil under the first commodity exchange of India at Kochi, after a gap of 3 decades. This brought about a sea-change in the coconut industry and trade. Copra crushing industry which suffered a set back in the past decade also received a boost on resumption of future trading in June 2002. National Multi-commodity Exchange, Ahmedabad, though

Production and Marketing of Coconut in India
Page 74 of 122
started future trading in coconut oil during their initial months of operations. However, there is not much activity in copra and coconut oil in this exchange, other commodity exchange such as Multi Commodity Exchange (MCX) and National Commodity Exchange (NCDX) are yet to start trading of copra and coconut oil. The trading in the above markets is conducted simultaneously for three contracts only. These contracts are required to commence three months in advance and the period of hedging is four months. The trader who trades in the exchange are bound to pay margin and special margin money as fixed from time to time by forward market commission (FMC). Further, the members have to deposit a security with the exchange. The limit on open position is fixed with the sanction of Forward Market Commission. Trade in exchange is carried on line. The trading of coconut oil and copra is in two tones and multiple there off. Minimum price movement for coconut oil and copra is 5 kg. / 100 kg. The maximum price fluctuation for a day is Rs.100 and as per bye-law of the exchange delivery can be made any where in India. The prices at Kochi in 2005 given in Table-14, revel that the future prices, vis., actual prices, vis., delivered prices of coconut showed using trends during January, 05 to 15th half of March, 05. By the second half of March and beginning of April, 05 the actual price showed decline with respect to future price in respect to the month of January and February where the actual prices were much higher than that of the future market. However, during May, 05 to December, 05 the prices on future market trading were higher than that of the actual prices. However, it is seen that the actual delivery prices were always less than that of actual and future prices except in case of the months of January and February.
Table No.14
Future Price V/s. Actual Price V/s delivered Price of Coconut Oil at Kochi Market (Rs.)
Table – 15 shows the volume of coconut oil traded and delivered under future trading it is clear from the figure that though the total volume traded had increased from 21,628 to 1,24,244 during the year 2002-03 to 2005-06. However, the quantity delivered at the same time was very less, though it had also kept the increasing trend as per the
Jan ’05
Feb’ 05
Mar’ 05
April ’05
May ’05
June’05
July’ 05
Aug’ 05
Sept’ 05
Oct’ 05
Nov’05
Dec’ 05
Actual 7280 7198 6199 5763 5394 5539 5212 5154 5125 4862 4864 4765
Future 6767 6700 6417 6167 6043 5935 5709 5702 5517 5399 5217 4888
Delivered 6920 6870 5650 5780 5240 5300 4940 4905 4700 4720 4500 4560

Production and Marketing of Coconut in India
Page 75 of 122
volume traded. Though the contribution of the system is very negligible, however, active involvement of farmers / traders will help to increase the trade in future market. It was expected to avoid violent fluctuation in price to bring transparency in marketing of oils and oil seeds, and provide option to farmers / traders to sell their products at a favourable price, three months in advance. Future trading practice could be used as a tool to stabilize price. However, contrary to this expectation from future trading it was reported that in the year 2005, future trading in coconut oil has failed to achieve the expected results due to alleged anomalies in the trading. It has been observed that there was lack of transparency in trading and pricing in the spot market and hence the future market was unable to perform its function. Unfortunately, the spot markets of coconut oil were influenced by the supply and demand factors in particular regions, and future prices were driven by a very small section of operators in the future exchange which was not observed as healthy trend in future trading. The spot market in coconut oil failed to meet the required conditions in absence of proper dissemination of market information and fragmentation of markets in different regions. It was observed that the speculators were responsible for wild fluctuations of coconut oil prices. Some traders were manipulating the prices by taking comfortable short position in futures market. This has resulted in default in payment amounting to about Rs.2 millions thereby forcing the market to suspend trading for a few days in the year 2005. This kind of artificial fluctuation is certainly detrimental to the coconut farmers and consumers.

Production and Marketing of Coconut in India
Page 76 of 122
Table No.15
Total Volume of Coconut Oil Traded and Delivered Under Futures Trading
Quantity in M.Tonnes Value in Rs.per tonne
2001- 02 2002- 03 2003- 04 2004- 05 2005- 06 2006- 07 Month
Total Volume
Qty. Delivered
Total Volume
Qty. Delivered
Total Volume
Qty. Delivered
Total Volume
Qty. Delivered
Total Volume
Qty. Delivered
Total Volume
Qty. Delivered
April - 362 0 2744 22 4606 24 6566 210 9780 44 May - 650 40 2168 48 3496 100 9752 126 9994 42 June - 698 54 1446 42 4214 26 12382 106 July - 292 6 2782 38 3300 72 12146 184
August - 1676 44 4108 50 4562 106 15256 162 September - 1540 22 1928 80 6186 54 13142 20
October 1614 80 3260 76 6950 68 11320 118 November 1730 8 3604 66 6424 28 10126 28 December 280 14 2350 20 4958 42 6876 142 3804 18 January 590 70 3812 68 2992 36 7880 34 9444 50
February 646 40 4056 20 3366 72 7754 22 9660 66 March 436 0 5848 50 3682 50 8072 74 10646 148 Total 1952 124 21628 412 37038 622 70320 750 124244 1236 19774 86
Monthly Average 488 31 1802 34 3087 52 5860 63 10354 103 1648 7 Estimated production of coconut
oil in Kerala 240500 238550 229450 238550 238550
% to total production 0.812 0.052 9.066 0.173 16.142 0.271 29.478 0.314 52.083 0.518
On analysis of the transactions of coconut oil under future trading with reference to the production of coconut oil in Kerala revealed thefollowing facts. During the year 2001-02, against the estimated production of coconut oil at 2.405 lakh Tons, the volume transacted is only 1952Tons which is only 0.812 per cent where as the delivery is only 124 Tons (0.052 per cent). The corresponding figures for production for theyears 2002-03, figures for actual 2004-05, 2005-06 are 9.066 per cent, 16.142 per cent,29.478 per cent and 52.083 per cent while the corresponding quantity delivered are 0.173 per cent, 0.271 per cent, 0.314 per cent and 0.51 8 per cent respectively. This indicates the negligiblecontribution of the system. Active involvements of farmers / traders are absolutely required for justifying the system.

Production and Marketing of Coconut in India
Page 77 of 122
PRICES 6.1 The classical function of price is to co-ordinate activities of independent business concerns, involved in the marketing of the commodity, so that resources are used to satisfy the demand of consumers as expressed in the market. While this role is still important, it is being modified in many significant ways and the importance of getting adequate information about market price is ever increasing. The study of marketing and that of prices go hand in hand, and to understand marketing of any agricultural commodity adequately, knowledge of fundamentals of pricing are absolutely essential. The study of price behaviour is an essential requisite of successful marketing mix represented by four P’s i.e. product, price, place and promotion. It has been observed that marketing cannot be done inside the Boardroom, so the focus has been shifted to the customer. The consumer now a day not only purchases the product, but the experience that comes along with it. The marketing principles have changed and along with 4 Ps, the 3Cs- i.e. control, convenience, choices, have come into the picture. This has led to the emergence of concept such as experiential marketing, customized products for sale in malls and innovative business models to constantly keep the customers engaged. The prices furnish guidelines to indicate how resources should be utilized in an economy governed by price mechanism under competitive conditions and they certainly determine, what should be produced, how much should be produced and their distribution. The price mechanism assists in allocating commodities to different uses, to achieve efficiency in production and distribution on the assumption of consumer’s supremacy. In the light of this price mechanism it would be necessary to study and observe the price, price situation, price behaviour, role of producer in determining the price, price support scheme and various other aspects of price of coconut and coconut products.
6.2 PRICES TREND : 6.2.1 Trend of Prices of Coconut : The prices of coconut and coconut products in the country are mainly centered around two major coconut products viz., copra and coconut oil. The price of coconut is usually influenced by the price of coconut oil prevailing in the wholesale markets. However, the coconut oil prices are characterized by wide and violent fluctuation and erratic price trends. The factors that determine the price of coconut and coconut products are also associated with the growers, oil industry, and consumers. The prices therefore, should be attractive to farmers so that they continue to invest and undertake coconut farming for their prospective growth, and remunerative to the product based industry for its survival.

Production and Marketing of Coconut in India
Page 78 of 122
Yearly Wholesale Price Index of Coconut (1997-2006)
0
50
100
150
200
1997
1998
1999
2000
2001
2002
2003
2004
2005
2006
Year
Inde
x V
alue
Wholesale Yearly Index
It has been observed that the prices of coconut in the country are integrated with the price of coconut oil prevalent at Kochi market (Annexure-L). However variations in quality of matured coconut, size of nuts, copra content, oil contents, marketing cost, marketing methods of fresh tender coconuts and matured coconuts are also deciding factors for the price received by the coconut farmers. The coconuts produced on farm and gardens move through many agencies like farmers or producers, collectors, middlemen, wholesalers and processors, before reaching the consumer in various forms. The involvement of these agencies and number of agencies involved in the marketing channels are also deciding factors of coconut prices.
Study of the price trend based on the wholesale prices of coconut at Ariskere,
Kozhikode and Kangayam markets for the period 1997 to 2006 (Annexure–VIII, IX & X and Figure-6), shows that the price were higher in all the three markets during the year 1997, which was attributed mainly to a reported decline in the production of coconuts. The average Wholesale Price Index (WPI) of coconut at 118.2 during 1998 was 12.5 per cent lower than that of the corresponding period of the previous year (148.3, 1997). Thus, the decline in the Wholesale Price Index (WPI) for coconut was significantly larger than that of either copra or coconut oil. The month end position of the prices of coconut during January-August, 1998, was in the range of Rs.3200-4000/-, per thousand nuts at Kozhikode and Rs.3800-4500/- at Alappuzha of Kerala state; Rs.3900-5300/- at Arsikere of Karnataka state as against the corresponding range of Rs.4300-5200/-, Rs.4200-6100/-, Rs.4900-6200/- in January–August, 1997, in the respective markets. It would show that the price of coconut fell significantly even in Karnataka which mainly produces ball copra (Annexure– III, IX, X & XI).
The index number of wholesale prices of coconut, which was at 147.4 in January,
Figure – 5 1999, exhibited its usual seasonal decline to reach 141.7 in July 1999 before recovering at 147.7 in August and further to 155 in October, 1999. At these levels, the Wholesale Price Index (WPI) for coconut work out to 8.8, 13.2 and 7.4 per cent higher in January, July and October, 1999, compared to the corresponding months of the year 1998. During the peak marketing period of January-May, 1999, the month ends wholesale prices of coconut coated in Kerala were in the range of Rs.3750-5000/- per thousand
Source : Annexure–XIII & XXVII nuts, at Kozhikode and Rs.4800-5300/- at Alappuzha. However, the prices in Karnataka at Arsikere market, were between
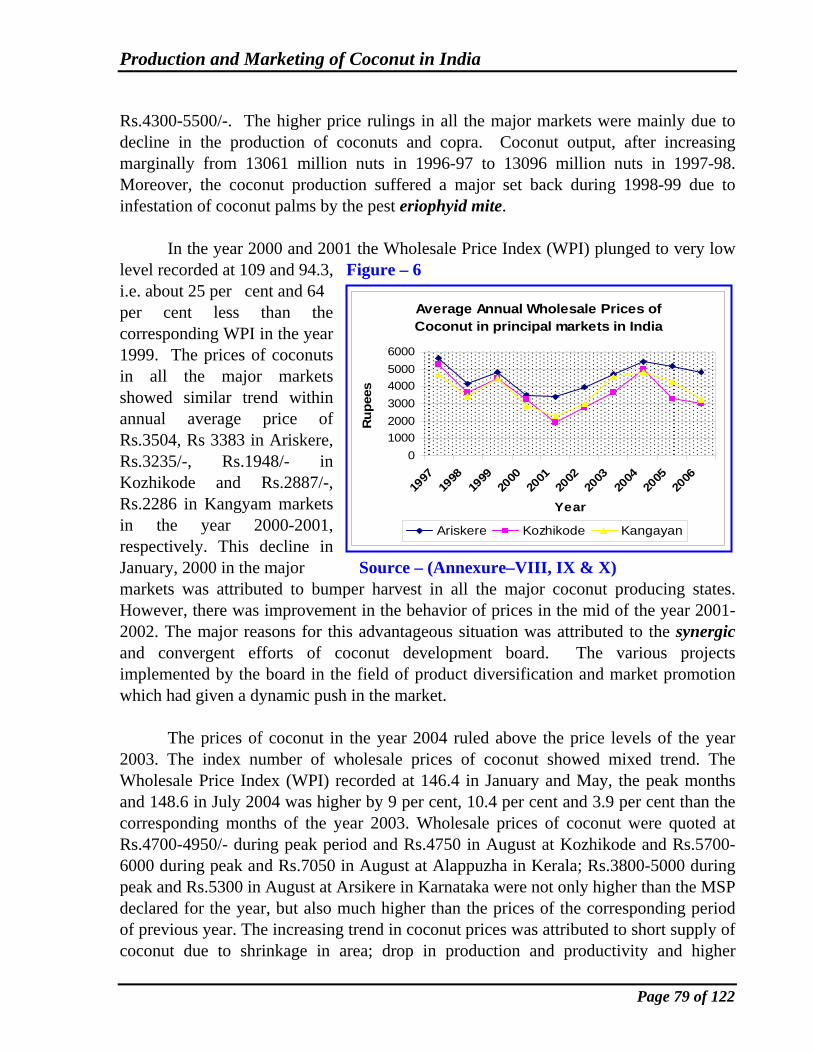
Production and Marketing of Coconut in India
Page 79 of 122
Average Annual Wholesale Prices of Coconut in principal markets in India
0100020003000400050006000
1997
1998
1999
2000
2001
2002
2003
2004
2005
2006
Year
Rup
ees
Ariskere Kozhikode Kangayan
Rs.4300-5500/-. The higher price rulings in all the major markets were mainly due to decline in the production of coconuts and copra. Coconut output, after increasing marginally from 13061 million nuts in 1996-97 to 13096 million nuts in 1997-98. Moreover, the coconut production suffered a major set back during 1998-99 due to infestation of coconut palms by the pest eriophyid mite.
In the year 2000 and 2001 the Wholesale Price Index (WPI) plunged to very low
level recorded at 109 and 94.3, Figure – 6 i.e. about 25 per cent and 64 per cent less than the corresponding WPI in the year 1999. The prices of coconuts in all the major markets showed similar trend within annual average price of Rs.3504, Rs 3383 in Ariskere, Rs.3235/-, Rs.1948/- in Kozhikode and Rs.2887/-, Rs.2286 in Kangyam markets in the year 2000-2001, respectively. This decline in January, 2000 in the major Source – (Annexure–VIII, IX & X) markets was attributed to bumper harvest in all the major coconut producing states. However, there was improvement in the behavior of prices in the mid of the year 2001-2002. The major reasons for this advantageous situation was attributed to the synergic and convergent efforts of coconut development board. The various projects implemented by the board in the field of product diversification and market promotion which had given a dynamic push in the market.
The prices of coconut in the year 2004 ruled above the price levels of the year 2003. The index number of wholesale prices of coconut showed mixed trend. The Wholesale Price Index (WPI) recorded at 146.4 in January and May, the peak months and 148.6 in July 2004 was higher by 9 per cent, 10.4 per cent and 3.9 per cent than the corresponding months of the year 2003. Wholesale prices of coconut were quoted at Rs.4700-4950/- during peak period and Rs.4750 in August at Kozhikode and Rs.5700-6000 during peak and Rs.7050 in August at Alappuzha in Kerala; Rs.3800-5000 during peak and Rs.5300 in August at Arsikere in Karnataka were not only higher than the MSP declared for the year, but also much higher than the prices of the corresponding period of previous year. The increasing trend in coconut prices was attributed to short supply of coconut due to shrinkage in area; drop in production and productivity and higher

Production and Marketing of Coconut in India
Page 80 of 122
Average Annual Prices of Coconut in selected states in India
3000
3500
4000
4500
5000
1998-99 1999-00 2000-01 2001-02 2002-03
Year
Rup
ees
Unhusked Semi-husked Husked
demand for the coconut products. Thus, the period 1997 to 2004 witnessed the prices volatility on account of cyclical and seasonal behavior of production and productivity.
Table No. 16
Average Wholesale Prices of Coconut at Ariseakare, Kozhikode and Kangayan Markets
(Rs.per 1000 nuts)
Year Ariseakare % of the 1997 price
Kozhikode % of the 1997 price
Kangayan % of the 1997 price
1997 5647 100 5309 100 4678 100 1998 4167 73.79 3684 69.99 3445 73.64 1999 4821 85.37 4468 84.14 4488 95.94 2000 3504 62.05 3235 60.93 2887 61.71 2001 3383 59.91 1948 36.69 2286 48.87 2002 3975 70.39 2818 53.07 2980 63.70 2003 4702 83.26 3663 69.00 4586 98.03 2004 5432 96.19 4988 93.95 4826 103.16 2005 5203 92.14 3306 62.27 4264 91.05 2006 4814 85.25 2850 54.00 3255 69.58
6.2.1.1 Price variation Due to Quality of Unhusked and Husked nuts : From the Figure – 7 data on prices during 1998-1999 to
2002-2003 of un husked, semi husked and husked nuts prevailed in different states of India, it could be seen that the husked nuts fetched higher prices than un husked nuts. In areas where the retting facilities for husk exist, un husked nuts fetch higher prices than that of husked nuts. In land tracks where retting was not done price of husked and un husked nuts were almost the same (Annexure–XIV, XV and XVI, figure-7). The difference between the price of husked and un husked at
Source : (Annexure–XIV, XV and XVI) important markets shows (figure-8), that the prices of husked nuts were higher and that of un husked at Rajamundry, Palakat (Andhra Pradesh), Dindigul (Tamil Nadu), while the reverse was the case in all other markets (Annexure-XVII).

Production and Marketing of Coconut in India
Page 81 of 122
Average Monthly Wholesale Price of Dry and Tender Coconut in selected markets during
2002-03
0100020003000400050006000700080009000
10000
Big Medium Small Tender
Markets
Rup
ees
Dharmapuri Kanyakumari Dindigul
Monthly Wholesale Prices of Unhusked and Husked Coconut in selected markets in India
01000200030004000500060007000
Tirvan
thapuram
Kozhikode
Tanajv
ur
Didigul
Rajamundry
Palako
l
Markets
Rup
ees
2001-02 Unhusked 2001-02 Husked
2002-03 Unhusked 2002-03 Husked
The difference in prices of unhusked and husked nuts depends upon the price obtainable for husk in different markets from time to time. A comparison of the prices in coconuts with husk and without husk Figure – 8 at Thiruvanthapuram, Quilon and Alapuzzha markets (Annexure–XVIII, XIX & XX), showed that un husked coconut generally fetched higher prices except in Quilon market where it was found that coconut with husk also fetched good price. However, comparison of the yearly prices prevailed in different states of India (Annexure–XIV, XV and XVI, Figure-7) showed only the marginal difference between the prices of the Source : (Annexure – XVII) husked, un husked and partially de husked or semi husked coconuts. 6.2.1.2 Size of nuts, tender nuts and Copra content : The size of coconuts matters much in fixing price of matured nuts, as bigger nuts usually yield more copra. Therefore, prices of coconuts, as a rule vary according to size of nuts. Nuts harvested in summer being bigger in size usually fetches higher price than the nuts harvested in the monsoon. The coconuts from the laterite soils of coastal tracts yield more copra therefore, fetch higher prices. Coconuts from certain locality are believed to yield copra with a better flavour and taste or to have better keeping quality as compared to other locality and such nuts usually fetch a higher premium price. Comparison of wholes prices of different varieties in the markets of Dharmapuri, Figure – 9 Kanyakumari, Dindigul, producing big,
medium and small size coconuts clearly revealed that the prices fetched by big size coconuts are higher than the prices of the medium and small sized coconuts (Annexure–XXI). Harvesting of tender nuts is necessarily of a localized nature, usually fetches some what lower prices than matured nuts. The difference may vary depending upon the demands of tender nuts, which is greater in summer month (Annexure–XXI, figure-9). Prices of matured nut differ according to
Source : (Annexure – XXI) the state they are being sold as fresh or

Production and Marketing of Coconut in India
Page 82 of 122
Seasonal Indices of Coconut Prices at selected centres in India (Based on the average monthly prices for the quinquennium
2001-05)
80
85
90
95
100
105
110
115
Janu
ary
Febr
uary
Mar
ch
Apr
il
May
June July
Aug
ust
Sep
tem
ber
Oct
ober
Nov
embe
r
Dec
embe
r
Months
Indi
ces
Arsikere Kozhikode Kangyam Average
after storage. In the producing areas the prices of dry nuts are generally higher than those of fresh nuts (Annexure –XXI). 6.2.1.3 Comparison of Prices in different markets : Comparison of prices of coconut in different markets becomes difficult owing to variation in size of nuts, the period for which they have been stored and difference in the actual number of nut required to be delivered Figure-6. The prices at Ariskere market Kozhikode, Kangayam market generally took a similar course (Annexure–VIII, IX & X). It would be clear from the Figure-6 that the prices of coconut in the different markets are not comparable, and also appears to be largely influenced by local condition of supply and demand. 6.2.1.4 Seasonal Variation in Price : Unlike most other agricultural commodities coconuts are harvested several times in a year and as such prices are not affected so Figure – 10 much by the presence of supplies at any
one particular time of the year. However, the demand for coconut for copra making slackens during the monsoon months. Since, harvesting of coconut in different seasons makes the difference in quality and size of nuts reaching the market. The copra content of the nuts harvested in summer months is higher than the nuts harvested during rainy season. All these facts contribute towards variation in prices of nuts in different months of the year. In order to study the seasonal
Source : (Annexure – XXII) variation in the prices of coconut data on average monthly whole sale price for the Quinquennium 2001-2005 in respect of three centers viz. Ariskere, Kozhikode & Kangyam was analyzed. From the data, it was observed that the seasonal indices fluctuated from 94.8 to 107.5, 95.8 to 106.9 at Ariskere and Kozhikode markets respectively, the corresponding indices at Kangyam was 87.5 to 112.7 showing a wide fluctuation in the market. Figure–10 shows the seasonal impact which have been calculated by the method of moving average (Annexure – XXII).

Production and Marketing of Coconut in India
Page 83 of 122
Average Monthly Wholesale and Retail Prices of Tender Coconut in selected markets during 2002-03
(Rs.per 000' nuts)
0
2000400060008000
10000
East Godavari Kanyakumari Junagarh Thane
Markets
Rup
ees
Wholesale Retail
Seasonal Variation of Prices of Coconut in differnt markets in India
0100020003000400050006000
Janu
ary
Febr
uary
Mar
ch
Apr
il
May
June July
Aug
ust
Sep
tem
ber
Oct
ober
Nov
embe
r
Dec
embe
r
Months
Rup
ees
Arsikere Kozhikode Kangyam
The study of the average monthly wholesale prices of coconut in respect of Arsikare, Kozhikode and Kangayam markets during the Quinquennium 2001-2005 shows the direction and speed of Figure – 11 the price behaviour in long run and seasonal fluctuations within the same marketing year (Annexure-XXIII, XXIV & XXV, Figure-11) it was also observed that the annual prices movement followed similar trends and the seasonal variations were alike without much fluctuation in prices in all the three marketing centers.
Source : (Annexure-XXIII, XXIV & XXV) The coconut prices tends to rise from October/November to March/April, this
variation in trend may be due to sustained demand for copra making which starts after the cessation of monsoon rains by October/November. Large scale arrivals of coconut starts in the season from January/February months only, the demand for copra making pushes prices to higher levels. From February onwards arrivals of nuts increase and the prices decline due to the presence of more supplies. After July though arrivals of nuts are low, their quality is below average. Further the monsoon rains hamper regular copra making and consequently the demand for nuts goes down.
Figure – 12
6.2.1.5 Retail Price: The retail prices of mature nuts vary mainly according to their size. It has been observed that the difference between the retail and wholesale price varies in different markets and for different transactions, as visible from Figure-12, wherein wholesale and retail prices of coconut in different markets have been shown.
Source : (Annexure – XXVI) Figure-12, Annexure-XXVI, shows the difference between the whole sale and retail prices varied from Rs. 1000/- to Rs. 3000/- in various markets of India.

Production and Marketing of Coconut in India
Page 84 of 122
Yearly Whole sale Price Index of Coconut Oil, Copra and Coconut
0
50
100
150
200
1997
1998
1999
2000
2001
2002
2003
2004
2005
2006
Years
Inde
x V
alue
COCONUT OIL COPRA COCONUT
6.2.1.6 Prices of coconuts in relation to Prices of copra & coconut Oil : The figure-13, indicate that the trend of prices move in tandem with the coconut oil and copra Figure – 13 prices(Annexure – XXVII). It also
shows that the price of coconut in the country is dependent on the prevailing wholesale prices of coconut oil and copra, which is characterized by recurring violent fluctuation. The coconut is sold according to the price of nuts, the experience of price formation of this produce in the market shows that there is clear in identifiable price differential between copra and coconut i.e. while the price of
Source : (Annexure – XXVII) coconut in variably comes down along with a declining prices of copra, this is not always true when the prices of copra moves up. There is certain period in a year, particularly between May and June, the wet months, when the prices of coconut do not move in the same direction of copra prices. Figure –13)
On examination of percentage difference in yearly wholesale price indices of
coconut oil, copra and coconut shows that an increase or decrease in the wholesale price indices of coconut oil and copra does accompany similar increase or decrease in the wholesale indices of coconut also.
6.2.2 Copra Prices Trend : The dried kernel of matured coconut, known as copra, is commercially classified into edible and milling copra. The edible copra is processed for the market in the form of balls and cups; milling copra is processed in the form of cups and chips. According to trade estimate only 40 per cent of coconut produced in major coconut producing states, Kerala and Tamil Nadu, convert coconut to copra. About 65 per cent of copra, locally produced in Kerala is used by oil milling industry and 35 per cent is exported to upcountry markets. Though copra is a basic raw material for the end commercial products, the coconut oil but the ruling price of coconut oil is the yardstick for determining the prices of copra and coconut in the market.

Production and Marketing of Coconut in India
Page 85 of 122
Monthly Average Price of Copra in
International Market
0
100
200
300
400
500
1997 1998 1999 2000 2001 2002 2003 2004 2005 2006
Year
US
$
Phil/Indo, Cif Europe
6.2.2.1 Prices in International Markets : Analysis of a decade’s price on the international prices of copra (Annexure–XXVIII & Figure-14). It has been observed that the average price of copra was at Figure – 14 $ 434 per tonne during 1997, which declined to $ 411 per tonne in 1998. The prices have however, been looking up since the last quarter of 1998 and the average price during January–July, months of the same year, were quoted at $ 484 per tonne. However, the prices further dipped to $ 201 per tonne during 2000-01. Though, after 2001 there was some recovery in the international price of Source : (Annexure- XXVIII) copra and in 2004 increased to about $ 450 per tonne and the trend continued in 2005 ($ 471), but again declined to $ 403 in the year 2006.
Analysis of the data on the prices of copra for the quinquennium in four important Figure – 15 markets of the world viz., Java-
Indonesia, Philippines, India and Srilanka, it was found that the prices in India and Srilanka were on the higher side than that of Java in Indonesia and Philippines. The prices in other two countries were seen to follow the same international trend and were about in the range with that Cif Europe (Figure-15 & Annexure–XXIX, XXX, XXXI & XXXII). While Indian market Source :
(Annexure–XXVIII-XXXII) showed the price trend on higher side compared to the international price, it was even higher than that of copra prices in Srilankan market. 6.2.2.2 Price in India in relation to prices in Foreign Markets : The prices of copra in viz., Kochi, Alappuzha, Alleppy, Kozhikode, Manglore, Kangayam markets provide a fair index of copra prices in India (Figure-16 & Annexure-XXXIV to XXXIX). It could be observed that the prices in Foreign and Indian markets, generally exhibits a similar trend. It was observed that the Srilanka market and Indian market showed closed affinity towards their price trend than the rest of the world market, which more or less behaved in the same manner. The relative level of prices in these markets changed from time to time. The prices in Indian markets were slightly higher than the prices of Indonesia, Philippines and Srilankan markets (Annexure– XXIX to XXXII).
Yearly Average Prices of Copra in various world markets
0
200
400
600
800
1000
1200
2001 2002 2003 2004 2005
Year
US
$
International (Cif, Europe) IndianSrilankan Java-Indonesia Philipines

Production and Marketing of Coconut in India
Page 86 of 122
Yearly Average Price of Milling Copra in selected markets
0
1000
2000
3000
4000
5000
1997 1998 1999 2000 2001 2002 2003 2004 2005 2006
Years
Rup
ees
Kozhikode Kochi AlleppeyKanghyan Manglore Alpuzha
6.2.2.3 Trend of Prices in India : The fluctuating price trend of milling copra, ball copra and edible copra in different markets during the period from 1997 to 2006, could be observed from the figure No.16, and the data (Annexure-XXXIII-XXXVIII), it would be clear that he prices quoted for Figure – 16 milling copra were below the Minimum Support Prices (MSP) in the year 1996 and 1998 and the Wholesale Price Index (WPI) of copra during January–September, 1998 was 10.4 per cent lower than the average Wholesale Price Index (WPI) for the corresponding period of 1997 (Annexure–XIV & XXVII). It was also observed that the prices of ball copra remained above the MSP, though the price of coconut fell significantly during the same period. The copra prices were scaling to move Source : (Annexure-XXXIII to XXXVIII) upwards till the mid of 2000. However, the copra price plunged to lowest during the year 2001, but again recovered from September, 2002 and henceforth the trend was increasing. Outwardly it would show that the return around in the price of copra in December, 2001 and the subsequent uptrend during 2002 had been a consequence of convergence of several factors, both on the supply and demand side. The first being that the prices of copra, which had been declining since the beginning of 2000, reached lowest by the end of November 2001. This would be evident from the month end wholesale prices prevailed in the major market as shown in Figure-16. As a result, the National Agricultural Cooperative Marketing Federation of India Limited (NAFED), at the end of 2001 had to liquidate the entire stock it built up from its operations during 2000 and 2001. Secondly, the supply of copra reportedly declined considerably due to drought during 2002. Apart from reduced supply, the cumulative effect of the eriophyidmite infestation has reduced the productivity and shrinkage in the size of copra in the major producing state of Tamil Nadu, Kerala and Karnataka, thus affecting the price of copra.
It was reported that the harvesting of tender coconut for sale in all these states and
usage of coconuts for manufacturing of diversified product increased significantly. According to some market observer, resumption in future trading in coconut oil in October, 2001 helped to push the price of coconut upwardly resulting in increasing in price of copra which were ruling at very low levels prior to the commencement of the trading. Further the resumption of future trading in copra in June, 2002 has thus

Production and Marketing of Coconut in India
Page 87 of 122
Yearly Average Price of Ball Copra in selected markets
0100020003000400050006000700080009000
1997 1998 1999 2000 2001 2002 2003 2004 2005 2006
Year
Rup
ees
Kozhikode Tiptur Arisekere
strengthened the market. The copra prices which were ruling in the range of Rs.1900-2600/- quintal during January / October, 2001 stepped about Rs.2000-2500/- in November / December, 2001 and gradually moved up to about Rs.3600/- quintal in December, 2002 at Kochi market. The highest price increase in copra was recorded in the year 2004. The price increased nearly by 115 per cent over the price of 2001. A sudden crash in prices of copra and coconut oil generally causes heavy loss to copra manufacturers, trader and coconut farmers. The fall in the prices during 2005-06 of copra was due to combination of various factors such as, demand, supply, imbalances, availability of cheaper substitute and introduction of Value Added Tax (VAT). As a result of imposition of Value Added Tax (VAT), the production cost of copra also increased in the state of Kerala. The copra purchasers moved from Kerala to the neighbouring Tamil Nadu state and created an artificial surplus situation, which led to price crash in other adjoining state in 2005-06. The market for ball copra produced in Karnataka had relatively better demand pull. The wholesale price was in the range of Rs.6203/- to Rs.8000/- quintal during peak Figure – 17 months in the year 2005, which was
higher than that of Minimum Support Price (MSP) (Annexure– XXXIX to XLI). The prevailing market prices during the year 2005, showed a substantial increase over previous year prices. Unlike milling copra, the prices of ball copra remained insulated from the prices of coconut oil because it was not used by the miller for extraction. The price of ball copra remained higher because of stagnation in coconut production since 2000-01,
Source : (Annexure–XXXIX to XLI) on account of recurring drought situation and higher demand for tender coconuts.

Production and Marketing of Coconut in India
Page 88 of 122
708090
100110120
January
Febru
ary
March
AprilMay
June
July
August
Septem
ber
October
Novembe
r
Decem
ber
Avera
ge
Months
Perc
enta
ge
Kozhikode Kochi AlleppeyKanghyam Manglore Alapuzha
Seasonal Indices of Copra Prices at various markets (Base on Monthly Prices for the quiquennium 2001 to 2005)
Yearly Average Price of different varieties of Copra at Kozhikode Markets
0
1000
2000
3000
4000
5000
6000
7000
1997 1998 1999 2000 2001 2002 2003 2004 2005 2006
Year
Rup
ees
Dil Pass Grade Rajpur Grade
6.2.2.4 Price Variation due to Quality : The ball copra and the best quality of cup copra are referred as “edible copra”, while all the other qualities of cup copra are “milling copra”. Ball copra fetches the highest price, while in the cup copra, the edible qualities commands a premium price Figure – 18 over the milling qualities, the extent of premium price paid depends upon the respective qualities and the supply and demand situation in different markets for both types of copra. The variation in prices of the milling copra, and the “Dil pass grade”, the Rajpur grades in different market given in Annexure- XLII & XLIII, could be seen from the Figure-18. The edible grade invariably fetched a premium, over the milling grade; the “Rajpur grade” too fetched a higher price than the other grade. The difference between the prices of the Source : Annexure- XLII & XLIII two qualities varied from time to time. When the price trends during 1997 to 2006 were compared, both grade shared the same trend as that of coconut oil and copra, thus showing that different factors mentioned above may also influence the price of different grades in the market. 6.2.2.5 Seasonal Variation in Prices : Seasonal variation in the prices of copra has Figure – 19 been studied from the data on
quinquennium average of monthly wholesale price for the period from 2000-05 at Kochi, Alapuzha, Alleppy, Manglore, Kangayam and Kozhikode market and seasonal indices have been calculated by the method of moving average (Annexure–XLIV, Figure-19). The copra prices were usually above the annual average from October to February and below for the rest of the year at Alleppey, Alapuzha, Kangayam, Kochi and Kozhikode markets. This might have been partly Source :
(Annexure– XLIV) due to the fact that copra produced in the monsoon

Production and Marketing of Coconut in India
Page 89 of 122
0
200
400
600
800
1000
1200
1996-97 1997-98 1998-99 1999-00 2000-01 2001-02 2002-03 2003-04 2004-05 2005-06 2006-07
Year
US$
Soyabean Cotton Sun seed Peanut Palm Conola Coconut Corn
Comparision of Prices of Coconut oil with Other Vegetable Oils (Us $ Per Mt, Cif Rotterdam, Melay, US)
months, is of poor quality, copra crushing activities get stacked and exports become slower due to rains. It has also been observed that the prices were increasing steadily from May-June onwards and reaching the peak in December (7 to 11 per cent above the annual average). This was followed by a precipitated fall in January (5 to 9 points in the index) and further declined in the subsequent months reaching the minimum in April-May (5-7 per cent below the annual average). Though all the above markets had showed similar trend in seasonal variations, some market to market variation was also observed. In case of Manglore market the increase in price indices differ from the other markets. The annual average index increased from November and maintained upward trend till May. The price index dropped in May and continued till September and regained the annual average index in October. The variation between the maximum and minimum price index was about 7 to 8 per cent in the Manglore market. (Annexure- XLIV, Figure-19)
6.2.3 Trend of Coconut Oil Prices : The price of coconut oil is influenced by its supply and inelastic demand. The other factors such as end users of entire coconut oil and their responsiveness to the prevailing prices, supply of other major vegetable oils viz., palm oil, soybean oil, rapeseed oil and sunflower oil, dominating the world market and lastly the different policies of Government from time to time do have bearing on the price determination process of coconut oil. As such, the coconut oil is over priced in both, domestic and word markets as well. 6.2.3.1 Prices In International Markets : Coconut oil is an important commercial product of coconut traded with world wide demand and the price of coconut oil moves in Figure – 20 close sympathy with that of
other vegetable oil (Annexure- XLV, figure–20). The coconut industry is always susceptible to the pressure from low price oil seeds prices and increased availability of cheap oils like palm and soybean oils. Coconut oil being the source of caprelic capric, Lauric acid and myristic acid, which are considered as important items for industrial application and
Source : (Annexure- XLV) always enjoys a premium price. However, advances in petro-chemical engineering have restricted the growing industrial demand for coconut oil, instead cheap benzene substituted it in the detergent

Production and Marketing of Coconut in India
Page 90 of 122
0
200
400
600
800
1997 1998 1999 2000 2001 2002 2003 2004 2005 2006
Year
Rup
ees
Price of Coconut Oil
International Price of Coconut (1997-2006)(US $ per MT)
industry. From the analysis of a decade’s data on the international prices of coconut oil (Annexure–XLVII, Figure-21) and the annual average prices of selected vegetable oil Figure – 21
for the same period (Annexure–XLVI), it could be observed that the international prices of all vegetable oils were moving in an oscillated manner with annual fluctuation. It was observed that coconut oil had slipped more sharply in the years 2000 to 2002 and the fluctuation in the coconut oil prices were shaper than other vegetable oils, except that of palm oil which also declined sharply in the international market, thus affecting the economy of many countries in Asia Pacific
Source : (Annexure-XLVII) regions. The declining trend continued till the beginning of the year 2002, however, in the mid of 2002, the price witnessed recovery in the international market. This decline in prices was attributed to a significant increase in the supply of coconut oil from the Philippines and Indonesia and large stock of palm oil as a result of with low demand from India and China. The unpredictable high and low price on account of erratic price behavior of coconut oil, coupled with the availability of substitute oils have been found responsible for the reduced use of coconut oil in soap manufacturing industry which also cast its shadow on the overall price structure of coconut oil.
Traditionally, the coconut oil enjoyed premium price over other oils, but during
2000-04, there has been significant change in the price structure of other oils, as a result the advantage of being a premium oil deteriorated progressively. The golden era of coconut Oil in the world market in terms of price during 1980-85, was the thing of past, when annual average price was the highest ever at US$ 895/MT, moving within a range of US$450-US$1080 (Annexure–XLVIII). The decline in coconut production in Indonesia caused by the drought in 1982-83 and a significant rise in consumption in the world market, as well as by impact of bullish prices of other oils were the reasons attributed to this loss to the coconut oil industry. Since, the onset of significant improvement in supply of Palm kernel oil in 1985-89, fluctuations in prices have however been tempered, though some radical spikes in prices were still experienced intermittently, particularly with average level of US$696 in 1995-99, due to simultaneous lack of production of both Palm kernel oil and coconut oil brought about by severe El Nino in Indonesia and the Philippines, and even Malaysia, in 1998-1999.
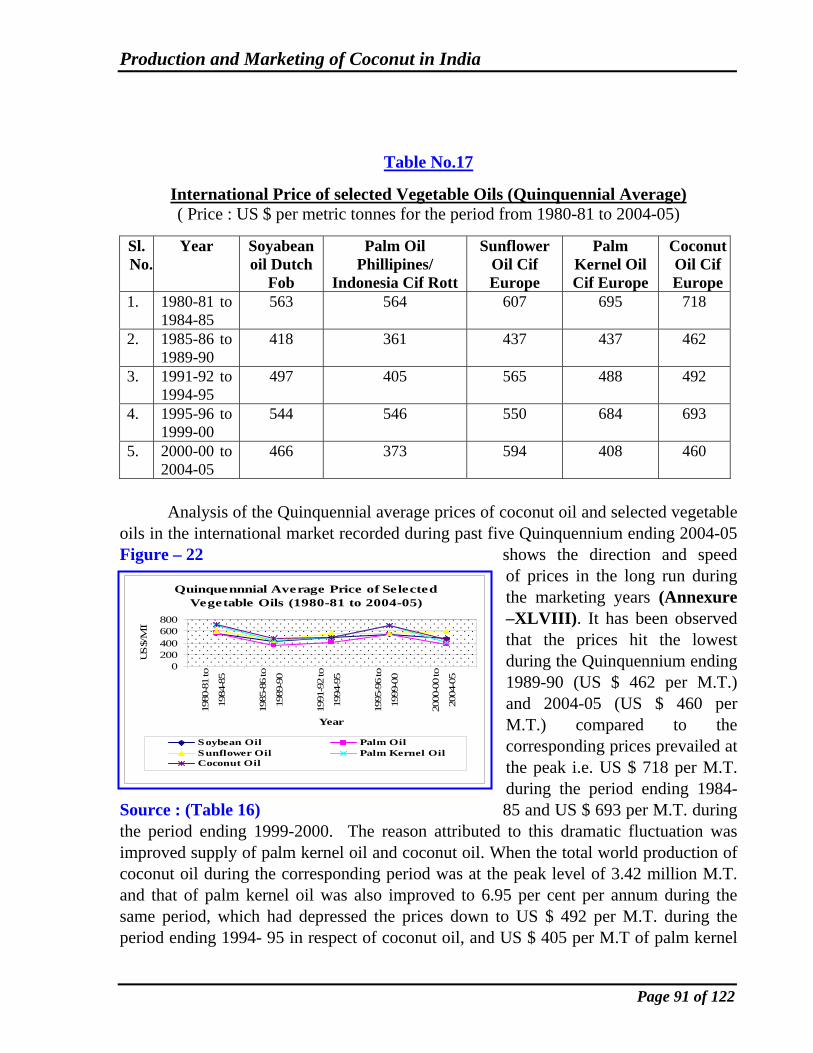
Production and Marketing of Coconut in India
Page 91 of 122
Quinquennnial Average Price of Selected Vegetable Oils (1980-81 to 2004-05)
0200400600800
1980
-81
to
1984
-85
1985
-86
to
1989
-90
1991
-92
to
1994
-95
1995
-96
to
1999
-00
2000
-00
to
2004
-05
Year
US
$/M
T
Soybean Oil Palm OilSunflower Oil Palm Kernel OilCoconut Oil
Table No.17
International Price of selected Vegetable Oils (Quinquennial Average) ( Price : US $ per metric tonnes for the period from 1980-81 to 2004-05)
Sl. No.
Year Soyabean oil Dutch
Fob
Palm Oil Phillipines/
Indonesia Cif Rott
Sunflower Oil Cif Europe
Palm Kernel Oil Cif Europe
Coconut Oil Cif Europe
1. 1980-81 to 1984-85
563 564 607 695 718
2. 1985-86 to 1989-90
418 361 437 437 462
3. 1991-92 to 1994-95
497 405 565 488 492
4. 1995-96 to 1999-00
544 546 550 684 693
5. 2000-00 to 2004-05
466 373 594 408 460
Analysis of the Quinquennial average prices of coconut oil and selected vegetable
oils in the international market recorded during past five Quinquennium ending 2004-05 Figure – 22 shows the direction and speed
of prices in the long run during the marketing years (Annexure –XLVIII). It has been observed that the prices hit the lowest during the Quinquennium ending 1989-90 (US $ 462 per M.T.) and 2004-05 (US $ 460 per M.T.) compared to the corresponding prices prevailed at the peak i.e. US $ 718 per M.T. during the period ending 1984-
Source : (Table 16) 85 and US $ 693 per M.T. during the period ending 1999-2000. The reason attributed to this dramatic fluctuation was improved supply of palm kernel oil and coconut oil. When the total world production of coconut oil during the corresponding period was at the peak level of 3.42 million M.T. and that of palm kernel oil was also improved to 6.95 per cent per annum during the same period, which had depressed the prices down to US $ 492 per M.T. during the period ending 1994- 95 in respect of coconut oil, and US $ 405 per M.T of palm kernel

Production and Marketing of Coconut in India
Page 92 of 122
oil. Prices of other major vegetable oil were bearish as well, compare to the corresponding prices during the same marketing year.
The world production of vegetable oils is dominated by soybean oil, palm oil,
rapeseed oil and sunflower oil. In the last five years the soybean oil grew at 28 per cent, palm oil at 45 per cent, rapeseed oil 29 per cent and sunflower oil at 24 per cent. The palm oil production has surpassed the production of soybean oil to become world’s largest oil on account of high productivity of the palm oil crop in South East Asian countries. But the growth of coconut oil during the same period was reported to be 0.46 per cent only in the world market. The productivity of coconut in the coconut producing countries all over the world is not enough to compete with productivity levels of competing oil seed crops like palm kernel oil, which is often considered as substitute for coconut oil. The global production, trade and price scenario of coconut oil also has been witnessing certain erratic trend and indeed was on a roller coaster in the recent past. This phenomenon might possibly be due to a more volatile price behavior of competing substitutes like palm oil in the world trade that highlight the prevailing uncertainty of coconut sector in global perspective as well. Since the behaviour of coconut oil price is relatively dependent on over all supply of oils and fats, the coconut oil is loosing its premium position in the vegetable oil trade to other oils. However, due to special characteristics of coconut oil, it has a minimum level of demand below which the coconut oil market moves independent of general oil seeds and fat market. When supply fluctuates around this inelastic level, considerable difference in price may occur. 6.2.3.2 Prices In India In Relation To Price In International Markets : When the average price of coconut oil at Kochi, Alapuzha, Kozhikode, Kangayam for a decade ending 2006 was compared with Figure – 23 the average price of Cif Rotterdam, it was observed that (Annexure- XLVII-XLIX, Figure-23) the price of coconut oil has always been much higher in India than in the International market because of inclusion of the coconut oil in the list of restricted items of imports. The world price of coconut oil declined to US $ 657 and $ 659 per tonne in 1997, 1998 respectively and had increased to $ 766 per tonne during Source : (Annexure-XLVII-XLIX)
A V ER A GE A N N U A L P R IC E IN IN D IA N A N D IN TER N A TION A L
M A R KETS OF C OC ON U T OIL
657 658 738450 317 398 467
662 628607
1448
10671265
766657
8961201
14501233
1043
0
50 0
100 0
150 0
200 0
2 50 0
1997 199 8 1999 200 0 2 001 20 02 20 03 2 004 20 05 2 006
Y EA R S
Ineter. Average. Indian average

Production and Marketing of Coconut in India
Page 93 of 122
(January–July), 1999. The international scenario of the price of coconut oil when compared to the domestic market during the same period, it was about 60 per cent higher than the international prices. However, during 2001-2005 the international prices and Indian prices didnot show much of the difference and the trend was same in both the markets; though the prices remained over all higher in the Indian markets than that of international market. 6.2.3.3 Trend of Coconut oil Prices In India : India produces about 4.5 lakhs tones of coconut oil which is equivalent to about 6.9 lakhs tonnes of milling copra. It has been reported that out of all coconut producing states, Tamil Nadu and Kerala accounts for 90 per cent of coconut oil production in the country. The average annual prices of coconut oil in different markets of the country during 1997 to 2006 would indicate the prices trend prevailed in the coconut oil markets (Annexure–XLIX to LIII). According to an estimate 40 per cent of the coconut produce is used for production of oil for direct consumption and cosmetic purposes. The usage of coconut oil as a cooking medium is confined to Kerala. It has been estimated that the overall demand for coconut oil as a cooking medium has only increased by about one per cent per annum. About 1.6 lakhs tonnes of oil is being used annually for direct household consumption and about two lakhs tonnes of coconut oil per annum is used for non household purpose, such as manufacture of hair oil, cosmetic and medicinal preparation and associate industrial consumption.
The coconut oil prices are decisive factors in determine the price of copra and coconuts. It has been observed that Kerala being coconut consuming state, coconut prices are controlled in the wholesale markets of Kochi and Kozhikode in the state. It has been observed since long that the prices of coconut oil always fluctuate, prices of coconut oil has no relation between the movement of prices during the season and off season sale in the wholesale market. The frequent, wild and wide fluctuation in coconut oil prices during the season and off season upset the economic of all these stake holder involved in the marketing channel of coconut oil. The high price of coconut oil has widened the price gap between other edible oils. The palm oil and palm kernel are principle substitute of coconut oil. The former competes with coconut oil in the edible oil segment and later in the non edible oil segment. Limited consumption base of the edible coconut oil and erratic prices situation in coconut oil market has led to a shift in demand for cheaper vegetable oils, available plenty in the market. The palm oil prices are globally cheaper than other major edible oil and they not only dominate the Indian import scenario but also trend to transmit price signal to domestic edible oil and oil seed. The traders opined that this shift in consumption pattern to cheaper vegetable oil would result in a slump in demand and draw in price of coconut oil. Further, Kerala, no longer holds the number one position as larger producer of copra in the country, but the neighbouring state of Tamil Nadu has emerged as the consequent largest producer of

Production and Marketing of Coconut in India
Page 94 of 122
507090
110
130150170190
1997
1998
1999
2000
2001
2002
2003
2004
2005
2006
Year
Inde
x N
umbe
r
indices
Wholesale Prices Indices of Coconut Oil (1997-2006)
coconut, which has resulted in an ease in coconut oil prices in the wholesale market of Kochi. It would thus result in narrow gap in demand and supply in the southern coconut sector in times to come. The price gap might not show a noticeable upward trend during the lean period in Kerala, as demand might not improve in the face of increase production in Tamil Nadu state and large scale import of edible oil in the country. The average annual prices of coconut oil in different markets of Kerala and Tamil Nadu during 1997 to 2006 (Annexure–XLIX to LIII) indicates the trend of prices of coconut oil prevailed in the country.
The prices of coconut oils in India showed a declining trend from 1997 to 1998, which again increased in the year 1999. The average price of coconut oil which was found to decline by 10.1 per cent, from Rs. 5259 in 1997 to Rs. 4403 in 1998, had again Figure – 24 started rising during 1999. The
average wholesale price indices (Annexure-LIV-LV, Figure-24) of coconut oil which had declined by 10.1 per cent from 146.1 in 1997 to 131.4 in 1998 have again gained during 1999. The index has risen from 133.7, in January, 1999 to 143.4, in April, 1999. Afterwards, though the index has registered a striking decline, it has again gone up to 143.3 in August, 1999 (Annexure–LIV-LV). During January-August, 1999, the month
Source : (Annexure-LIV-LV) end wholesale prices of coconut oil were reported in the range of Rs.5000-5900 per quintal at Kozhikode market and Rs.5000-5800 in Kochi market. The price had risen from Rs.4978 in January, 1999, to Rs. 5565 in April, 1999. Afterwards, though the prices had registered a slight decline, it had again gone up to Rs.5888 in November of 1999. The reason for higher price ruling in all the major markets (Annexure–XLIX-LIII) during 1999 was attributed, mainly to a reported decline in the production of coconut and copra. Coconut oil price was much higher in India than the international markets (Annexure–XLVII & XLIX) and is possibly that was because, in 1999 both copra and coconut oil were on the list of restricted imports. However, India having lost its case for continuing with quota restriction in WTO, the effect of competition from abroad was felt more than anticipated earlier.

Production and Marketing of Coconut in India
Page 95 of 122
AVERAGE ANNUAL PRICES OF COCONUT OIL AT KOCHI,ALEPPY,KOZHIKODE, KANGAYAM MARKETS
5259
4403
5446
34473103
4352
5863
6629
561349665232
4419
5445
34423106
4316
5859
6590
56234942
5411
6720
5588
37423315
4466
59756705
5976
4981
6176
4794
6333
4220
3475
4422
58546529
59235314
20003000400050006000700080009000
1997 1998 1999 2000 2001 2002 2003 2004 2005 2006
Year
Rs.
Per
tonn
eKochi Market Aleppey market Kozhikode market Kangayam
The coconut oil prices fell by over 24 per cent during 2000, followed by a further fall of 12 per cent in 2001. The wholesale Figure – 25 price index of coconut oil, however, staged a sharp turn around in December, 2001 and registered an average increase of about 12 per cent during 2002 (January–October).The month end price of coconut oil, which ruled the markets in the range of Rs.2800-3200 per quintal during January-October, 2001 in Alappuzha, Rs.2900-3400 in Kozhikode, Rs. 2800-3000 in Kochi market, and Rs.3100-3600, in Kangayam market, spurted to Rs.3400-3750 and Rs.3650-4160 in November– Source : (Annexure–XLIX-LIII) December, 2001, respectively, in the above markets. However, with some initial hesitancy, the price of coconut oil gradually moved up during 2002 and the average price quoted in October 2002 was Rs. 4637 in Kochi market, Rs.4600/- per quintal in Alappuzha, Rs.4800/- in Kozhikode and Rs. 4800 in Kangyam market. The monthly average market price of coconut oil in wholesale markets of Allapuzza, Kerala in 2003 ruled at Rs.6250 per quintal. The average index number of wholesale prices for coconut during January-September, 2003 was 140.7 (Annexure – XLIX to LIII). One of the reasons attributed to the above spurt in prices was the resumption of futures trading in coconut oil in October, 2001, under the first commodities Exchange of India Ltd., Kochi, after a gap of 3 decades. Secondly the net import of coconut oil, despite very low international prices as compared to domestic prices, has been insignificant in terms of volume in recent years. Apart from high tariff of 85 per cent, coconut oil continued to remain a canalized item, to be imported only through an authorized State trading organization. However, net import levels of about 9 thousand tonnes in 2000-01 and 24 thousand tonnes in 2001-02 had also not materially affected the supply situation of coconut oil. Thirdly, the industrial demand for coconut oil has considerably been shifted to other vegetable oils, especially palm kernel oil in the sector such as paints, soaps and detergents.
The price of coconut oil during 2004 also ruled above last year’s level. The wholesale price index fluctuated between 166.3 and 175.7 during January-July, 2004.

Production and Marketing of Coconut in India
Page 96 of 122
The average wholesale price index of coconut oil is estimated at 162.8 and 174.6 in the peak season of coconut and 170.7 in July, 2004 were higher by 21.1 per cent, 28.8 per cent and 23.8 per cent than in the correspondence months of 2003. The prices of coconut oil have been reported in the range of Rs.5900-6800 per quintal during peak period (January-May) and Rs.6975 in August at Kozhikode, Rs.5800-6500 during lean period and at Alappuzza, Rs.6950 in August and Rs. 5800-6500 during peak period and Rs.7025 in August at Kochi in Kerala. The import of coconut oil despite very low international price (Rs.30447 metric tonnes), as compared to higher domestic price of Rs.81249 per metric tonnes in Tamil Nadu and Rs.63906 in Kerala. The average index number of Wholesale Prices Index (WPI) of coconut oil, with 1993-94 as base, recorded at 172.8 during first seven months (January-July) of the year 2005 was marginally higher than Wholesale Prices Index (WPI) of 172.6 during the corresponding period of the previous year. The Wholesale Prices Index (WPI) of coconut oil during different months of 2005 also revealed a similar trend as that of copra. The Wholesale Prices Index (WPI) after remaining higher than the last year’s level by 9.2, 11.2 and 3.6 per cent during January, February and March, fell below the last year’s level by 0.9, 6.3, 6.4 and 8.5 per cent in April, May, June and July, 2005. In consonance, the month end wholesale prices of coconut oil remained higher than last year’s, level during first two months (January and February) at Kozhikode, Alappuzha and Ernakulam in Kerala. (Annexure- XLIX-LV)
The agricultural trade liberalization is apparently swinging the market equilibrium against the interest of coconut oil prices. The import of cheaper vegetable oil with low incidence of duty and more specifically to the import of palm oil and palm kernel oil has increased the availability of cheaper substitutes for coconut oil. This has depressed the demand for coconut oil, imparting its price in the market. The palm oil being cheaper than other edible oils dominates the import basket of edible oils. The imports have increased more than fifteen folds from 3.46 lakhs tones to 52.90 lakhs tones.
It has been reported that there has already been a consumption shift to cheaper vegetable oil due to price advantage among the lower income strata of the society in Kerala. Though, the Government authority had again increased the import duty from 65 per cent to 80 per cent for crude palm oil and crude palmolein, from 75 per cent to 90 per cent for RBD palm oil, RBD palmolein and other palm oil, but the gap between the price of cheap imported substitutes and domestic produce still remained wide.

Production and Marketing of Coconut in India
Page 97 of 122
80.00
85.00
90.00
95.00
100.00
105.00
110.00
115.00
January
Februa
ryMarc
hApril
May June July
August
Septem
ber
October
November
December
Months
Inde
x N
umbe
r
Kochi Aleppey Kozhikode Kangayam Avrage
Seasonal Indices of Coconut Oil Prices for the Quinquennium 2001-05
6.2.3.4 Seasonal variation in prices : The production and consumption pattern during various season in the country always affects the price structure of all the agricultural and horticultural produce. The analysis of data on the average monthly wholesale prices of Figure – 26 the Quinquennium 2001-
2006 in respect of Kochi, Alleppey, Kozhikode and Kangayam market has also revealed the seasonality in coconut oil prices (Annexure–LVI & LVII, Figure-26). It has been observed that the price tends to decline during January to May and then steadily increase till it riches to peak by December. The main reason attributed for the
Source : (Annexure-LVI- LVII) decrease is the peak production period of coconut and copra. The increase of prices of coconut oil during September to December is on account of shortage of raw material and the peak price increase is due to the highest seasonal demand for coconut oil during the festival period as there are different festivals like Onam, Deepawali, X’mas and New Year, when the demand of coconut oil is at the maximum.
6.2.4 Coconut Oil Cake Price Trend : Oil meals are a rich source of proteins and are used as cattle feed all over the world including India. Oil meals are obtained after the extraction of oil from oilseeds whether by expelling or solvent extraction. Oil meals from India are exported across the world in view of the heavy demand from many developed and developing countries, as an ingredient of animal feed, where animal meat consumption is high. The animal gains weight by eating more proteins through the oil meals, which results in higher yield of meat per animal.
Coconut oil cake/meal is the residue left after extracting oil from copra. The yield of coconut oil cake may be reckoned to vary from 33 to 36 per cent of the copra. Traditionally it is used as cattle feed. The most important qualities of coconut oil cake as observed by the farmers are its palatability to the animals and better results in terms of
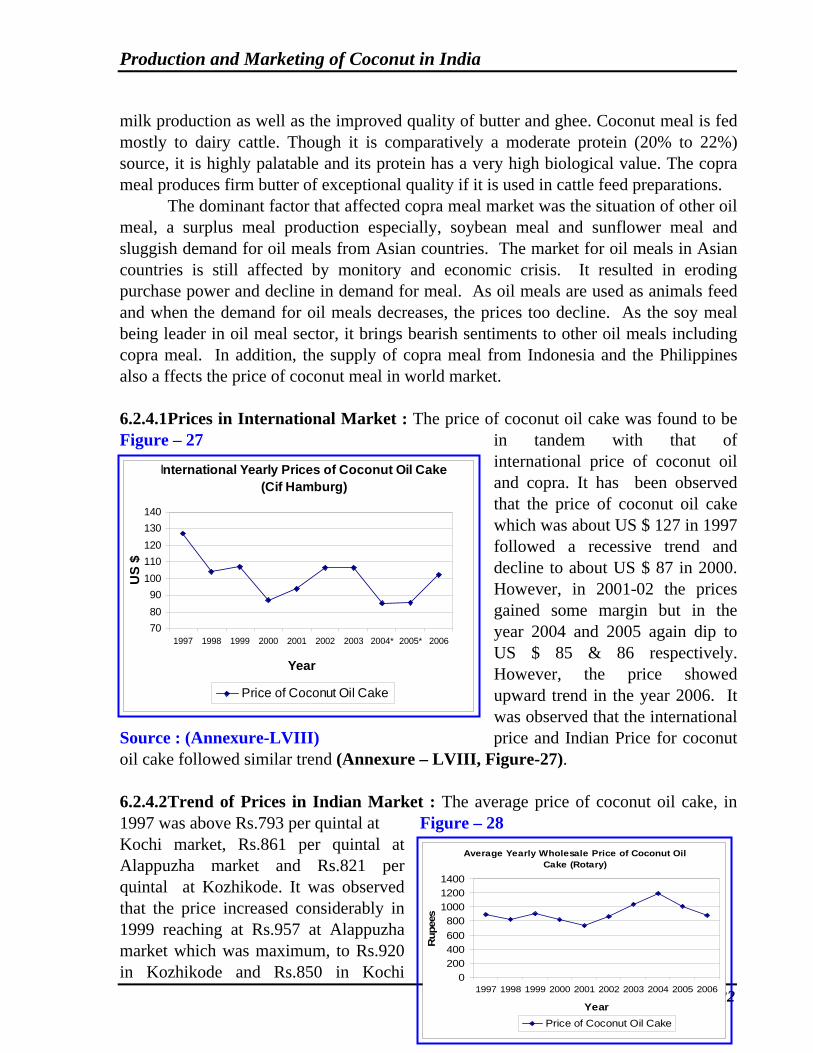
Production and Marketing of Coconut in India
Page 98 of 122
Average Yearly Wholesale Price of Coconut Oil Cake (Rotary)
0200400600800
100012001400
1997 1998 1999 2000 2001 2002 2003 2004 2005 2006
Year
Rup
ees
Price of Coconut Oil Cake
708090
100110120130140
1997 1998 1999 2000 2001 2002 2003 2004* 2005* 2006
Year
US
$
Price of Coconut Oil Cake
International Yearly Prices of Coconut Oil Cake(Cif Hamburg)
milk production as well as the improved quality of butter and ghee. Coconut meal is fed mostly to dairy cattle. Though it is comparatively a moderate protein (20% to 22%) source, it is highly palatable and its protein has a very high biological value. The copra meal produces firm butter of exceptional quality if it is used in cattle feed preparations.
The dominant factor that affected copra meal market was the situation of other oil meal, a surplus meal production especially, soybean meal and sunflower meal and sluggish demand for oil meals from Asian countries. The market for oil meals in Asian countries is still affected by monitory and economic crisis. It resulted in eroding purchase power and decline in demand for meal. As oil meals are used as animals feed and when the demand for oil meals decreases, the prices too decline. As the soy meal being leader in oil meal sector, it brings bearish sentiments to other oil meals including copra meal. In addition, the supply of copra meal from Indonesia and the Philippines also a ffects the price of coconut meal in world market.
6.2.4.1 Prices in International Market : The price of coconut oil cake was found to be Figure – 27 in tandem with that of
international price of coconut oil and copra. It has been observed that the price of coconut oil cake which was about US $ 127 in 1997 followed a recessive trend and decline to about US $ 87 in 2000. However, in 2001-02 the prices gained some margin but in the year 2004 and 2005 again dip to US $ 85 & 86 respectively. However, the price showed upward trend in the year 2006. It was observed that the international
Source : (Annexure-LVIII) price and Indian Price for coconut oil cake followed similar trend (Annexure – LVIII, Figure-27). 6.2.4.2 Trend of Prices in Indian Market : The average price of coconut oil cake, in 1997 was above Rs.793 per quintal at Figure – 28 Kochi market, Rs.861 per quintal at Alappuzha market and Rs.821 per quintal at Kozhikode. It was observed that the price increased considerably in 1999 reaching at Rs.957 at Alappuzha market which was maximum, to Rs.920 in Kozhikode and Rs.850 in Kochi

Production and Marketing of Coconut in India
Page 99 of 122
Yearly Average Price of Coconut Oil Cake at different Markets in India
500
700
900
1100
1300
1500
1997 1998 1999 2000 2001 2002 2003 2004 2005 2006
Years
Rup
ees
Kochi Market Alappuzha Market Kozhikode Market
Seasonal Indices of Coconut Oil Cake for the Quinquennium 2001-05
70.0080.0090.00
100.00110.00120.00130.00
Janu
ary
Febr
uary
Mar
ch
Apr
il
May
June
July
Aug
ust
Sep
tem
ber
Oct
ober
Nov
embe
r
Dec
embe
r
Months
Indi
ces
Kochi Alappuzha Kozhikode Average
markets, respectively. Thereafter, the prices showed a downward trend and almost fell down to Rs.706 in Kozhikode market in the year 2001. During 2002, Source : (Annexure– LIX) however, prices showed some increase and the trend continued till the end of 2004. However, after 2004 the price once again showed recessive trends (Annexure–LX, LXI & LXII, Figure-29). 6.2.4.3 Comparison of Prices in different Market : The comparison of yearly average Figure – 29 prices of coconut oil cake
prevailed in the important markets viz; Kochi, Alappuzha and Kozhikode show that the prices in all the three markets followed similar trend (Annexure-LX to LXII, Figure-29). Though the prices of coconut oil cake in these three market’s do not move in close sympathy with on another on monthly basis. The prices of coconut oil cake at Alappuzha market were generally higher
Source : (Annexure- LX to LXII) than those at Kochi and Kozhikode markets. 6.2.4.4 Seasonal Variations in Prices : The analysis of the data on the price of coconut oil cake for the quinquennium ending Figure – 30 2001-2005 showed that the seasonal variation in coconut oil cake at Kochi, Alappuzha at Kozhikode market showed that the price of coconut cake were usually above the annual average from January to May and below for rest of the year. In Kozhikode market, however, the prices were found to be more than the annual average during November to February. It was also observed that in the month of January the percentage increase was in the range of 7 to 20 per cent Source : (Annexure-LXIII)
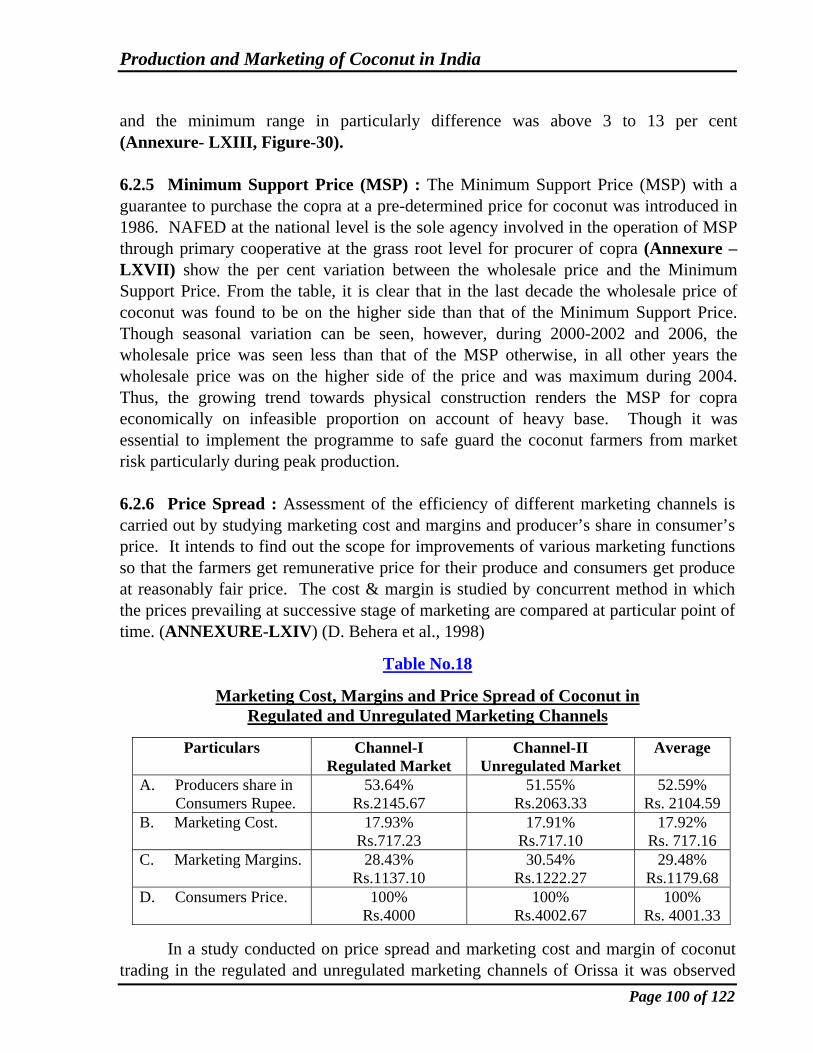
Production and Marketing of Coconut in India
Page 100 of 122
and the minimum range in particularly difference was above 3 to 13 per cent (Annexure- LXIII, Figure-30). 6.2.5 Minimum Support Price (MSP) : The Minimum Support Price (MSP) with a guarantee to purchase the copra at a pre-determined price for coconut was introduced in 1986. NAFED at the national level is the sole agency involved in the operation of MSP through primary cooperative at the grass root level for procurer of copra (Annexure –LXVII) show the per cent variation between the wholesale price and the Minimum Support Price. From the table, it is clear that in the last decade the wholesale price of coconut was found to be on the higher side than that of the Minimum Support Price. Though seasonal variation can be seen, however, during 2000-2002 and 2006, the wholesale price was seen less than that of the MSP otherwise, in all other years the wholesale price was on the higher side of the price and was maximum during 2004. Thus, the growing trend towards physical construction renders the MSP for copra economically on infeasible proportion on account of heavy base. Though it was essential to implement the programme to safe guard the coconut farmers from market risk particularly during peak production. 6.2.6 Price Spread : Assessment of the efficiency of different marketing channels is carried out by studying marketing cost and margins and producer’s share in consumer’s price. It intends to find out the scope for improvements of various marketing functions so that the farmers get remunerative price for their produce and consumers get produce at reasonably fair price. The cost & margin is studied by concurrent method in which the prices prevailing at successive stage of marketing are compared at particular point of time. (ANNEXURE-LXIV) (D. Behera et al., 1998)
Table No.18
Marketing Cost, Margins and Price Spread of Coconut in Regulated and Unregulated Marketing Channels
Particulars Channel-I Regulated Market
Channel-II Unregulated Market
Average
A. Producers share in Consumers Rupee.
53.64% Rs.2145.67
51.55% Rs.2063.33
52.59% Rs. 2104.59
B. Marketing Cost. 17.93% Rs.717.23
17.91% Rs.717.10
17.92% Rs. 717.16
C. Marketing Margins. 28.43% Rs.1137.10
30.54% Rs.1222.27
29.48% Rs.1179.68
D. Consumers Price. 100% Rs.4000
100% Rs.4002.67
100% Rs. 4001.33
In a study conducted on price spread and marketing cost and margin of coconut trading in the regulated and unregulated marketing channels of Orissa it was observed

Production and Marketing of Coconut in India
Page 101 of 122
that the average producers’ share was 53.64 per cent in case of Sakhigopal regulated marketing channel and 51.55 per cent through unregulated marketing channel. Where as the marketing cost in both the channels was almost the same i.e. 17.93 and 17.19 respectively. The total trade margin was more 30.54 per cent in unregulated markets than in regulated (28.43 per cent). However the average consumers price was almost same for both the marketing channel Rs.4000 per 1000 nuts and Rs.4002.67 per 1000 nuts in unregulated marketing channel. In an another survey conducted in central Kerala, it was observed that Coconut are marketed through different channels viz.
Producer → Copra Maker → Oil Miller → Wholesaler → Consumer. Producer → Oil Miller → Wholesaler → Retailer → Consumer. Producer → Oil Miller → Consumer. Producer → Itinerant Merchant → Wholesalers → Oil Miller → Retailer
→ Consumer.
However the most predominant channel had been the producer→Copra Maker→Oil Miller→ Wholesaler→Consumer in the Kerala State. It was observed that the price realized by the farmers was Rs.310/- per 100 nuts and price paid by consumers for the same was Rs.512/- per 100 Coconuts. (Table No.19) implying a price spread was Rs.202/- per 100 nuts.
Table No.19
Margins and Costs of various Intermediaries for Coconut Marketing in Central Kerala
Sl. No. Rs. Percentage i) Price received by Farmer 310.33 60.58 ii) Price received by Copra maker. 415.25 81.06 iii) Marketing Cost of Copra Maker. 33.60 6.56 iv) Price realized from by products by copra maker. 9.53 1.86 v) Net Margin of Copra Maker. 80.85 15.78 vi) Price paid by Wholesaler. 431.00 84.14 vii) Marketing Cost of Oil Miller (Milling) 16.00 3.12 viii) Price realized from by products by Oil Miller. 25.25 4.93 ix) Net Margin of Oil Miller. 25.00 4.88 x) Marketing Cost increased Wholesaler. 00.50 00.10 xi) Price paid by retailer. 459.00 89.60 xii) Net Margin of Wholesaler. 27.50 5.37 xiii) Marketing Cost incurred by retailer. 2.12 00.41 xiv) Net Margin of retailer. 51.13 9.98 xv) Price paid by Consumer. 512.25 100.00 xvi) Price Spread. 201.92 39.42
Source : Journal of Tropical Agriculture

Production and Marketing of Coconut in India
Page 102 of 122
The study reveled that the producer’s share in Consumer’s rupee was 61 per cent of the price paid by the end consumer and the price spread was 39 per cent. (Santosh et.al., 2004)
COCONUT PRODUCTS / BY PRODUCTS: UTILISATION AND
DIVERSIFICATION 7.1 Major coconut production in the country primarily is in demand from consuming states for traditional products viz. matured nuts, tender coconut water, coconut oil, desiccated coconut, oil cake and coir products. Nearly 90 percent coconut production is directed for traditional use in domestic markets. The most important traditional commercial product traded in the country has been the coconut oil. Therefore, the demand and supply of this single coconut product determines the price of raw coconut. Moreover, the market share of coconut oil both in domestic and export market is declining due to tough competition, especially from palm and soybean oil prices. Diversification efforts made by coconut oil industries have yielded limited success. In the process of diversification and product development, to bring new coconut products in the market, strategic market research is essential. Besides, coconut oil and oil cake, the coconut processing industry traditionally has been confined to copra production, manufacture of desiccated coconut, coir and coir products only. Because, the coconut processing sector remained confined to these traditional products, it has been observed that inspite of commendable achievements made in enhancing the production and productivity of coconut, the processing sector could not make much progress in the direction of diversification and value addition to coconut products. The processing determines effective utilization of harvested produce and the quality of the end product, which ultimately affect the consumption and acceptance of the product. 7.2 However, with the advent of modern technology and for faster development of coconut sector in the country, product diversification, value addition and byproduct utilization have gained importance, to create demand for new products and byproducts in domestic market, and to ensure their supply throughout the year. Further, the cost of production of the traditional coconut products in the country has been so high that price-wise, the Indian coconut products are less competitive in global market. Its contribution to export market has therefore been insignificant except the coir and coir products.
In the process of diversification and product development, more than 50 value added coconut products have been developed in Asian and Pacific Countries for domestic as well as export market. Though actual data about these products could not be obtained, some of the important products which have received consumer acceptance in

Production and Marketing of Coconut in India
Page 103 of 122
the country are coconut cream, coconut milk, coconut water and nata-de-coco which has also gained expanded market in Philippines and Indonesia. Pre-packed tender coconut water in sachet is produced by number of countries and has gained popularity. Philippines is even producing and exporting coco-chemicals viz. fatty alcohol, fatty acids. These products could be promoted for wider and global acceptance through concerted efforts and aggressive market strategies by APCC countries. 7.3 In India, product diversification of coconut was accelerated in late nineties due to sustained efforts made by Coconut Development Board by employing technology development through reputed Research Institutions in the country. The marketable value added products includes packed tender coconut water, coconut milk and milk based products, coconut chips, coconut based dairy products, desiccated coconut, coconut water based products, snowball-tender-coconut, vinegar, coir based products, coconut shell and coconut wood based products. Other products, which are being subjected to research and development, are organic food, oleo chemical, bio-diesel, bio-lubricant and cosmetics. Some of these products viz. coconut milk, coconut cream, spray dried coconut milk powder, vinegar, packed tender coconut water, snowball-tender- coconut and virgin-coconut-oil have been produced on commercial scale. Besides, coconut biscuits, coconut chips, coconut based sweets and coconut chutney like traditional convenience products, using indigenous technology were already in the market. The Government of India, through the Coconut Development Board made strategic efforts and motivated entrepreneurs industrialist and artisans to exhibit their products in national and international trade fairs and exhibitions, to get better access to up country markets. Coconut shell and wood based products viz. handicrafts and utensils certainly have aesthetic utility and value. It has been observed that these products have good demand for export too. 7.4 Tender Coconut : In the development process of coconut, about 12 months Plate – 18 period lapses between the emergence of inflorescence
and complete maturity of the fruits and at one point of time palm carry 12 or more bunches of coconut at successive stages of development, each representing growth interval of about a month. In the development process the fruit reaches it maximum size normally in the 6 months and filled with nut water through out this period. The water of tender coconut is technically called as liquid endosperm. The kernel starts forming
Packed Tender Coconut water as a thin soft layer in 6 months and increases in its hardness and quantity till the end of maturity. With the increase in thickness of kernel

Production and Marketing of Coconut in India
Page 104 of 122
the internal cavity gets reduce in size and decrease in quantity of nut water as the nuts ripen. The chemical composition and volume of nut water changes during maturation. The coconut water plays an important role in bio-synthesis of fat in the kernel and also in the development of germination of the nuts. Maximum volume of water has been found in 6th month old nuts as reported from many coconuts growing states. The immature nut of three months old contains small quantity of water and maximum is found in the eighth months, there after, there is sharp decline in water content as the nut ripens. The water of tender coconut is the most nutritious, wholesome beverage that nature has provided. It has calorific value of 17.4 per hundred gms. with the normal PH between 4.9 and 5.2. Sugars are important constituents of tender coconut water found in maximum concentration of about 5 to 5.5 percent in early months of maturation and slowly reduces to 2 percent at the stage of full maturity of nuts. In early stages of maturity glucose, fructose and sucrose are found in the coconut water. In the fully matured nuts approximately 50 percent of total sugar is sucrose. The composition of total sugar, reducing sugar and non-reducing sugar in tender coconut water, vary from variety to variety and from place to place, even at the same stage of maturity. The tender coconut water contains most of the minerals such as potassium, sodium, calcium, phosphorous, iron, copper, sulphur and magnesium. The tender coconut water being rich in potassium and other minerals is of immense the rapeutic value as di-uretic and is considered curative for hypertension. It is rich in vitamin C (ascorbic acid) content and other vitamins of ‘B’ (Annexure-LXIX) group. Tender coconuts are plucked, transported and sold in natural form which involves lot of transportation cost due volume of the nuts so the answer lies in value addition and establishment of processing units for manufacture of pre-packed coconut water in consumer packs. 7.4.1 Snow Ball Tender Coconut : The snow tender kernel of tender coconut is a delicious dessert. Traditionally, the kernel of tender coconut is sometimes consumed after drinking the water by the consumer or Plate – 19 else the ball is thrown away. The tender coconut water along with tender coconut kernel without husk is produced and named as snow ball tender coconut. It is the tender coconut without husk, shell, and testa which is in ball shape and white in colour. This white ball contains tender coconut water which can be consumed by

Production and Marketing of Coconut in India
Page 105 of 122
just inserting a straw through the top white tender coconut kernel. Coconut of 8 month of maturity is considered suitable for making snowball tender coconut. Snow Ball Tender Coconut The snow ball tender coconut can be individually packed and refrigerated under hygienic condition, thereby increasing the shelf-life of this product, the snow ball coconut can be stored for prolonged period and sold as ready to serve product. 7.4.2 Egg Coconuts : Eggs coconut referred to a form of product derived from tender coconut where a whole around soft kernel is pulled out from its shell with tender water Plate – 20 intact in it. Generally the small sizes of older bunch of tender
nut are used to make egg coconut and this generally correspondto 8 to 9 month’s old fruits. In Malaysia the commercial processor of egg coconut usually harvest the Malayam Yellow Dwarf variety because the husk shell of MYD is softer and the nuts are smaller in size and easier to process.
Egg Coconut 7.4.3 Pre Packed Tender Coconut Water : Tender coconuts from the producing area are transported and sold in their natural form involving a lot of transportation cost due to volume of the material. Moreover, life of tender coconut water in the nut is short and can not be kept for long duration. The shelf life of the tender coconut water can be increased by packing it in flexible pouches or in alluminium beverage containers. The optimum age of tender coconut for this purpose is around 6 months as tender coconut water attains it optimum level of quantity and quality in respect of flavour, taste and yield. The characteristic flavour of tender coconut water is contributed by heat sensitive sugars and hence and partial heat treatment combined with preservative is employed. The flavours of the tender coconut vary, in accordance with the agro-climatic conditions, irrigation, nature of soil and level of fertilizers applied. Therefore, to obtain a uniform taste some of the sweetening agents are added to bring it to the optimum level and acceptability. The pre packed tender coconut water is well acceptable upto a period of 3 months under ambient condition and about 6 month under refrigerated conditions, without any change in the flavour. The flavour retention is better in case of cans than in flexible pouches. 7.4.4 Bottled Coconut Water : Matured coconut water can be marketed as natural soft drink if preserved and packed in bottles as non-carbonated beverage. The process involves collection of water, up-gradation, pasteurization, filtration and bottling. The coconut water collected from copra processing units is immediately filtered through a clean cheese cloth. Initial filtration at the collection centres reduces the bacterial load in

Production and Marketing of Coconut in India
Page 106 of 122
the water. The pH of the coconut water is adjusted to 4.2 with citric acid and 0.1 – 0.15 per cent sodium citrate as the salt reduces the bitter taste that may develop on addition of citric acid to stabilize the acidic pH. Sodium chloride at the concentration of 0.01 to 0.05 per cent found to have improved the taste in some formulations. The total soluble solid content is adjusted to 8-10 per cent with refined sugars. Sodium benzoate is also added @ 0.05 per cent to increase the shelf life. The formation is immediately pasteurized at 940C for 25-30 minutes. Excessive heat treatment is avoided as it imparts cooked flavour to the product. The protein starts coagulating at 700C at this stage; rigorous agitation is also avoided in order to prevent disintegration of protein coagulation into fine particles. After pasteurization, the formulation is passed through a pressure filtration mechanism and the filtered product is filled in sterilized bottles and sealed, when the temperature of the product in the bottle ranges between 720C to 750C. The bottled coconut water can be stored for three months at ambient temperature without spoilage. 7.4.5 Coconut Vinegar : Coconut water can be converted into vinegar by using vinegar generator assembly which comprises a feed vat, an acidifier and a receiving vat for collection of vinegar. The mature coconut Plate – 21 water consisting of about 3 per cent sugar content is concentrated to 10 per cent level by fortifying with sugar. The fortified coconut water is then fermented by inoculating the solution with Sacchaaromyces cerevieae. After alcohol fermentation is completed for about 4-5 days, the clear liquid is siphoned off and inoculated with mother vinegar containing aceteobacter bacteria. The alcoholic ferment obtained is then fed into vinegar generator where it is uniformly sprayed over the surface of the porous packing Coconut Vinegar medium (corn cobs). At this stage the alcoholic ferment is oxidized to acetic acid. The product is recycled into vinegar generator and the process of acidification is repeated until strength of 4 per cent is attained. This acidified vinegar is then aged before bottling. Vinegar is used as preservative in pickle industry and flavouring agent in many food products. It has been reported that the natural coconut vinegar enjoys consumer’s preference over synthetic vinegar when available in the market.

Production and Marketing of Coconut in India
Page 107 of 122
7.4.6 Nata–de–Coco : It is a gelatinous dessert delicacy produced by action of bacteria Acetobacter, xylinium in culture medium of matured coconut water. The culture solution Plate –22 is prepared by mixing coconut water with sugar and acetic acid in
prescribed proportion, which is inoculated with the micro-organism Acetobacter xylinium through a culture liquid. It is filled in glass jar covered with thin cloth and kept for 2-3 weeks without disturbance. During this period a white or cream coloured jelly like substance forms and flouts on the top of the culture medium. It is harvested, cut into pieces and washed in hygienic potable water to remove all acid. It is then immersed in flavoured sugar syrup for 12 hours and packed in glass bottles. The product is used as a dessert and as an ingredient in ice-cream and fruit
Nata–de–Coco mixes and has great export potential in South East Asian countries. The recommended proportion of ingredients for production of Nata-de-Coco are boiled, cooled and filtered coconut water 1 kg, sugar 65 g., glacial acetic acid 25 g., mother liquor 165 g. (Thampam-93) 7.5 Coconut Milk : Coconut milk is a product extracted from the endosperm or kernel of coconut and constitutes into an emulsion of coconut oil in water, stabilized by proteins and probably by some iron found in oil water interface. It is milk like liquid obtained from the gratings of fresh coconut kernels after they are mixed with some water, kneaded and pressed out. The coconut milk has a pleasant sweet and agreeable flavour. The stability of emulsion is better in the pH range in which coconut proteins are more soluble. Coconut milk is richer in fat, poor in protein and sugar content. It is an important dietary component in the food of coconut producing countries; valued for its characteristic nutty flavour and also for its nutritional values. It is an ingredient in many household culinary viz., fish, shell-fish, meat, poultry and vegetable dishes confectionaries, sweets and as substitute of dairy cream in beverage type milk, evaporated sweet condensed milk, cheese, yoghurt and many other types of preparation. Since coconut milk is extremely sensitive to processing, aseptic system of packaging of low acid food products in consumer or bulk packaging could be the best to prevent it from spoilage. Preserved form of coconut milk such as canned coconut cream or milk and coconut milk powder are available in many coconut growing countries. Coconut milk can be preserved by spray drying method and converted into spray dried coconut milk powder. The coconut milk powder offers additional advantage such as reduced storage space, bulk packaging at reduced cost and longer shelf life. The spray dried coconut milk powder can be reconstituted to coconut milk by addition of potable water. The Central Food Technology Research Institute, Mysore, has developed the technology for commercial production of spray dried coconut milk.

Production and Marketing of Coconut in India
Page 108 of 122
7.6 Sweet Coconut Chips : The product is developed from the matured coconut kernel after removing the moisture content of the kernel through osmotic dehydration using various osmotic pressures technics. The dehydrated coconut chip in ready-to-eat form, can be used as snacks. Fresh kernel of matured coconut containing reasonable amount of water is used for preparation of sweet coconut chips. The important steps involved in the production are dehusking, removal of shell, removal of testa, slicing of kernel, blanching of slices, osmotic dehydration of slices, drying of the slices in hot drier and then packing in aluminum foil. Cane sugar of commercial grade is used as sweetening agent. The CPCRI, Kasaragod has developed this product and it has been reported that about 50 per cent of chips by weight of the fresh kernel are obtainable. On an average, about 150 gms. Chips can be obtained from matured coconuts. The sweet coconut chips are hygroscopic in nature. If the relevant humidity is more than 75 per cent, it will absorb moisture and loose it crispness. Hence, coconut must be packed in aluminum foil laminated with Low Density Polyethylene (LDPE) pouches which will maintain its flavour and crispness upto 6 months without affecting its microbial and bio-chemical qualities. To avoid the breakage of chips during the transportation, it may be packed as blown packets using inert gases like nitrogen or carbon dioxide. 7.7 Virgin Coconut Oil : Scientific research and studies have found out that Medium Chain Fatty Acid (MCFA) which are predominantly present in coconut oil have Plate – 23 neutriceutical effects similar to the present in mother’s milk, which
gives infants, immunity from diseases. Further, it has been discovered that the MCFA in coconut oil with lauric acid and its monoglyeceride form monolauric, are the most potent in antimicrobial property. The beneficial properties of coconut oil led to development of special type of coconut oil, known as virgin coconut oil, which has high market value. The virgin coconut oil is obtained from the fresh coconut meat (kernel) of coconut by chemical or natural means with or without the application of heat, which does not alter the oil and its properties. Virgin coconut oil
Virgin Coconut Oil is edible in its natural state immediately after expulsion and filtration. It is a pure form of coconut oil, crystal white in colour, with natural vitamin E (Tocopheorl) contents. It has a mild scent of fresh coconut. Virgin coconut oil, greatly by differs from traditionally produced copra-derived coconut oil, which has to undergo chemical processing, bleaching and dehydration process to make it a suitable for human consumption. The refined bleached coconut oil is yellow in colour, odourless and tasteless. It does not contain vitamin E, as it gets lost in the process of thermal and chemical processing. Virgin coconut oil can be produced either from the fresh comminuted coconut meat, coconut milk or coconut residue. Fresh coconut meat can be processed by different methods.

Production and Marketing of Coconut in India
Page 109 of 122
1. Fresh Dry Processed / Wet Milling Route – Involves de-shelling the coconut meat manually or by machine – splitting and slicing the de-shelled meat – washing – grinding or wet milling – drying the particulated coconut meat – extracting the oil using screw type press to produce virgin coconut oil. Virgin coconut oil and food grade medium fat coconut flakes. The flakes are ground to produce coconut flour.
2. Fresh Dry Processed / Desiccated Coconut Route – The processed involve all the steps desiccated coconut viz., de-shelling, paring, washing, grinding blanching and drying except sulphite treatment and then extracting the virgin coconut oil using screw type press.
3. Fresh Dry Processed / Graded Coconut Route – It involves splitting the nut grating – blanching and drying the coconut meat and extracting the virgin coconut oil using screw type press.
4. Low Pressure Oil Extraction or Intermediate Moisture Content Method – It involves splitting the nut – grating the meat to find particles – drying to the level of moisture content of 10 to 12 per cent of extracting the virgin coconut oil using a manually operated press.
Contents of Virgin Coconut Oil
Total Fats 96.46% Capric Acid 5.53% Saturated 89.46% Oleric Acid 4.40%
Mono-unsaturated 4.60% Others 14.20% Poly-unsaturated 1.00% Cholesterol 0%
Lauric Acid 43.59% Trans Fatty Acids 0% Myristic Acid 17.08% Iodine Value 4.94% Caprylic Act 7.94% Sodium (Na +) % 9.46% Palmtic Acid 7.26%
7.8 Coconut Products and By-products :
Sl. No.
Principal Edible Products
Products by Products and Value Added Products
1. 2. 3. Derivatives 1. Products from
Inflorescence SAP.
i) Sugar / Jaggery. ii) Beverage (Boiled sap) iii) Toddy (Fermeuted sap) iv) Coconut wine v) Neera (Fresh sap) vi) Vinegar vii) Confectionary Jelly
Immatured Coconut Kernel in Syrup i) Coconut Jam ii) Puddings / Ice cream
2. Products from Coconut Kernel
(Meat) Matured Coconut

Production and Marketing of Coconut in India
Page 110 of 122
i) Desiccated Coconut ii) Partially De-fated Coconut Powder iii) Rousted Coconut Paste iv) Coconut Chips (Sweetened Chips) (Sliced Coconut) v) Ball Copra vi) Cup Copra (Coconut flour) vii) Coconut Yoghurt / Ice cream viii) Fresh Coconut gratings ix) Dehydrated edible coconut meat x) Coconut oil / Virgin Coconut oil
3. Products from Coconut Milk
i) Milk Powder (Dehydrated Milk) ii) Coconut Milk / Syrup iii) Coconut Spread / Cheese iv) Coconut honey / candy v) Coconut Skim Milk Beverage vi) Sweetened coconut skim milk blend vii) Coconut protein viii) Low / high fat coconut jam ix) Virgin Coconut oil
Tender Coconut i) Fresh Tender Coconut Water ii) Tender nut Coconut water & Coconut Meat shake iii) Canned or Pouched tender coconut water
Matured Coconut
4. Production from Coconut Water
i) Coconut water concentrate (Syrup) as flavoured beverage on dilution ii) Carbonated / non carbonated coconut water iii) Nata-de-coco iv) Vinegar v) Toddy
5. Coconut oil i) Edible oil ii) Bio diesel / biofuel iii) Industrial oil iv) Cosmetics
1. 2. 3. 6. Virgin Coconut oil i) Dietary oil ii) Body oil/ Baby oil (skin can) iii) Body
cream/ Lotion/ Shampoo iv) Soap v) Pharmaceuticals vi) Nutriceutical Products
Non Edible Products 1. Coconut Husk i) Coir, Coir foam, Rubberized foam ii) Coir Carpets/
Mattresses iii) Coir geotextiles iv) Coir Composite v) Coir pith briquette vi) High Value coir products safety belts vii) Coir boards, Coir asbestos
2. Coconut shell i) Charcoal ii) Activated charcoal iii) Shell powder iv) Shell handicrafts v) Ice-cream & beer cups vi) Shell gasified for alternate heat energy
3. Coconut palm wood i) Furniture ii) Doors iii) Panels (Wall & Floor) iv) Handicrafts
4. Coir pith i) Organic Manure ii) Ornament plant growing pot iii) Coir pith briquettes iv) Coir chullah
7.9 Coir : India is the largest producer of brown coir fibre and its production has been steadily increased during the last five years Coir is one of the important natural, golden colour, hard fibres extracted from the husk or fibrous mass (mesocare) covering the coconut. It is of great commercial interest and falls under the category of industrial hard fibres such as hemp, abucca, henequen etc. Coir has certain unique qualities, such as resistance to spoilage due to moisture and dampness. Coir fibres posses remarkable,

Production and Marketing of Coconut in India
Page 111 of 122
durability to withstand physical strength and hence it is a renewable resource for manufacturing various floor covering and other coir products. In India coir fibres is extracted from coconut husk after retting in saline water and also by deploying mechanical method using fibre extracting machines. Mechanical extraction of coir fibre requires dry husk and is widely used in coconut growing states in the country owing to better realization of coir fibre, cost effectiveness and overall inadequate retting facilities. The white fibre sector has become stagnant over last few years, where as the export requirement is mainly of white fibres products. The coir industry is mainly concentrated in the coconut producing states viz., Kerala, Karnataka, Tamil Nadu and Andhra Pradesh in southern region and Orissa in the eastern region. The industry’s strength lies in the export oriented coir products manufactured in the country. It has been reported that there were 6531 functional coir processing units in the country. Out of which 5124 units in Kerala, 217 units in Karnataka, 262 in Tamil Nadu, 265 in Andhra Pradesh, 100 in Orissa, 75 in West Bengal, 5 in Maharashtra, 6 in Pondicherry and 3 in Goa. Consequent upon mechanization in coir processing sector in Kerala, production of brown fibre has increased many folds. A new retting process using coir ret, a bacterial culture developed through research by coir board has become popular in Karala. The fibre is called green husk fibre which is mixed with white fibre to make coir yarn and other products. 7.9.1 Coir Pith : Coir pith commonly known as coconut peat is the by-products of coir industry, which was hitherto considered as a waste material. Coir pith is converted into briquettes for the purpose of easy transportation. It is easily composed to be used as an organic manure and soil ameliorant. ‘Pith plus’ a product developed by the Coir Board in collaboration with Tamil Nadu Agril. University, is supplemented with urea is added to coir pith to make the manure. Coconut Shell Products : The coconut shell can be converted into very useful industrial products like coconut shell charcoal, activated carbon and coconut shell powder which have a market all over the world especially in Japan, South Korea, France, United Kingdom and USA. Coconut shell is a by-product of the coconut industry. It has been estimated that ever one to seven million tonnes of coconut shell could be salvaged per annum in the country but very small quantity of coconut shell is processed into useful products.

Production and Marketing of Coconut in India
Page 112 of 122
STATUS OF FURTHER PROCESSED, VALUE ADDED
COCONUT PRODUCTS 8.0 Coconut In Ayurvedic Medicines : Coconut palm is of great importance in the ayurvedic medicine as it helps to cure many diseases. The India system of medicines prescribe coconut kernel, coconut milk, coconut oil, coconut inflorescence, tender shoot (cabbage), tender coconut water, coconut neera, coconut jaggery and recommends the consumption of these coconut products. The coconut products posses immense medicinal properties and hence they are used in various ayurvedic preparations. 8.1.1 Coconut Cabbage 8.1.2 Coconut inflorescence 8.1.3 Tender coconut 8.1.4 Coconut husk 8.1.5 Coconut water 8.1.6 Coconut kernel 8.1.7 Coconut milk 8.1.8 Coconut oil 8.1.9 Sweet toddy (Neera) 8.1.10 Jaggery 8.2 Culinary Preparations with Coconut Vegetarian Culinary Preparations : 8.2.1 VELLAYAPPAM. 8.2.2 PALAPPAM (HOPPERS) 8.2.3 SPICED CASSAVA DOSSA. 8.2.4 COCONUT DOSA. 8.2.5 APPAM. 8.2.6 TOASTED COCONUT CHIPS. 8.2.7 COCONUT LADOO. 8.2.8 MAIDA DOSAI. 8.2.9 TENDER COCONUT PAYASAM. 8.2.10 IDIAPPAM (RICE SEMIA OR NOODLES) 8.2.11 COCONUT CAKE.
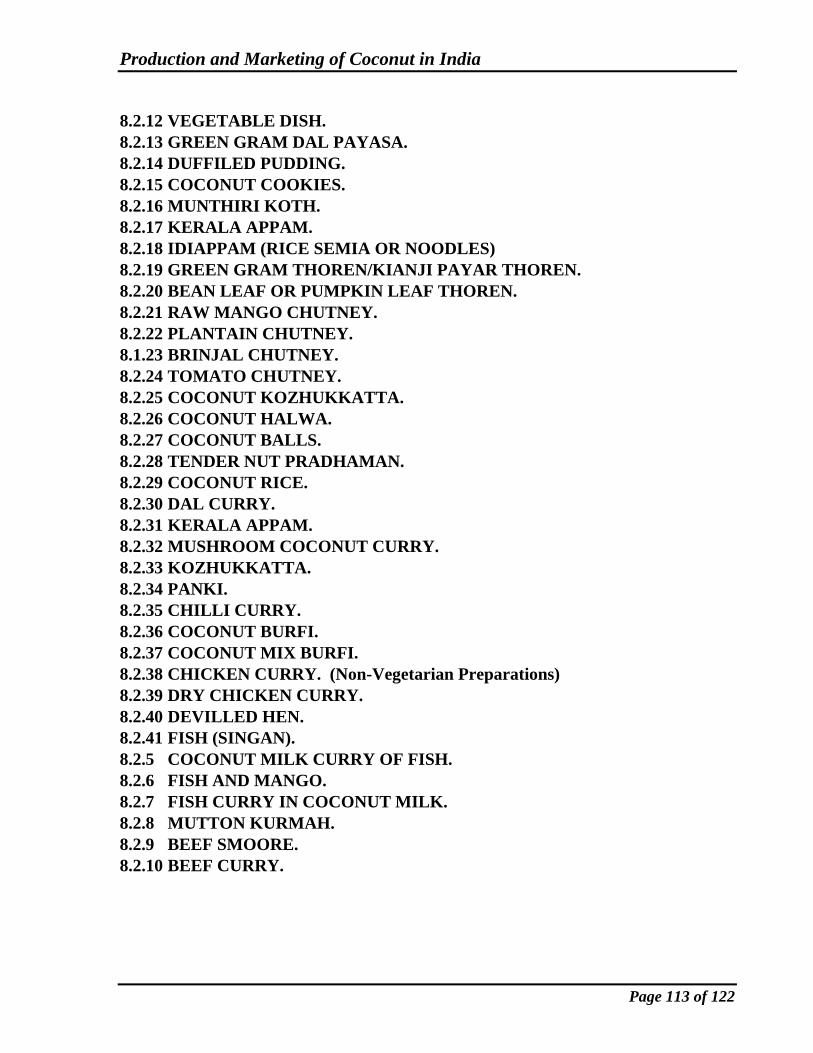
Production and Marketing of Coconut in India
Page 113 of 122
8.2.12 VEGETABLE DISH. 8.2.13 GREEN GRAM DAL PAYASA. 8.2.14 DUFFILED PUDDING. 8.2.15 COCONUT COOKIES. 8.2.16 MUNTHIRI KOTH. 8.2.17 KERALA APPAM. 8.2.18 IDIAPPAM (RICE SEMIA OR NOODLES) 8.2.19 GREEN GRAM THOREN/KIANJI PAYAR THOREN. 8.2.20 BEAN LEAF OR PUMPKIN LEAF THOREN. 8.2.21 RAW MANGO CHUTNEY. 8.2.22 PLANTAIN CHUTNEY. 8.1.23 BRINJAL CHUTNEY. 8.2.24 TOMATO CHUTNEY. 8.2.25 COCONUT KOZHUKKATTA. 8.2.26 COCONUT HALWA. 8.2.27 COCONUT BALLS. 8.2.28 TENDER NUT PRADHAMAN. 8.2.29 COCONUT RICE. 8.2.30 DAL CURRY. 8.2.31 KERALA APPAM. 8.2.32 MUSHROOM COCONUT CURRY. 8.2.33 KOZHUKKATTA. 8.2.34 PANKI. 8.2.35 CHILLI CURRY. 8.2.36 COCONUT BURFI. 8.2.37 COCONUT MIX BURFI. 8.2.38 CHICKEN CURRY. (Non-Vegetarian Preparations) 8.2.39 DRY CHICKEN CURRY. 8.2.40 DEVILLED HEN. 8.2.41 FISH (SINGAN). 8.2.5 COCONUT MILK CURRY OF FISH. 8.2.6 FISH AND MANGO. 8.2.7 FISH CURRY IN COCONUT MILK. 8.2.8 MUTTON KURMAH. 8.2.9 BEEF SMOORE. 8.2.10 BEEF CURRY.

Production and Marketing of Coconut in India
Page 114 of 122
SUMMARY AND CONCLUSION
9.1 Coconut, ‘Cocus nucifera linn’, the most important, ancient and useful of the tropical palms, has been cultivated in India from the time immemorial. Because of the economic importance, this plantation crop is grown in more than 90 countries across the world and India ranks third in production of coconut. Traditionally, the economic importance of coconut was laid on its nourishing water, kernel, copra, oil and coir, but laying emphasis on value addition and product diversification is widening the spectrum of its economy. 9.2 Though, coconut originated from South East Asia including Australia, it dispersed through out the world specifically in the coastal areas. The coconut plantation crop is grown across the world in an area of 11.85 million hectares producing 57.514 billion nuts equivalent to 10.52 million tonnes of copra. Among the Asian and Pacific coconut community (APCC) mainly six countries i.e. Philippines, Indonesia, India, Sri Lanka, Thailand and Malaysia together accounts for more than 80 per cent of the total area under coconut cultivation and about 82 per cent of the worlds coconut production. About 50 per cent of the coconut production in the world is processed into copra, which varies from country to country depending upon the pattern of consumption. The economy of coconut is mainly dependent on coconut oil and its price and is susceptible to pressure from cheaper substitute like palm oil, soybean oil and sunflower oil. But because of its lauric acid and myristic acid content, it is still considered as an important oil for industrial application and enjoys a premium price. 9.3 The coconut occupies a significant position in socio-cultural needs of the Indian society and is gaining considerable importance in the national economy as a potential source of rural employment and income generation among the plantation crops in coconut growing areas. The coconut palms grow under varying soil and climatic conditions and hence gaining popularity for cultivation even in non-traditional areas of the country. Coconut palms are grown in most of the zones except subtropical and temperate regions, which includes 19 states and three Union Territories in the country, but are favourably adapted to coastal agro ecosystem. The major area under coconut cultivation in the country comprises of states of Kerala, Karnataka, Tamil Nadu, Pondicherry, Andhra Pradesh, Maharashtra, Goa, Orissa, West Bengal, Andaman & Nicobar, Lakshadweep Island, Gujarat, Assam and other parts of North Eastern States. Nearly 48-50 per cent of the total area is under coconut cultivation in Kerala, followed by Karnataka, Tamil Nadu and Andhra Pradesh which all together accounts for 90 per

Production and Marketing of Coconut in India
Page 115 of 122
cent of total area under coconut in the country. Various bodies like the Indian Coconut Central Committee (1945), Directorate of Coconut Development (1966) and Coconut Development Board (1981) were established to carry out the organized and systematic development of coconut and coconut products. The improvements in the production and productivity of coconut had been on account of continuous efforts made by all the agencies involved in the process of integrated approach to improve the production and productivity of the coconuts in the country. The foremost factors which determine the production and productivity of coconut are the indigenous and exotic varieties evolved through selective breeding and hybrids, through cross breeding. The important varieties are Tall varieties (WCT/ECT, Lakshadweep ordinary / Benaunum Tall, Kamrup), Exotic (Philippine ordinary, Fiji Tall, etc.). Indigenous Dwarf varieties evolved are chowghat orange, Malyam yellow, Ganga Bandam, Gangapani etc., evolution of hybrid varieties certainly improved the coconut productivity by crossing different types of Tall dwarf varieties. More than 80 hybrid combinations have been evaluated in India and so far eleven hybrids were released for commercial cultivation and establishment of seed gardens, viz., Kerashankar, Godavari, Ganga, VHC-1,2, VH-3. Selection of appropriate varieties of hybrids for plantation depends on agro-climatic conditions prevailing in the area. Coconut being a mono crop does not utilize all the basic resources such as, sunlight, groundwater and therefore, intercropping is economical to the farmer and gardeners, crops grown in coconut garden are tapioca, ginger, turmeric, leguminous plants spices, medicinal plants and various vegetable crops. The Central Plantation Crop Research Institute (CPCRI), Kasaragod has evolved High Density Multi-Species Cropping System (HDMSCS) to meet the diverse needs of the coconut farmers. Like any other plantation crop, coconut is also prone to various pests and diseases which directly affects the production of coconut palm viz., root (wilt) diseases, eriophyid mite, stem bleeding, bud and leaf rots and basal stem diseases. Of late, the infestation by the eriophyid mite, the deadly rot has been reported in traditional coconut growing areas. The farmers in the country had therefore, adopted the integrated disease and pest management control measure to save the coconut crop. The harvesting practices of coconut depend upon the local economy of the coconut growing state. In southern state, matured coconut are harvested for making copra for oil and edible purpose and to obtain good quality husk for manufacturing of coir product, where as in the state of West Bengal, Assam and Orissa, coconut are mainly harvested for consumption of tender coconut water and matured coconuts for religious and culinary purpose.

Production and Marketing of Coconut in India
Page 116 of 122
9.4 The coconut palm being a small land holder’s plantation crop grown in 1.89 million hectare area in the tropical belt of the country extending from Kerala, Karnataka, Tamil Nadu, Andhra Pradesh in south, Gujarat, Maharashtra in west; Orissa and West Bengal in the east, Assam and Tripura in the North Eastern region of India and is a means of living for millions of people inhabiting in the traditional and non traditional coconut growing states and union territories. The islands of Andaman and Nicobar and Lakshadweep are other traditional coconut areas. It is predominantly cultivated in small and marginal holding and as a medium of resource to poor farm environment having less marketable surplus. It has been reported that the national average productivity of coconut in India is very low i.e. around 40 nuts per palm per year. The low productivity of coconut crop in the country has been on accounts of several reasons, i.e. lack of adoption of scientific cultivation practices to enhance productivity; which helps in bringing down the cost of production. In most of the small coconut holdings, the soil nutrients and water are limiting factor in crop production. Kerala, the southern most state situated along the West coast is a major coconut growing state. Except in Kerala and a few small states and union territories, coconut is not grown contiguously but limited to only congenial belts accounting to an insignificant portion of the total arable agricultural area. Kerala, Karnataka, Tamil Nadu and Andhra Pradesh are therefore the four major coconut producing state, sharing 90.8 per cent of the total area, whereas the contribution of other States / Union territories is only 9.2 per cent. 9.5 Marketing of coconuts differs from that of other fresh fruits due to natural durability of coconuts, which are sold as fresh tender nuts as well as matured water nuts and dry nuts, though the marketing practices followed are similar in nature, they may differ in accordance with the post harvest practices followed by farmers of coconut and form of products consumed in that area. Coconut farmers in the country have adopted indirect mode of disposal of their produce. However, rich farmers prefer to trade through direct channel, as a result the role of intermediaries or middle men is seen prominently in the marketing channels of coconut. Most of the coconut farmers have adopted leasing their farms / gardens as the mode of disposal of the coconut, but absence of lease holder, low productivity and uncertain farming conditions, always force coconut farmers to adopt mixed marketing practices. Since tender coconuts are marketed for drinking coconut water, the farmers prefer to sell them immediately after harvesting without subjecting it for grading. Tender coconuts have great demands in most of the towns and cities all over the country, Kolkata, Mumbai, Chennai, Bangalore and Delhi are major consuming market for tender coconut and the major assembling markets for tender coconut are located at Kolkata, Maddurai and Mumbai. The assembling and distribution of tender coconut through out the country is almost uniform and involves producer, contractor, itinerary merchants, wholesalers, retailers and hawkers. Realizing the importance of tender coconut as a

Production and Marketing of Coconut in India
Page 117 of 122
nutritious and refreshing drink, the tender coconuts are also marketed to the processing unit for packing the tender coconut water in bottles, polythene satchels or aluminum cans. The matured nuts reaching markets are either partially husked or dehusked as per demand and requirements in distant markets. The coconut meant for copra making are sold fully husked by the farmers in near markets, similarly, where the coir industries are located and retting facilities are available, the coconut are completely dehusked for marketing purposes. In accordance with the demand the storage practices for matured coconuts differ from place to place and from farmers to the traders depending upon the requirement for the ultimate utility for the market. Since the major portion of the coconut produced in the country is marketed through indirect mode of disposal and to limited extent through direct channel, the numbers of agencies involved in the marketing system are more or less similar through out the country with exceptional number where direct sale is involved. The states where copra making and milling industries are located, the agencies involved are village merchant / or copra maker, middle men or copra merchant, trader / miller.
Though grading of coconut is an important marketing function to fetch a remunerative price for the coconut but it has not been fairly adopted at the producer’s levels, through out the country, whether for tender and or matured coconuts. However, the wholesale traders adopts the practice of grading coconut and copra based on the categories such as size, colour, freshness in case of tender coconut and size, weight and kernel content in case of matured coconuts, while copra is graded, into edible and milling as ball and cup copra. The grades and classification differ from the state to state and depends upon the local nomenclature. Since, Kerala is an important coconut trading centre the main centre for coconut oil markets are located at Kochi, Trichur and Trivendrum, similarly Kanghayam and Vellakovil in Tamil Nadu and Udipi and Mysore in Karnataka are main oil trading centres. The marketing practices followed in the coconut and coconut product trade, it has been revealed that in-numerable intermediaries, channels, functionaries, brokers, assemblers, traders, merchants, wholesalers, institutions and retailers are involved directly or indirectly in the movement of coconut from the point of production to the point of consumption, performing various activities in the flow process, enabling movement of coconut and its products until placed in the hands of consumers. Though the future trading in copra and coconut oil was discontinued due to excessive speculation

Production and Marketing of Coconut in India
Page 118 of 122
in trading activities, in early 70’s it was reintroduced in 2001 for coconut oil under the first commodity exchange of India at Kochi, to boost marketing of coconut oil and copra in the country. 9.6 Since long the prices of coconut and coconut products in the country are mainly centred around copra and coconut oil, the price of coconut is usually influenced by the prevailing prices of coconut oil in the wholesale market. The coconut prices are characterized by wide and violent functions with erratic price trends. The prices of coconut at the important markets in coconut producing areas (viz., Arikere, Kozhikode, Kanghyam) generally move in close sympathy with one another but at other distant markets the prices do not show the sympathetic trend. The monthly wholesale prices in the above markets followed similar trend and seasonal variations and moved alike without much fluctuation in these three marketing centers. The coconut prices tend to rise where there is sustained demand of copra making from the months of October, November to March and April. The large scale arrival of coconut during the month of January-February declines the prices of the coconuts in almost all the markets. However, the prices remain low during monsoon period inspite of regular supply in the market due to reduction in copra making.
The coconut prices vary in accordance with the quality of the nuts, the size of coconut matters much in fixing the price of matured nuts, big nuts invariably fetches higher price than the smaller nuts. However, the previous price trend had changed a lot in case of tender coconuts in today’s market good quality tender coconut fetches higher price or if not then equivalent to the price of matured coconut due to higher demand from the consuming market. In areas where the coir industries are located, the unhusked coconut fetches higher prices than the husked coconut. Copra is a basic raw material for commercial end product the coconut oil, but the ruling price of coconut oil is the yardstick for determining the prices of copra in the market. The price trend in India showed that the ball copra generally fetched more price than cup and milling copra. Similarly, the edible copra fetched even higher prices than that of milling copra. Since copra prices is subjected to wide fluctuation Government ensures the remunerative price to the farmers by declaring Minimum Support Price (MSP) as a result some time it was observed that the price of ball copra remained above the Minimum Support Price (MSP), though the prices of coconut declined in the market. The other factor which affects the prices of copra in the markets are harvesting of tender coconuts, increase in demand, resumption of future trading and or combination of various factors such as demand-supply imbalancing, availability of cheaper substitute and introduction of Value Added Tax (VAT).

Production and Marketing of Coconut in India
Page 119 of 122
Since, coconut oil is an important product of coconut with world wide demand, the prices of coconut oil moves in close sympathy with that of other vegetable oils. The other features which affect the prices of coconut oil are the end uses of coconut oil and their responsiveness to the prevailing prices, supply of other major vegetable oils viz., soybean oil, palm oil and different polices of Government in execution from time to time, do effect the price determination process of coconut oil. The coconut oil as such is over priced in domestic and world market, being source of caprelic, capric, lauric acid and myristic acid, which are considered as important items for industrial application.
RECOMMENDATIONS
10.1 Coconut Production : To increase productivity, it is necessary to take up systematic
replanting and under planting to replace the old, senile, unproductive and disease affected palms, using quality planting material. Secondly, the integrated farming system should be popularized. All the field models of inter / mixed / multicrop / multistoried cropping and mixed farming integrating livestock farming such as dairy, poultry, duck farming, aquaculture have to be popularized among the farmers. Breeding of high yielding varieties resistant to diseases, tolerance to biotic and abiotic stress should be developed.

Production and Marketing of Coconut in India
Page 120 of 122
Decreasing the cost of production of nut is the most important criteria for increasing competitiveness. Cost effective management practices such as organic recycling of coconut biomass and other farm wastes or converting them into vermicompost, addition of need based in-puts at the appropriate level and time, adopting drip irrigation by providing subsidy for it, soil moisture conservation, basin management with organic mulching or growing green manures and incorporating them, need based plant protection measures using bio-control agents are also to be adopted for substantial growth in production and to increase the productivity of coconut. 10.2 Integrated Pest and Disease Management : The integrated pest and disease management approach allows pest and disease management without any adverse impact on ecological sustainability of the Agro ecosystem. It is necessary that a massive and concerted programme be launched involving research and extension backed by suitable subsidy scheme. It is recommended that a massive programme should be launched to weed out the old unproductive and diseased coconut palms and replanting seedling of improved hybrid varieties of coconut palms as a measure of rehabilitation. 10.3 National Agricultural Insurance Scheme : Adverse weather condition and the problem of disease infestation are the two major risk factors affecting coconut production and productivity which result in low income to farmers. In the absence of any effective mechanism for risk cover, the economy of coconut plants suffers severely. Hence, the scope of National Agricultural Insurance Scheme should be extended to provide risk cover to coconut farmers. 10.4 Trade in Coconut Product : Conventional trade in coconut product including nuts and copra are characterized by the involvement of intermediary at different levels of marketing due to which the farmers suffers a long. Thus, there is necessity of a system that mediates between “the farm and the firm”. Adoption of farm level processing, involving farmer’s groups / societies / associations should be encouraged. Bigger units of copra making should be set up. Introduction of state of art warehousing facilities and access to robust prices risk management instruments such as “future contracts for coconut, coconut oil, copra and oil cake” should be encouraged. Organized transport system involving number of cottage industry area should be involved. 10.5 Development of Market Intelligence System : It includes all the pertinent marketing data about a product line from both external and internal sources and assembles the data, thus helping in marketing decision making as it comprises of collection and storage of data, analysis and interpretation of data and the dissemination of intelligence. Thus, a competitive data base market intelligence system should be developed to generate advance estimation of coconut production, copra with a view to generate reliable and consistent estimates.

Production and Marketing of Coconut in India
Page 121 of 122
10.6 Market Research : Market promotion is one of the key aspects for a better scales outlet and better price. Market survey, market research and market promotion are interlinked and should be a continuous process. These aspects need strengthening to identify domestic and export market, identification of rich production and distribution channels; thus linking the consumer, customers and public to the market. It is, therefore, recommended that need based and problem oriented market research should be taken up to find solution to emerging marketing problems. 10.7 Organic Coconut Product :The consumer for organic foods are increasing and organic sales is growing by 20 per cent. Since consumer of organic food look for absence of pesticides/herbicides/synthetic fertilizer, coconut is the best option to satisfy all these preferences. Since coconut is largely raised in all the coconut growing areas under natural farming it can be marketed as organic product. 10.8 The demand for diversified and value added product of coconut is increasing in India and abroad very rapidly, Inspite this potential, its valuable wealth resources have not been exploited to its optimum potential. Many circumstances have contributed to diffidence in the value added sector of coconut viz., prices of raw materials, technologies, fear of competition and non-attachment of quality standards, end product price uncertainty, lack of investments are some of the factors which are hampering the growth of coconut into diversified and value added product. Therefore, it is recommended that the Government may play an active role in promoting the diversification of usage of coconuts and its value added products like coconut cream, spray dried coconut cream powder, coconut vinegar etc., by providing: a) Institutional support system which will offer knowledge base as i) quality
concepts ii) Technology linkage iii) National and International Production and Processing Standards.
b) Programmes for technology improvement, absorption, quality upgradation, investment generation, product improvement.
c) Providing financial support and appropriate incentives in the form of soft loans, tax holidays or cut down taxes, working capital and capital subsidy.
d) By providing adequate funds at liberal terms for processing and storage facilities for copra.
e) Creating awareness and exposition of value added products among consumers. f) Close interaction among coconut processors, traders, research organization and
Government by way of organizing workshops, trade fairs, exhibitions for the all-round growth of processing industry is necessary.
Production and Marketing of Coconut in India
Page 122 of 122
Thus it would help in brining down the cost of production of diversified and value added product within the reach of consumers and also provide a better price to farmers. 10.9 Packaging and Labeling : Proper packing is as important as other aspects of marketing. As this area has not received much attention in case of coconut based products, it is necessary that this may be given good attention to attract consumers. Proper labeling is yet another area that needs immediate attention. Consumers are cautious of the product they purchase. Therefore, it should scrupulously followed in India to increase trading in diversified and value added products of coconut. It has been observed that coconut oil has great medicinal, cosmetic and industrial application, therefore, all the market promotion efforts should be directed to promote the coconut oil as basic and essential ingredient for medicinal and cosmetic purpose. Accordingly, the research and development should be directed to explore, the multipurpose use of coconut oil for industrial application and improve, its marketability in India and abroad.

Annexure I WORLD AREA , PRODUCTION AND PRODUCTIVITY OF COCONUT
S.No. Name of Country Area Production Yield
1. American Samoa 2,200 4,700 21,364 2. Bangladesh 31,000 89,000 28,710 3. Barbados 600 1,800 30,000 4. Belize 345 1,100 31,884 5. Benin 12,000 20,000 16,667 6. Brazil 275.007 2,973,700 108,132 7. Brunei Darussalam 120 200 16,667 8. Cambodia 13,000 71,000 54,615 9. Cameroon 1,700 5,100 30,000 10. Cape Verde 1,700 6,000 35,294 11. China 28,200 289,000 102,482 12. Cocos (Keeling) Island 950 7,600 80,000 13. Colombia 13,350 110,028 82,418 14. Comoros 27.000 77,000 28,519 15. Congo, Republic of 1,100 4,000 36,364 16. Cook Islands 700 1,800 25,714 17. Costa Rice 4,000 19,500 48,750 18. Cuba 26,432 110595 41,841 19. Cote d’Ivoire 30,000 240,000 80,000 20. Dominica 3,450 11,500 33,333 21. Dominican Republic 38,000 181,533 47,772 22. Ecuador 3,540 20,973 59,246 23. El Salvador 7,900 112,000 141,772 24. Equatorial Guinea 2,500 6,000 24,000 25. Fiji Island 50,000 140,000 28,000 26. French Guinea 63 230 36,508 27. French Polynesia 19,800 86,800 43,838

S.No. Name of Country Area Production Yield 28. Ghana 55,000 315,000 55,000 29. Grenada 2,300 6,500 2,300 30. Guadeloupe 120 270 120 31. Guam 9,500 53,000 9,500 32. Guatemala 11,500 40,000 11,500 33. Guinea 6,000 22,500 6,000 34. Guinea-Bissau 9,000 45,500 9,000 35. Guyana 14,000 45,000 14,000 36. Haiti 9,700 24,000 9,700 37. Honduras 2,300 21,150 2,300 38. India 1,900,000 9,500,000 1,900,000 39. Indonesia 2,660,000 16,289,000 2,660,000 40. Jamaica 51,000 170,000 51,000 41. Kenya 15,000 60,000 15,000 42. Kiribati 27,000 103,000 27,000 43. Liberia 2,400 7,000 2,400 44. Madagascar 33,000 84,000 33,000 45. Malaysia 179,000 710,000 179,000 46. Maldives 7,500 35,000 7,500 47. Marshall Island 8,000 15,000 8,000 48. Martinique 500 1,150 500 49. Mauritius 510 1,900 510 50. Mexico 148,000 959000 148,000 51. Micronesia, Fed States of 30,300 140000 30,300 52. Mozambique 70,000 265000 70,000 53. Myanmar 41,000 350000 41,000 54. Nauru 320 1600 320 55. Nepal 173 352 173

S.No. Name of Country Area Production Yield 56. New Caledonia 16,000 16,000 59,259 57 Nicaragua 5,800 5,800 50,435 58 Nigeria 50,000 166,000 33,200 59. Niue 3,125 2,500 8,000 60. Pacific Island Trust Tr 0 0 0 61. Pakistan 500 2,000 40,000 62. Panama 4,700 15,000 31,915 63. Papua New Guinea 200,00 650,000 32,500 64. Peru 1,500 21,283 141,887 65. Philippines 3,253,927 14,344,920 44,085 66. Puerto Rico 900 5,250 58,333 67. Reunion 125 560 44,800 68. Saint Kitts and Nevis 200 1,000 50,000 69. Saint Lucia 3,500 14,000 40,000 70. Saint Vincent/Grenadines 685 2,550 37,226 71. Samoa 21,500 140,000 65,116 72. Sao Tome and Principe 13,000 28,500 21,923 73. Senegal 1,550 4,700 30,323 74. Seychelles 700 3,200 45,714 75. Sierra Leone 2,700 2,600 9,630 76. Singapore 15 130 86,667 77. Solomon Island 37,000 330,000 89,189 78. Sri Lanka 447,000 1,950,000 43,624 79. Suriname 1,100 9,000 81,818 80 Tanzania, United Rep of 310,000 370,000 11,993 81. Thailand 337,000 1,450,000 43,027 82. Togo 4,200 14,500 34,524 83. Tokelau 600 3,000 50,000 84. Tonga 8,100 58,000 71,605

- 4 –
S.No. Name of country Area Production Yield 85. Trinidad and Tobago 3,300 18,000 54,545 86. Tuvalu 1,600 1,600 10,000 87. Vanuatu 74,000 240,000 32,434 88. Venezuela, Bolivar Rep of 19,681 190,908 97,001 89. Viet Name 132,800 930,600 70,075 90. Wallis and Futuna Is 4,100 2,300 5,610
Source : FAO, 2004

Annexure - II
AREA, PRODUCTION AND PRODUCTIVITY OF COCONUT IN APCC COUNTRIES (1970-2002)
Area – ‘000’/Ha. Production in Copra – ‘000’ M.T.
Productivity - M.T./Ha.
1990 2002 Sl. No.
Name of Countries Area Production Productivity Area Production Productivity
1. F.S. Micronesia 17 8 0.44 17 8 0.47 2. Fiji 56 34 0.60 61 15 0.24 3. India 1472 1397 0.95 1899 2398 1.26
4. Indonesia 3394 2332 0.69 3983 3331 0.83 5. Kiribati - - - 25 26 1.04 6. Malaysia 323 225 0.69 131 86 0.66 7. Marshal Islands - - - 8 7 0.87 8. Papua New Guinea 260 164 0.63 260 162 0.62 9. Philippines 3112 2629 0.84 3259 2377 0.73 10. Samoa 47 47 0.51 96 55 0.57 11. Solomon Islands 59 39 0.66 59 22 0.37 12. Shri Lanka 419 514 1.23 395 518 1.31 13. Thailand 393 342 0.87 343 240 0.70 14. Vanuatu 96 62 0.64 96 60 0.62 15. Vietnam 350 190 0.54 133 136 1.02 TOTAL 9939 7983 0.80 10,765 9441 0.88
Source : Asian and Pacific Coconut Community Statistics.

Annexure –III A
AREA, PRODUCTION AND PRODUCTIVITY OF COCONUT IN INDIA (GROWTH RATE)
KERALA KARNATAKA TAMIL NADU YEAR
Area "000 ha
Production Million Nuts
Productivity Nuts/ ha
Area "000 ha
Production Million Nuts
Productivity Nuts/ ha
Area "000 ha
Production Million Nuts
Productivity Nuts/ ha
1992-93 877.0 5125.2 5844 246.0 1269.7 5161 196.4 2771.1 14109 1993-94 882.3 5197.0 5890 252.9 1308.0 5172 272.8 3311.4 12139 1994-95 911.0 5335.1 5856 263.8 1364.1 5171 298.6 4345.7 14554 1995-96 980.0 5908.0 6029 278.8 1450.9 5204 322.5 3257.6 10101 1996-97 1010.0 5759.0 5702 290.0 1493.0 5148 328.0 3811.6 11621 1997-98 1020.3 5911.0 5793 302.4 1550.4 5127 267 3097 11620 1998-99 882.3 5132.0 5817 310.4 1611.5 5192 285.0 3335.3 11703
1999-2000 899.1 5167.0 5747 320.6 1670.3 5210 304.0 3222.0 10599 2000-01 925.8 5536.0 5980 333.8 1754.2 5255 323.5 3192.0 9867 2001-02 939.5 5744.0 6114 369.8 1503.6 4066 335.8 3293.6 9808
2002-2003 905.5 5338.0 5895 369.8 1503.6 4066 345.9 2860.7 8270 2003-04 906.2 5484.0 6052 376.0 1529.1 4067 352.7 2560.5 7260 2004-05 897.8 5727.0 6379 385.4 1209.6 3139 357.1 3243.5 9083
Growth over the period
20.8
601.8
534.9
139.4
-60.1
-2022.8
160.7
472.4
-5026.6
Growth rate 0.20 0.93 0.73 3.81 -0.40 -4.06 5.11 1.32 -3.60 Growth
over10 yr period
-13.2 391.9 522.6 121.6 -154.5 -2032.4 58.5 -1102.2 -5470.7
Growth rate for last 10 yr -0.15 0.71 0.86 3.86 -1.19 -4.87 1.81 -2.88 -4.61

Annexure –III B
AREA, PRODUCTION AND PRODUCTIVITY OF COCONUT IN INDIA (GROWTH RATE)
ANDHARA PRADESH OTHER ALL INDIA YEAR
Area "000 ha
Production Million Nuts
Productivity Nuts/ ha
Area "000 ha
Production Million Nuts
Productivity Nuts/ ha
Area "000 ha
Production Million Nuts
Productivity
Nuts/ ha 1992-93 71.7 1081.8 15088 146.6 993.1 6774 1537.7 11240.9 7310 1993-94 79.9 1103.5 13811 147.2 1054.8 7166 1635.1 11974.7 7324 1994-95 86.6 1181.4 13642 153.8 1073.3 6979 1713.8 13299.6 7760 1995-96 90.0 1231.4 13682 159.6 1104.4 6920 1830.9 12952.3 7074 1996-97 90.0 685.9 7621 174.5 1238.0 7095 1892.5 12987.5 6863 1997-98 95 815 8588 176.9 1344.2 7599 1861 12717 6863 1998-99 98.0 698.1 7123 178.8 1759.0 9838 1755 12536 7145
1999-2000 101.7 1051.8 10342 142.1 1016.4 7153 1768.1 12129.0 6860 2000-01 102.6 1092.7 10650 138.2 1103.5 7985 1823.9 12678.4 6951 2001-02 104 1125 10817 183.2 1297.0 7080 1932.3 12962.9 6709
2002-2003 105.3 1158.6 11003 187.0 1280.3 6847 1913.5 12535.0 6551 2003-04 104.0 1195.0 11490 194.8 1409.6 7236 1933.7 12178.2 6298 2004-05 104.0 1199.3 11532 190.7 1453.5 7622 1935.0 12832.9 6632
Growth over the period
32.3
117.5
-3556.1 44.1 460.4 847.7 397.3 1592.0 -678.2
Growth rate 3.15 0.86 -2.22 2.22 3.23 0.99 1.93 1.11 -0.81 Growth
over10 yr period
17.4 17.9 -2110.3 36.9 380.2 643.4 221.2 -466.7 -1128.3
Growth rate for last 10 yr -0.15 0.71 0.86 2.17 3.08 0.89 1.22 -0.36 -1.56

Annexure –III C
AREA, PRODUCTION AND PRODUCTIVITY OF COCONUT IN INDIA (GROWTH RATE)
YEAR Area "000 ha Production Million Nuts Productivity Nuts/ ha
1994-95 1713.8 13299.6 7760
1995-96 1830.9 12952.3 7074
1996-97 1892.5 12987.5 6863
1997-98 1861.0 12717.3 6834
1998-99 1754.5 12535.9 7145
1999-00 1768.1 12129.0 6860
2000-01 1823.9 12678.4 6951
2001-02 1932.3 12962.9 6709
2002-03 1921.8 12535.0 6523
2003-2004 1933.7 12178.2 6298
2004-05 1935.0 12832.9 6632
Growth over the period 221.2 -466.7 -1128.3
Growth rate 1.22 -0.36 -1.56
Growth rate for 5 yrs 1.82 1.13 -0.67
Growth rate for 2 yrs 0.34 1.18 0.84

Annexure - IV A
STATE-WISE AREA AND PRODUCTION OF COCONUT IN INDIA
Andhra Assam Kerala Tamil Nadu Maharashtra Karnataka Year Area Production Area Production Area Production Area Production Area Production Area Production
1992-93 71.7 1081.8 15.6 103.2 877.0 5125.2 196.4 2771.1 7.9 131.0 246.0 1269.7 1993-94 79.9 1103.5 17.3 116.5 882.3 5197.0 272.8 3311.4 7.9 148.5 252.9 1308.0 1994-95 86.6 1181.4 17.8 117.6 911.0 5335.1 298.6 4345.7 8.2 178.6 263.8 1364.1 1995-96 90.0 1231.4 18.2 140.3 980.0 5908.0 322.5 3257.6 8.2 169.1 278.8 1450.9 1996-97 90.9 686 19.6 126.9 1005.7 5835 327.9 3811.0 15.1 245.3 291.4 1498 1997-98 94.9 815.0 19.7 126.9 1020.3 5911.0 266.5 3096.7 15.1 226.8 302.4 1550.4 1998-99 98.2 1922.1 19.7 126.9 1078.2 6672.0 266.5 3096.7 15.1 226.8 287.8 1495.1
1999-2000 102 1051.8 20.2 150.1 899.1 5167.0 304.0 3222.0 15.1 226.7 320.6 1670.3
2000-01 103 1092.7 21 136 925.8 5536 323.5 3192.0 16.8 244.4 333.8 1754.2 2001-02 104 1125 21.1 163.6 939.5 5744 335.8 3293.6 16.8 193.8 369.8 1503.6 2002-03 105 1158.6 21.1 163.6 905.5 5338 345.9 2860.7 16.4 180.7 369.8 1503.6

Annexure - IV B
STATE-WISE AREA AND PRODUCTION OF COCONUT IN INDIA Orissa West Bengal A&N Islands Goa Lakshadweep Pondicherry Tripura Year
Area Production Area Production Area Production Area Production Area Production Area Production Area Production 1992-93 38.4 219.5 20.4 285.1 24.1 84.4 24.2 113.0 2.8 21.0 1.9 31.0 11.3 4.9 1993-94 38.4 219.5 21.1 310.3 24.4 85.3 24.0 116.0 2.8 26.3 1.9 27.7 9.4 4.7 1994-95 42.9 234.5 21.6 274.4 24.4 85.4 24.6 118.0 2.8 26.0 2.1 34.1 9.4 4.7 1995-96 47.3 246.8 23.1 279.4 24.4 85.4 24.7 119.0 2.8 27.0 2.1 31.5 8.8 5.9 1996-97 53.1 272 23.7 313.0 24.7 87.5 24.7 121 2.8 27.7 2.1 31.5 9.1 6.1 1997-98 54.1 413.4 24.3 306.2 24.8 86.6 24.9 120.9 2.8 27.7 2.1 29.6 9.1 6.1 1998-99 54.5 795.1 24.6 318.2 24.7 87.5 24.9 121.0 2.8 27.7 2.1 29.6 9.1 6.1 1999-00 29.0 163.3 24.2 324.3 24.7 87.5 25.0 121.6 2.8 28.3 2.2 31.2 9.1 7.5 2000-01 17.7 109.9 24.5 330.5 25.2 89 25 125.1 2.7 36.9 2.2 24.7 3.1 7 2001-02 46.7 208.2 25 324.2 25.2 90 25 125.1 2.7 53.1 2.3 24 3.3 7 2002-03 50 205.4 25 324.2 25.3 94.3 25.1 122 2.7 53 2.3 22.3 3.3 7

Annexure - V
ARRIVALS OF TENDER AND MATURED COCONUT IN DELHI MARKET
(Qty. in M.T)
TENDER COCONUT MATURED COCONUT Sl.No. Month
2002-03 2003-04 2004-05 2002-03 2003-04 2004-05
1. April 4839.8 3077.1 2678.4 4526.3 2536.2 2052.9
2. May 3897.9 3240.3 2067.6 2485.3 2279.7 2314.4
3. June 2278.9 2106.2 1610.6 4744.1 2383.3 2490.9
4. July 3073.7 1310.2 1652.3 3803.5 3482.7 2637.0
5. August 2530.6 1350.2 1456.4 4480.0 3120.1 2997.0
6. September 1878.8 2040.3 1824.4 3655.3 5527.5 3689.1
7. October 2619.8 1896.9 1991.1 5160.7 3146.1 6801.1
8. November 1636.1 1576.4 1198.3 2135.2 1749.0 1812.5
9. December 1257.1 1029.7 1046.0 1466.4 1272.0 1465.1
10. January 655.5 626.9 855.5 1570.5 1330.1 1911.0
11. February 1277.0 1113.1 1098.9 1706.5 1639.1 1505.8
12. March 2411.4 1977.9 2575.8 3537.2 4066.5 3729.7
Total 28356.6 21345.2 20055.3 39271.0 32532.3 33406.5
Average 23252.4 35069.6
Total arrival of fruits : 2002-03 = 2157763.2 (MT) 2003-04 = 2391504.6 (MT) 2004-05 = 2327328.0 (MT)

Annexure – VI A
COCONUT GRADING AND MARKING RULES 1. Short Title and Application :-(i) These rules may be called the Coconut Grading and Marking Rules, 1976.
(ii) They shall apply to coconuts-in-shell and copra produced in India. 2. Definitions :- In these rules - (i) "Agricultural Marketing Adviser" means the Agricultural Marketing Adviser to the Government of India.
(ii) "Authorised packer" means a person or a body of person who has been granted a certificate of Authorisation by the Agricultural Marketing Adviser for getting the commodity graded and Agmarked in accordance with the grade standards and procedure prescribed under these rules. (iii) "Certificate of Authorisation" means document issued by the Agricultural Marketing Adviser in the name of a particular person or a body of persons granting an authorisation for grading a particular commodity at a specified premises for a specified period mentioned in it. (iv) "Schedule" means a schedule appended to these rules.
3. Grade Designation: - The grade designations to indicate the quality of coconuts shall be as set out in column 1 of schedule II to V. 4. Definitions of Quality :- The quality indicated by the grade designations shall be as set out against such designation in Schedule II to V. 5. Grade Designation Mark :- The grade designation mark shall consist of label bearing the design resembling the one set out in schedule I. 6. Method of Marking :- (i) The grade designation mark shall be securely affixed on each container in a manner approved by the Agricultural
Marketing Adviser. (ii) In addition to the grade designation mark, each container shall be clearly marked with such particulars and in such manner as may be specified from time to time by the Agricultural Marketing Adviser. (iii) An authorised packer may after obtaining the previous approval of the Agricultural Marketing Adviser, mark his private trade mark on a container in a manner approved by the said officer, provided that the private trade mark does not represent quality or grade of coconut different from that indicated by the grade designation mark affixed on the container in accordance with these rules.
7. Method of Packing :- (i) Only sound, clean and dry gunny bags neatly, stitched, free from objectionable odour shall be used for packing. Any
other type of container shall be used only after obtaining approval of the Agricultural Marketing Adviser. (ii) All containers shall be secured and sealed in a manner approved by the Agricultural Marketing Adviser.
8. Special Conditions of certificate of Authorisation :- In addition to the conditions specified in rule 4 of the General Grading and Marking
Rules 1937, the special condition set out in Schedule VI shall be the conditions of every Certificate of Authorisation issued under these rules.

SCHEDULE - I (See Rule 5)
DESIGN FOR THE GRADE DESIGNATION MARK OF COCONUT
(In shell or Ball Copra or cup Copra)

SCHEDULE-II (See Rules 3 and 4)
GRADE DESIGNATION AND DEFINITIONS OF QUALITY OF COCONUT-IN-SHELL
Grade
Designation Colour Size(1) (Diameter) in
Millimeters Description
Extra special Brown 110 and above
Special I Brown white or II Brown & White
100 and above
Standard I Brown White or II Brown & White
90 and above
General Mixed Below 90 Non specified+(3) -- --
The Coconuts shall be well developed, matured and husked *(2) with or without water. These shall be free from bad smell, damage and blemish due to fungus and insect infestation and dark with finger or metal it shall give the characters tic metallic sound without any dull note.
Note : (1) To find out the size, the nuts should be husked and the size should be measured by passing the nuts in the iron rings made to the size required.
*(2) The husk not exceeding 10% of the weight of the nuts is permissible. +(3) Packing under "non-specified" grade will be allowed only against a specific order from the foreing buyer indicating the
quantity and quality of the produce desired.

SCHEDULE III (See Rules 3 and 4)
GRADE DESIGNATION AND DEFINITIONS OF QUALITY OF BALL COPRA FOR EDIBLE USE
Grade
Designation Size
(Diameter) Minimum
in mm
Foreign matter % by
weight (maximum)
Mouldy Black Kernels % by
Count (maximum)
Wrinkled Kernels % by
Count (maximum)
Moisture content % by
weight (maximum)
Chips % by weight
(maximum)
Description
Grade 1 85 0.2 2.0 10.0 7.0 1.0 Grade 2 75 0.2 2.0 10.0 7.0 1.0 Grade 3 60 0.2 2.0 10.0 7.0 2.0
(i) These shall be the kernels obtained intact and in the form of balls from the fruits of cocos nucifera Linn. family-palmae. (ii) These shall be well dried, reasonably firm and in sound merchantable condition. (iii) These may be fumigated by sulphur of other fumigants permissible under PFA Rules, 1955 and shall be free from rancid taste and objectionable odour. The testa shall be whitish to dark brown in colour and the meat shall be pearly white to ash white in colour and shall be sweet in taste
+ Non-Specified Note : 1. Foreign matter includes sand, dust, straw and shell. 2. Mouldy and black kernels include balls in which more than 5% of the inner surface is covered with mould and/or is dark brown to black in
colour. 3. Wrinkled kernels include balls that are shrunk out of normal shape or are not fully matured or developed or have a rubbery structure and uneven
surface. Such kernels are often discoloured. 4. Chips include pieces of kernel which are smaller in size. 5. Meat means the soft body enclosed in the shell which carries the oil. +6. Packing under Non-Specified grade will be allowed only against a specified order from the foreign buyer indicating the quantity and quality of
the produce desired.
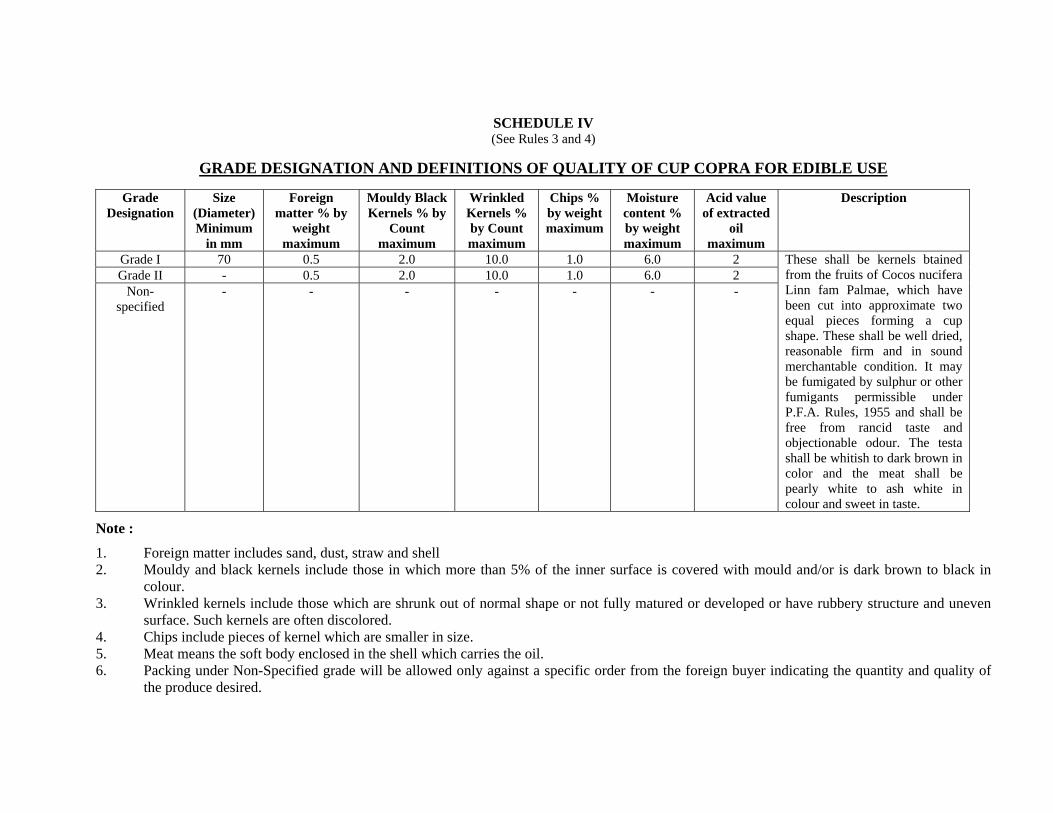
SCHEDULE IV (See Rules 3 and 4)
GRADE DESIGNATION AND DEFINITIONS OF QUALITY OF CUP COPRA FOR EDIBLE USE
Grade
Designation Size
(Diameter) Minimum
in mm
Foreign matter % by
weight maximum
Mouldy Black Kernels % by
Count maximum
Wrinkled Kernels % by Count maximum
Chips % by weight maximum
Moisture content % by weight maximum
Acid value of extracted
oil maximum
Description
Grade I 70 0.5 2.0 10.0 1.0 6.0 2 Grade II - 0.5 2.0 10.0 1.0 6.0 2
Non-specified
- - - - - - -
These shall be kernels btained from the fruits of Cocos nucifera Linn fam Palmae, which have been cut into approximate two equal pieces forming a cup shape. These shall be well dried, reasonable firm and in sound merchantable condition. It may be fumigated by sulphur or other fumigants permissible under P.F.A. Rules, 1955 and shall be free from rancid taste and objectionable odour. The testa shall be whitish to dark brown in color and the meat shall be pearly white to ash white in colour and sweet in taste.
Note :
1. Foreign matter includes sand, dust, straw and shell 2. Mouldy and black kernels include those in which more than 5% of the inner surface is covered with mould and/or is dark brown to black in
colour. 3. Wrinkled kernels include those which are shrunk out of normal shape or not fully matured or developed or have rubbery structure and uneven
surface. Such kernels are often discolored. 4. Chips include pieces of kernel which are smaller in size. 5. Meat means the soft body enclosed in the shell which carries the oil. 6. Packing under Non-Specified grade will be allowed only against a specific order from the foreign buyer indicating the quantity and quality of
the produce desired.

SCHEDULE V
(See Rules 3 and 4)
GRADE DESIGNATIONS AND DEFINITIONS OF QUALITY OF CUP COPRA FOR OIL MILLING
Grade Designation
Foreign matter % by weight maximum
Mouldy Black
Kernels % by Count maximum
Wrinkled Kernels % by Count maximum
Chips % by weight maximum
Moisture content % by weight maximum
Oil contention moisture free
basis % by weight
maximum
Acid value of extracted
oil maximum
Description
Grade I 0.5 5.0 10.0 5.0 6.0 70.0 2 Grade II 1.0 10.0 10.0 10.0 6.0 68.0 4 Grade III 2.0 15.0 15.0 15.0 6.0 66.0 10 + Non-
specified - - - - - - -
These shall be kernels obtained from the fruits of Cocos nucifera Linn., fam. Palmae which have been cut into approximately two equal pieces forming a cup shape. These shall be well dried, reasonably firm and in sound merchantable condition. It may be fumigated by sulphur or other fumigants permissible under P.F.A. Rules, 1955 and shall be free from rancid taste and objectionable odour. The testa shall be whitish to dark brown in colour and the meat shall be pearly white to ash white in colour.
Note :
1. Foreign matter includes sand, dust, straw and shell - 2. Mouldy and black kernels include those in which more than 5% of the inner surface is covered with mould and /or is dark brown to black in color. 3 Wrinkled kernels include those which are shrunk out of normal shape or are not fully matured or developed or have rubberystructure and uneven surface. Such
kernels are often discolored. 4. Chips include pieces of kernels which are smaller in size. 5. Meat means the soft body enclosed in the shell which carriers the oil. 6. Packing under Non-specified grade will be allowed only against a specified order from the foreign buyer indicating the quantity and quality or
the produce desire.

SCHEDULE VI (See Rule 8)
SPECIAL CONDITIONS OF CERTIFICATE OF AUTHORISATION
1. An authorized packer shall own or have access to suitable hygienic premises for the processing and/or storage of coconuts/copra duly approved by the Agricultural Marketing Adviser.
2. An authorized packer shall make such arrangements for the testing of Coconuts/Copra as may be prescribed from time to time by
the Agricultural Marketing Adviser. He shall also maintain proper records of the analysis of samples. 3. All instructions regarding method of sampling and analysis, sealing and marking of containers and maintenance of records etc,
which may be issued from time to time by the Agricultural Marketing Adviser shall be strictly observed. 4. A sample of coconut/copra drawn in a manner prescribed by the Agricultural Marketing Adviser, from each lot, shall be forwarded
to such Control Laboratory as may be directed from time to time. 5. Each container shall be filled with coconuts in the manner prescribed by the Agricultural Marketing Adviser. 6. An authorized packer shall provide all facilities as may be necessary to the Inspecting Officers duly authorized by the Agricultural
Marketing Adviser in this behalf

Annexure – VI B
VEGETABLE OILS GRADING AND MARKING RULES
1. Short title and application:- 1) These Rules may be called the Vegetable Oils Grading and Marking Rules, 1955. 2) They shall apply to Vegetable Oils produced in India. 2. Definitions- In these rules unless the context otherwise requires,- 1) “Agricultural Marketing Adviser” means the Agricultural Marketing Adviser to the Government of India ;
2) “Authorised packer “means a person or a body of persons, who has been granted a certificate of authorization to grade and mark commodity in accordance with the grade standards and procedure prescribed under these rules.
3) “Certificate of authorisation” means a certificate issued under the General Grading and Marking Rules, 1988, 4) “Schedule” means schedules appended to these rules. 3. Grade designations:- The grade designation to indicate the quality of Vegetable Oils shall be as set out in column 1 of Schedule I to XVI 4. Definition of quality:- The quality indicated by the grade designations shall be as set out against such designations in Schedule I to XVI 5. Grade designation marks :- The grade designation marks shall consist of;
(i) A label specifying name of the commodity, grade designation and bearing a design consisting of an outline map of India with the word “AGMARK” and the figure of rising sun with the words “Produce of India” and ¦ÉÉ®úiÉÒªÉ =i{ÉÉnùù resembling the one as set out in Schedule XVII-A ; or
(ii) Agmark replica consisting of design incorporating the number of certificate of authorization, the word “AGMARK”, the name of the commodity, the grade designation resembling the one as set out in Schedule XVII-B; Provided that the use of Agmark replica in lieu of Agmark labels shall be allowed to such authorized packers who have been granted permission, by the Agricultural Marketing Adviser or an officer authorized by him in this behalf and subject to conditions as specified from time to time •
6. Packing provisions;- 1) Vegetable Oils shall be packed either in new, sound, clean and rust free tins or in clean bottles., mild steel drums, railway tank
wagons or in approved clean and new thermo plastic containers/ flexible packs like pouches, cans, bottle jars etc. 2) The plastic containers shall be manufactured out of food grade plastic materials permitted under Prevention of Food Adulteration rules , 1955. 3) The Vegetable Oils shall be packed in the standard size namely, 100gms., 200gms., 5OOgms, 1Kg, 5Kgs and thereafter in multiples of 5 Kgs net
weight. The edible vegetable oils may also be packed in corresponding volumetric packings expressed in milli-liters or liters along with their weights in gms/kgs as the case may be.
4) The containers of oils shall be free from any contaminants and shall not be composed of whether wholly or in part, any poisonous or deleterious substance which renders the contents injurious to health.
5) The container of oils shall be free from insect infestation, fungus contamination or any obnoxious and undesirable smell. 6) The packing shall be done in the manner prescribed for different types of packing,
Contd..2/-

:: 2 ::
7. Marking provisions- 1) The grade designation mark shall be securely affixed to each container in a manner approved by the Agricultural Marketing Adviser. In addition to the grade designation mark, the following particulars shall also be clearly and indelibly marked on each container:-
(a) Name of packer. (b) Place of packing (business address) (c) Tank filling No. (d) Date of packing in plain letters.* (e) Net weight /volume (wherever applicable) Note* : the date of packing shall be the date of completion of analysis of the sample.
2) An authorised packer may after obtaining the prior approval of the Agricultural Marketing Adviser or an officer authorised in this behalf, mark his
private trade mark on a container in a prescribed manner; Provided that private trade mark does not represent quality or grade of the Vegetable Oil different from that indicated by the grade designation mark affixed on the container in accordance with these rules.
8. Special conditions of certificate of authorisation:- In addition to the conditions specified in sub-rule (8) of rule 3 of the General Grading & Marking Rules,
1988, the conditions set out in Schedule III shall be the conditions of every Certificate of Authorisation issued for the purpose of these rules. 9. Repeal and Savings :- The Edible Oils Grading and Marking Rules, 1939 and the Castor Oil Grading and Marking Rules, 1949, are hereby rescinded without
affecting the previous operation of the said rules or anything duly done or suffered thereunder. Note :- Each label shall have printed thereon a serial number along with a letter or letters denoting the series e.g. A. 004378.

AGMARK GRADE DESIGNATION AND DEFINITION OF QUALITY OF COCONUT OIL
Definition of Quality Grade
Designation Moisture and
insoluble impurities percent by weight (not more than)
Colour on Lovibond scale* in 1 inch cell
expressed as Y +5R (not deeper than)
Specific gravity at
300C/ 300C
Refractive Index at
400C
Specification value (not less than)
Iodine value
((Wij's method)
Unsaponifible matter per cent by weight (not
more than)
Acid value (not more than)
Polenske value (not
more than)
Description General requirement
1. 2. 3. 4. 5. 6. 7. 8. 9. 10. 11. 12. Refined 0.10 2 0.915 to
0.920 1.4481 to
1.4491 250 7.5 to
10.0 0.5 0.5 13.0 Coconut oil shall be
obtained either by process of expression of good quality copra (Cocos nucifera) or by a process of solvent extraction **of good quality coconut cake or good quality copra (Cocos nucifera) using approved food grade solvents. The refining of the oil shall be done by neutralization with alkali and/or physical refining and/or by miscella refining followed by bleaching with adsorbent earth And/or activated carbon and deodorisation with Steam. No chemical agent shall be used.
The oil shall have natural sweet taste. it shall be clear and free from turbidity when a filtered sample is kept for 24 hrs. at 300C. The oil shall be free from rancidity, admixture or other oils or substances or adulterants. The oil shall be free from mineral oil, sediments, suspended matter, separated water, obnoxious odour, added colouring and flavouring agents. The oil may contain permitted antioxidants not exceeding in concentration as specified under Prevention of Food Adulteration Rules, 1955.
* In the absence of Lovi-bond Tintometer, the colour shall be matched against standard colour comparator. * In case of solvent extracted oil, the flash point by Pensky-Mattens (closed cup) method shall not be less than 2250C and the container shall be marked "Solvent Extracted".
Contd..2/

:: 2 ::
1. 2. 3. 4. 5. 6. 7. 8. 9. 10. 11. 12. Grade-I 0.25 4 0.915 to
0.920 1.4481 to
1.4491 250 7.5 to
10.0 0.8 3.0 13.0 The oil shall be the
product obtained by expression of good quality copra (Cocos nucifera only)
The oil shall have natural sweet taste and characteristic odour. It shall be clear and free from rancidity, admixture of any other oil, substances or adulterants. It shall also be free from mineral oil, sediments, suspended matter, separated water, obnoxious odour, added colouring and flavouring agents. The oil may contain permitted antioxidants not exceeding in concentrations as specified under Prevention of Food Adulteration Rules, 1955.
Grade- II 0.25 11 0.915 to 0.920
1.4481 to 1.4491
250 7.5 to 10.0
0.8 6.0 13.0 the product obtained by expression of good quality copra (Cocos nucifera only)
The oil shall have natural sweet taste and characteristic odour. It shall be clear and free from rancidity, admixture of any other oil, substances or adulterants. It shall also be free from mineral oil, sediments, suspended matter, separated water, obnoxious odour, added colouring and flavouring agents. The oil may contain permitted antioxidants not exceeding in concentrations as specified under Prevention of Food Adulteration Rules, 1955.

Annexure – VI C VEGETABLE OIL CAKES (EXPRESSED OR SOLVENT EXTRACTED)
GRADING AND MARKING RULES
1. Short title and application – These rules may be called Vegetable Oil Cakes (Expressed or Solvent Extracted) Grading and Marking Rules, 1979. 2. Definition. – In these rules,- (a) “Agricultural Marketing Adviser” means the Agricultural Marketing Adviser to the Government of India;
(b) “Schedule” means a Schedule appended to these rules. 3. Grade designations.-The grade designations to indicate the quality of oil cakes (expressed or solvent extracted) shall be as set out in column (1) of Schedule
II-A 4. Definition of quality-. The quality indicated by the grade designation shall be as set out against each grade designation in Schedule II-A to IX-B. 5. Grade designation marks.- The grade designation mark shall consist of a label bearing the design set out in Schedule I and specifying the grade designation,
the name of cake and whether it is expressed or solvent extracted. 6. Method of marking – (1) The grade designation mark shall be securely affixed or stenciled on each container in a manner approved by the Agricultural
Marketing Adviser and shall as indicate the number of the Certificate of Authorization issued to the packer by the Agricultural Marketing Adviser. (2) In addition, on every container the following particulars shall clearly and indelibly be marked :-
(a) Lot number, (b) Name of packer, (c) Date of packing, (d) Place of packing.
(3) The authorized packer may, after obtaining the prior approval of the Agricultural Marketing Adviser, mark his private trade mark on the container in a manner approved by the said officer, provided that the private trade mark does not represent quality or grade of the oil cake different from that indicated by the grade designation mark affixed to the container in accordance with these rules.
7. Method of packing – (i) The oil cake shall be packed only in container made of jute or other material approved by the Agricultural Marketing Adviser from
time to time. (ii) Each container shall be securely closed and sealed and shall contain oil cake of one trade description and of one grade designation only. 8. Special conditions of Certificate of Authorization- In addition to the conditions specified in Rule 4 of the General Grading and Marking Rules, 1937, the
following conditions shall also be the conditions of every Certificate of Authorization issued for the purpose of these rules, namely:- (i) Each authorized packer shall take all precautions to avoid admixture of oil cakes with castor seeds and castor cake (ii) If an authorized packer handles more than one type of oil cake in the same premises adequate precaution shall be taken by him to avoid mixing of different oil cakes. The premises should be clean and hygienic and should be subjected to prophylactic treatment at an interval no more than three weeks. The stock should be fumigated as and when any insect infestation is noticed. (iii) The authorized packer shall make such arrangements for testing oil cakes as may be specified form time to by the Agricultural Marketing Adviser and shall also maintain proper records of analysis of the samples. (iv) All instructions regarding methods of sampling and analysis, packing and marking and maintenance of record, which may be issued from time to time by the Agricultural Marketing Adviser shall be observed (v) A sample of oil cake drawn in the manner prescribed by the Agricultural Marketing Adviser from each lot, shall be forwarded to such control laboratory as may be notified from time to time.
GRADE DESIGNATIONS AND DEFINITIONS OF QUALITY OF COCONUT OIL CAKE-EXPRESSED

Grade Designation
Moisture per cent by
weight (maximum)
Crude protein (nitrogen x
6.25 per cent by weight minimum)
Crude fat or ether extract per cent by
weight (minimum)
Crude fibre per cent by
weight (maximum)
Total ash per cent by
weight (maximum)
Acid insoluble
ash per cent by weight
(maximum)
Castor husk
General characteristics
Good 10.0 21.0 8.0 12.0 8.0 1.5 Nil Ghani 12.0 18.0 13.0 12.0 8.5 2.5 Nil
1. Coconut Oil cake of grade good shall be the products obtained after the extraction of oil from copra (dried coconut kernels) by power driven machinery. 2. Ghani grade oil cake shall be the product obtained after the extraction of oil from copra(dried coconut kernels) by animal driven ghani or chakki. 3. The material shall be free from harmful constituents and castor cake or husk. 4. It shall be free from rancidity adulterants, insects or fungus infestation and from fermented musty and other objectionable odour.
5. It shall be free from dirt and extraneous matter.
NOTE : The values specified in columns 3 to 7 are calculated on moisture free basis. Adopted form the Indian Standards Specifications for coconut oil cakes as
Livestock feed (IS : 2154-1962).
GRADE DESIGNATIONS AND DEFINITIONS OF QUALITY OF COCONUT OIL CAKE (MEAL)- SOLVENT EXTRACTED

Grade Designation
Moisture per cent by
weight (maximum)
Crude protein
(nitrogen x 6.25 per cent
by weight minimum)
Crude fat or ether extract per cent by
weight (minimum)
Crude fibre per cent by
weight (maximum)
Acid insoluble
ash per cent by weight
(maximum)
General characteristics
Good 10.0 23.0 1.0 14.0 1.5 Fair 10.0 21.0 1.5 15.0 2.0
The solvent extracted coconut oil cake (meal shall be obtained by extraction of oil by means of a solvent from the expeller ghani pressed coconut oil cake. The expeller or ghani pressed coconut oil cake used for extraction shall have been obtained by pressing clean and sound coconut. The meal shall have been subjected to heat and steam treatment un controlled and regulated conditions so as to remove traces of solvent. The material shall be in the form of either flakes or powder. It shall be free from harmful constituents and castor cake or husk or both and mahua cake. It shall be free from rancidity, adulterants, insects or fungus infestation and from musty odour.
Note : 1. The values specified in columns 3 to 6 are calculated on moisture free basis. Adopted from Emergency Indian Standards specification for a solvent extracted
coconut oil cake (meal) as livestock feed (IS : 3591-E-1966) 2. Solvent for extraction : Only hexane food grade solvent shall be used for the purpose of extraction. The requirement of the solvent shall be as follows :-
Boiling range 630 C to 710 C Aromatic content max : 1 per cent. Non-volatile content max. 0.001 gms/100 ml.
Annexure – VII A

SCENARIO OF COCONUT MARKETING IN INDIA
Sl. No.
State / UT District / Market
Private channe
l
Insti- tution / channe
l
Name of the producer - seller
Village Size of holding orchard
(hect)
Distance from village
to assembling
market (km.)
Type of road
Transport used
Qnty. of nut
Price for
1000 nuts
System of sale open auction,
tender, mutual negotiation etc.
1. 2. 3. 4. 5. 6. 7. 8. 9. 10. 11. 12. 13. 14. Chennai P I M.Kuzhanathai,
Chennai Thennangdupi
Narthu 4 3 Tar road Tractor 10000 5500 Mutual
negotiations Dharam Puri P -- R.Jeyavelu Manivambadi 1 18 Surface Bus 1000 3500 - do -
Pollachi P I Shri V.Ratnam Annamalai 48 2 Tar road Lorry/Tractor 20000 6500 - do - Vadassary P -- S.Kumaresan Vandavila 4 10 - do - - do - 10000 7500 - do -
1. Tamil Nadu
Dindigul P -- S.Mod.Sayeed Sithyery Koltai 20 20 Surface Truck 9000 4000 - do - 2. Pondicherry -- P -- G.Narayan Murungapalkam 12 10 Tar road Lorry 15000 5000 - do -
Ratnagiri P -- R.Pillankar Bhatye Village Less than 0.149
4 Surface Personal tempo 380 8000 Direct method
Sindhudurg P -- V.D.Thakurdesai Nangaon 0.2 5 - do - Hired vehicle 800 8000 - do -
3. Maharashtra
Mumbai P -- R.L.Vaze Arnala 1.2 16 - do - Truck 6000 4000 Contract system Junagarh P I Yusufbhai Gameti Gadu 2 12 Tar road Auto carrier 2000 2250 By auction Navsari P -- S.G.Patel Jeravasam 1 10 Surface Auto 2750 3500 - do -
Ahmedabad P -- R.M.Godavi Jarpara 0.60 10 - do - Tempo 1750 3100 Mutual negotiations
4. Gujrat
Bhavnagar P -- J.B.Henabhai Ratol 2 9 - do - Bullock cart 177 400 Open auction 5. Daman Daman P -- R.B.Gandhi Magarwada 0.50 12 - do - Auto 1450 4500 Mutual
negotiations 6. Diu Diu P -- K.B.Malala Bucharwada 0.50 6 - do - Auto 700 4000 - do -
Cuttack P -- B.S.Behra Gangapur 1/3 3 - do - Trolly rickshaw 120 4800 - do - Ganjam P -- T.Nag.Reddy Basinaputi ¼ 3 - do - - do - 100 5000 - do - Khurda P -- G.C.Rath Jamukoli 0.5 11 - do - Auto/tractor 500 6000 - do -
Nayagarh P -- B.Mahapatra Dinagaon 3 7 - do - Tractor 3000 5000 - do -
7. Orissa
Puri P -- P.Pradhan Pambhandar 0.7 4 Kutcha road Auto 540 7000 Open auction Mysore P -- Mahadeva Kyanahalli 3 2 Pucca road Bullock cart 1000 5000 Mutual
negotiations Mandya P -- Shankar Annakere Medium 8 - do - - do - 300 5100 - do -
Mangalore P -- Abdul Hamid Padil 2 10 - do - Tempo 500 5500 - do - Tumkur P -- Jagdish Appa Gopalanahalli 2 12 Surface Tractor 3000 5700 By tender
8. Karnataka
Bangalore P -- Manjunath Nuggenhatti 0.8 18 - do - Bullock cart 1000 6000 Mutual negotiations
Trivendrum P -- Gangadhar Nair Kattakada 1 -- - do - N.A 500 6000 - do - Nedumangal P -- Ravindran Pillai Aruvikkra 0.8 6 - do - -- 900 4800 - do -
Thiruvan-thapuram
P -- Chandras Nair Katlakada 2 2 - do - Jeep 1300 5000 - do -
Thrissur P -- Vijaragavam Korumbissey 2 -- - do - Nil 4500 6500 - do -
9. Kerala
Malappuram P -- Maiddeen Kutty Anakayam 1.5 6 Pucca road Tempo 2500 1200 - do -
Annexure – VII B

SCENARIO OF COCONUT MARKETING IN INDIA
1. 2. 3. 4. 5. 6. 7. 8. 9. 10. 11. 12. 13. 14.
Ponnani P -- Kuttun Kuttikad 1 10 Pucca road Tempo 20000 4500 Mutual negotiations
Manna P -- Muhammad Anakayam 52 cents 15 - do - - do - 500 1100 - do -
Kalicut P -- M.M.Matheus Mukkam 1.2 hect. -- - do - - do - 1650 5250 - do -
Kozhikodi P -- Abdul Raheman Roanuthum 1.5 2 Surface Auto 800 -- - do -
9. Kerala
Kannur P -- Thomas Oblathar 5 5 - do - - do - 4400 -- - do -
10. Lakshadweep Manglore P -- Pookoya Kavarati 3 1 - do - - do - 1000 -- - do -
Shrikakulam P -- C.N.Mittal Tekkali 75 hect. -- Pucca raod Truck 10000 5000 - do -
East Godavari P -- B.Murthy Arukkamula 10 8 - do - - do - 15000 4000 - do -
West Godavari P -- T.Madhoo Rao Yelamnchill 8 10 - do - - do - 8000 4200 - do -
Vishakhapatanam P -- B.Meenu S.Ragavanam 5 -- Surface Van 8000 3000 - do -
11. Andhra Pradesh
Vizayanaganam P -- Appala Narasiah Bhogapuram 4 -- - do - -- 9000 4500 - do -
24 Paraganas (S) P -- Rabial Nagne Shyompur 1 1 - do - Rickshaw 300 3000 - do -
Murshidabad P -- M.Ghosh Kosipur 0.5 hect. 5 Unsurface - do - 500 700 - do -
Howrah P -- Nemaj Mandal Bonnarpara 1 2 - do - - do - 200 550 - do - 12. West Bengal
Midnapur P -- Mahadeo Khatua Geonkhali 1 15 - do - - do - 400 600 - do -
13. Goa South Goa Distt. P -- Moreshwar Joshi Dhave 1.5 hect. 8 Pucca road Bus 5000 5500 - do -
Silchar Town P -- Ramshwar Saikia Gedaborri 0.25 ha. -- -- -- 400 500 - do-/Auction
Dibrugarh P -- Gopap Barria Uria-gaon 0.5 hect. -- -- -- 500 450 - do -
Tinsukia Town P -- Ali Askan Borri-gaon 0.3 hect. -- -- -- 500 450 - do -
Hazakamarup P -- Krishna Das Soldnlattaro 0.5 hect. 3 Surface -- 200 1400 - do -
14. Assam
Guwahati P -- Kamala Barman Bonmaza 0.25 ha. -- -- -- 500 450 - do -

Annexure-VIII MONTHLY AVERAGE PRICE OF COCONUT AT ARSIKERE MARKET
(Rs/1000 Nuts)
Month / Year 1997 1998 1999 2000 2001 2002 2003 2004 2005 2006
January 4900 5200 4200 4000 2900 4000 4500 4891 5460 3958
February 6200 5200 5300 5000 4000 4200 5200 5481 5919 3879
March 5800 5300 5300 4800 4000 4300 4400 6048 5648 4910
April 5600 4000 5200 3700 3500 3700 4000 4897 5500 5596
May 5700 3500 4500 3700 2800 4000 3900 5629 5750 4990
June 5400 3800 4900 3500 3000 4000 4000 5393 4945 4713
July 5600 4000 4800 3450 3300 3800 4605 5370 5085 4758
August 5300 3700 4700 3100 3200 3750 4777 5690 5014 4723
September 5800 3600 4600 2900 3000 3750 5489 5731 5242 5275
October 4800 3800 4700 2600 3300 3800 5347 5324 4629 5376
November 4850 3900 4650 2600 3500 3900 5258 5231 4581 4783
December 5250 4000 5000 2700 4100 4500 4950 5500 4663 4805
Average 5433 4167 4821 3504 3383 3975 4702 5432 5203 4814
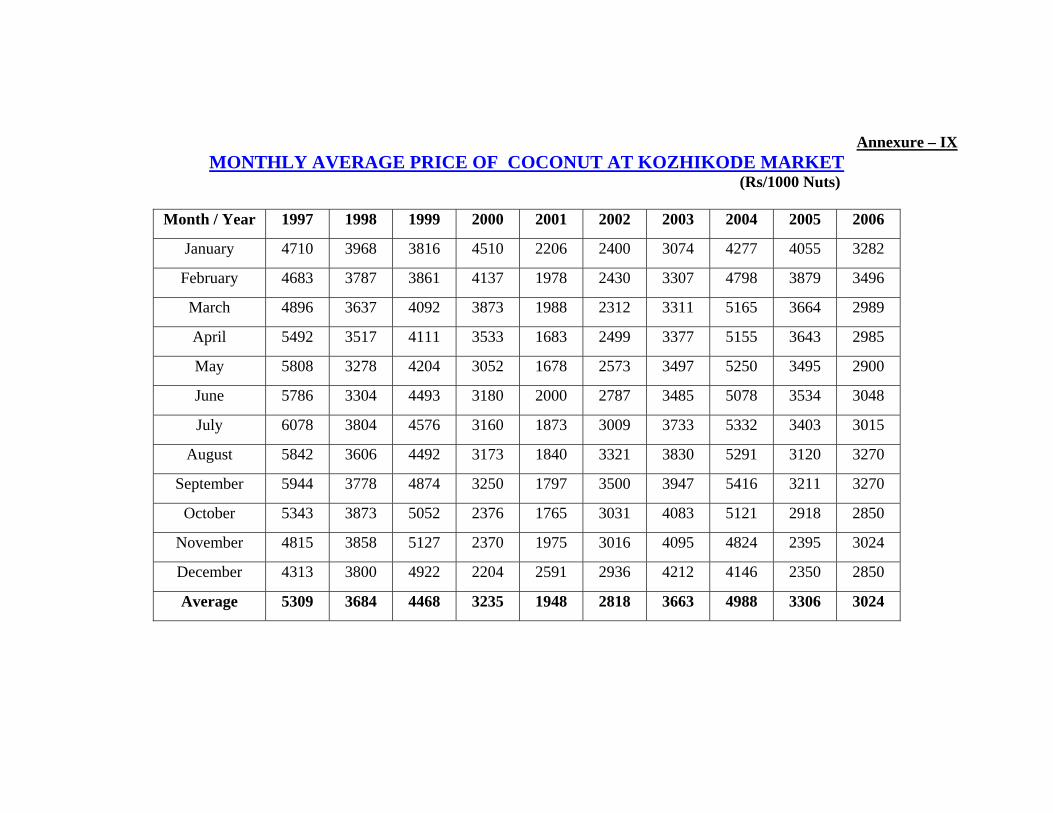
Annexure – IX MONTHLY AVERAGE PRICE OF COCONUT AT KOZHIKODE MARKET
(Rs/1000 Nuts)
Month / Year 1997 1998 1999 2000 2001 2002 2003 2004 2005 2006
January 4710 3968 3816 4510 2206 2400 3074 4277 4055 3282
February 4683 3787 3861 4137 1978 2430 3307 4798 3879 3496
March 4896 3637 4092 3873 1988 2312 3311 5165 3664 2989
April 5492 3517 4111 3533 1683 2499 3377 5155 3643 2985
May 5808 3278 4204 3052 1678 2573 3497 5250 3495 2900
June 5786 3304 4493 3180 2000 2787 3485 5078 3534 3048
July 6078 3804 4576 3160 1873 3009 3733 5332 3403 3015
August 5842 3606 4492 3173 1840 3321 3830 5291 3120 3270
September 5944 3778 4874 3250 1797 3500 3947 5416 3211 3270
October 5343 3873 5052 2376 1765 3031 4083 5121 2918 2850
November 4815 3858 5127 2370 1975 3016 4095 4824 2395 3024
December 4313 3800 4922 2204 2591 2936 4212 4146 2350 2850
Average 5309 3684 4468 3235 1948 2818 3663 4988 3306 3024

Annexure - X MONTHLY AVERAGE PRICES OF COCONUT AT KANGAYAM MARKET
(Rs/1000 Nuts)
Month / Year 1997 1998 1999 2000 2001 2002 2003 2004 2005 2006
January N.A 4310 4240 4975 2425 2500 4220 5000 4950 3500
February N.A 3538 3875 N.A 2500 2500 4688 5000 4988 3182
March N.A 3350 4500 N.A 2500 2500 4763 5625 4813 2950
April 4750 3425 4400 3450 2375 2500 4575 5390 4130 3063
May 4750 2690 4250 3150 2200 2500 4050 4550 3925 3188
June 4750 2750 4250 2700 2320 2500 4000 4325 3338 3000
July 4750 3000 4250 2650 2025 3025 4000 4080 4950 3063
August 4600 3125 4600 2500 2000 3250 4192 4575 2850 2538
September 4500 3500 4000 2500 NA 3062 4600 4600 3130 3300
October 4500 3500 5010 2563 2000 3500 5063 4670 3425 2750
November 4500 4150 5000 2000 2050 3710 5438 5150 3875 4250
December 5000 4000 5480 2380 2750 4213 5438 4950 3863 4280
Average 4678 3445 4488 2887 2286 2980 4586 4826 4264 3255

Annexure - XI MONTHLY AVERAGE PRICES OF COCONUT AT ALAPPUZHA MARKET
(Rs/1000 Nuts)
Month / Year 1997 1998 1999 2000 2001 2002 2003 2004 2005 2006
January 6100 4500 5000 6250 2880 4000 5700 6750 7250 N.A
February 5900 3800 4875 5730 3000 4000 4900 6250 6875 N.A
March 4500 3800 4967 4130 3000 3870 4675 6120 6250 N.A
April 5300 4000 5275 4000 3500 3800 4875 5920 6000 N.A
May 4200 3800 5050 3500 3000 3850 4875 6175 6000 N.A
June 4700 4100 5700 3380 3130 3900 4875 6500 6000 N.A
July 4700 4000 5130 3250 3500 4125 5200 6750 N.A. N.A
August 4600 4200 5380 3500 3500 4375 5750 6750 N.A N.A
September 4700 4100 5880 3130 3500 4425 6150 6750 N.A N.A
October 4600 4580 6250 3000 2900 4525 6875 6750 N.A N.A
November 5500 4450 7130 2880 3500 5150 6750 7250 N.A N.A
December 5000 4700 6380 2880 3780 5950 7000 8000 N.A N.A
Average 4983 4169 5585 3803 3266 4331 5635 6664 6396 N.A

Annexure - XII
MONTHLY AVERAGE PRICES OF COCONUT AT KOCHI MARKET (Rs/1000 Nuts)
Month / Year 1997 1998 1999 2000 2001 2002 2003 2004 2005 2006
January N.A N.A N.A 5750 2780 3500 4775 6150 7000 N.A
February N.A N.A 5313 4750 2780 3370 5200 5720 6750 N.A
March N.A N.A 5413 3630 2780 3620 5050 6000 6750 N.A
April N.A N.A 5710 3600 2700 3550 5150 5870 6500 N.A
May N.A N.A 5325 3250 2850 3900 4950 6125 6250 N.A
June N.A N.A 5456 3250 2850 4350 5250 6250 5500 N.A
July N.A 4380 4880 2850 2850 4500 5100 6120 N.A N.A
August N.A 4413 5350 2850 2950 4250 5500 6375 N.A N.A
September N.A N.A 5750 2950 2800 4250 5600 6000 N.A N.A
October N.A 5065 5750 2750 2780 4250 6000 6250 N.A N.A
November N.A 4888 5750 3000 3130 5000 6375 6850 N.A N.A
December N.A 5313 5750 2950 3750 4875 6120 7000 N.A N.A
Average N.A 4812 5538 2892 3043 4521 5783 6433 6458 N.A
Annexure - XIII
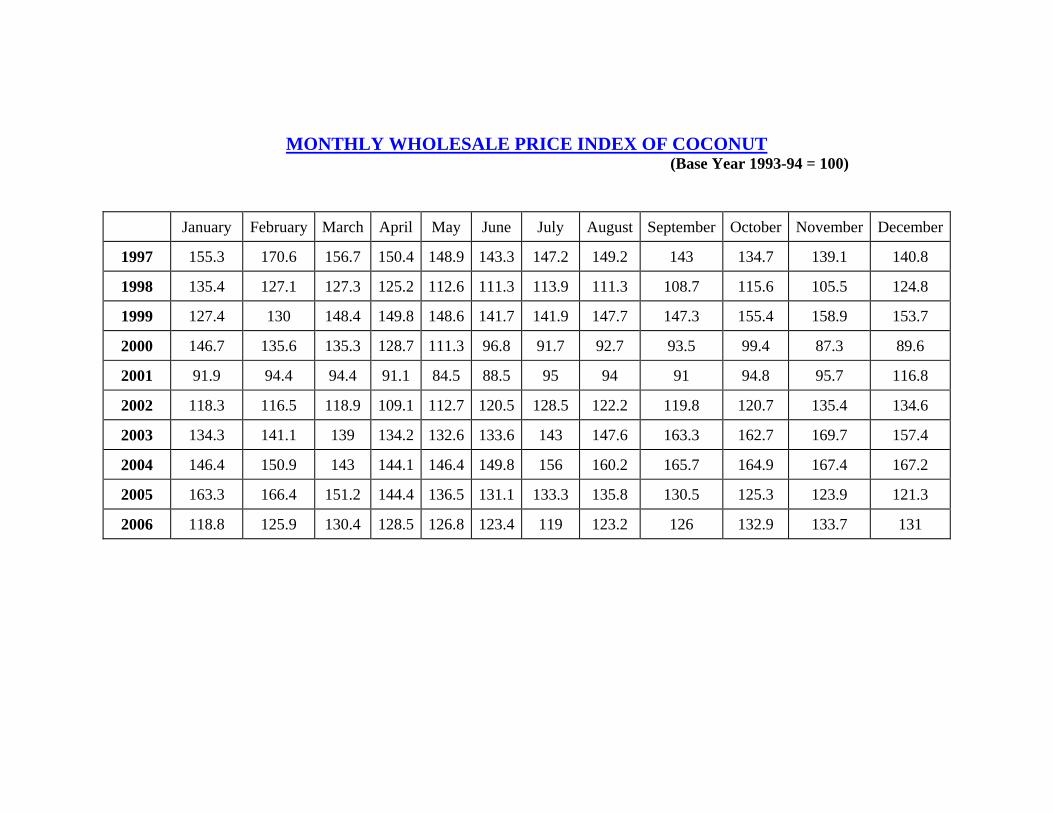
MONTHLY WHOLESALE PRICE INDEX OF COCONUT (Base Year 1993-94 = 100)
January February March April May June July August September October November December
1997 155.3 170.6 156.7 150.4 148.9 143.3 147.2 149.2 143 134.7 139.1 140.8
1998 135.4 127.1 127.3 125.2 112.6 111.3 113.9 111.3 108.7 115.6 105.5 124.8
1999 127.4 130 148.4 149.8 148.6 141.7 141.9 147.7 147.3 155.4 158.9 153.7
2000 146.7 135.6 135.3 128.7 111.3 96.8 91.7 92.7 93.5 99.4 87.3 89.6
2001 91.9 94.4 94.4 91.1 84.5 88.5 95 94 91 94.8 95.7 116.8
2002 118.3 116.5 118.9 109.1 112.7 120.5 128.5 122.2 119.8 120.7 135.4 134.6
2003 134.3 141.1 139 134.2 132.6 133.6 143 147.6 163.3 162.7 169.7 157.4
2004 146.4 150.9 143 144.1 146.4 149.8 156 160.2 165.7 164.9 167.4 167.2
2005 163.3 166.4 151.2 144.4 136.5 131.1 133.3 135.8 130.5 125.3 123.9 121.3
2006 118.8 125.9 130.4 128.5 126.8 123.4 119 123.2 126 132.9 133.7 131
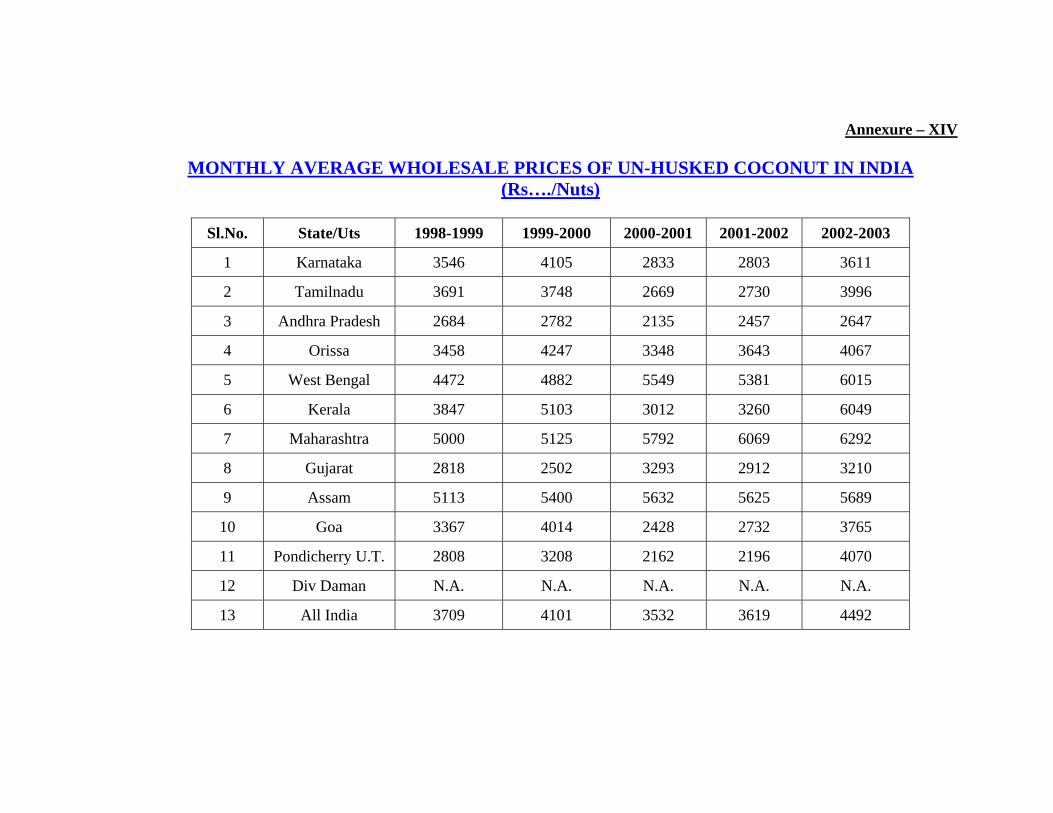
Annexure – XIV
MONTHLY AVERAGE WHOLESALE PRICES OF UN-HUSKED COCONUT IN INDIA (Rs…./Nuts)
Sl.No. State/Uts 1998-1999 1999-2000 2000-2001 2001-2002 2002-2003
1 Karnataka 3546 4105 2833 2803 3611
2 Tamilnadu 3691 3748 2669 2730 3996
3 Andhra Pradesh 2684 2782 2135 2457 2647
4 Orissa 3458 4247 3348 3643 4067
5 West Bengal 4472 4882 5549 5381 6015
6 Kerala 3847 5103 3012 3260 6049
7 Maharashtra 5000 5125 5792 6069 6292
8 Gujarat 2818 2502 3293 2912 3210
9 Assam 5113 5400 5632 5625 5689
10 Goa 3367 4014 2428 2732 3765
11 Pondicherry U.T. 2808 3208 2162 2196 4070
12 Div Daman N.A. N.A. N.A. N.A. N.A.
13 All India 3709 4101 3532 3619 4492

Annexure – XV
MONTHLY AVERAGE WHOLESALE PRICES OF SEMI-HUSKED COCONUT IN INDIA
Sl.No. State/Uts 1998-99 1999-2000 2000-01 2001-02 2002-03
1 Karnataka 3858 4179 3464 3573 4419
2 Tamilnadu 3002 3546 2390 2683 3163
3 Andhra Pradesh 3042 3082 2438 2727 2964
4 Orissa 4447 4686 4562 4598 4692
5 West Bengal 6267 6752 5573 5350 5372
6 Kerala N.A. N.A. N.A. N.A. N.A.
7 Maharashtra 5000 5500 6500 7000 7500
8 Gujarat 2104 2360 2662 3001 3287
9 Assam N.A. N.A. N.A. N.A. N.A.
10 Goa 3148 3815 2227 2530 3565
11 Pondicherry U.T. 3058 3315 2265 2296 4165
12 Div Daman N.A. N.A. N.A. N.A. N.A.
13 All India 3770 4137 3565 3751 4347

Annexure – XVI
MONTHLY AVERAGE WHOLESALE PRICES OF HUSKED COCONUT IN INDIA (Rs…/Nuts)
Sl.No. State/Uts 1998-99 1999-2000 2000-01 2001-02 2002-03
1 Karnataka N.A. N.A. N.A. N.A. N.A.
2 Tamilnadu 3691 3763 2647 2688 3904
3 Andhra Pradesh 3529 3473 2745 2850 3131
4 Orissa N.A. N.A. N.A. N.A. N.A.
5 West Bengal 6820 7203 7236 7508 4241
6 Kerala 3509 4723 2797 3010 3718
7 Maharashtra 5000 5500 6500 7000 7500
8 Gujarat N.A. N.A. N.A. N.A. N.A.
9 Assam N.A. N.A. N.A. N.A. N.A.
10 Goa 3126 3695 2207 2480 3586
11 Pondicherry U.T. 2650 3017 2021 1994 3865
12 Div Daman N.A. N.A. N.A. N.A. N.A.
13 All India 4046 4482 3736 3933 4278

Annexure-XVII
MONTHLY WHOLESALE PRICES OF HUSKED AND UN HUSKED IN SELECTED MARKETS (Rs…../Nuts)
Trivendrapuram Kozhikode Tanjavur Dinidgul Rajamundry Palakol Month Un husked Husked Un husked Husked Un husked Husked Un husked Husked Un husked Husked Un husked Husked
2001 – 2002 April 2675 2425 2957 2738 2750 2700 2200 2300 2400 3200 1800 2300 May 2450 2213 2943 2725 2400 2300 2050 2150 2500 3000 1800 2300 June 2650 2400 3143 2910 2015 2150 2050 2150 2400 2800 1600 1900 July 2775 2525 3186 2950 2350 2200 2000 2100 2400 2700 1800 2800
August 2940 2640 3024 2800 2565 2575 2050 2150 2500 3500 1800 2500 Sept. 3000 2750 3078 3850 2631 2600 1950 2050 2600 3200 1600 1900 Oct. 3000 2750 3119 2888 2525 2650 2050 2150 2600 3400 1300 1900 Nov. 3270 3020 3218 2980 2700 2800 2200 2300 2500 3300 1000 1600 Dec. 3875 3600 3915 3625 2885 2950 2600 2700 2500 3200 1600 2000 Jan. 3672 3400 3915 3625 3250 3000 2800 2900 2500 3300 1600 2000 Feb. 3524 3263 3780 3500 2915 2700 2300 2400 2500 3300 1500 1900
March 3294 3050 3780 3500 2560 2600 2500 2600 2500 3300 1500 1900 Average 3094 2836 3338 3174 2629 2602 2229 2329 2492 3183 1575 2083
2002 – 2003 April 3438 3188 5425 3100 2980 2600 2450 2550 2400 3200 1800 2300 May 3500 3250 5513 3150 2650 2700 2450 2550 2400 3100 1500 2000 June 3800 3550 5623 3213 2625 2750 2600 2700 2400 3100 1600 2000 July 4075 3825 5775 3300 2925 3000 2750 2850 2400 3100 1700 2100
August 4000 3750 5294 3025 2675 3000 3200 3300 2300 3000 2100 2800 Sept. 3975 3725 5163 2950 3125 3050 3300 3400 2400 3000 2100 2500 Oct. 3900 3660 5163 2950 3150 3100 3200 3300 2300 3000 2100 2500 Nov. 4650 4350 6108 3490 3000 2800 3300 3400 2300 3500 2200 2600 Dec. 4830 4550 6080 3453 3250 3200 3700 3800 2300 3500 2200 2400 Jan. 4750 4500 6213 3550 3450 3600 3700 3800 2400 3500 2300 3800

Feb. 5000 4800 6388 3650 3450 3900 3450 3550 2400 3600 3100 3900 March 5050 4840 6370 3640 3450 3650 3650 3750 2300 3400 3000 3800
Average 4247 3999 5760 3289 3061 3113 3146 3246 2358 3250 2142 2725

Annexure – XVIII
MONTHLY AVERAGE PRICE OF COCONUT (WITH HUSK) AT
THIRUVANANTHAPURAM MARKET (Rs…../Nuts)
Months 1998 1999 2000 2001 2002
January 5000 4850 5625 2750 3750
February 4780 4630 4750 2775 3750
March 3850 4980 4000 2790 3250
April 3380 5000 3250 2667 3250
May 3750 4880 3000 2450 3125
June 3550 4380 2880 2650 3250
July 3600 4500 2550 2750 3550
August 4000 4650 2750 2940 3988
September 4000 4800 2900 3000 4000
October 4750 4800 2750 3000 N.A.
November 4750 5150 2650 3213 N.A.
December 4730 5750 2500 3750 N.A.
Average 4178 4864 3300 2895 3546

Annexure – XIX
MONTHLY AVERAGE PRICE OF COCONUT (WITH HUSK) AT QUILON MARKET
(Rs…../Nuts) Months 1998 1999 2000 2001 2002
January 4750 4500 5375 3875 4950
February 4130 4750 4750 3963 4800
March 4000 5000 4125 3700 4800
April 4000 5000 3500 3440 4500
May 3750 5000 3500 3525 4490
June 3500 5000 3030 3600 4788
July 3500 5250 2900 3625 5000
August 3380 5750 3000 4187 N.A.
September 4000 5700 2880 4175 N.A.
October 4000 5850 2750 4250 N.A.
November 3880 6100 2750 4780 N.A.
December 4250 5750 3000 5225 N.A.
Average 3928 5304 3463 4029 4761

Annexure - XX
MONTHLY AVERAGE PRICE OF COCONUT (WITH OUT HUSK) AT ALAPPUZHA MARKET
(Rs…../Nuts) Months 1998 1999 2000 2001 2002
January 4260 4800 4825 2975 4000
February 3900 4675 4240 3690 3700
March 3675 4825 4360 3000 3730
April 3780 5060 4100 2835 3975
May 3725 4775 3940 2725 4500
June 3750 4800 3140 3040 5300
July 3800 4880 2900 3235 N.A.
August 3850 5350 3200 3000 N.A.
September 3925 5300 3520 2925 N.A.
October 4340 5370 3475 2988 N.A.
November 4300 5540 3320 3280 N.A.
December 4725 5240 2975 4100 N.A.
Average 4003 5051 3666 3149 4201
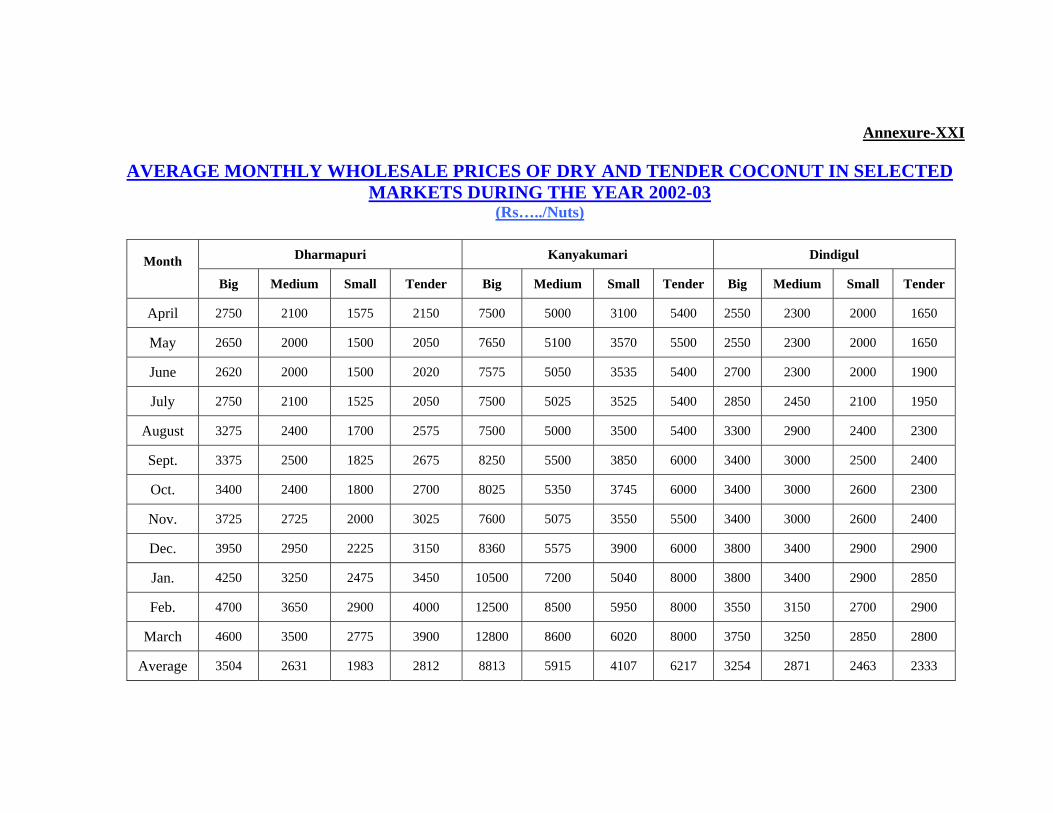
Annexure-XXI
AVERAGE MONTHLY WHOLESALE PRICES OF DRY AND TENDER COCONUT IN SELECTED MARKETS DURING THE YEAR 2002-03
(Rs…../Nuts)
Dharmapuri Kanyakumari Dindigul Month Big Medium Small Tender Big Medium Small Tender Big Medium Small Tender
April 2750 2100 1575 2150 7500 5000 3100 5400 2550 2300 2000 1650
May 2650 2000 1500 2050 7650 5100 3570 5500 2550 2300 2000 1650
June 2620 2000 1500 2020 7575 5050 3535 5400 2700 2300 2000 1900
July 2750 2100 1525 2050 7500 5025 3525 5400 2850 2450 2100 1950
August 3275 2400 1700 2575 7500 5000 3500 5400 3300 2900 2400 2300
Sept. 3375 2500 1825 2675 8250 5500 3850 6000 3400 3000 2500 2400
Oct. 3400 2400 1800 2700 8025 5350 3745 6000 3400 3000 2600 2300
Nov. 3725 2725 2000 3025 7600 5075 3550 5500 3400 3000 2600 2400
Dec. 3950 2950 2225 3150 8360 5575 3900 6000 3800 3400 2900 2900
Jan. 4250 3250 2475 3450 10500 7200 5040 8000 3800 3400 2900 2850
Feb. 4700 3650 2900 4000 12500 8500 5950 8000 3550 3150 2700 2900
March 4600 3500 2775 3900 12800 8600 6020 8000 3750 3250 2850 2800
Average 3504 2631 1983 2812 8813 5915 4107 6217 3254 2871 2463 2333

Annexure - XXII
SEASONAL INDICES OF COCONUT PRICES AT SELECTED CENTERS (Quinquennium Average 2001-05)
Month / Year Arsikere Kozhikode Kangyam
January 95.8 95.8 101.4
February 109.3 98 104.5
March 107.5 98.3 107.3
April 95.2 97.8 100.7
May 97.2 98.7 91.5
June 94 101 87.5
July 97.6 103.7 96
August 98.8 104 89.6
September 102.3 106.9 102.2
October 98.7 101.2 99.1
November 99 97.5 107.4
December 104.5 97.1 112.7
Average 100.0 100.0 100.0

Annexure- XXIII
MONTHLY AVERAGE PRICE OF COCONUT AT ARSIKKARE MARKET (Rs.per 000’ nuts)
Month / Year 2001 2002 2003 2004 2005 Average
January 2900 4000 4500 4891 5460 4350
February 4000 4200 5200 5481 5919 4960
March 4000 4300 4400 6048 5648 4879
April 3500 3700 4000 4897 5500 4319
May 2800 4000 3900 5629 5750 4416
June 3000 4000 4000 5393 4945 4268
July 3300 3800 4605 5370 5085 4432
August 3200 3750 4777 5690 5014 4486
September 3000 3750 5489 5731 5242 4642
October 3300 3800 5347 5324 4629 4480
November 3500 3900 5258 5231 4581 4494
December 4100 4500 4950 5500 4663 4743

Annexure – XXIV
MONTHLY AVERAGE PRICE OF COCONUT AT KOZHIKODE MARKET (Rs.per 000’ nuts)
Month / Year 2001 2002 2003 2004 2005 Average
January 2206 2400 3074 4277 4055 3202
February 1978 2430 3307 4798 3879 3278
March 1988 2312 3311 5165 3664 3288
April 1683 2499 3377 5155 3643 3271
May 1678 2573 3497 5250 3495 3299
June 2000 2787 3485 5078 3534 3377
July 1873 3009 3733 5332 3403 3470
August 1840 3321 3830 5291 3120 3480
September 1797 3500 3947 5416 3211 3574
October 1765 3031 4083 5121 2918 3384
November 1975 3016 4095 4824 2395 3261
December 2591 2936 4212 4146 2350 3247

Annexure – XXV
MONTHLY AVERAGE PRICES OF COCONUT AT KANGAYAM MARKET (Rs.per 000’ nuts)
Month / Year 2001 2002 2003 2004 2005 Average
January 2425 2500 4220 5000 4950 3819
February 2500 2500 4688 5000 4988 3935
March 2500 2500 4763 5625 4813 4040
April 2375 2500 4575 5390 4130 3794
May 2200 2500 4050 4550 3925 3445
June 2320 2500 4000 4325 3338 3297
July 2025 3025 4000 4080 4950 3616
August 2000 3250 4192 4575 2850 3373
September NA 3062 4600 4600 3130 3848
October 2000 3500 5063 4670 3425 3732
November 2050 3710 5438 5150 3875 4045
December 2750 4213 5438 4950 3863 4243

Annexure – XXVI
AVERAGE MONTHLY WHOLESALE AND RETAIL PRICES OF TENDER COCONUT IN
SELECTED MARKETS DURING 2002-03 (Rs.per 000' nuts)
East Godavari Kanyakumari Junagarh Thane Months Wholesale Retail Wholesale Retail Wholesale Retail Wholesale Retail
April 2200 3750 5400 6465 2850 3450 4000 8000
May 2300 3800 5500 6575 3000 3850 4000 8000
June 2200 3650 5400 6475 3050 3950 4000 8000
July 2200 3900 5400 6462 3000 3613 4000 8000
August 2200 4000 5400 6437 2800 3300 4000 8000
September 2200 3800 6000 7175 2800 3200 4000 8000
October 2300 3800 6000 7187 2750 3175 4000 8000
November 2300 3800 5500 6587 2750 3188 4000 7500
December 2200 3900 6000 7175 2500 3063 4000 7500
January 2300 4000 8000 9175 2500 3000 3500 7500
February 2300 3900 8000 7137 2550 3175 3500 7500
March 2300 3900 8000 9187 2600 3463 3500 8000
Average 2250 3850 6217 7170 2763 3369 3875 7833

Annexure – XXVII
YEARLY WHOLESALE PRICE INDEX OF COCONUT, COCONUT OIL AND COPRA (Base Year 1993-94 = 100)
Calendar Year 1997 1998 1999 2000 2001 2002 2003 2004 2005 2006
COCONUT
Index 148.3 118.2 145.9 109 94.3 121.4 146.5 155.2 138.6 126.6
COCONUT OIL
Index 146.1 131.4 143.1 108.1 95.2 111.3 148.3 175.5 162.7 138.8
COPRA
Index 149.9 129 144.2 105 85.9 119.3 157.5 185.8 172.8 142.7

Annexure - XXVIII
MONTHLY AVERAGE PRICE OF COPRA IN INTERNATIONAL MARKET
(US $ Per MT. Phil/Indo, CIF Europe)
Month / Year 1997 1998 1999 2000 2001 2002 2003 2004 2005 2006
January 506 378 471 420 205 221 311 388 645 373
February 496 371 451 411 193 232 309 415 646 393
March 489 378 451 403 182 232 291 450 710 385
April 466 380 504 353 183 244 273 500 462 372
May 428 420 530 324 189 263 276 498 445 390
June 415 414 530 395 196 289 279 471 432 387
July 399 402 449 284 223 289 279 445 420 384
August 385 403 431 279 235 290 275 440 414 404
September 403 409 421 222 210 270 274 448 338 413
October 412 439 430 210 195 274 297 447 384 411
November 412 465 436 237 203 290 335 450 384 434
December 394 474 438 228 200 301 400 427 372 486
Average 434 411 462 314 201 266 300 448 471 403

Annexure – XXIX
DOMESTIC PRICES OF COPRA IN JAVA- INDONESIA (US $ per M.T)
Month 2001 2002 2003 2004 2005
January 132 217 298 318 330
February 121 228 298 336 330
March 134 221 286 365 349
April 147 220 279 393 342
May 142 223 281 402 337
June 158 236 290 361 325
July 197 233 274 363 315
August 174 241 243 377 299
September 147 244 279 372 319
October 157 247 288 357 349
November 177 255 306 312 325
December 178 258 335 358 293
Average 155 235 288 360 326

Annexure – XXX
DOMESTIC PRICES OF COPRA IN PHILIPPINES
(US $ per M.T)
Month 2001 2002 2003 2004 2005
January 143 213 291 356 396
February 127 223 275 390 367
March 126 221 264 423 371
April 133 239 246 463 394
May 140 242 255 425 367
June 154 254 258 422 361
July 188 260 256 381 328
August 183 264 249 378 301
September 172 258 253 381 303
October 160 269 282 383 322
November 181 296 311 391 308
December 187 308 355 401 279
Average 158 254 275 400 341

Annexure – XXXI
DOMESTIC PRICES OF COPRA IN SRILANKA (US $ per M.T)
Month 2001 2002 2003 2004 2005
January 409 681 682 501 803
February 358 641 644 489 851
March 337 655 543 499 792
April 327 565 504 499 714
May 355 595 518 525 727
June 384 685 496 504 674
July 430 679 491 577 592
August 521 642 495 610 555
September 510 644 499 677 526
October 486 640 482 656 NA
November 608 645 517 761 NA
December 799 671 550 810 NA
Average 460 645 535 592 693

Annexure – XXXII
DOMESTIC PRICES OF COPRA IN INDIA
(US $ per M.T)
Month 2001 2002 2003 2004 2005
January 405 505 776 919 1089
February 437 491 816 NA 1101
March 426 465 800 897 956
April 399 519 770 879 866
May 410 529 745 910 817
June 432 587 705 983 808
July 430 624 778 982 752
August 439 637 829 1018 746
September 419 615 886 970 743
October 419 627 937 980 733
November 438 740 979 1074 718
December 546 751 954 1095 717
Average 433 591 831 973 837
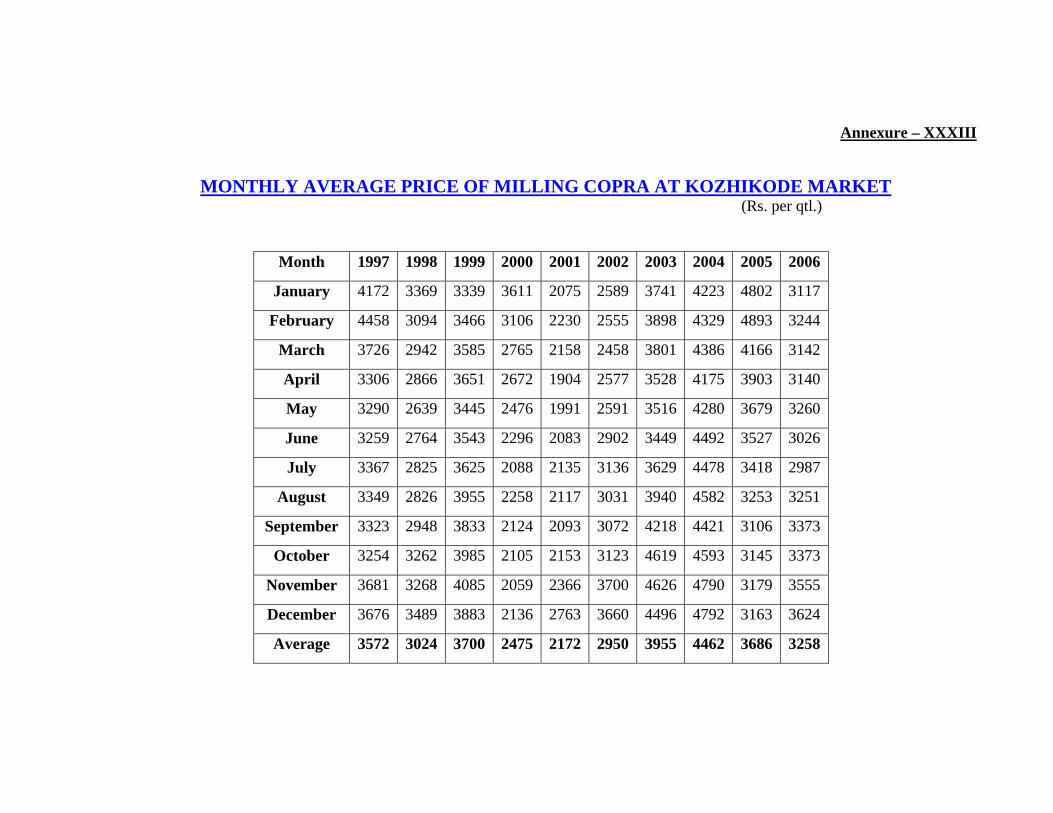
Annexure – XXXIII
MONTHLY AVERAGE PRICE OF MILLING COPRA AT KOZHIKODE MARKET (Rs. per qtl.)
Month 1997 1998 1999 2000 2001 2002 2003 2004 2005 2006
January 4172 3369 3339 3611 2075 2589 3741 4223 4802 3117
February 4458 3094 3466 3106 2230 2555 3898 4329 4893 3244
March 3726 2942 3585 2765 2158 2458 3801 4386 4166 3142
April 3306 2866 3651 2672 1904 2577 3528 4175 3903 3140
May 3290 2639 3445 2476 1991 2591 3516 4280 3679 3260
June 3259 2764 3543 2296 2083 2902 3449 4492 3527 3026
July 3367 2825 3625 2088 2135 3136 3629 4478 3418 2987
August 3349 2826 3955 2258 2117 3031 3940 4582 3253 3251
September 3323 2948 3833 2124 2093 3072 4218 4421 3106 3373
October 3254 3262 3985 2105 2153 3123 4619 4593 3145 3373
November 3681 3268 4085 2059 2366 3700 4626 4790 3179 3555
December 3676 3489 3883 2136 2763 3660 4496 4792 3163 3624
Average 3572 3024 3700 2475 2172 2950 3955 4462 3686 3258

Annexure – XXXIV
MONTHLY AVERAGE PRICE OF MILLING COPRA AT KOCHI MARKET
(Rs. per qtl.)
Month 1997 1998 1999 2000 2001 2002 2003 2004 2005 2006
January 4065 3201 3212 3240 1914 2452 3610 4151 4900 3119
February 4238 2889 3329 2836 2063 2387 3793 NT 4954 3298
March 3623 2737 3401 2576 2012 2260 3720 4050 4303 3178
April 3349 2753 3567 2493 1885 2521 3583 3971 3897 3139
May 3241 2597 3338 2378 1935 2568 3465 4112 3679 3210
June 3268 2746 3411 2277 2040 2852 3280 4442 3639 3197
July 4905 2718 3359 2081 2031 3034 3619 4437 3383 3040
August 3270 2746 3634 2171 2072 3097 3856 4600 3358 3268
September 3294 2939 3603 2066 1981 2986 4119 4382 3344 3396
October 3149 3254 3785 1900 1979 3047 4357 4427 3297 3648
November 3493 3153 3800 1994 2068 3598 4552 4851 3233 3620
December 3470 3360 3635 2009 2577 3648 4438 4948 3228 3639
Average 3614 2924 3506 2335 2046 2871 3866 4397 3768 3313

Annexure – XXXV
MONTHLY AVERAGE PRICE OF MILLING COPRA AT ALLEPPEY MARKET (Rs. per qtl.)
Month 1997 1998 1999 2000 2001 2002 2003 2004 2005 2006
January 4289 3358 3450 3746 2140 2588 3744 4070 4788 3150
February 4468 3068 3519 3142 2227 2555 3925 4143 4851 3272
March 3827 2807 3564 2838 2154 2470 3833 4253 4032 3070
April 3386 2820 3689 2732 2011 2544 3700 4111 3851 3120
May 3288 2631 3473 2608 1997 2577 3537 4267 3625 3095
June 3256 2785 3536 2335 2135 2891 3391 4608 3584 3088
July 3368 2812 3559 2168 2207 3241 3673 4577 3466 2992
August 3330 2877 3918 2274 2178 3140 3914 4705 3410 3231
September 3330 2931 4030 2271 2086 3163 4144 4497 3179 3337
October 3233 3259 4161 2194 2176 3176 4524 4697 3177 3337
November 3570 3201 4328 2175 2312 3738 4724 4875 3183 3656
December 3640 3475 4092 2225 2728 3745 4457 4893 3187 3680
Average 3582 3002 3777 2559 2196 2986 3964 4475 3694 3252

Annexure – XXXVI
MONTHLY AVERAGE PRICE OF MILLING COPRA AT KANGHYAM MARKET (Rs. per qtl.)
Month / Year 1997 1998 1999 2000 2001 2002 2003 2004 2005 2006
January 3900 3246 3290 N.A 2250 2625 3650 4347 4788 3025
February 4500 2945 3350 3300 2125 2600 3825 4233 4725 3238
March 3800 2825 3438 2780 2125 2600 3759 4375 4225 3210
April 3550 2790 3475 2550 1919 2553 3759 4136 3700 3125
May 3656 2650 3513 2275 1695 2572 3454 4140 3263 3113
June 3538 2638 3475 2230 1756 2831 3525 4415 3050 2840
July 3474 2700 3435 3613 1663 2941 3734 4379 3190 NA
August 3455 2725 3650 2075 2000 2975 3837 4438 3213 2838
September 3200 2800 3675 2180 N.A 2975 4200 4426 3150 3060
October 3350 3060 3820 2225 1851 2988 4480 4421 3150 3463
November 3475 3175 4093 2213 2694 2915 4499 4496 2938 3463
December 3468 3288 3970 2155 2563 3581 4419 4572 3175 3400
Average 3614 2904 3599 2509 2058 2846 3928 4365 3471 3161

Annexure – XXXVII
MONTHLY AVERAGE PRICE OF MILLING COPRA AT MANGLORE MARKET (Rs. per qtl.)
Month / Year 1997 1998 1999 2000 2001 2002 2003 2004 2005 2006
January NA 3650 3266 3853 2110 2598 3759 4719 5120 3275
February NA 3289 3369 3560 2089 2552 3809 4525 5150 3476
March NA 3241 3365 3000 1978 2601 3690 4657 5000 3600
April NA 3250 3539 2900 1751 2610 3685 4501 5401 NA
May NA 3000 3546 3050 1807 2550 3670 4750 5250 NA
June NA 3000 3430 2280 1996 2550 3660 4828 4350 NA
July NA 2736 3478 2200 1900 3000 3525 4480 3500 NA
August 3000 2550 3600 2020 1850 3000 3714 4451 3400 NA
September 3250 2736 3620 2363 2004 3096 3500 4465 3100 NA
October NA 3165 3680 1820 2011 3262 4511 4701 3200 NA
November NA 3112 4006 2048 2352 3818 4602 4576 3100 NA
December 3900 3266 3881 2201 2529 3660 4510 4800 3450 NA
Average 3383 3083 3565 2608 2031 2941 3886 4621 4168 3450

Annexure – XXXVIII
MONTHLY AVERAGE PRICE OF MILLING COPRA AT ALAPUZHA MARKET (Rs. per qtl.)
Month / Year 1997 1998 1999 2000 2001 2002 2003 2004 2005 2006
January 4400 3358 3450 3746 2131 2586 NA 4070 4788 3103
February 4260 3068 3519 3142 2227 2557 NA 4143 4851 3273
March 3430 2807 3564 2838 2155 2466 NA 4253 4032 3070
April 3500 2820 3689 2732 2004 2587 3575 4111 3851 NA
May 3120 2631 3473 2608 1998 2678 3450 4267 3625 NA
June 3550 2788 3526 2335 2137 3009 3403 4608 3584 NA
July 3350 2812 3559 2168 2031 3240 3673 4577 3466 NA
August 3280 2878 3918 2274 2156 3180 3914 4705 3410 NA
September 3300 2931 4030 2275 2085 3167 4144 4497 3179 NA
October 3420 3259 4161 2194 2171 3219 4524 4697 3177 NA
November 3980 3201 4328 2175 2312 3803 4724 4815 3183 NA
December 3900 3475 4093 2225 2728 3745 4420 4855 3187 NA
Average 3624 3002 3776 2559 2178 3020 3981 4467 3694 3149
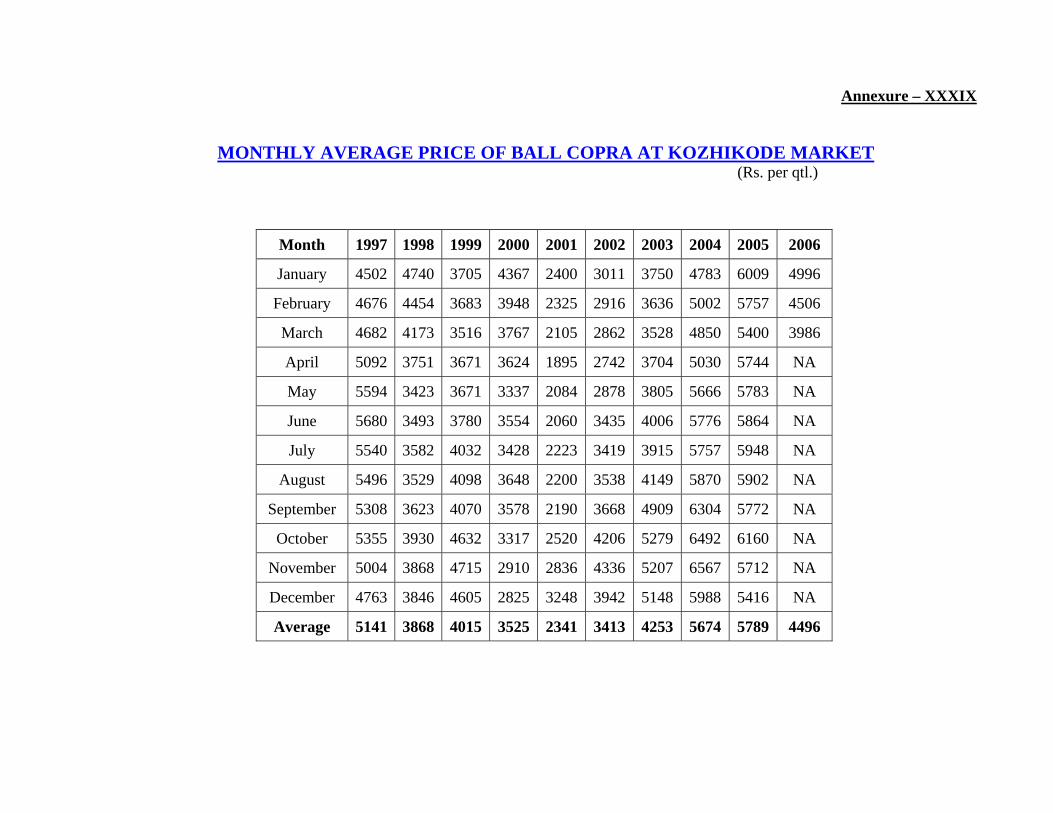
Annexure – XXXIX
MONTHLY AVERAGE PRICE OF BALL COPRA AT KOZHIKODE MARKET (Rs. per qtl.)
Month 1997 1998 1999 2000 2001 2002 2003 2004 2005 2006
January 4502 4740 3705 4367 2400 3011 3750 4783 6009 4996
February 4676 4454 3683 3948 2325 2916 3636 5002 5757 4506
March 4682 4173 3516 3767 2105 2862 3528 4850 5400 3986
April 5092 3751 3671 3624 1895 2742 3704 5030 5744 NA
May 5594 3423 3671 3337 2084 2878 3805 5666 5783 NA
June 5680 3493 3780 3554 2060 3435 4006 5776 5864 NA
July 5540 3582 4032 3428 2223 3419 3915 5757 5948 NA
August 5496 3529 4098 3648 2200 3538 4149 5870 5902 NA
September 5308 3623 4070 3578 2190 3668 4909 6304 5772 NA
October 5355 3930 4632 3317 2520 4206 5279 6492 6160 NA
November 5004 3868 4715 2910 2836 4336 5207 6567 5712 NA
December 4763 3846 4605 2825 3248 3942 5148 5988 5416 NA
Average 5141 3868 4015 3525 2341 3413 4253 5674 5789 4496

Annexure – XL
MONTHLY AVERAGE PRICE OF BALL COPRA AT TIPTUR MARKET (Rs. per qtl.)
Month / Year 1997 1998 1999 2000 2001 2002 2003 2004 2005 2006
January 4300 5000 4000 4300 3100 3200 4100 5700 7390 7164
February 4300 5000 3950 4200 3200 3000 4000 5800 7249 6739
March 4550 5500 4100 3900 1700 3100 3800 5700 6977 5835
April 4700 5200 4000 3800 2400 2800 3900 5500 6987 5308
May 5100 5500 4300 3700 2200 3000 3700 6300 7034 4733
June 5300 5300 3800 3600 2300 3800 3900 6200 6921 4536
July 5000 4800 3800 3600 1400 3700 4035 6000 7072 4541
August 5100 4200 3750 3600 2200 3600 4460 6025 7405 4538
September 5000 3800 3600 3600 2200 3600 4980 7100 7506 4719
October 5300 4000 3600 3550 2300 4400 5275 7275 7485 4645
November 5400 4000 3600 3500 2700 4400 5315 7416 7539 4090
December 5000 3800 3650 3500 3200 4400 5595 7500 7292 4091
Average 4921 4675 3846 3738 2408 3583 4422 6376 7238 5078

Annexure - XLI
MONTHLY AVERAGE PRICE OF BALL COPRA AT ARISEKERE MARKET (Rs. per qtl.)
Month / Year 1997 1998 1999 2000 2001 2002 2003 2004 2005 2006
January 4740 5550 4250 4200 3000 3050 3950 5100 7760 7503
February 5100 5000 4000 4100 3010 3200 3800 5350 7846 7081
March 4200 5000 4100 3800 2770 3550 3750 5500 7111 6139
April 4600 NA 3850 4000 2350 2850 3800 5594 7709 NA
May 5000 4450 3750 3700 2100 3400 3600 6156 7455 NA
June 5050 4200 3650 3600 2050 3600 3750 6343 7253 NA
July 5300 4150 3550 3600 2300 3600 3500 6165 7624 NA
August 5500 3875 3650 3650 2050 3550 4500 6536 7810 NA
September 5400 3253 3575 3600 2100 3700 4800 7440 8023 NA
October 5020 7515 4300 3400 2500 3900 5000 7835 8001 NA
November 5100 3250 4500 3400 2850 4100 5200 7961 7965 NA
December 5300 5888 4500 3250 3250 4000 5300 7891 7796 NA
Average 5026 4739 3973 3692 2528 3542 4246 6489 7696 6908

Annexure – XLII
MONTHLY AVERAGE PRICE OF EDIBLE GRADE COPRA (DILPASS GRADE) AT KOZHIKODE MARKET
(Rs. per qtl.)
Month 1997 1998 1999 2000 2001 2002 2003 2004 2005 2006
January 4317 3611 3564 3888 3048 2776 4239 4386 4946 3315
February 4626 3282 3604 3335 2393 2734 3971 4489 5013 3373
March 3930 3078 3722 2988 2287 2595 3925 4555 4363 NA
April 3633 3066 3880 2818 2058 2720 3761 4363 4118 NA
May 3813 2950 3786 2755 2133 2771 3662 4461 3881 NA
June 3760 3104 3824 2648 2238 3102 3592 4640 3758 NA
July 3782 3200 3857 2393 2296 3296 3745 4627 3617 NA
August 3694 3202 4112 2462 2301 3183 4061 4713 3500 NA
September 3546 3218 4028 2286 2205 3217 4385 4549 3330 NA
October 3482 3514 4178 2328 2221 3254 4828 4717 3301 NA
November 3898 3446 4273 2325 2537 3829 4839 5034 3322 NA
December 3921 3644 4104 2350 2996 3810 4675 4933 3315 NA
Average 3867 3276 3911 2715 2393 3107 4140 4622 3872 3344

Annexure – XLIII
MONTHLY AVERAGE PRICE OF EDIBLE GRADE COPRA (RAJPUR GRADE) AT KOZHIKODE MARKET
(Rs. per qtl.)
Month 1997 1998 1999 2000 2001 2002 2003 2004 2005 2006
January 4800 4806 3907 4610 2454 3245 4238 5322 6574 4880
February 4875 4435 3822 4131 2422 3171 4076 5495 6352 4528
March 4883 4231 3718 3902 2207 3073 3928 5292 5957 NA
April 5181 3888 3830 3796 1987 3011 4094 5495 6219 NA
May 5928 3615 3909 3501 2192 3163 4211 6161 6224 NA
June 5949 3701 4022 3766 2178 3779 4063 6269 6295 NA
July 5844 3818 4294 3730 2369 3860 4352 6353 6384 NA
August 5790 3785 4351 3898 2366 4251 4639 6430 6355 NA
September 5611 3925 4295 3813 2347 4148 5442 6992 6238 NA
October 5698 4192 5039 3516 2705 4691 5854 7313 6796 NA
November 5378 4089 4905 3242 3118 4809 5820 7469 6090 NA
December 5098 4122 4916 2941 3528 4405 5755 6724 5860 NA
Average 5420 4051 4251 3737 2489 3795 4706 6276 6279 4704
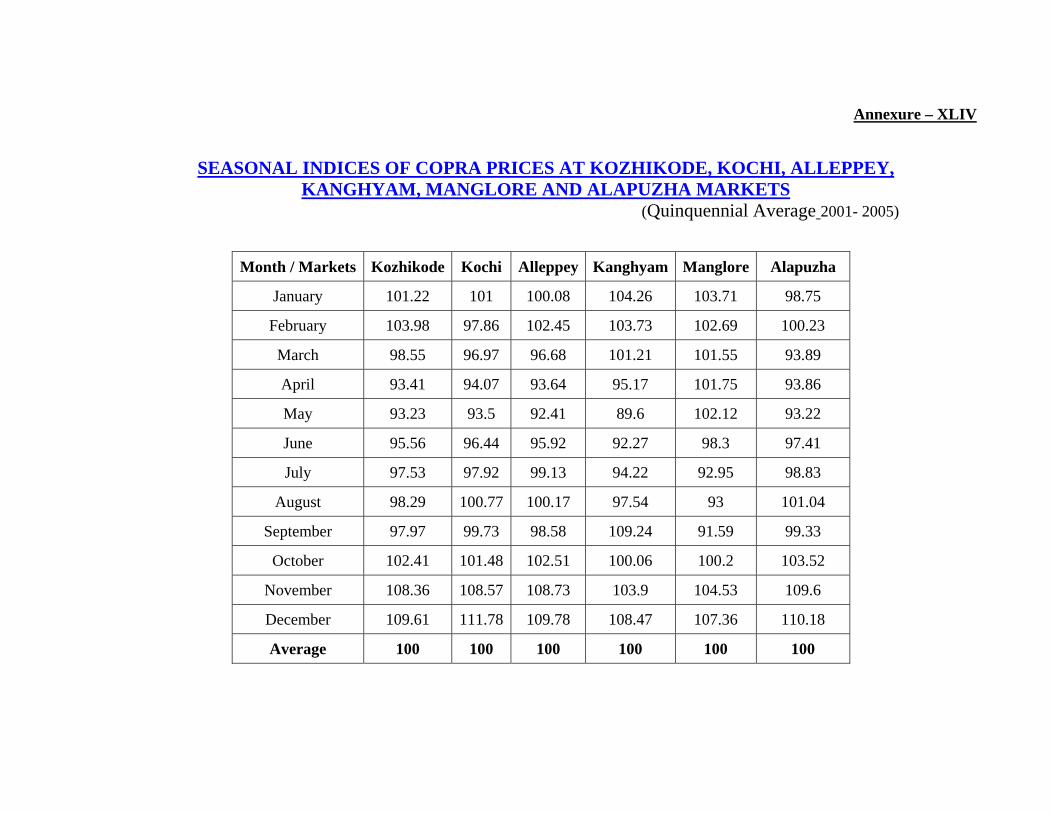
Annexure – XLIV
SEASONAL INDICES OF COPRA PRICES AT KOZHIKODE, KOCHI, ALLEPPEY, KANGHYAM, MANGLORE AND ALAPUZHA MARKETS
(Quinquennial Average 2001- 2005)
Month / Markets Kozhikode Kochi Alleppey Kanghyam Manglore Alapuzha
January 101.22 101 100.08 104.26 103.71 98.75
February 103.98 97.86 102.45 103.73 102.69 100.23
March 98.55 96.97 96.68 101.21 101.55 93.89
April 93.41 94.07 93.64 95.17 101.75 93.86
May 93.23 93.5 92.41 89.6 102.12 93.22
June 95.56 96.44 95.92 92.27 98.3 97.41
July 97.53 97.92 99.13 94.22 92.95 98.83
August 98.29 100.77 100.17 97.54 93 101.04
September 97.97 99.73 98.58 109.24 91.59 99.33
October 102.41 101.48 102.51 100.06 100.2 103.52
November 108.36 108.57 108.73 103.9 104.53 109.6
December 109.61 111.78 109.78 108.47 107.36 110.18
Average 100 100 100 100 100 100

Annexure - XLV
MONTHLY WHOLESALE PRICE INDEX OF COPRA
(Base Year 1993-94 = 100)
Month /
Year January February March April May Jun July August September October November December
1997 173.1 173.7 152.6 138.7 141.3 141.2 146 143.4 144.1 139.9 151.7 153.5
1998 147.2 136.7 127.1 126.4 118.4 122.1 120.4 120.2 122.7 135 132.4 139.6
1999 136.1 139.1 140.8 144.5 139.3 138.1 138.6 145.6 147 155.6 151.6 154.2
2000 144.8 124 115 110.9 106.5 99 93.4 96.6 94.1 91.3 91.4 92.7
2001 87.8 90.7 87.3 79.3 77.3 81.9 82.6 81.5 81 82.8 89.6 108.7
2002 104.4 103.7 101.9 105 105 116.9 128.1 124.1 123.7 128.1 143.8 147.3
2003 146.3 150.6 147.2 144.3 138.1 134.7 143.4 156.1 174.8 182.6 190.8 181.5
2004 170.6 169.8 173.3 170.6 174.2 187.8 185.5 191.8 188.7 199.4 207.8 210.6
2006 152.2 154.7 143.6 139.6 136.7 135.7 133.2 140.3 142.6 147.3 144 143.1

Annexure – XLVI
INTERNATIONAL VEGETABLE OIL PRICES (US $ per M.T)
Year Soyabean Cottonseed Sunseed Peanut Palm Canola Coconut Corn
Begin U.S. Brz Arg Rott U.S. Rott U.S. Rott U.S. Rott Malay Rott Rott U.S
1-Oct 1 2 3 4 5 6 7 8 9 10 11 12 13 14
1996/97 496 515 564 588 564 588 499 545 963 959 526 539 693 530
1997/98 569 608 614 633 636 693 595 730 1080 964 601 637 625 638
1998/99 438 452 453 483 602 632 444 560 876 801 486 482 748 558
1999/00 344 328 332 356 474 496 363 413 780 744 309 359 539 393
2000/01 311 295 295 336 352 428 350 428 768 685 235 372 323 299
2001/02 363 376 376 412 396 445 513 587 716 659 329 451 388 422
2002/03 486 489 491 534 832 883 731 592 1024 1139 421 588 449 621
2003/04 661 567 542 633 688 752 738 663 1317 1178 481 670 630 625
2004/05 507 466 471 545 609 649 962 703 1711 1102 392 660 636 614
2005/06 516 474 467 573 649 669 832 635 981 931 416 770 583 555
2006/07 604 605 607 680 670 692 NA 709 1105 1143 532 810 702 599

Annexure – XLVII
INTERNATIONAL PRICE OF COCONUT OIL
(Us $ Per MT, Cif Rotterdam)
MONTH 1997 1998 1999 2000 2001 2002 2003 2004 2005 2006
January 768 558 763 654 319 362 494 573 645 569
February 768 559 745 591 285 376 477 642 646 591
March 737 578 700 552 289 366 441 685 710 575
April 710 618 827 550 293 411 421 736 679 578
May 654 723 874 481 295 240 440 749 648 583
June 637 652 796 437 317 446 459 658 639 575
July 597 667 656 400 358 445 439 669 606 583
August 567 667 684 371 363 443 421 627 553 606
September 615 652 704 332 323 410 431 657 521 609
October 627 695 690 340 307 343 487 642 577 626
November 616 752 703 367 330 457 515 659 659 656
December 586 774 715 329 330 482 583 652 657 732
Average. 657 658 738 450 317 398 467 662 628 607

Annexure –XLVIII
INTERNATIONAL PRICE OF SELECTED VEGETABLE OILS (Price : US $ Per MT)
Sl. No.
Year
Soyabean oil Dutch Fob
Palm Oil Phil / Indo, Cif Rott
Sunflower Oil Cif Europe
Palm Kernel Oil Cif Europe
Coconut Oil Cif Europe
1. 1992-93 432 400 585 519 513 2. 1993-94 518 373 642 462 483 3. 1994-95 634 597 675 639 623 4. 1995-96 596 592 566 687 693 5. 1996-97 548 542 628 738 760 6. 1997-98 591 566 687 616 609 7. 1998-99 590 649 479 712 701 8. 1999-00 395 382 388 666 704 9. 2000-01 325 287 524 367 375 10. 2001-02 369 306 524 316 336 11. 2002-03 493 418 597 445 446 12. 2003-04 600 463 623 495 508 13. 2004-05 545 392 703 416 636
Source : APCC Year Book, 2002

Annexure –XLIX
DOMESTIC PRICES OF COCONUT OIL IN INDIA (Rs.per qtl.)
MONTH 1997 1998 1999 2000 2001 2002 2003 2004 2005 2006
January 6139 4816 4978 4965 2831 3706 5451 6306 7280 4536
February 6410 4350 5174 4287 3079 3604 5709 NT 7198 4965
March 5428 4090 5292 3832 3013 3398 5543 6193 6199 4753
April 5031 4164 5565 3691 2848 3801 5361 5985 5763 4735
May 4844 3869 5188 3360 2963 3874 5177 6219 5394 4851
June 5018 4102 5319 3226 3118 4323 5037 6736 5539 4853
July 5016 4050 5223 3016 3110 4607 5536 6740 5212 4566
August 4957 4140 5647 3176 3169 4716 5886 7009 5154 4810
September 4951 4433 5589 2997 3020 4554 6286 6680 5125 5073
October 4742 4886 5883 2867 3018 4637 6664 6753 4862 5510
November 5308 4725 5888 2964 3153 5476 6950 7077 4864 5462
December 5261 5215 5600 2981 3911 5525 6754 7224 4765 5474
Average 5259 4403 5446 3447 3103 4352 5863 6629 5613 4966

Annexure – L
MONTHLY AVERAGE PRICE OF COCONUT OIL AT KOCHI MARKET (Rs.per qtl.)
MONTH/YEAR 1997 1998 1999 2000 2001 2002 2003 2004 2005 2006
January 6139 4816 4978 4965 2831 3706 5451 6306 7280 4536
February 6410 4350 5174 4287 3079 3604 5709 NT 7198 4965
March 5428 4090 5292 3832 3013 3398 5543 6193 6199 4753
April 5031 4164 5565 3691 2848 3801 5361 5985 5763 4735
May 4844 3869 5188 3360 2963 3874 5177 6219 5394 4851
June 5018 4102 5319 3226 3118 4323 5037 6736 5539 4853
July 5016 4050 5223 3016 3110 4607 5536 6740 5212 4566
August 4957 4140 5647 3176 3169 4716 5886 7009 5154 4810
September 4951 4433 5589 2997 3020 4554 6286 6680 5125 5073
October 4742 4886 5883 2867 3018 4637 6664 6753 4862 5510
November 5308 4725 5888 2964 3153 5476 6950 7077 4864 5462
December 5261 5215 5600 2981 3911 5525 6754 7224 4765 5474
Average 5259 4403 5446 3447 3103 4352 5863 6629 5613 4966

Annexure – LI
MONTHLY AVERAGE PRICE OF COCONUT OIL AT ALEPPEY MARKET
(Rs.per qtl.)
MONTH/YEAR 1997 1998 1999 2000 2001 2002 2003 2004 2005 2006
January 5962 4886 4947 4963 2830 3710 5450 6347 7285 4544
February 6393 4450 5144 4313 3104 3605 5691 6203 7207 4952
March 5520 4094 5326 3820 3016 3418 5579 6160 6188 4763
April 5034 4177 5577 3668 2886 3693 5355 5997 5778 4729
May 4840 3867 5178 3356 2975 3721 5204 6190 5438 4839
June 5054 4091 5317 3229 3122 4166 4995 6733 5557 4883
July 4837 4035 5212 2999 3086 4612 5527 6733 5208 4558
August 4957 4150 5625 3188 3177 4709 5864 7004 5158 4823
September 4926 4373 5597 2985 3019 4562 6271 6699 5131 5096
October 4714 4900 5886 2843 3017 4597 6668 6750 4855 5096
November 5317 4773 5895 2956 3137 5455 6950 7056 4871 5533
December 5232 5236 5631 2980 3908 5545 6749 7210 4794 5483
Average 5232 4419 5445 3442 3106 4316 5859 6590 5623 4942

Annexure- LII
MONTHLY AVERAGE PRICE OF COCONUT OIL AT KOZHIKODE MARKET (Rs.per qtl.)
MONTH/YEAR 1997 1998 1999 2000 2001 2002 2003 2004 2005 2006
January 6425 5030 5065 5466 3090 3909 5562 6352 7184 4703
February 6714 4592 5276 4698 3287 3787 5833 6448 7342 4,885
March 5569 4394 5394 4164 3277 3651 5739 6359 6323 4730
April 5027 4324 5614 3951 3020 3903 5464 6241 6113 4749
May 4874 3974 5300 3754 3023 3944 5259 6477 5568 4709
June 5249 4230 5425 3612 3240 4434 5181 6838 5546 4836
July 5242 4323 5504 3291 3313 4854 5936 6793 5296 4657
August 5089 4340 5989 3394 3406 4763 5933 7040 5154 5151
September 5000 4495 5784 3201 3247 4690 6250 6633 4907 5197
October 4857 5013 5904 3084 3231 4604 6874 6923 4772 5197
November 5436 4926 5978 3149 3498 5535 6945 7196 4780 5482
December 5453 5374 5820 3139 4151 5512 6689 7158 4756 5474
Average 5411 4585 5588 3742 3315 4466 5975 6705 5976 4981

Annexure- LIII
MONTHLY AVERAGE PRICE OF COCONUT OIL AT KANGAYAM MARKET
(Rs.per qtl.)
MONTH/YEAR 1997 1998 1999 2000 2001 2002 2003 2004 2005 2006
January 6933 5033 5733 6417 3133 3867 5667 6427 7250 4692
February 7333 4559 5967 5550 3133 3867 5734 6333 7768 5017
March 6408 4267 6100 5306 3133 4053 5900 6450 7400 5013
April 5667 4292 6100 4133 3333 4000 5467 6220 6907 5000
May 5934 4000 6267 4000 3433 4000 5467 6350 6383 5042
June 6067 4167 6267 3794 3533 4000 5333 6592 5650 5387
July 6067 4747 6160 4000 3533 4608 5417 6640 5227 NA
August 5947 5233 6283 3901 3559 4800 5734 6700 4967 5284
September 6381 5333 6533 3587 3600 4830 6000 6684 5433 5507
October 5871 5333 6334 3200 3684 4800 6400 6567 4798 5734
November 5784 5066 7050 3634 3613 4880 6600 6649 4667 5867
December 5717 5499 7200 3120 4017 5358 6533 6733 4625 5906
Average 6176 4794 6333 4220 3475 4422 5854 6529 5923 5314

Annexure- LIV
MONTHLY WHOLESALE PRICE INDEX OF COCONUT OIL
Year Jan Feb Mar Apr May Jun Jul Aug Sep Oct Nov Dec
1997 157.9 162 155.9 147.9 146.7 137.8 139.9 135.6 139.1 136.5 144.2 149.9
1998 145.3 134.3 132.4 128.2 124.8 125.7 126.7 128.8 130 134.4 131.9 134.3
1999 133.7 136.6 138.2 143.4 141.4 140.8 138.4 143.3 143.6 151.2 154 152.1
2000 148.9 131.8 121.7 116.1 102.9 98.4 95.6 94.4 94.7 97.1 98.1 97.7
2001 95.7 96.6 97.3 93.6 93.7 92.7 94.4 94.6 94 93.3 92.3 104
2002 101.1 94.9 92 100.8 103.9 109.1 115.5 115.4 114.5 114.7 132.1 141.6
2003 138.9 137.4 135.1 133.8 135.6 137.2 141.9 148.2 162.8 166.2 170.5 172.1
2004 168.2 166.3 171.1 172.4 174.6 176.1 179.5 181.2 178.2 175.6 179.7 182.8
2005 183.6 185 177.2 170.8 163.6 166.3 161.1 158 155.3 150.6 144.5 136.4
2006 132.2 135.9 133.2 131.8 134.6 138.2 134.1 137.2 140.8 147.6 149.6 150.8
2007 149.1 147 139.6 138.8 140.4 137.8 140.2 140.6 N.A N.A. N.A. N.A.

Annexure - LV
YEARLY WHOLESALE PRICE INDEX COCONUT OIL
Calendar Year 1997 1998 1999 2000 2001 2002 2003 2004 2005 2006
Index 146.1 131.4 143.1 108.1 95.2 111.3 148.3 175.5 162.7 138.8
Annexure – LVI
SEASONAL INDICES OF COCONUT OIL PRICES AT SELECTED CENTRES
Kochi Aleppey Kozhikode Kangayam
January 89.46 99.12 99.11 98.54
February 96.99 101.07 101.64 101.13
March 95.78 95.69 96.79 101.43
April 93.79 93.44 94.9 98.2
May 93.73 93.21 93.26 97.4
June 97.44 96.77 96.79 96.82
July 97.99 97.66 98.93 96.86
August 101.19 100.99 101.19 98.56
September 101.17 101.13 99.51 101.76
October 103.50 101.8 101.7 101.53
November 108.56 108.42 107.6 101.01
December 110.77 110.69 108.5 105.32
Average 100 100 100 100

Annexure- LVII
SEASONAL VARIATIONS OF COCONUT OIL PRICES
(Rs.per qtl.)
Kochi Market
AleppeyMarket
Kozhikode Market
Kangayam Market
Indian average
Percentile diff.
January 5018 5028 5133 5173 5018 100
February 4911 5127 5264 5309 4911 98
March 4850 4854 5013 5325 4850 99
April 4749 4740 4915 5155 4749 98
May 4746 4728 4830 5113 4746 100
June 4934 4909 5013 5083 4934 104
July 4962 4954 5124 5085 4962 101
August 5124 5123 5241 5174 5124 103
September 5123 5130 5154 5342 5123 100
October 5241 5164 5267 5330 5241 102
November 5497 5500 5573 5379 5497 105
December 5609 5615 5623 5529 5609 102

Annexure – LVIII
INTERNATIONAL: MONTHLY PRICES OF COPRA MEAL (US $ per MT, Phil/Indo. CIF Hamberg)
MONTH 1997 1998 1999 2000 2001 2002 2003 2004 2005 2006
January 157 112 115 100 97 102 92 84 103 NA
February 150 109 111 96 94 108 119 87 91 NA
March 138 105 110 92 84 100 114 94 96 NA
April 140 98 111 86 84 105 106 98 96 84
May 132 98 NA 86 94 107 103 96 86 93
June 121 101 NA 85 96 107 NA 83 80 NA
July 112 101 NA 79 95 105 NA 92 80 NA
August 110 92 101 78 99 105 NA 84 72 NA
September 116 NA 104 82 101 104 NA 80 67 NA
October 117 NA NA 84 98 112 NA 80 NA NA
November 117 112 100 86 93 114 NA 74 NA 130
December 118 117 NA 94 93 111 NA 73 NA NA
Average. 127 105 107 87 94 107 107 85 86 102
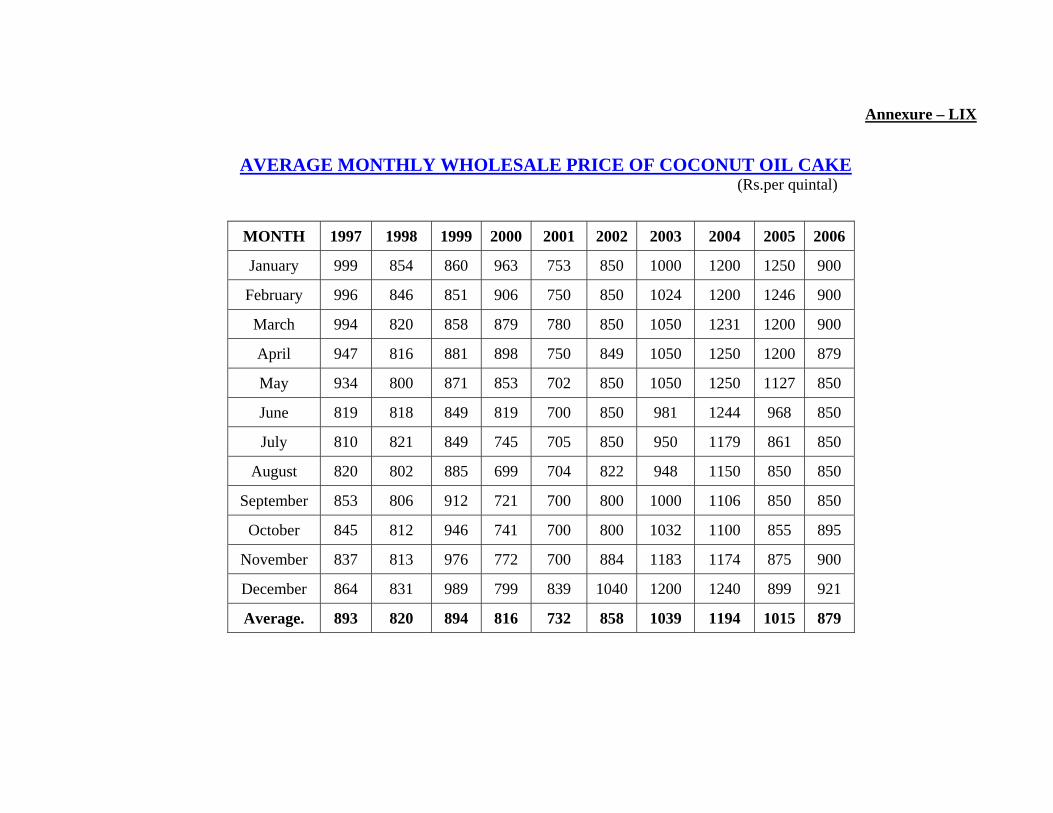
Annexure – LIX
AVERAGE MONTHLY WHOLESALE PRICE OF COCONUT OIL CAKE (Rs.per quintal)
MONTH 1997 1998 1999 2000 2001 2002 2003 2004 2005 2006
January 999 854 860 963 753 850 1000 1200 1250 900
February 996 846 851 906 750 850 1024 1200 1246 900
March 994 820 858 879 780 850 1050 1231 1200 900
April 947 816 881 898 750 849 1050 1250 1200 879
May 934 800 871 853 702 850 1050 1250 1127 850
June 819 818 849 819 700 850 981 1244 968 850
July 810 821 849 745 705 850 950 1179 861 850
August 820 802 885 699 704 822 948 1150 850 850
September 853 806 912 721 700 800 1000 1106 850 850
October 845 812 946 741 700 800 1032 1100 855 895
November 837 813 976 772 700 884 1183 1174 875 900
December 864 831 989 799 839 1040 1200 1240 899 921
Average. 893 820 894 816 732 858 1039 1194 1015 879

Annexure – LX
MONTHLY AVERAGE PRICE OF COCONUT OIL CAKE AT KOCHI MARKET (Rs.per quintal)
MONTH 1997 1998 1999 2000 2001 2002 2003 2004 2005 2006
January NA 814 810 950 750 850 NA 1200 1250 900
February NA 800 810 936 750 850 1017 NT 1243 900
March NA 814 812 903 750 850 NA 1231 NA 900
April NA 826 830 901 738 850 1050 1250 NA 879
May NA 810 818 882 662 850 NA 1250 1119 854
June NA 796 810 846 700 850 NA 1241 964 850
July NA 800 821 751 700 850 950 1177 858 850
August NA 775 856 750 654 800 NA NA 850 850
September NA 750 860 750 700 800 1001 1104 850 850
October NA 761 897 750 700 800 1028 1173 854 NA
November NA 775 929 713 702 875 1186 875 874 897
December 797 789 950 747 841 NA NA 1241 900 924
Average. 797 793 850 823 721 839 1039 1174 976 878

Annexure – LXI
MONTHLY AVERAGE PRICE OF COCONUT OIL CAKE AT ALAPPUZHA MARKET (Rs.per quintal)
MONTH 1997 1998 1999 2000 2001 2002 2003 2004 2005 2006
January NA 900 895 990 900 1000 NA 1200 1217 944
February NA 900 936 950 900 1000 1050 1200 1250 950
March NA 884 1000 950 900 1000 NA 1200 NA 948
April NA 850 1000 950 900 1000 1050 1200 NA 940
May NA 850 1000 941 900 900 NA 1200 1200 950
June NA 833 1000 900 900 900 NA 1200 1080 950
July NA 850 935 771 850 900 952 1190 970 912
August NA 850 900 750 855 NA NA NA 950 900
September NA 850 900 750 850 900 1036 1113 950 900
October NA 850 915 750 813 900 1050 NA 950 NA
November NA 850 1000 756 802 857 1189 1195 950 946
December 921 860 1000 832 939 NA NA 1200 947 1100
Average. 921 861 957 858 876 936 1055 1190 1046 949

Annexure – LXII
MONTHLY AVERAGE PRICE OF COCONUT OIL CAKE AT KOZHIKODE MARKET (Rs.per quintal)
MONTH 1997 1998 1999 2000 2001 2002 2003 2004 2005 2006
January NA 825 895 1000 675 871 NA 1837 1241 950
February NA 875 864 921 675 854 1084 1240 1256 950
March NA 900 850 875 696 875 NA 1246 NA 950
April NA 818 884 750 697 771 1114 1217 NA 928
May NA 784 888 714 718 750 NA 1176 958 838
June NA 810 830 764 715 850 NA 1222 950 848
July NA 822 819 715 677 750 1047 1140 941 813
August NA 743 911 650 655 750 NA NA 853 779
September NA 779 932 700 650 NA 1020 1101 840 930
October NA 819 1013 620 670 871 1175 NA 959 NA
November NA 819 1084 621 791 1010 1182 1278 985 1032
December 893 852 1064 675 854 NA NA 1310 953 1157
Average. 893 821 920 750 706 835 1104 1277 994 925

Annexure - LXIII
SEASONAL INDICES OF COCONUT OIL CAKE PRICES AT SELECTED CENTRES (for the Quinquennium 2001-2005)
Month Kochi Alappuzha Kozhikode Average
January 110.46 107.04 120.54 100
February 105.23 107.14 109.7 100
March 102.94 102.48 97.91 100
April 106.00 102.98 99.06 100
May 105.98 104.17 93.85 100
June 83.32 101.19 97.39 100
July 98.91 96.43 95 100
August 83.75 89.58 78.52 100
September 97.16 96.23 94.16 100
October 99.34 92.06 95.83 100
November 98.36 99.1 109.38 100
December 108.40 102.08 108.34 100

Annexure – LXIV
AVERAGE PRICE SPREAD OF COCONUT TRADING IN ORISSA
(Rs. Per ‘000’ nuts) Particulars share/cost/margin/ Price Regulated market Un-regulated market.
Producers net share in consumers rupee
2145.67 (53.64)
2063.33 (51.55)
Expenses of Village Merchant itinerant
33.83 (0.85)
22.50 (0.56)
Expenses of Wholesaler-I 294.90 (7.37)
324.20 (8.10)
Expenses of Wholesaler-II 212.57 (5.31)
202.57 (5.06)
Expenses of retailer 175.93 (4.40)
167.83 (4.19)
Total Marketing Cost. 717.23 (17.93)
717.10 (17.91)
Margin of Village merchant 53.93 (1.35)
49.50 (1.24)
Margin of Wholesaler-I 311.90 (7.80)
401.17 (10.02)
Margin of Wholesaler-II 225.80 (5.64)
225.60 (5.64)
Margin of retailer 545.47 (13.64)
546.00 (13.64)
Total Marketing Margin 1137.10 (28.43)
1222.27 (30.54)
Consumer Price 4000.00 (100.00)
4002.67 (100.00)

Annexure – LXV
COCONUT YIELD PER ANNUM IN INDIA
Sl. No. Name of State Per Palm
Per Annum Per Hector Per Annum
Yield for Hybrid Palm per H.P.A.
1 Tamil Nadu 55 – 200 9625 – 22750
2 Pondichery 100 - 17500
3 Kerala 60 – 100 5000 – 9000
4 Andhra Pradesh 80 – 100 7500 – 12000 19000
5 Karnataka 35 – 40 - 6000
6 Gujarat 75 – 200 5000 – 12000 12000 – 30000
7 Due 40 – 60 -
8 Daman 30 – 75 -
9 Assam 75 – 78 6500 – 7500
10 West Bengal -- - 5580
11 Orissa - 40 -
12 Maharashtra 55 – 100 6500 – 7300
13 Goa - 29 - 5000 125 Million Nut
14 30 – 200 5000 – 22750

Annexure - LXVI
STATE LEVEL INFORMATION (CULTIVATION)
Name of State Sl. No.
Tamil Nadu
(1) Pondichery
(2) Kerala
(3) 1. Variety – Type grown
Tall – Dwari – Hybrid COD/WCT Chandra Shankara ECT/DG (UH-C-1) ECT/MYD (UH/C-2)
East Coast Tall West Coast Tall TXD, DXT COD/WCT (Chandra Shankara). E.O./COD (Chandra-Laksha). 15.1 Cm. to 36.7 Cm. A.O./G.B. Annual Ganga. WCT/GB Kera Ganga. WCT/COD Kera Shankara. L.O./GB Laksha Ganda. WCT/MYD Kera Suree. WCT X SS Kera Saughagya.
2. Average Rain fall (cms) 69 to 110 cm. Upto 120 cm. 15.1 cm. to 36.7 cm. 3. Temperature range in 0C
Humidity
2000 hours or more for year 120 hours of sum shine per month RH – 20 % sto 91 %
17.0 0C to 41.0 0C (RH) 65 to 83 %
23 0C to 37 0C 60 to 75 %
4. Type of soil Red loamy, Black cotton soil Alluvial, Sandy & Loam
Red loam, Black cotton, Sandy to Sandy loam.
Coastal sandy, Laterite, loamy Alluvial, River Alluvial.
5. Method of Cultivation Nursery Technique/ Paly-bag Nursery.
Nursery Nursery Nursery
6. Transplanting Practice – I. Planting Distance – Tall Dwarf Hybrid II. Method of Planting – Square/Triangular III. Technique of Planting.
7.5 x 7.5 mtr. -- -- Square / System. 1x1x1 mtr. Pit.
7.5 x 7.5 mtr. -- -- Square / System. 1x1x1 mtr. Pit.
7.6 x 9.0 mts. Square / System. 1x1x1 mtr. Pit.
7. Maintenance practice followed for adult plantation. I. Manuring of adult palms. II. Fertilizer treatment given to Palms in the area. III. Organic manures used. IV. Green Manures used. V. Intercultivation in practice.
Compost 50 to 60 kg. Urea – 1300 kg. NPK 1 to 3 kg. Super Phospet – 2kg. Potash 2 kg. Compost 10 to 50 kg. Sun Hemp, Neem. Black Gram, Groundnut, Gingelly, Banana, Jawar, Pulses, Cocoa.
Farm Yard – 50 kg. Urea – 1.5 kg. Super phospet 2.00, mop 2 kg. Compost. Pulses. Ragi, Paddy.
Fertilizer and manure are applied. NPK 0.34 to 0.5, 0.17 to 0.30 K – 0.68 to 1.000 kg. Cattle manure 10 to 50 kg. Wild green leaves, Sun hemp. Tapica, Sweet Potato, Yam ginger, Turmeric, Pulses, Banana, Pineapple, Veg.
8. Cover cropping followed in coconut gardens.
N.A. Ragi, Paddy less than 10 years old palm.
Mango, Jack fruits.
Contd..2/-

Name of State Sl. No.
Andhra Pradesh.
(4) Karnataka
(5) Gujaratq
(6) Diu (7)
1. Variety – Type grown Tall – Dwari – Hybrid
East Coast Tall. Ect x GB (Godawari Ganga) WCT x COD (Kera Sankara)
West coast Tall. Tall & Dwart COD x WCT Chandra Shankar LO x COD Chandra Laksha
West Coast Tall Hybrid – TDX, DXT
West Coast Tall TDX, DXT
2. Average Rain fall (cms) 100 to 225 cm. 70 to 80 cm. 47 cms. To 300 cms. 43.3 to 69.1 cms. 3. Temperature range in 0C
Humidity 27 0C RH 1000 M.
27 0C -
21 to 47 0C Humidity – 12 to 90
35 to 38 0C 60 &
4. Type of soil Costal allivium, Red soil, Black allivium, sowdy.
Costtal allivium, Red soil Read loomy, Black Grayish brown sandy.
5. Method of Cultivation Nursery Technique/ Paly-bag Nursery.
Sand bed Nursery Technique
Nursery Technique.
Nursery Technique.
Nursery Technique.
6. Transplanting Practice – I. Planting Distance – Tall Dwarf Hybrid II. Method of Planting – Square/Triangular III. Technique of Planting.
7.5 x 7.5 to 8 x 10 mtr. Square. 3 x 3 x 3 foot pits.
7.5 x 7.5 to 10 x 10 Square. 3 x 3 x 3 foot pits.
7.5 x 7.5 mtrs. 7.0 x 7.0 mtr. Square. 1 x 1 x 1 mtr. Pit.
4 x 4 mtr. 4 x 4 mtr. Square. 1 x 1 x 1 mtr. Pit.
7. Maintenance practice followed for adult plantation. I. Manuring of adult palms. II. Fertilizer treatment given to Palms in the area. III. Organic manures used. IV. Green Manures used. V. Intercultivation in practice.
Compost 10 kg. per Tree. DPK 1 kg., Uria 1.5 kg., Phosphates 2.5 kg. 160 Varmi compost. Dhamicha, Green Manure. Ploughing weeding.
50 kg. per palm manuring. 2 to 3 kg. of NPK given two times. Farm yard manure. Sun hemp, hourse grass, green manure. Ploughing weeding.
-- UREA NPK AMMO PH 2.00 kg 1.5 kg 1.00 kg 1.25 kg -- Sun hemp. Ploughing weeding.
-- Ammo Su fasp Potesh 1.0 kg 1.0 kg. 1.0 kg. -- -- Ploughing.
8. Cover cropping followed in coconut gardens.
Green gram, Sun hemps, Dhamicha, Capalgomium.
Turmeric, Ginger, Banana, Vegetables, Coco, Ragi, Jawar.
Groundnut, Gram, Vegetables, Methi, Pineapple.
Bajara, Jawar, Vegetables.
Contd..3/-

Name of State Sl. No.
Daman
(8) Assam
(9) West Bengal
(10) Orissa
(11) 1. Variety – Type grown
Tall – Dwari – Hybrid West coast Tall TDX, DXT
Assam Tall
2. Average Rain fall (cms) 183 cms. 160.12 cms. 3. Temperature range in 0C
Humidity 11.4 to 38.80 0C 55 to 65 %
(RH) 75 to 85 %
4. Type of soil Black cotton soil. Sandy 5. Method of Cultivation
Nursery Technique/ Paly-bag Nursery.
Traditional method. Nursery Technique
6. Transplanting Practice – I. Planting Distance – Tall Dwarf Hybrid II. Method of Planting – Square/Triangular III. Technique of Planting.
10 x 15 feet. -- 8 x 10 feed Square. 1 x 1 x 1 mir pit.
7.5 m. x 7.5 m -- -- Penipheral Planting in homestate garden. Planting in pits.
7. Maintenance practice followed for adult plantation. I. Manuring of adult palms. II. Fertilizer treatment given to Palms in the area. III. Organic manures used. IV. Green Manures used. V. Intercultivation in practice.
Farm yard 50 kg. Ammo Su fasp. Potesh 2.0 kg. 2.5 kg. 2.0 kg. --- Yes Plougning
Once in a year. Ring method.
8. Cover cropping followed in coconut gardens.
Vegetables & Flowers pulses.

Annexure - LXVII
DIFFERENCE BETWEEN ANNUAL AVERAGE WHOLESALE PRICES AND MINIMUM SUPPORT PRICES OF MILLING COPRA AND BALL COPRA
(Rs. per quintal)
Milling Copra Ball Copra Sl. No. Year
MSP WSP Absolute difference (WSP – MSP)
Percentage difference MSP WSP Absolute difference
(WSP – MSP) Percentage difference
1 1997 2700 3542 842 31.18 2925 5029 2104 71.93
2 1998 2900 3038 138 4.76 3125 4427 1302 41.66
3 1999 3100 3708 608 19.61 3325 3945 620 18.65
4 2000 3250 2415 - 835 - 25.69 3500 3652 152 4.34
5 2001 3300 2145 - 1155 - 35.00 3550 2426 - 1124 - 31.66
6 2002 3300 3086 - 214 - 6.48 3550 3513 - 37 - 1.04
7 2003 3320 4055 735 22.14 3570 4307 737 20.64
8 2004 3500 4598 1098 31.37 3750 6180 2430 6.48
9 2005 3570 3698 128 3.58 3820 5075 1255 32.85
10 2006 3590 3264 - 326 - 9.08 3840 4024 184 4.79

Annexure – LXVIII
BALANCE OF PAYMENT IN INDIAN EXPORT AND IMPORT OF COCONUT PRODUCTS
Year Import Percentage change over
previous year Export
Percentage change over
previous year
Trade Deficit/Surplus
1992-93 155.72 7.32 103.67 140.87 -52.06
1993-94 587.04 276.98 373.17 259.96 -213.87
1994-95 786.27 33.94 581.23 55.75 -205.04
1995-96 810.06 3.03 472.77 -18.66 -337.29
1996-97 1298.27 60.27 840.13 77.70 -458.14
1997-98 571.05 -56.01 1173.78 39.71 602.73
1998-99 432.78 -24.21 998.33 -14.95 565.55
1999-2000 1364.86 215.37 1933.72 93.70 568.86
2000-2001 3197.52 134.27 2742.19 41.81 -455.33
2001-2002 4134.56 29.31 2530.00 -7.74 -1604.56
2002-2003 7707.25 86.41 4189.77 - -3517.47
Growth rate 33.50 20.71

Annexure – LXIX
NUTRIENT CONTENTS OF TENDER COCONUT
Nutrient Units Value per 100 grams of edible portion 1. 2. 3.
Proximates Water g 94.99 Energy keal 19 Energy kj 79 Protein g 0.72 Total lipid (fat) g 0.20 Ash g 0.39 Carbohydrate, by difference g 3.71 Fiber, total dietary g 1.1 Sugars, total g 2.61 Minerals Calcium, Ca mg 24 Iron, Fe mg 0.29 Magnesium, Mg mg 25 Phosphorus, P mg 20 Potassium, K mg 250 Sodium, Na mg 105 me,/n mg 0.10 Copper, Cu mg 0.040 Manganese, Mn mg 0.142 Selenium meg 1.0 Vitamins Vitamin C, total ascorbic acid mg 2.4 Thiamin mg 0.030 Riboflavin mg 0.057 Niacin mg 0.080 Pantothenic acid mg 0.043
Contd..2/-

:: 2 ::
1. 2. 3. Vitamin B-6 mg 0.032 Folate, total meg 3 Folic acid meg 0 Folate, food meg 3 Folac, DFE meg-DTE 3 Vitamin B-12 meg 0.00 Vitamin A, IU IU 0 Vitamin A, RAE meg-RAE 0 Retinol meg 0 Vitamin E (alpha-tocopherol) mg 0.00 Vitamin K (phylloquinone) meg 0.0 Lipids Fatty acids, total monounsaturated g 0.176 4:0 g 0.000 6:0 g 0.001 8:0 g 0.014 10:0 g 0.011 12:0 g 0.088 14:0 g 0.035 16:0 g 0.017 18:0 g 0.010 Fatty acids, total monounsaturated g 0.008 16:1 undifferentiated g 0.000 18:1 undifferentiated g 0.008 20:1 g 0.000 22:1 undifferentiated g 0.000 Fatty acids, total polyunsaturated g 0.002 18:2 undifferentiated g 0.002 18:3 undifferentiated g 0.002 18:4 g 0.000 20:4 undifferentiated g 0.000
Contd..3/-

:: 3 ::
1. 2. 3. 20:5 n-3 g 0.000 22:5 n-3 g 0.000 22:6 n-3 g 0.000 Cholesterol mg 0 Amino acids Tryptophan g 0.008 Threomine g 0.026 Isoleucine g 0.028 Leucine g 0.053 Lysine g 0.032 Methionine g 0.013 Cystine g 0.014 Phenylalanine g 0.037 Tyrosine g 0.022 Valine g 0.044 Arginine g 0.118 Histidine g 0.017 Alanine g 0.037 Aspatic acid g 0.070 Glutamic acid g 0.165 Glycine g 0.034 Proline g 0.030 Serine g 0.037 Other Alcohol, ethyl g 0.0 Cattiene mg 0 Theobromine mg 0 Carotene, beta meg 0 Carotene, alpha meg 0 Cryptoxanthin, beta meg 0 Lycopene meg 0 Lutein + zeaxanthin meg 0

OFFICIALS ASSOCIATED WITH THE PROJECT
GUIDANCE
Late Shri H.P.Singh, Jt. Agricultural Marketing Adviser, Branch Head Office, Nagpur. Shri Har Prasad, Jt. Agricultural Marketing Adviser, Branch Head Office, Nagpur. Shri B.D.Sherkar, Dy. Agricultural Marketing Adviser (Retd.), Branch Head Office, Nagpur.
FIELD SURVEY
Special thanks are due to all the staff at the Sub-Offices of the Directorate of Marketing and
Inspection, associated with the field survey, data collection and compilation related to this report.
1. Shri N.G.Mani, M.O. 13. Shri Y.M.Rao, M.O. 2. Shri K.S. Achary, M.O. 14. Shri M.Jawahar, M.O. 3. Smt. R.Lalitha, M.O. 15. Shri G.M.Dandi, M.O 4. Shri N.M.Ramchandran, M.O. 16. Shri P.P.Mukhopadya, M.O. 5. Dr.C.Swamidas, M.O. 17. Shri B.Pushit, M.O. 6. Shri S.Noohu Kannu, M.O. 18. Shri R.K.Pande, M.O. 7. Shri K.Jeyanandan, M.O. 19. Shri M.K.Prakash, M.O. 8. Shri James Antony, M.O. 20. Shri G.M.Moon, M.O. 9. Shri C.Nandail, M.O. 21. Shri P.P.Mukhopadya, M.O. 10. Shri B.K.Prusti M.O. 22. Shri T.K.Ray, AAMA. 11. Shri D.N.Roy,M.O. 23. Shri G.Chakraborty, M.O. 12. Shri P. Malvin Roy, M.O. 24. Shri Prasad Chakraborty, M.O.
.STATISTICAL ASSISTANCE
Shri G.B.Gawande, Statistical Officer.
Shri B.U.Mesharam, Statistical Assistant. Shri P.N.Parteti, Statistical Assistant.
TYPING AND COMPUTER WORK
Shri D.N.Lamghare, Stenographer.
Shri A.S.Thubrikar, U.D.C.
LIBRARY AND DOCUMENTATION
Smt.S.R.Gaikwad, Sr. Library Information Assistant.

REFERENCES
1) C.V. Sairam S. Arul Raj and Rajagopal Perspectives of Marketing Research for Coconut
and its products; (CPCRI, Kasargod Kerala)
2) P.C. Malu, A.G. Deasai & Joshi G.D; Evaluation of Coconut (Cocos nucifera L.) Cultivars for Tender Nut water Indian Coconut Journal Vol. XXXIV No. 11 March, 2004 5-12
3) B. Vijaychandran Pillai; Marketing Problems of Rural Coil Co-ops in Kerala – “A Comparative study with Private Sector. Unit Indian Cooperative Review, July 2003, 64-70”.
4) R.K. Singh and B. Subburaj, Market share of Tender nuts – An Estimation – Indian Coconut Journal 8-10, Vol. XXXIV No. 5 September, 2003”.
5) N.H.Jayadas, G.Ajit Kumar and K.K. Saju Coconut Oil as on Alternative to Automobile Lubricants Indian Coconut Journal. Vol. XXXIV No. 5 September, 2003 3-7”.
6) M. Thomas, Mathew, B.L Anand, and M.K. Sukumaran Nair, The Mite and Coconut Economy of India. Indian Coconut Journal, Vol. XXXIV No. 9 January 2004, 6 – 14”.
7) P.M. Jacob, K.Samsudeen, & H. Moosa, Prospects of Cultivating Dwarf Orange Coconut Cultivar for Tender Nut Production in Lakshadweep Island, Indian Coconut Journal Vol. XXXIV No. 11, March, 2004 3-4.
8) Subburaj & Dr. R.K. Singh, Marketing of Coconut, Disposal Strategies of farmers.
Indian Coconut Journal : 1-7 March, 2003 Vol. XXXIII No. 11, ISSN 0970-0579.
9) Rethinam, Ponniah, Virgin Coconut Oil Applications 2004, Indian Coconut Journal Vol. XXXIV No. 12 5-7.
10) H.P.Maheswarappa, P.Subraminam, R.Dhanapal, Gopal Sundaram and P.Hedge, R.1998,
Influence and Irrigation and mulching on soil, moisture and soil temperature under coconut in literal study soil Journal of Plantation crop 26;93-97.
11) K.Ramaraju, S.Palani Swaraj, P.Annakodi, M.K.Varadarajan, M.Muthu Kumar and V.Bhaskaran, Impact of coconut mite, aceria guereronis K.(Acari: Eriophydoe) on yield parameters of coconut. Indian Coconut Journal, Vol.25, No.9, Page 12-15.
12) M.M. Thomas, Coconut Industry in India, an overview, Indian Coconut Journal, Vol.2, No.7 Page 3-13.
13) M.Poduval, M.D.Abu Hasan and P.KChattopadhyad, Evaluation of coconut cultivars for tender nut water for West Bengal, Indian Coconut Journal, 20, No.1 Page-3-6.
14) S.Narayanan and L.Bastine, Price Spread of Coconut in the Central Region of Kerala, Journal of Tropical Agriculture, 42 (1-2): 73-75, 2004.