Embed Size (px)
Citation preview

Production and Costs

Average and Marginal Product
Marginal Product of Labor=Increase of Product when Employing an Additional Worker (≠ marginal benefit)
Average Product of Labor or Product per Worker=Total Product/Number of Workers

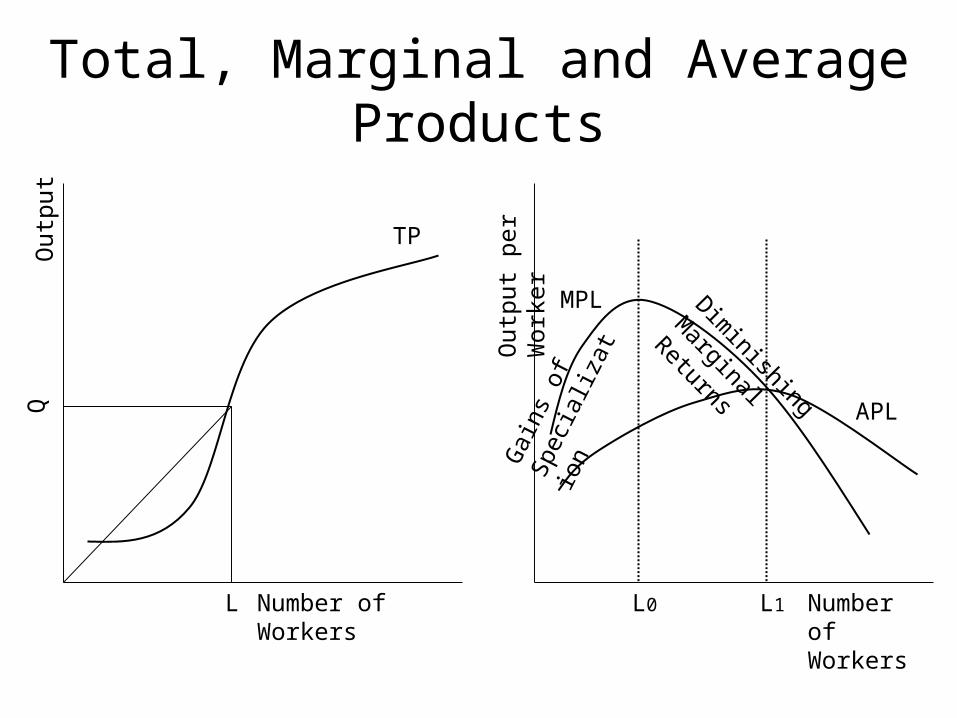
Total, Marginal and Average Products
2 12 7 6
3 21 9 7
4 28 7 7
5 33 5 6.6
6 36 3 6
7 37 1 5.3
Labor Total Product
Marginal Product Average Product
1 (worker) 5 (dresses) 5 (d. added by additional worker)
5 (d.p.w.)
Total, Marginal and Average Products
Number of Workers
Out
put
Number of Workers
Out
put
per
Wor
ker
L0 L1
TP
MPL
APL
Gai
ns o
f S
peci
aliz
atio
n
Diminishing
Marginal Returns
Q
L

Average and Marginal Product
Suppose that 5 bakers bake 500 cupcakes. The average product of labor is 100 (500/5).
A new baker is employed and total output goes up to 630 cupcakes.
The marginal product of adding an additional worker is 130. The new average product of labor is 630/6=105.
If the marginal product of labor is larger than 100, the average product of labor rises. If the marginal product of adding an additional worker is less than 100, the average product of labor falls.
Then, the marginal product curve cross the average product curve when the average cost of labor is at the maximum.

Costs (5 machines $10 per machine, wage is $15 per worker)
Labor Total Product
1 5
2 12
3 21
4 28
5 33
6 36
7 37
Variable Cost
15
30
45
60
75
90
105
Total Costs
65
80
95
110
125
140
155

Average Costs (per unit cost)AVC=VC/QAC=TC/Q
If labor is the only Variable Input: Variable CostAVC=VC/Q=(PL*L)/Q=PL/(Q/L)=PL/APL
Marginal CostsThe increase in total cost when increasing production by 1
unit (not when increasing labor by 1 unit!).
MC=PL*(1/MPL)One additional worker adds MPL to product. It is needed
1/MPL units of workers to produce one unit of the product.

Cost Curves
Labor Product MPL APL VC TC AVC AC MC1 5 5 5 15 65 3 13 3 (1/5)*15
2 12 7 6 30 80 2.5 6.6 2.14
3 21 9 7 45 95 2.14 4.5 1.67
4 28 7 7 60 110 2.14 3.9 2.14
5 33 5 6.6 75 125 2.27 3.7 3
6 36 3 6 90 140 2.5 3.8 5
7 37 1 5.3 105 155 2.84 4.1 15

Total and Variable Costs
Output
$TC
VC

Relationship Between Marginal and Average Products and Costs
Output
$ pe
r un
it of
out
put
Number of Workers
Out
put
per
Wor
ker
L0 L1
MC
MPL
APL
AC
AVC
Q1(L1)Q0(L0)
MC=PL*(1/MPL)
AVC=PL/APL

Average and Marginal Cost
Suppose the total cost of producing 5 units is $100. The average cost is $20. A new unit is produced and the total cost goes to $130.
The marginal cost of producing an additional unit is $30.
The new average cost is 130/6=25.
If the marginal cost is larger than 20, the average cost rises. If the marginal cost of producing an additional unit is less than 20, the average cost falls.
Then, the marginal cost cross the average cost curve when the average cost of labor is at the minimum.

Fixed Costs
Output
$
Output
Cos
t pe
r un
it of
out
put
AFC
AVC
ATC
FC

Short Run and Long Run
Output
Cos
t pe
r U
nit
ACSR AC long run
Q*