Embed Size (px)
Citation preview

Production and Cost
Production FunctionInputs Output (s)
Cost Function
At Given
Output Level Inputs Unit InputNeeded Price
Based on ProductionFunction
TotalCost

Total Product
Look at theslope
TotalProduct Q
Input (Labor)
TP

Total Product
TotalProduct Q
Input (Labor)
TP

Deriving the Average Product Curve
Total Product Q
Input (Labor)
TP
APL
L
APL
Q3
Q2
Q1
P1 P2 P3

TotalProduct Q
Input (Labor)
TP
MPL
L
MPL
Deriving the Marginal Product Curve

Critical Points in Average and Marginal Product
TotalProduct Q
Input (Labor)
TP
MPL
LMPL
APL
AB
C

Stages of Production
Stage III
MPL
L
MPL
APL
A
B
C Stage I Stage II

Economic vs. Accounting Profit
Economic profits from good (service) =Revenue from good (service) – Total Cost of making good (service) – Value of next best alternative
Value of good (service)
Value of next best alternative(aka “opportunity cost”)
Accounting profits from good (services) = Revenue from good (services) – Total cost of making good (services)

Topics in Costs
Estimating cost functions:Identifying Fixed from Variable Costs
Short run costsLong run costs – scale economiesLearning economies (“experience
curves”)Economies of scope

Cost Functions
In any tactical (short run) setting, some production drivers of a company are “fixed” while others are “variable”
What is fixed and what is variable depends on the company, contracts drawn up, and the industry
The Prestige Telephone Company case is (partially) an exercise in identifying fixed from variable costs. Also illustrates importance of accounting in economic decision making

Examples of Fixed and Variable Costs
Fixed CostDriver
Variable Costs Driver
Auto manufacturers
Physical Capital Labor
Materials
Universities Tenured Faculty Power (portion)
Power (portion) Non-tenured faculty Staff

Cost Function
Form of cost function depends on whether we are dealing with the short run or the long run
Short run, some cost drivers are “fixed” (also to be shown in PTC example). Thus cost function is:C = Fixed Costs + Variable Costs
Equation which relates total costs to outputC = f(Q)

Estimating Cost Function
Done by examining cost data (typically from income statements) and extrapolating cost function
Some Fixed Costs are easily identifiedSome Variable Costs are also easily
identified– the real issue is to determine the relationship between TVC and Q (linear or non-linear?)
The trickiest items are “quasi-fixed-variable” costs: these have a fixed and variable component which must be separated

Quick notes about Costs
C = 100 + 38QWhat does F = 100 represent?What does AVC = 38 represent?What is cost of producing an additional
chip, and what does it cover?Any insights into the production technology
which may be gleaned from the cost function?
What is Average Cost (AC)? Know what is C, F, TVC, AVC, AFC, and AC

Separating Fixed and Variable Costs
Argued that some items have a fixed and variable component. How to identify each component?
We must now make assumptions about the form of the cost function: linear, non-linear? “Constant” will be Fixed Cost
Note how scatter plot suggests that a linear cost function seems appropriate

Cost Functions in general
Can be either linear or non-linearIf non-linear, MC depends on level of
productionExample: C = 20,000 + 200Q + 0.5Q2
MC = 200 + QHow to tell if your company has a
linear or a non-linear cost function?►Scatter plot of costs vs. output►Run regressions►Run a battery of test to test functional form

Total Cost
Total Cost = Total Variable Cost + Total Fixed CostTVC,TC
Q
TVC
TC
TFC

Deriving Average Fixed Cost
TFC
Q
TFC
AFC
Q
AFC

Deriving Average Variable Cost
TVC
Input (Labor)
TVC
AVC
Q
AVC
Minimum AVC
AVC decreasing
AVC increasing

Average Total Cost
Q
AFC
ATC AVC AFC
AVC
ATC
AFC
AVC
ATC

Deriving the Marginal Cost Curve
TVC
Q
TC
MC
Q
MC
Minimum MC (Diminishing marginal returns
to variable input) MC declining
MC increasing
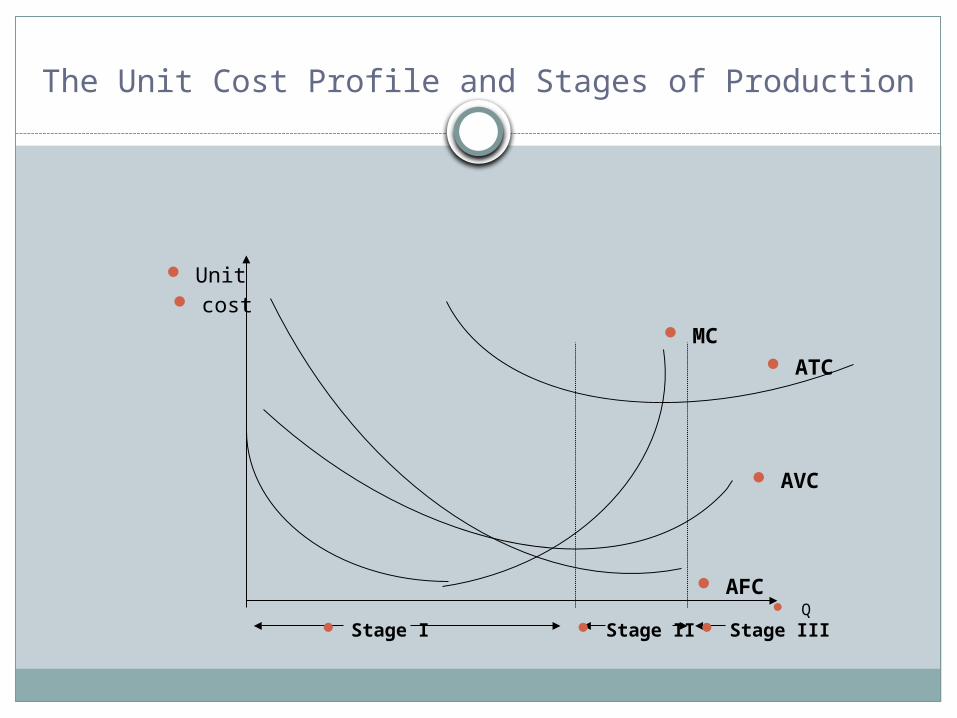
The Unit Cost Profile and Stages of Production
Unit cost
Q
AFC
AVC
ATC
MC
Stage I Stage II Stage III

Why does AC rise/fall? Short Run
Reasons for AC rising/falling are very different depending on whether we are dealing with the short or the long run
In the short run, at least one input is fixed
Output rises from increase in variable inputs
How variable inputs interact with the fixed input determines the shape of the Short run cost functions

Relation between Production and cost
The production function implies the cost functions
Diminishing marginal returns is the reason for increasing MC
The profile of ATC, AVC, AFC and MC is very important for managerial decisions; learn to draw these curves accurately!

Quantity of labor
Co
sts
(d
olla
rs)
Ave
rag
e p
rod
uct
an
dm
arg
inal
pro
du
ct
Quantity of output
MP
MC
Productivity & Cost Curve Relationship

Quantity of labor
Co
sts
(d
olla
rs)
Ave
rag
e p
rod
uct
an
dm
arg
inal
pro
du
ct
Quantity of output
MPAP
MCAVC
Productivity & Cost Curve Relationship

Un
it C
ost
s
Output
For every plant capacity size... there is a short-run ATC curve
and every ATC has a minimum cost
Long-run Production Costs

Un
it C
ost
s
Output
An infinite number of such costcurves can be constructed...
Long-run Production Costs

The Long-run ATC just “envelopes”all of the short-run ATC curves
Un
it C
ost
s
Output
Long-run Production Costs

Long-run ATCUn
it C
ost
s
Output
Long-run Production Costs

Un
it C
ost
s
Output
Long-run ATC
Economiesof scale
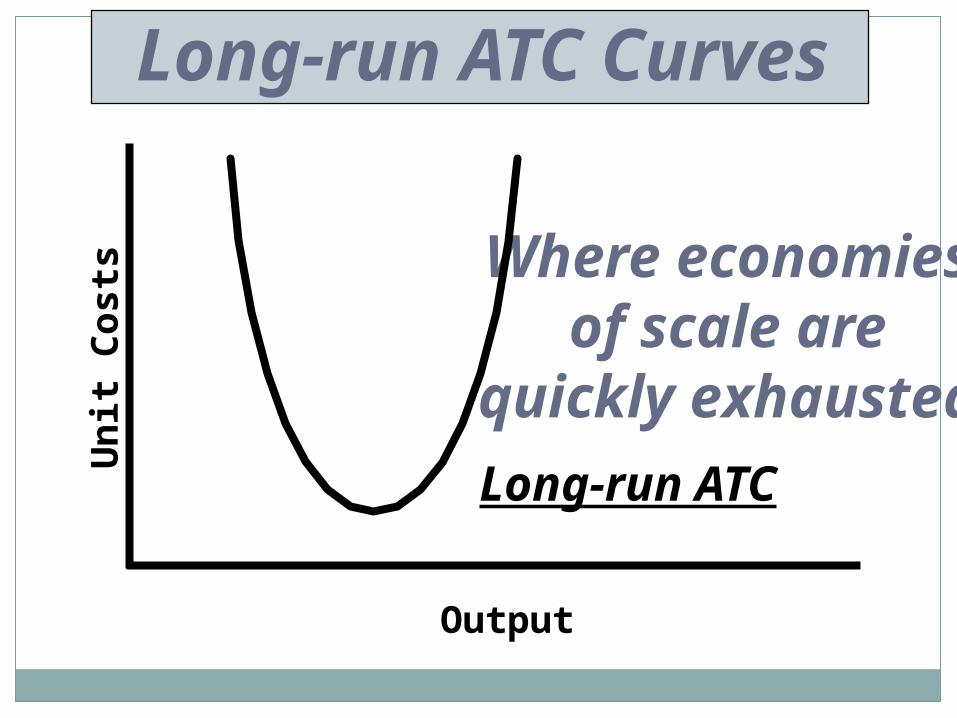
Long-run ATC Curves

Un
it C
ost
s
Output
Long-run ATC
Economiesof scale
Constant returnsto scale
Long-run ATC Curves

Un
it C
ost
s
Output
Long-run ATC
Economiesof scale
Diseconomiesof scale
Constant returnsto scale
Long-run ATC Curves

Un
it C
ost
s
Output
Where extensiveeconomies of
scale exist
Long-run ATC Curves
Long-run ATC
Un
it C
ost
s
Output
Where economiesof scale are
quickly exhausted
Long-run ATC Curves
Long-run ATC

A last word about...
Minimum Efficient Scale - MESDecision on plant size should relate to the expected demand for the product
Plant Size Expected Demand LRTC LRAC A 10000 $50000 $5.00 B 20000 90000 4.50 C 30000 120000 4.00Although Plant C has lower cost per unit than plant A or B, you do not want to build the plant A or C if your estimated demand is 20000 units.