Embed Size (px)
Citation preview

Product Quality and the
Economic Performance of Firms
Stan Liebowitz University of Texas at Dallas
March 6, 2000

1
Introduction
Explaining the causes of corporate success is certainly the holy grail of business
strategists, and is or should be the main goal of business school research. In this study I
report findings comparing the economic performance of companies to the quality of their
products.
In doing so I have been the beneficiary of work already performed under the
guidance of McKinsey researchers to create a population of firms and industries chosen
so as to provide maximum contrast in firm performance, and also to find firms with
particular patterns of performance changes. In principle, this should allow very fine
gradation and detail when examining the potential causes of economic performance.
The McKinsey researchers examined total stockholder return for many firms in two
consecutive five-year periods.1 Firms that experienced returns above the norm for
comparative firms in both periods were classified as "sharpbenders".2 Conversely, firms
that were below the median of similarly situated firms for both periods were classified as
"never-had-its". The contrast between never-had-its and sharpbenders provides the
sharpest contrast and will be the major focus of this study.
Additionally, McKinsey also classified firms into found-it and lost-it categories.
These are firms that move from generating above average stockholder returns the first
period to generating below average returns in the second period, or vice-versa. By
examining firms in these categories one should be able to determine the timing of the link
between performance and other variables of interest.
The McKinsey data set contains firms in 40 markets (industries).
Unfortunately, the McKinsey data set, for all its useful attributes, was not created to
ease the task of comparing the quality of products across firms. Data on product quality
1 For most industries, these time periods were from December 1986 to December 1991 and December 1991 to December 1996. 2 The performance of comparative firms was either the median of peer firms in the industry or a benchmark index (such as Standard and Poors) for that industry.

2
are difficult to come by, and the industries chosen by the McKinsey researchers to
maximize the variation in economic performance of firms, were less than ideal for
measuring quality in many cases. I was able to generate useful data for slightly more than
one fourth of the McKinsey markets. For that reason, I had to go outside the McKinsey
population and examine some other industries and firms in order to generate a sufficient
number of markets to have confidence that my results were quite general.
Types of Quality
The literature discusses several types of quality.
? Conformance quality measures the success a firm has at producing
products that conform to a particular specification. This is most commonly
used when talking about ‘defects’ but I am using the term in a much broader
manner. There are at least two types of conformance measures that can be
judged.
? Some set of parameters can be specified that presumably ‘measures’
those aspects of a product that consumers find valuable. This can be
thought of as an ‘ideal’ product for the price range, at least in the eyes
of the creator of this standard. Characteristics of real products can then
be compared to these ideal characteristics, and after appropriate
weighting, an overall judgment can be made about the quality of the
product. Price may be a separate parameter in these considerations. This
is the type of analysis that is found in Consumer Reports, Car and
Driver, PC Magazine, and so forth. These magazine reviewers set out to
measure the performance of products along certain dimensions that the
reviewers consider important. For an automobile, these characteristics
might include acceleration, gas mileage, braking distance, seating
comfort, ride, reliability, and so forth. But not every characteristic can
be included in the list, so that different reviewers will have different
ideals, which is one reason they can come to different opinions about

3
the product being reviewed. Such product reviews may give summary
statistics or more detailed scores, allowing the reader to recalculate the
results with more personal weights. This will be the primary source of
data that I am using in my analysis.
? A measure of the success that a firm has in producing products that meet
the product specifications that it has set for itself. This is a measure of
production success. It measures reliability in production, a characteristic
that is certainly important. It is not generally the most important
consideration, however. Perfect conformance in this regard might make
quality engineers happy, but no matter how little variance there is in a
product’s production, no matter how predictable its performance might
be, if the specification is not one that consumers are interested in, the
product will not succeed in the market.
? Perceived quality is generally measured as the quality of products perceived
by consumers. Historically, this has been measured in several different
ways:
? Industry executives are sometimes asked to rate the quality of products
produced by their firm, or other firms in their industry. This technique
has been used in the PIMS database and in the Fortune database.3 Both
of these data sets suffer from the weakness that actual consumers are not
asked about the product, but instead executives or industry experts
(analysts) are asked for their opinion of product quality for an entire
company or line of business. The advantage of these data, naturally, is
that they are very convenient to use, allowing the analyst to ignore the
tedious job of measuring quality of numerous individual products and
instead allowing the analysis to jump right to the firm or line of business
level, which is the level at which success, profits, or stock market
returns are usually measured. The downside is that executives may not

4
be in a position to really know what it is that consumers want (certainly
executives from failing firms), and in addition, they may just assume
that successful firms are producing the highest quality product, leading
to a serious circularity in the analysis. In fact, I believe this is a serious
flaw in the Fortune data, and a likely flaw in the PIMS data.4
? Consumers might be asked to rate products that they consume, or stores
that they patronize. If they are asked the proper questions, and if the
respondents are representative of the consumers in that market, this type
of perceived quality should reflect the success that firms are having in
producing products or experiences that consumers find to have the
highest quality (perhaps per dollar of expenditure). I use this type of
data in several places, particularly in the retail segment where there
seems to be little other way of measuring retail quality.
? Value is generally measured as the quality of a product relative to its price
and the quality/price relationship of competing products. It would almost be
considered a violation of a law of nature, to economists at least, if
consumers did not choose a product that they thought provided the best
value to them. Economic models of consumer behavior require that a
consumer choose the product best suited to sate the consumer’s tastes,
relative to its cost. Yet, it is possible that producers of such products might
not do that well in the market if they are charging, say, too little for a
product and not earning the profits that their investors expect. Some of the
markets in this study have measures of value based on consumer surveys.
3 Robert Buzzell and Bradley Gale, "The PIMS Principles," The Free Press, New York, 1987. The Fortune Data come from Fortune Magazine and are available in a database that they sell. 4 The PIMS data is supposed to be tested against consumer surveys, but I do not know the extent to which this is done. See Page 105 in Buzzell and Gale.

5
Quality and Economic Performance.
It is not obvious that there should be a linkage between product quality and the
economic performance of firms. After all, higher quality is likely to arise as the result of
using superior raw materials, or superior effort, or superior talent. If increased quality
also meant increased cost, there would presumably be some cost/quality combination that
best fulfilled the tastes of consumers, and there is little reason to believe, a priori, that
this would occur at the top of the quality scale.
If higher quality comes about as the result of superior foresight, talent, or effort,
then the workers providing these superior skills might be expected to receive extra
remuneration, again possibly leaving the firm with higher quality products in no better
economic shape than its competitors. On the other hand, it is possible that it is difficult
for the factors leading to superior quality to ratchet up their salaries to fully reflect their
added value, perhaps because it is difficult to disentangle one person's influence from
what might be a team effort. In this case, there might well be a relationship between
quality and firm performance.
Nevertheless, our task here is empirical in nature--to determine whether there is a
relationship between quality and economic performance. Why there is such a relationship
is an intriguing question that will need to be answered in the future.
Data: Types and Problems
I have used various sources of data for this project, generated in large part by my
RAs.5 Measures of quality are difficult enough to come by that I did not have the luxury
of being able to use consistent measures from one industry to the next. Instead, different
industries have different measures of quality.
Various types of data were examined in an effort to measure quality. Ideally, I had
hoped to find data in trade journals that ranked the quality of the products and that also
provided separate information on pricing. In prior work examining software markets,
5 I need to thank Jeff Gurley and Tina Lane for providing diligent research assistance.

6
such data were common.6 Although converting reviews from disparate PC magazines into
a comparable format was not totally transparent, it was simple compared to dealing with
the quality data for some of the industries examined in this study.
Difficulties with the data can be classified into several major categories: (a)
availability, (b) internal consistency, and (c) external consistency. I will explain these
problems below.
For most of the Evergreen industries, generating any quality data at all proved to be
quite a challenge. In many cases, there was no published information about product
quality that my research assistants or I could find. We have scoured libraries, spoken to
industry executives, contacted trade associations, and received help from McKinsey, but
often to no avail.
In other cases, publicly available data exists for only a few years. In some
instances, it was possible to unearth data for some products produced by firms, but not
for the products that generated a preponderance of their revenues. In yet other cases,
getting the data into a manageable form proved to be anything but a simple task. For
example, in some industries (e.g. architectural paints) the number and variety of products
within a market was practically overwhelming. When there are dozens of varieties of
products from a single vendor, offered at different prices, it is difficult to assign a single
quality level to the firm.
These limitations in data availability have reduced the number of markets that
could be included in the analysis and the degree to which I was able to use the lost-it and
found-it categories of firms to test the more data intensive hypotheses that were part of
the Evergreen mandate.
Internal consistency would seem to be a prerequisite for any data set that we are to
believe measures quality in any sort of meaningful way. I have encountered a few
instances, however, where the results do not, at first blush, make sense. This can be due
6 The work on software applications appears in my book with Stephen Margolis, “Winners, Losers, and Microsoft: Competition and Antitrust in High Technology,” Independent Institute, 1999.

7
to instances where manufacturers are catering to different tastes than that of the
reviewers.
A theoretical example might be the following. Consumer Reports provides both
survey data and conformance data for many of the products they review. The
conformance data they provide compares a product with the ‘tastes’ of the testers at
Consumer Reports, which may or may not represent tastes of ordinary consumers. A
careful reading of Consumer Reports reveals that Consumers Union, the publisher of the
magazine, has a clear political agenda, and these political tastes can influence the ratings.
So, for example, when testing automobiles Consumer Reports will weight gasoline
mileage more heavily than many individual consumers are likely to because Consumers
Union is concerned about the world running out of resources, even when the world seems
awash in oil. This will skew their rankings compared to the rankings that typical
consumers might choose.
Here is an actual example of such inconsistency. This chart below represents prices
and quality as measured by Consumer Reports for Sony portable CD players in 1996.
Other brands were also examined, of course, but the focus here is on internal consistency,
which for obvious reasons is better tested with but a single brand.
There are six different models: D-245, D-141, D-345, D-335, D-842K, D-143, and
D-421SP. If we are to believe these results, Sony has two low quality players and five
high quality players, and prices are unrelated to quality. The best player is $149, and far
inferior to this player is one at $258. If these measures of quality accurately reflected
consumer preferences, the $149 player with the highest score (80) would clearly
dominate all other players except the $89 player scoring 79, and all consumers would
choose one of these two.7 Since all these products have the same name, and all are
supposed to be available to all users, it is difficult to imagine any form of price
discrimination that could explain such behavior by Sony. Sony should charge the highest
price for the unit now selling for $149 since it is the highest quality.
7 This form of rational maximizing behavior is the explicit assumption underlying economic models of consumer behavior. Potential problems such as incomplete or erroneous information on the part of consumers might alter this result.
8
Sony Portable CD Players, 1996
14989 199 283250
110 25872
75
78
81
$85 $135 $185 $235 $285 $335Price
Qu
alit
y R
anki
ng
What is going on then? Detailed examination reveals that Consumer Reports does
not value certain cost-increasing attributes even though the manufacturer believes that
consumers value them (e.g., water resistance or a remote control on the headphone).
Since water resistance would be of value to anyone jogging in the rain, it would appear
that the Consumer Reports rating system is overly narrow. Consumer Reports’ rankings
might be best for the typical consumer who will never take the player out into the rain,
but this heterogeneity in uses, and therefore tastes, causes all sorts of possible distortions
in rankings that don’t take account of these various tastes.
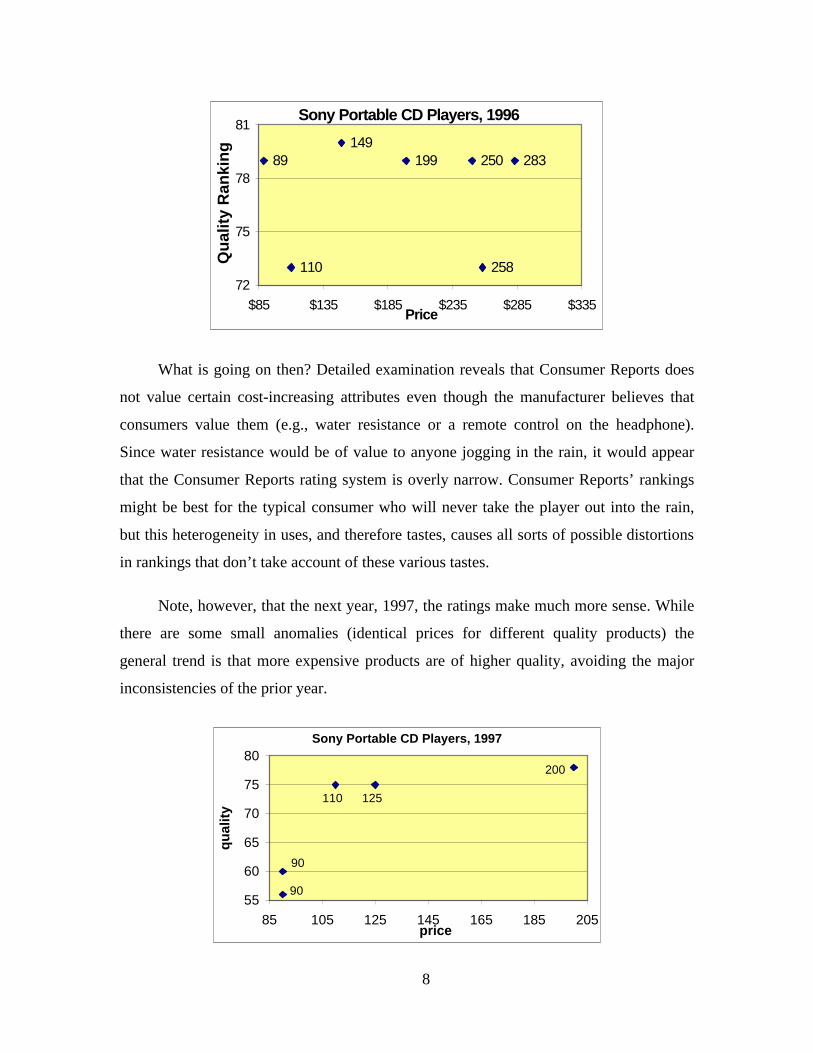
Note, however, that the next year, 1997, the ratings make much more sense. While
there are some small anomalies (identical prices for different quality products) the
general trend is that more expensive products are of higher quality, avoiding the major
inconsistencies of the prior year.
Sony Portable CD Players, 1997
125110
90
90
200
55
60
65
70
75
80
85 105 125 145 165 185 205price
qu
alit
y

9
External inconsistency occurs when data from two different sources do not agree.
I tried, wherever possible, to use data from more than one source, and on those occasions
where multiple sources were available, I tried to assess how similar the various sets of
data were.
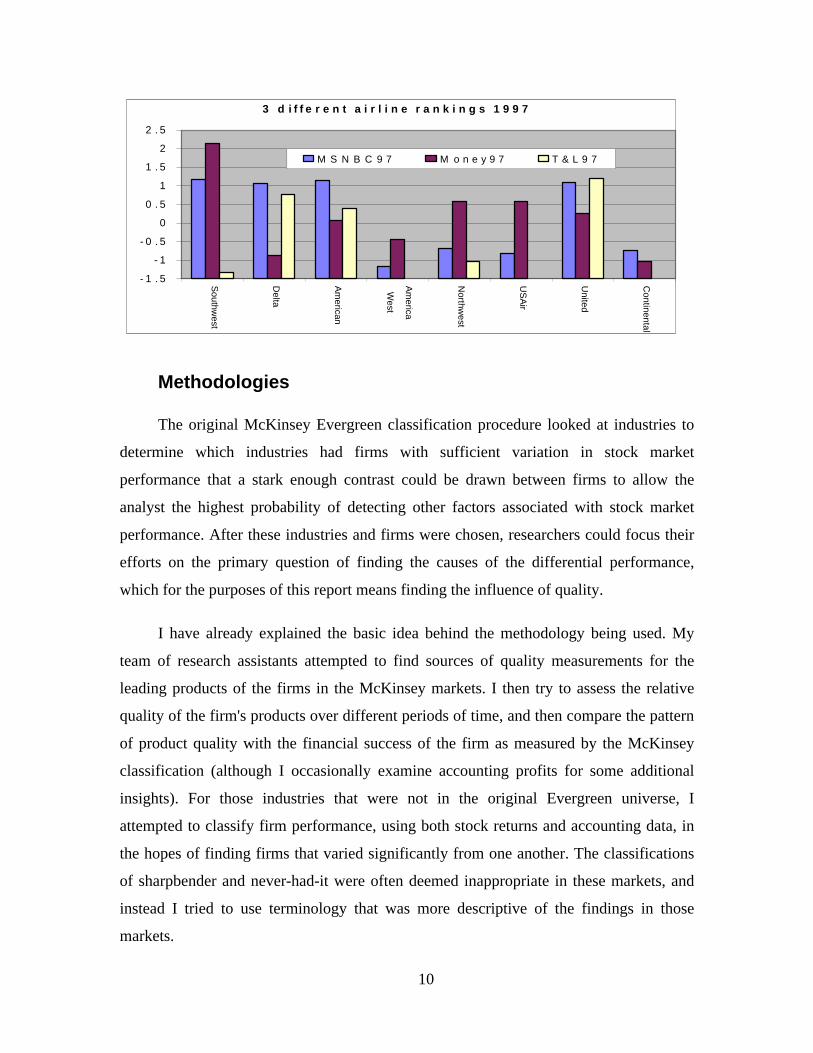
The industry with the greatest number of data sources is airlines (not an Evergreen
industry). The primary sources are the Department of Transportation, and Consumer
Reports, but in 1997 there are three other sources: MSNBC, Money Magazine, and
Travel and Leisure Magazine, all of whom surveyed their audience. Since they were all
based on surveys you might expect them to be largely in agreement with one another, but
as the chart below indicates, this is not the case. The most blatant difference is in the
ranking of Southwest Airline, the firm that wins most of the other ratings (excluding
these three sources) in most years. It wins with MSNBC and Money Magazine, but
comes in last with the Travel and Leisure audience. Southwest has low prices, a good on-
time record, good baggage service, and a friendly crew. It does not, however, have a great
selection of destinations, or gourmet meals. Apparently, individuals that read Travel and
Leisure magazine do not find Southwest to their liking, and perhaps for good reason,
given their tastes.
More troubling yet, the correlation between Travel and Leisure rankings and the
Money Magazine rankings is -.76.8 Obviously, the readers responding to these surveys
either have very different views of quality, or some of the surveys are very bad
instruments. In my analysis I try to use ratings that appear reasonably consistent with
other evidence, and ratings that appear to be based on a cross section of consumers that
reflects the center of the market for the product, where possible. Thus, the readers of
Travel and Leisure Magazine are judged to be atypical in their tastes, and their rankings
are discounted.
8 The correlation between MSNBC ratings and the Money ratings is .29 and between MSNBC and T&L is .48.
10
3 d i f f e r e n t a i r l i n e r a n k i n g s 1 9 9 7
- 1 . 5
- 1
- 0 . 5
0
0 . 5
1
1 . 5
2
2 . 5
Southw
est
Delta
Am
erican
Am
erica
West
Northw
est
US
Air
United
Continental
M S N B C 9 7 M o n e y 9 7 T & L 9 7
Methodologies
The original McKinsey Evergreen classification procedure looked at industries to
determine which industries had firms with sufficient variation in stock market
performance that a stark enough contrast could be drawn between firms to allow the
analyst the highest probability of detecting other factors associated with stock market
performance. After these industries and firms were chosen, researchers could focus their
efforts on the primary question of finding the causes of the differential performance,
which for the purposes of this report means finding the influence of quality.
I have already explained the basic idea behind the methodology being used. My
team of research assistants attempted to find sources of quality measurements for the
leading products of the firms in the McKinsey markets. I then try to assess the relative
quality of the firm's products over different periods of time, and then compare the pattern
of product quality with the financial success of the firm as measured by the McKinsey
classification (although I occasionally examine accounting profits for some additional
insights). For those industries that were not in the original Evergreen universe, I
attempted to classify firm performance, using both stock returns and accounting data, in
the hopes of finding firms that varied significantly from one another. The classifications
of sharpbender and never-had-it were often deemed inappropriate in these markets, and
instead I tried to use terminology that was more descriptive of the findings in those
markets.

11
Before turning to the method of handling quality measurements, I should mention
that I view the Evergreen Categories as providing two levels of tests. The more stringent
test (which I refer to as the primary test) involves comparisons of sharpbenders with
never-had-its. This is the strongest performance differential, and thus provides that
greatest variation over which to examine the role of quality differentials. Because the
performance differentials are continuous across two time periods, there is less of a chance
that expectations might cause mismatches in the measured relationship between quality
and performance, unlike the more exacting test (secondary test) based upon the lost-it and
found-it categories. As will be seen below, however, sometimes the classification of
sharpbender or never-had-it depended crucially on exactly which year was used to start
the period, and so these classifications are not always as robust as might have been
hoped.
With the lost-it and found-it categories, finding a relationship between quality and
performance is less likely, even if such a relationship exists. In part this is due to the fact
that I was not able to obtain quality measurements in every year. If product quality affects
the performance of firms, then changes in quality should change measured performance.
By using 5-year returns, however, it is possible that a jump in quality at the end of the
period, or the expectation of a jump in quality that will occur after the period has ended,
might lead to a stock market reaction prior to actual changes in quality. In this case the
change in stock return will likely not be linked to measured quality, particularly if the
quality measurement occurs in the middle of the period, as happens with many of the
firms in this sample.
As already mentioned, many of the original industries chosen by the Evergreen
methodology did not have data allowing us to measure the quality of the products of the
firms in the sample. In fact, after examining many industries and running into many dead-
ends, only fourteen of the Evergreen industries proved to be usable. My procedure to
generate additional markets was the inverse of the McKinsey procedure. I began by
looking for industries with measurable quality dimensions of the products, and then to
look at firms to determine whether they could be classified using the McKinsey
methodology, or some variant of it.

12
For these industries, I tended to classify firms slightly differently than McKinsey
had those in the Evergreen universe. As before, the question to be answered was whether
firms that had a better economic performance also had superior quality. Instead of using
two time frames, à la McKinsey, all available data were combined into one time period.
Firms tended to be categorized as above or below average in economic performance, and
then quality comparisons were made to see whether there was a relationship between the
two. Since accounting profits played a large role in this analysis, the trends of quality
measurements and accounting returns became an object of analysis.
Five of the nineteen markets in this study are not in the original Evergreen
universe: Car Rental Agencies, Cruise Lines, Airlines, Cosmetics, and Discount
Brokerage Firms. The analysis from these markets generated results on the relationship
between quality and performance that were consistent with the results generated from the
Evergreen markets.
As I discuss in the next section, there was very strong support for concluding that
economic performance is related to quality. On the other hand, in the few instances where
I was able to test, there was at best very weak support for the linkage between changes in
quality and changes in economic performance.
In a world where there are many different levels of quality and many different
prices, it might be sufficient to compare the quality of products competing in the same
general price range without any specific attention to prices per se. On the other hand, if
the price differences between brands in a particular category seem large relative to price
differences between categories, it would be necessary to control for price. Thus, I attempt
to determine the role of price, and whether we need to control for price, on a case-by-case
basis.
Assessing the quality of a firm’s products can be very difficult, particularly when
firms produce a range of the products in the same category at different price points.
Paints are a good case in point. In the following chart each point represents the price and
quality of a particular item from a manufacturer of paint for the year 1989. These data
come from Consumer Reports, and represent their estimate of quality relative to some

13
model of quality that they use. Assuming that their measure of quality is correct (and that
their measure of price is correct), and that their measure of quality has cardinal
properties, how does one go about determining, say, whether Sherwin Williams produces
paints of high or low quality when it obviously produces paints of both high and low
quality?
Paints
10
15
20
25
30
35
100 110 120 130 140 150Quality
Pric
e
Sherwin WilliamsOther companies/brandsPPG
The method I have chosen in these cases, although I would be the first to admit that
it is far from perfect, is to run a regression with a dummy variable for the vendors of
interest, such as Sherwin Williams. I then chart the coefficients of these dummy variables
for different time periods to determine the trend of a manufacturer’s quality relative to
price. Since I do not know the sales of the various types of paint for each manufacturer,
there would be no way to properly measure the average raw quality of paint produced,
even if I wanted to do so.
Some of the markets consist of retailers, who do not provide final consumer
products but instead provide an environment to help convince consumers to purchase
their wares. The measures of quality in this case include the helpfulness and friendliness
of the sales staff, the ambiance of the surroundings (the layout, looks, and utility of the
store), the taste of the buyers responsible for stocking the store, and other such measures.
I was only able to get values of these attributes from surveys of consumers that were
available in several publications. Price was listed as a separate attribute, and I thought it
best to keep it as a separate variable in this case. For one thing, prices reflect both the
wholesale prices and the retailer’s markup, but it is only the latter that should play a role

14
in the measurements although it seems unlikely that the former would not play a large
role in the rankings. Second, these retailers sell thousands of items and it is difficult to
gauge the average prices, to say nothing of average markups, with any precision. Third, it
isn’t clear what the precise nature of the relationship between price and quality is, so it is
not possible to accurately adjust quality by price to determine ‘bang-for-the-buck’.
Measuring the quality of a firm’s products is also difficult when a firm produces
many different products that cater to consumers in different markets. In the (Evergreen)
Personal Care and Cleaning 'market', for example, there are companies that produce
many products for very different markets. Gillette, which is best known for its non-
electric razors, also owns Braun, which makes a whole array of electronic products, as
well as Duracell brand batteries, Parker pens, and Right Guard antiperspirants. In this
case I try to determine which products generate the greatest share of revenues and get as
much quality information on them as possible, and then generalize the results to the entire
firm.
Finally, there are firms, such as Sony, that produce a whole host of products in one
or more industries. In these cases, I take quality measurements for the sample of products
reviewed, and hope that this measured quality is a good proxy for the firms total portfolio
of products.
Findings
The hypothesis to be tested is whether, for a firm, high product quality is related to
superior economic performance, as measured in total return to stockholders. The results
are unambiguously positive. Table 1 provides a heuristic categorization of the results.

15
QuadSupport for Primary
Hypothesis?Support for Secondary
Hypothesis?1 Discount Retailers: yes inconclusive2 Department stores3 Grocery Stores strong yes -4 Athletic Apparel yes very weak yes5 Paints and Coatings6 Personal Care and Cleaning strong yes -7 Desktop applications strong yes yes8 Desktop Computers strong yes neutral9 Internet Aggregators strong yes -
10 Networking11 Database: weak yes -12 Hard Drives: moderate yes -13 Consumer Electronics moderate yes neutral14 Car Rental Agencies yes -15 Cruise Lines medium-strong yes -16 Airlines strong yes -17 Cosmetics18 Discount Brokerage Firms quite strong yes -19 Telephone and Voice Carriers
Table 1: Qualitative Results
very weak no
weak no
inconclusive
weak to moderate yes
inconclusive
The first column lists the name of the industry or market. The second column
provides a general conclusion about whether, in that market, strong economic performers
also have high quality. The third column examines whether there is a relationship
between changes in economic performance and changes in quality, for the relatively
small number of markets where such a test was viable. In some cases there was no clear
winner/loser contrast to allow this form of test, and those industries have the results
straddling columns 2 and 3. In those cases, I looked at whatever variation did exist and
tried to determine whether it was consistent with the variations in quality.
It is also possible to provide a somewhat more quantitative slant on these results,
and these are provided in the Table 2. First, note that 15 of the 19 markets provide either
a weak or strong positive answer to the question of whether there is a linkage between
quality and economic performance. If we treat the results from each industry as an
independent event and assume that the evidence will either be positive or negative, we
can treat these results as if they were coin tosses and see what the likelihood would be of
generating these results if there were no positive relationship between these variables.

16
The logic is as follows. If there were no positive relationship between performance
and quality, then the likelihood of a no would be the same as a yes (50% chance of heads
or tails). To get 15 out of 19 "yes" verdicts would be like getting 15 heads out of 19
tosses. This would randomly happen less than 2% of the time, so we can conclude, on
this basis, that the evidence in favor of a linkage is strongly statistically significant (this is
found in the last row of Table 2, which provides results from the cumulative binomial
distribution).
I should note that I have tilted the results against the hypothesis when there was
uncertainty in measurements or outcomes, and there was some in a majority of the
markets, so that these results are actually very conservative and understate the strength
of the linkage between quality and economic performance.
Quad
Number of quality
measurements for high and low
performers
Number of measurements consistent with quality/performance linkage
Probability of getting these numbers if there is no positive linkage of quality and economic
performance1 Discount Retailers 9 8 3.900%2 Department stores 3 0 negative linkage3 Grocery Stores 6 6 3.125%4 Athletic Apparel 9 7 17.969%5 Paints and Coatings 14 3 negative linkage6 Personal Care and Cleaning7 Desktop applications 29 23 0.297%8 Desktop Computers 35 32 0.000%9 Internet Aggregators 14 9 42.395%
10 Networking 10 6 75.391%11 Database: 9 6 50.781%12 Hard Drives: 7 5 45.313%13 Consumer Electronics 7 5 45.313%14 Car Rental Agencies 25 21 0.091%15 Cruise Lines 5 4 37.500%16 Airlines 15 14 0.098%17 Cosmetics 3 1 negative linkage18 Discount Brokerage Firms 7 6 12.500%19 Telephone and Voice Carriers 10 2 negative linkage
Aggregating all observations 217 158 0.000%Industries one at a time 19 15 1.920%
Table 2: Quantitative Results

17
It is also possible to count in each market the observations that are consistent or
inconsistent with a positive linkage between quality and performance. The details can be
found in the discussions for each market.9 The total number of such quality comparisons
is found in column 2 of the chart and the number of comparisons consistent with a
positive linkage of quality and performance is found in column 3.
Treating each of these observations like the toss of a coin, as before, allows a
calculation of the likelihood that the results in a particular market might have arisen if
there were no linkage between quality and economic performance. For most of these
industries, the results are inconsistent with a hypothesis of no linkage between quality
and performance. The small number of quality observations for most industries makes it
hard to rule out the possibility of no positive linkage, but for 6 industries the likelihood of
generating the results we have without an underlying positive linkage are less than 1 in
20.
Finally, we can add all of these comparisons together as if each one was an
individual coin toss and determine the likelihood of getting 158 confirming comparisons
and only 59 detracting comparisons if there were in fact no positive linkage. The
likelihood is so close to zero that it couldn't be conveniently calculated. To give some
idea of how strong these results are, if only 129 instances had been found (instead of the
158 that were actually found), the likelihood of so many consistent observations would
still have been less than 1% if in fact no positive linkage existed. If 145 instances had
been found, the likelihood would have been only .0001%.
It seems safe to say, therefore, that these results are very strongly indicative of a
positive relationship between quality of product and the firm's economic performance.
The rest of this report provides the details, industry by industry and firm by firm,
that led to the creation of the two tables of results.
9 The particulars of how these comparisons were made are discussed at the end of the material for each market, but in general we looked to see if sharpbenders had above average quality, never-had-its had below average quality, and so forth.

18
I. Discount Retailers
Summary: Quality and performance seem linked for Ross and Kmart. With
additional effort, the performance-quality relationship for Wal-Mart and Dayton Hudson
becomes apparent.
Ross K Mart Dayton Hudson Wal-Mart
Sharpbender Never Had It Found It Lost It changed to Above
average
These companies are in the discount retail business. Dayton Hudson is primarily
known for its Target stores. Ross provides discounted clothing and other brand-name soft
goods, although the merchandise availability is unpredictable. Wal-Mart and Kmart both
are large retailers selling a wide assortment of discounted merchandise.
Fig 1.1: Retail Discounter Quality
0.2
0.4
0.6
0.8
1
1.2
1.4
1.6
1987 1992 1993 1994 1994.9 1997 1998
K-Mart Dayton (Target)
Wal-Mart Ross
Figure 1.1 measures quality as perceived by consumers, and normalizes the average
score to 1, with no adjustment for the standard deviation.10 Information on the
sharpbender (Ross) exists, unfortunately, for only two periods. Still, the primary test
gives unambiguous results. Kmart, the never-had-it, is the lowest in quality and, as will
10 These results are taken from Chain Store Age, Stores, and Consumer Reports.
19
be seen in a moment, also last in price. Ross, for the two periods in which it is scored,
does well, although there is very little useful information in the last period because the
scores are all so similar.
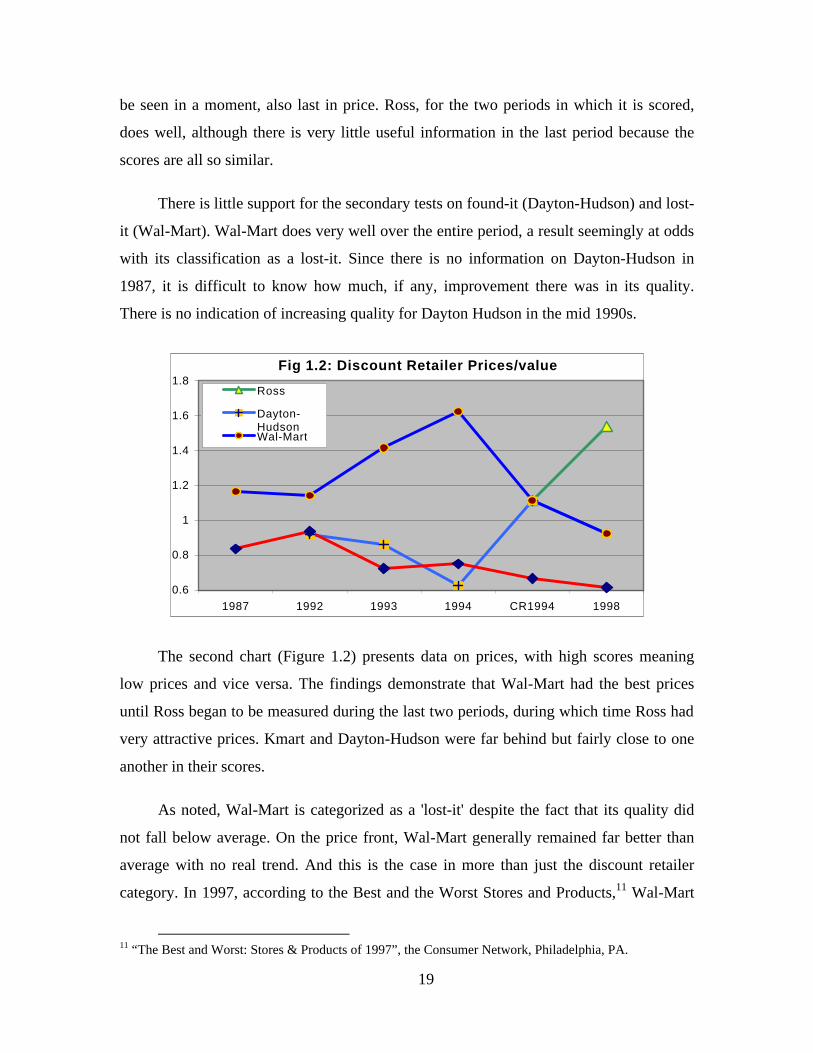
There is little support for the secondary tests on found-it (Dayton-Hudson) and lost-
it (Wal-Mart). Wal-Mart does very well over the entire period, a result seemingly at odds
with its classification as a lost-it. Since there is no information on Dayton-Hudson in
1987, it is difficult to know how much, if any, improvement there was in its quality.
There is no indication of increasing quality for Dayton Hudson in the mid 1990s.
Fig 1.2: Discount Retailer Prices/value
0.6
0.8
1
1.2
1.4
1.6
1.8
1987 1992 1993 1994 CR1994 1998
Ross
Dayton-HudsonWal-Mart
The second chart (Figure 1.2) presents data on prices, with high scores meaning
low prices and vice versa. The findings demonstrate that Wal-Mart had the best prices
until Ross began to be measured during the last two periods, during which time Ross had
very attractive prices. Kmart and Dayton-Hudson were far behind but fairly close to one
another in their scores.
As noted, Wal-Mart is categorized as a 'lost-it' despite the fact that its quality did
not fall below average. On the price front, Wal-Mart generally remained far better than
average with no real trend. And this is the case in more than just the discount retailer
category. In 1997, according to the Best and the Worst Stores and Products,11 Wal-Mart
11 “The Best and Worst: Stores & Products of 1997”, the Consumer Network, Philadelphia, PA.

20
was considered the second best value supermarket (second to Lucky), far ahead of Kroger
and Albertsons, and the second best value drugstore (second to Drug Emporium).
The only deviation here from a strict linkage between quality and performance is
Wal-Mart, and it turns out that its classification as a lost-it is questionable, based on both
stock market returns with more recent data, and accounting returns.
First, I examined Wal-Mart's stock performance.12 From 1990 to 1999 (the first
stock chart13) it clearly was the leader, followed by Dayton-Hudson and then Ross.14 If
one begins the period in 1991 (the second stock chart), however, a very different result
emerges.15 Now the leading firm is Ross, followed by Dayton-Hudson and Wal-Mart,
which are neck-and-neck. Kmart's trails the pack in both periods, befitting its lost-it
categorization.
12 I should note that this performance is only based on stock price whereas the McKinsey measures include dividends. 13 On these charts, ROST is Ross, WMT Wal-Mart, DH Dayton Hudson, and KM Kmart. 14 This is also true for the years between 1986 and 1990. 15 Similar results hold for different starting periods. If we begin in 1986, Wal-Mart is clearly number one and Ross number 2, but if we begin in 1987

21
Accounting returns tell a similar but somewhat less variable story.16 Wal-Mart has
earned above normal accounting returns although they have fallen over time.
Nevertheless, even with this decline, its accounting returns still represent a good
performance. Ross, on the other hand, has had a large increase in its returns, consistent
with its increasing stock price, moving from well below to well above average. Kmart has
the worst returns, and Dayton-Hudson generally somewhere in the middle, although not
very much better than Kmart on average.
Fig 1.3: Return on Assets
-15.00%
-10.00%
-5.00%
0.00%
5.00%
10.00%
15.00%
20.00%
1986 1987 1988 1989 1990 1991 1992 1993 1994 1995 1996 1997
Ross Dayton Hudson
Wal-Mart K Mart
16 These returns are defined as the sum of net income after taxes plus interest paid divided by the assets of the firm averaged over beginning and end of year values.

22
It seems inappropriate, then, to classify Wal-Mart as a lost-it based on economic
performance. Once we reclassify Wal-Mart as either a sharpbender or merely a winner,
the quality findings become more consistent with the performance rankings. Overall, the
linkage between quality and performance seems strong in this market. In Figure 1.1,
Kmart is below Wal-Mart in 6 of 7 instances, and below Ross in 2 of 2 instances. I
conclude, for quantitative purposes, that in 8 of 9 comparisons, quality is linked to
economic performance. If I had counted the number of times that Wal-Mart and Ross
were above average and Kmart below average, a stronger result would have emerged.
However, I want to handicap somewhat the hypothesis linking quality and economic
performance to reduce the chances of incorrectly claiming that a link exists between the
two if no such link actually exits.

23
II. Department stores
Summary: Seems at first a bad fit, but after reexamining idiosyncrasies and actual
performance, I conclude that there are idiosyncratic factors at work distorting the results.
Also, there is no evidence on the 'never-had-it' firm, Mercantile.
Sharpbender Never-Had-It Found-It Lost-It
Kohls Mercantile Sears Nordstrom
The following chart (Fig 2.1) rates three of the department store companies on
quality.17 The average score is 1. This chart reveals that Nordstrom has the highest
quality, Sears is in the middle but falling, and Kohl's has the lowest quality.
Fig 2.1: Department Store Quality
0
0.5
1
1.5
2
2.5
1983 1984 1987 1994 1997
Kohl’s SearsNordstrom
The second chart, Figure 2.2, represents the price, or value cosumers ascribe to the
store.18 Unfortunately, I was only able to get two years of such data. Kohl's and
17 Data for 1994 and 1998 come from Consumer Reports. Data for the other years come from Chain Store Age. Data from the latter source are based on measurements from a few major metropolitan areas. 18 This chart is based on data from Consumer Reports.

24
Nordstroms receive equal scores here, making it hard to separate their values on the
graph.
Kohls, which is supposed to be the sharpbender, does poorly in quality, although it
performs well in terms of price. This may reflect that fact that Kohls has tried to position
itself as intermediate between a discounter and department store. A trade journal refers to
Kohls' strategy as follows: "The company's formula is simple: sell brand name
department store merchandise at discount store prices. Kohl's stores resemble traditional
department stores…Although analysts liken it more to a department store than a
discounter, Kohl's strategy for selling brand name merchandise at promotional prices puts
it in competition with retailers on both ends of the value spectrum." 19 Thus Kohl's poor
performance on quality may reflect the fact that discounters normally have lower quality
service than the traditional department stores with which they are compared here. It does
not explain why its price/value is no better than Nordstroms, the store known for
preeminant service.
Fig 2.2: Department Store Prices or Value
0
0.2
0.4
0.6
0.8
1
1.2
1.4
1.6
1994 1997
Kohl's SearsNordstrom
Nordstrom, classified as having lost-it, has the highest quality, and generally good
value, according to the survey's upon which the results are based. According to industry
trade journals, Nordstrom's recent problems stem from a poor choice of inventory which
has alienated somewhat its fashion concious customers, an unwillingnes to use
computers, and no centralization of functions after the chain went national.20 The last two
19 See "Kohl's Strives for National Status", Discount Store News, April 1, 1996, page 3. 20 See "Great Service Wasn't Enough," Business Week, April 19,1999.

25
of these factors should tend to increase its cost structure but do not directly alter the
quality of Nordstrom stores. Nordstrom's weakness in spotting new fashion trends would
be expected to have been particuarly punishing since its customers are among the most
fashion concious of any store. 21 This appears to be a case where quality of service made
the company a success but has not been sufficient to overcome other problems that have
crept into the company after is ambitious expansion from its West Coast base.
Sears, which is categorized as a found-it, does poorly in the ratings. Its quality falls
from above average to below average and its attractiveness of price falls from average to
below average. On these charts Sears would appear to fall somewhere between a lost it
and a never-had-it with respect to quality or price. Sears position as a found-it, however,
is not very robust, and depends importantly on the timing of its stock price. Additionally,
it appears that its improved fortunes in the mid 1990s was based on misleading
information.22
Fig 2.3: Department Stores
-2.00%
0.00%
2.00%
4.00%
6.00%
8.00%
10.00%
12.00%
14.00%
16.00%
1986 1987 1988 1989 1990 1991 1992 1993 1994 1995 1996 1997
KohlsSearsNordstrom
21 See Chain Store Age, October 1996, page 28B, which reports the results of the Chicago Female Fashion Research Project. Regarding Nordstrom's customers, this report states: "This chain's shoppers are by far the most fashion-conscious, with dressing fashionably being a very important part of their lifestyles and an important way of expressing their individuality. The customers at Kohl's and Sears, on the other hand, are reported to be not very fashion conscious. 22 See “Sears's Growing Credit Business May Have Masked Retailing Woes,” by Joseph B. Cahill, Wall Street Journal, July 6, 1999. This article claims that Sears inflated its results with reckless credit card lending. This claim is repeated in "Sears Cuts Forecasts, Realigns Staff As Firm's Merchandise Chief Quits," By Calmetta Y. Coleman, Wall Street Journal, September 3, 1999.

26
In Fig 2.3 I have graphed the return on assets for these three companies. This seems
to better measure their fortunes. Kohls does the best, as befits a sharpbender.
Nordstroms's does fall over time, but not necessarily into lost-it territory. Sears performs
quite badly, although at the end of the period appears to have improved, although this
improvement, in hindsight appears ephemeral, due instead to its willingness to take on
extra risk. In each of the last two cases, there were other factors besides quality were
altering the financial prospects of these stores.
From this, if there were a linkage between quality and performance, and ignoring
idiosyncratic factors, we would expect Sears to be at the bottom, Kohl’s at the top, and
Nordstrom in the middle. The fact that Kohl’s is at the bottom in three of three cases,
implies that in 3 comparisons, there are 0 confirmations for the hypothesis.
In reality, however, I conclude that firms in this market suffer from too many
idiosyncrasies and mischaracterizations to really provide any useful information on the
overall hypothesis. Nevertheless, in the spirit of stacking the deck slightly against the
linkage hypothesis, I report the 0 of 3 statistics.
27
III. Grocery Stores
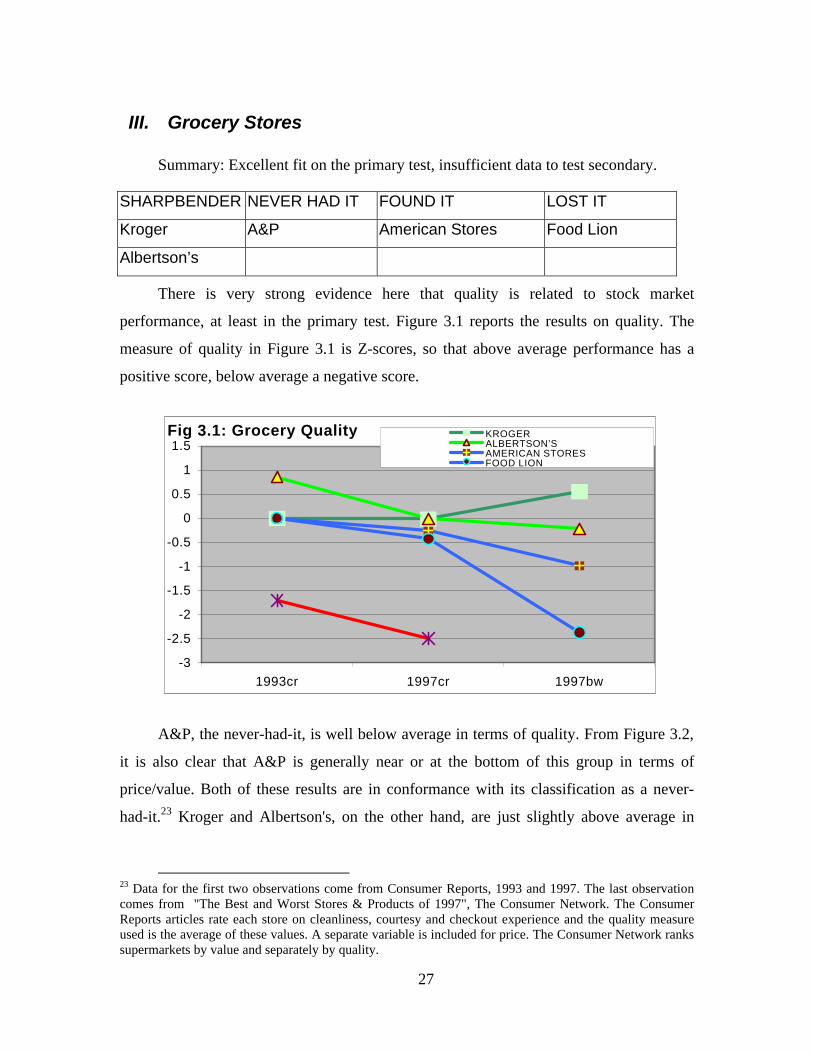
Summary: Excellent fit on the primary test, insufficient data to test secondary.
SHARPBENDER NEVER HAD IT FOUND IT LOST IT
Kroger A&P American Stores Food Lion
Albertson’s
There is very strong evidence here that quality is related to stock market
performance, at least in the primary test. Figure 3.1 reports the results on quality. The
measure of quality in Figure 3.1 is Z-scores, so that above average performance has a
positive score, below average a negative score.
Fig 3.1: Grocery Quality
-3
-2.5
-2
-1.5
-1
-0.5
0
0.5
1
1.5
1993cr 1997cr 1997bw
KROGERALBERTSON’SAMERICAN STORESFOOD LIONA&P
A&P, the never-had-it, is well below average in terms of quality. From Figure 3.2,
it is also clear that A&P is generally near or at the bottom of this group in terms of
price/value. Both of these results are in conformance with its classification as a never-
had-it.23 Kroger and Albertson's, on the other hand, are just slightly above average in
23 Data for the first two observations come from Consumer Reports, 1993 and 1997. The last observation comes from "The Best and Worst Stores & Products of 1997", The Consumer Network. The Consumer Reports articles rate each store on cleanliness, courtesy and checkout experience and the quality measure used is the average of these values. A separate variable is included for price. The Consumer Network ranks supermarkets by value and separately by quality.

28
terms of quality, and almost exactly average in price.24 The sharpbenders do appear far
better than the never-had-it.
Fig. 3.2: Grocery Price (Value)
-2.5
-2
-1.5
-1
-0.5
0
0.5
1
1.5
1993cr 1997cr 1997bw
KrogerAlbertson'sAmerican StoresFood LionA&P
Because I was only able to generate data beginning in 1993, it is not possible to test
the lost-it or found-it categories. Presumably the found-it (American Stores) should be
above average in the measurements (although rising from far below average to average
might be sufficient to cause the classification), and the evidence is not very strong here.
American Stores is slightly below average in quality but slightly above average in price
performance (i.e., low price).25
The corollary of this is that the lost-it should have fallen in quality, perhaps below
average. Food Lion’s quality is average to below average. It has good prices, however,
but is accorded low value.26 There is, however, an important exogenous event that took
place in 1992 that hurt Food Lion. The ABC television network broadcasted a prime-time
story claiming that the company had unsanitary conditions in its stores.27 This severely
24 It is worth keeping in mind that averages are calculated over a much larger number of supermarket chains than the five examined here which is how it can happen that almost none of them are above average. 25 American Stores are based on reviews of Lucky’s and Jewel’s, the grocery chains it operates. Although it also operates drug stores, grocery chains comprise 73% of its sales. American Stores was purchased by Albertson's in 1999. 26 Consumer Reports ranks stores by price, but the Consumer Network measures ‘value’. 27 This story was on ABC's Prime Time Live in November of 1992.

29
damaged Food Lion's reputation and it is possible that Food Lion's stock performance is
due, at least in part, to this story.
Examining the return on assets, we see confirmation of the general stock market
ratings, with a few surprises. In the period of time covered by our quality rankings,
Kroger and Albertson's dominate the economic performance. A&P has consistently bad
performance. Food Lion's performance drops from the late 1980s, but not to the level that
one might expect from a lost-it. The surprise is the poor performance of American Stores
-- no evidence here of it being a found-it. Yet American Stores does not do terribly well
on quality measures.
Grocery Stores
-5.00%
0.00%
5.00%
10.00%
15.00%
20.00%
1986 1987 1988 1989 1990 1991 1992 1993 1994 1995 1996 1997
Ret
urn
on
Ave
rag
e A
sset
s
Kroger Albertson'sA&P American StoresFood Lion
What, then, are the results from this market? First, the sharpbenders have much
better quality than the never-had-it. The sharpbenders are above average, the never-had-it
below average. With only four years of quality data, there is no test possible for the
found-it and lost-it, which may not even be properly categorized. Nevertheless, Food
Lion and American Stores have quality levels between the sharpbenders and never-had-it.
If we eliminate ties, all 12 data points in Figure 3.1 are properly lined up to support the
hypothesis that quality and performance are related. Limiting the observations to just
30
sharpbenders and the never-had-it, 6 out of 6 observations are consistent with this
hypothesis, and this more modest result is reported in the table of results.28
28 This is counted as the three data points from Consumer reports in 1993 and again in 1997. Since there are no results for A&P in 1997bw, that is excluded, even though its poor performance in the value rankings in that data source strongly indicate that it would have done poorly in the quality rankings as well, had it been listed.

31
IV. Athletic Apparel
Summary: Support for primary hypothesis. Data begin in 1990, making it hard to
test the found-it and lost-it tests although there is some very weak evidence consistent
with the lost-it.
Sharpbender Never-had-it Found-it Lost-it
Nike LA GEAR Adidas Reebok
Figure 4.1 presents results on the quality of athletic apparel, in the form of
sneakers, or athletic shoes, the leading product of these companies. 29 The average score
is a "1" on this chart.30
F ig 4.1: Athlet ic Apparel Q u a lity
0 .8
0 .9
1
1 .1
1 .2
1 .3
1 .4
1990 1 9 9 1 1992 1 9 9 3 1995 1 9 9 7 1998
N ike L A G E A RA d idas Reebok
There appears to be reasonable support for the claim that quality influences results
in this market. In the primary test, Nike unambiguously beats LA Gear. This is clearly
seen in Figure 4.1 where LA Gear clearly trails the pack. Nike does not, however, appear
to differ distinctly from Adidas or Reebok, but Nike is just about always above average,
even if not the highest. Still, it appears that the firm with the best economic performance
29 Quality assessments and prices came from Consumer Reports, Popular Mechanics and Tennis Magazine. 30 Averages are based on a larger number of shoes than just those from these manufacturers.

32
also has above average quality, and the firm with the worst performance has the lowest
quality.
In the secondary test, Reebok might appear to start out above average and fall
below average, befitting its categorization as having lost-it, but if the 1991 observation
were removed there would be no real change at all. Adidas is slightly above average in
each measurement, but since there are no measurements prior to this era it is impossible
to know if Adidas was below average and then rose in the rankings in conformance with
its classification as a found-it, although the quality results for Adidas are not inconsistent
with its performance. Thus there is very weak evidence consistent with the secondary
hypothesis.
Measuring the quality of output in this market suffers from one of the difficulties
encountered elsewhere as well, that being due to the large number of offerings by each
manufacturer covering various price and quality ranges. The ratings, however, are usually
based on only one or two shoes from a given manufacturer, and thus I merely use the
average values for each manufacturer to generate that manufacturer's score.
Fig 4.2: Attractiveness of Athletic Shoe Prices
-40%
-20%
0%
20%
40%
60%
80%
90 91 92 93 95 97
Nike ReebokLA Gear AdidasOthers

33
As far as pricing, LA Gear is the most attractive, with Reebok and Adidas the most
expensive.31 From these observations it would appear that LA gear is going for the
bottom of the market -- low prices and low quality. From its position as a never-had-it,
this was not a winning strategy. Pricing does not seem to have much of an independent
role in this market.
How many observations are consistent with the hypothesis that quality affects
economic performance? Both LA Gear quality observations, and 5 of the 7 Nike quality
observations are consistent with this hypothesis.
31 Positive numbers indicate below average prices and vice-versa.

34
V. Paints and Coatings
Summary: Results appear inconsistent, but it isn't clear that there is a primary test
here. Missing data for important components of company sales, so this is at most a weak
contradiction.
Sharpbender Found-it Lost-it Never had it
Valspar PPG Industries Sherwin Williams
The primary test is also not as clean here as I would like. The never-had-it does not
appear to be properly classified according to the McKinsey methodology. According to
the McKinsey listing, Sherwin-Williams stock generated average or above average
returns in each of the two time periods, which implies that its classification is a mistake.32
My examination of stock market returns (not shown) indicated that while Sherwin
Williams did not perform as well as Valspar, it performed almost identically to PPG, the
supposed found-it. Accounting returns on assets shown in Figure 5.1, however, indicate
that Sherwin Williams deserves its never-had-it classification. 33
Fig 5.1: R e turn on Assets
0
0.05
0 .1
0.15
0 .2
0.25
0 .3
1989 1990 1991 1992 1993 1994 1995 1996 1997 1998
PPGVa lsparSherwin W illiam s
32 McKinsey lists Sherwin Williams 5 year returns as 20% above comparable firms in the first five year period and even with comparable firms in the second period, whereas Valspar is 50% above in both comparisons and PPG is 10% below and 20% above comparables in the two periods. 33 Defined as operating income before taxes divided by total assets.

35
This is a difficult market to measure quality. There are many types of paint and
many different quality gradations. I focus on consumer coatings, otherwise known as
'architectural coatings', since that is the market for which quality ratings were found. For
some of these companies, however, architectural coatings are not a very important part of
their business.
Sherwin Williams is one company where architectural coatings are important. It
makes paints and sells them largely through its own stores to consumers. However, its
success depends not only on its paints, but also in part on how well it manages its stores.
Valspar, on the other hand, while making consumer paints, also has many industrial
products in the coatings market. Consumer coatings are only 34% of its business.34 PPG
produces many glass products and chemicals in addition to its coatings business which is
about half of its sales.35 PPG's coating business, however, has only a small component
devoted to consumer paints. Since the measurement for PPG's product quality only
represents a small portion of its business, it is not clear how representative that would be
of its entire product line and even Valspar has a minority of its revenues generated in this
market.36
We would need to assume that consumer paints and coatings are indicative of these
firms' quality of products in order to calculate average quality (price adjusted) of product.
Various manufacturers produce and sell paints, but the data do not distinguish between
retailers that put their name on paints produced by others and those paints for which the
producer can be easily identified.
Since there was usually a range of paints for each producer for each quality review,
I performed a regression for each review using the quality of the product as the dependent
variable and price and firm dummies as independent variables.37 The coefficient for each
firm then represented the fixed effect of that firm on the quality-price relationship. That is
34 From Valspar's 1998 annual report. 35 From the company’s website. 36 The lost-it in this industry, RPM, is not included because we could not find any of its products reviewed. Most of its consumer products are more in the line of sealants or corrosion fix-its, such as RustOleum. 37 Since we are only interested in relative positions by year, each coefficient was scaled by the average absolute value of coefficients in that year’s regression in order to reduce the variation in the measured coefficients between years.

36
to say, if a firm generated a positive value, then its quality was above normal for the
prices charged.
Fig 5.2 Quality of Achitectural Paints
-3
-2
-1
0
1
2
3
88.3 88.9 89 90 91 93 94 97
sw ppg val
The results, found in Figure 5.2, represents price adjusted quality, and indicate that
Sherwin Williams produces better paint than Valspar in 6 of 7 instances, including 2
where it is a virtual tie.38 PPG and Sherwin Williams, on the other hand, are quite close.
Whether this is to be taken as evidence against the hypothesis, or not, depends on
whether the quality of architectural paints is to be taken as a measure of the quality of
other products for the firms that specialize in other products and whether this technique
properly captures product quality. If we do not adjust by price, for example, we get a
somewhat different result found in Figure 5.3.39 Here, Sherwin Williams wins 4 of 7
comparisons, including 2 close calls.
38 The results are measured as Z-scores so that positive values are above average and the values on the horizontal axis measure the number of standard deviations above or below the mean. 39 Since price appears to play a very small role in some markets, it might not be all that surprising if it were to play a small role here. Theory, however, would argue that price should play an important role.

37
Fig 5.3: Paint Quality no price adjustment
-1.5
-1
-0.5
0
0.5
1
1.5
88.3 88.9 89 90 91 93 94 97
sw ppg val
Overall, I don't think we can have great confidence in these results. Taking them on
their face, however, and following my policy of handicapping somewhat the hypothesis
that holds a positive relationship to exist between quality and economic performance, I
count, from Figure 5.2, 2 of 7 instances where the never-had-it is below average and 1 of
7 instances where the sharpbender is above average, providing 3 of 14 observations
consistent with the hypothesis.

38
VI. Desktop applications
Summary: Excellent Fit both primary and secondary.
SHARPBENDER NEVER HAD IT FOUND IT LOST IT
Microsoft Borland Lotus WordPerfect
This market consists of desktop computer programs, the most important of which
are wordprocessors and spreadsheets. Each of the four firms above produced products in
one or both of these categories.
One finding in software markets is that they tend toward winner-take-all results. In
such circumstances, firms with good but not the best products will not necessarily do any
better than firms with weak products.40 Therefore, being just above or below average in
terms of quality or performance will not necessarily translate into above or below average
performance.
Fig 6.1: Comparison Spreadsheet Ratings
2/1/
98 P
C W
orld
2/18
/97
PC M
agaz
ine12
/1/9
6 B
yte
4/1/
96 H
ome
Off
Com
p
2/28
/94
INFO
WO
RL
D
2/8/
94 P
C M
agaz
ine11
/10/
92 P
C M
agaz
ine
10/1
2/92
INFO
WO
RL
D
12/3
1/91
PC
Mag
azin
e
9/1/
91 P
C W
orld
6/1/
91 B
yte
7/1/
89 P
erso
nal C
ompu
ting
9/1/
88 P
erso
nal C
ompu
ting
5
6
7
8
9
10
Rat
ing
s
ExcelLotusQuattro
40 This is more fully established in my book with Stephen Margolis, “Winners, Losers, and Microsoft: Competition and Antitrust in High Technology" Independent Institute, 1999. The book contains a much more detailed discussion of these markets and a more complete listing of markets than is provided here. Microsoft did well in most of those markets also.

39
Microsoft produced superior quality products in these, its major markets, as shown
first, in Figure 6.1 representing spreadsheet performance, and then in Figure 6.2
representing word processing performance. Its dominance in spreadsheets is quite
overwhelming.41 In word processing, it is only in the Windows word processor market
that Microsoft had a clear advantage. Microsoft’s prices were also somewhat on the low
side, and in fact there is strong evidence that Microsoft played the role of price cutter in
these markets.42
Borland's spreadsheet product was not bad, but its good-but-not-great performance
did not lead to either much market share or profitability, thus its poor stock market
performance is consistent with its quality ranking.
WordPerfect produced high quality products in the mid to late 1980s as reflected in
its very good performance in the DOS word processor market. But its Windows
wordprocessor was not of high quality. Perfect Office, a product combining Borland's
products with WordPerfect's was not well reviewed compared to Microsoft's offerings.
Thus WordPerfect’s categorization as a lost-it is fully in keeping with the quality changes
in its products.
F ig 6 .2: W o r d P r o c e s s ing
7/1/
87 P
C W
orld
6/1/
88 P
erso
nal C
ompu
ting
7/1/
89 P
C W
orld
8/1/
89 C
ompu
te
3/5/
90 P
C W
eek
p. 9
2
8/1/
90 P
erso
nal C
ompu
ting
12/1
1/90
PC
Mag
azin
e
1/7/
91 In
fow
orld
2/18
/97
PC
Mag
azin
e
11/2
1/95
PC
Mag
azin
e
2/8/
94 P
C M
agaz
ine
11/9
/93
PC
Mag
azin
e
8/1/
93 P
C C
ompu
ting
5/24
/93
Com
pute
rWor
ld
2/25
/92
PC
Mag
azin
e
2/10
/92
Info
wor
ld
6 .0
6 .5
7 .0
7 .5
8 .0
8 .5
9 .0
9 .5
1 0 .0
1 0 .5
A m i Pro M S W o r d D O SM S W ord W indows W ordPer fec tW ordPer fec t fo r W i n d o w s W ordS ta r
41 In these charts the top product is given a score of 10 and all other products are scaled accordingly. 42 The complete listing of prices is available in my book. Microsoft tends to be in the middle of the pack in any single year, but prices did not start to decline until Microsoft began to dominate these markets.

40
Lotus, in the 1980s and early 1990s derived most of its revenue from its ‘1-2-3’-
spreadsheet product. The chart on spreadsheet quality indicates that 1-2-3 was not a high
quality product. Stock market performance in this period was in line with the poor quality
of Lotus’ main product. Lotus’ word processor, Ami Pro, was quite good, but not as good
as Microsoft Word, and given the winner-take-all characteristics of these markets, Lotus
did not benefit from its second place quality showing. Lotus’ fortunes turned around
when it introduced an entirely new product, Lotus Notes. This is a category of program,
essentially started by Lotus that allows individuals working together on a project to
collaborate and communicate with one another. In nine product reviews that I was able to
find between 1993 and 1998, Lotus won eight of them.43
To count the observations consistent with the hypothesis, I will focus on
spreadsheets and wordprocessors and count Microsoft wins out of the total of all tests.
Microsoft won 11 out of 13 spreadsheet comparisons and 12 of 16 word-processing
comparisons for a total of 23 out of 29.
43 June 93, PC magazine; Nov 95, InfoWorld; Sept 96, ComputerWorld; Oct 96, PC magazine; Dec 96, Byte; Dec 96, InfoWorld; Apr 97, InfoWorld; May 97, PC magazine; May 98, PC magazine.

41
VII. Personal Care and Cleaning
Summary: Strong support of the primary test. Insufficient data to test secondary
hypothesis.
SHARPBENDER NEVER HAD IT FOUND IT LOST IT
Gillette Church & Dwight Clorox Carter-Wallace
These firms are not in the same economic markets. In order to examine the quality
of products I had to estimate the quality of each firm’s products in the markets where it
competes.
Gillette
Gillette produces non-electric razors under its name, Duracell batteries,
antiperspirants (Right Guard), various products under the Braun brand including electric
razors, coffee makers, food processors, and electric toothbrushes, pens (Parker,
Papermate) and Oral B toothbrushes. Gillette is best known for its razor blades, its largest
moneymaker, which generated about one third of profits in 1988, and about half of its
profits in 1998. The introduction of the Sensor cartridge razor in 1990 is a textbook case
of how to do things right,44 and includes much anecdotal evidence that the razor was far
superior to the competition. In fact, there seems not to have been any serious competition
by the mid 1990s.
44 In fact, it has been the subject of a Harvard Business School case study by Pankaj Ghemawat

42
Fig 7.1: 1989 Cartridges and Disposables
0
20
40
60
80
100
0 1 2 3 4 5Price
Qu
alit
y
Gillette Cart Other CartridgesOther Disp Gillette Disp
Figures 7.1 and 7.2 provide information about these products. First, disposable
razors were of lower quality than cartridge razors. Further, in both the disposable and
cartridge realms, Gillette was on the expensive side, with a very small quality advantage
that seemed hardly able to justify the higher price.
By 1995, after the Sensor came out, an important shift in consumer preference from
disposables to cartridge based systems had largely been completed. Disposables remained
inferior to cartridge razors, but there seemed to be far fewer disposables. Now, however,
Gillette had the highest quality in each category. In fact, it practically owned the cartridge
category because its main competitor, Shick, felt obliged to license Gillette's technology
to stay competitive.45
Fig 7.2: 1995 Cartridges and Disposables
0
1
2
3
4
5
6
0 2 4 6 8 10 12price
qu
alit
y
G illette Cart Other CartO ther Disp Gilette D isp
.
45 Forbes, 2/4/91, by Subrata Chakravarty, page 82.

43
Braun products, another major category for Gillette, do not do quite so well but still
perform adequately in the quality dimension. In a 1992 test of electric toothbrushes,
Braun was first of eight, with one of the highest prices.46 In a 1994 test of food
processors, it was slightly below average with a price in line with its performance.47 In a
1995 test of coffee makers, it was third of six for basic models, with the highest price,
and second of six for programmable models, with the highest price.48 In a 1988 coffee
maker test, it had the highest quality and a middling price.49 In a 1995 test of electric
razors, it came in slightly above average with a price that was slightly above average.50
Duracell, a recent acquisition, appears to be another ‘best-in-class’ product. In a
1997 set of tests in Consumer’s Reports it performed very well in tests, coming out first
(out of eight) in two tests and third in another. Duracell also has high prices, coming in
second highest in each of these tests.51 Popular Electronics, in its 1998 tests, found
Duracell to be the best product. 52
Overall, it seems fair to say the Gillette produces high quality products, although
whether they are the best value is unclear. This has allowed Gillette to price its products
at a premium level without handicapping its market share. I caution that this may not
apply to all products equally. The price differential between the high-end razors and low-
end razors is in the vicinity of a few dollars. Even though the razors would be purchased
every few weeks, the dollar amount of this quality differential remains quite small.
Whether this strategy would work in industries where the cost of quality is far higher in
absolute terms is unclear although prices have played a smaller role than we might have
expected in several industries.53
46 Consumer Reports, Dec. 1992, Electric Toothbrushes, pg. 171 47 Consumer Reports, Dec. 1994, Food Processors, pg. 134 48 Consumer Reports, Dec. 15, 1995, Coffee Makers, pg. 104 49 Consumer Reports, Dec. 1988, Coffee Makers, pg. 56 50 Consumer Reports, Oct. 1995, Electric Shavers, pg. 650 51 Consumers Reports actually suggests that the differences in longevity are small enough that consumers should buy batteries based on price and ignore the quality ratings altogether. 52 Popular Electronics, January 1998, by Stephen Booth, pg. 12 53 Buzzell and Gale, in the PIMS Principles argue that products with high prices are generally sold in more competitive markets.

44
Since Gillette is a sharpbender, and produces high quality products, this is
consistent with a hypothesized positive linkage.
Church and Dwight
Church and Dwight (C&D) produces several baking-soda based products under the
Arm and Hammer brand. Examples are antiperspirant, toothpaste, laundry detergent, cat
litter, carpet deodorizer, and air freshener.
The reviews of C&D's products indicate that they are quite weak in the quality
dimension. For example, in 1992 its toothpaste product was ranked 25th out of 29th in
terms of quality and was more expensive than most of the superior alternative products.54
In 1991, C&D's entry in the laundry detergent market ranked 25th out of 29th, although it
was less expensive than most.55 In a 1995 review of powdered laundry detergents, C&D's
entry came in 13th out of 18, although its liquid product came in 5th out of 17.56
This relatively poor quality on the part of the never-had-it is consistent with the
hypothesized positive link between performance and quality.
Clorox
The data on Clorox cleansers begin in the early 1990s. They indicate that Clorox’s
quality was somewhat above average, as were its prices. In a 1991 comparison, Clorox
laundry detergent was rated 10th out of 13, and was more expensive than most.57 The
laundry detergent was discontinued within two years. In a 1991 test of bathroom
cleansers the Clorox product was 7th out of twenty four, and the second most expensive.58
A 1993 test of all-purpose cleansers found the Clorox products to be better than average,
scoring fifth and tenth out of 21 products, with prices slightly below average. Clorox’s
drain opener, Liquid-Plumr, was in the middle of the pack in 1994 in terms of quality and
54 Consumer Reports, Dec. 15, 1992, Toothpaste, pg. 177 55 Consumer Reports, Feb. 1991, Laundry Detergents, pg. 100 56 Consumer Reports, Feb. 1995, Laundry Detergents, pg. 92 57 Consumers Reports, February 1991. 58 Clorox bleach, which was not specifically made as a bathroom cleanser, came in fifth, with the lowest price by far. Tilex, the product Clorox created specifically for this job, was the second most expensive.

45
was slightly more expensive than most. In an August 1996 test of scouring cleansers,
Clorox Soft Scrub was in the middle of the pack.
In late 1998 Clorox acquired First Brands, a maker of (Glad) storage bags and cat
litter. In late 1996 it acquired Armor All, the maker of car care products.
Clorox appears to be a firm that has produced somewhat above average products at
above average prices. Whether this performance was consistent with an increase in
quality requires information from an earlier period, and I have been unable to unearth
information sufficient to answer this question.
Carter-Wallace
This company is classified as a lost-it. The company’s primary products are Arrid
antiperspirant, Trojans condoms, Pearl Drops toothpaste, Nair hair remover and Answer
home pregnancy test. In the late 80’s and early 90’s, C-W also derived a fair percentage
of sales from prescription medications -- Felbamate, an epilepsy drug, and Organidin, a
cough syrup. At one time, C-W also manufactured Miltown tranquilizers.
Although I looked at the quality rankings for condoms, toothpaste and home
pregnancy test, there were no definitive conclusions on the quality of those products, or,
more importantly for a lost-it, changes in quality. And it became clear early on that it
would be fruitless to try to explain Carter-Wallace’s fortunes based on these factors.
Exogenous factors, explained below, were the dominant factors in Carter-Wallace’s
vicissitudes.
C-W’s decline can be attributed quite easily to several important problems with its
drug business that caused it to essentially leave that business altogether in 1994.59 In
April of 1993 the FDA ordered Carter-Wallace to stop marketing its Organidin
prescription drug (a cough suppressant) due to possible cancer causing effects. At the
59 According to an article in the October 5, 1994 Wall Street Journal, by Molly Baker, pg B6, Carter-Wallace was to take a $49 million second-quarter charge to cut its workforce by 23%, eliminating most pharmaceutical research and closing some plants. The actions were prompted by the production halt of Organidin and FDA restrictions on Felbamate. Carter-Wallace said it would take another charge of as much as $70 million to write-off costs related to Felbamate.

46
time, Organidin contributed $75m in revenues (11% of total sales) and 37% operating
profit. In August of 1993 the FDA approved Felbamate, the first new anti-epilepsy drug
in over a decade, and a prime mover in Carter-Wallace’s stock price rise that occurred in
1991.60 However, in August of 1994 the FDA and Carter-Wallace urged doctors to
immediately withdraw patients from taking Felbamate, and eventually a class-action suit
ensued. The FDA in April of 1993 ordered C-W to stop marketing and eventually take off
the market Organidin, which was found to cause cancer in lab tests on animals. In 1994,
C-W also ended production of Deprol, an antidepressant, after the FDA withdrew its
approval because it lacked evidence of efficacy.
It is possible to claim that these difficulties were due to the quality of the products,
since they had important negative side effects. However, I think that this would be
stretching the definition of quality. It is best that we should treat these as exogenous
events independent of the quality of the products. Carter-Wallace, therefore, can not be
used to test main hypothesis.
Although the evidence in this industry is strongly consistent with the hypothesized
link between quality and performance, the fact that the firms are in different industries,
and that there are some many different products precludes a simple quantitative test.
60 According to an article by Thomas Jaffe in the September 16, 1991 issue of Forbes (pg.209) a recent 30% stock gain was due to expectations that Carter-Wallace would file a drug application for Felbamate, which could eventually rack up sales of $100 to $200 million annually.
47
VIII. Desktop Computers
Summary: strong support for primary; cannot really test secondary.
SHARPBENDER NEVER HAD IT FOUND IT LOST IT
Dell Packard Bell HP AST
This is a McKinsey industry, but I limited the analysis to desktop PCs although the
original list of firms included some who had a minor presence in the PC market.
Removing these firms left a hole in the never-had-it category, which I filled with Packard
Bell.
Some explanation of Packard Bell as a never-had-it is obviously in order. Packard
Bell has not been publicly traded, so there are no stock market returns to measure. It has
not released financial data thus accounting returns are unavailable. It is possible,
however, to piece together its performance through bits and pieces of information
reported in the press.
Packard Bell took its name from an old radio/television manufacturer in the late
1980s and became one of the largest producers of low priced PCs in the early and mid
1990s, sold largely ugh mass merchant retailers. A flattering article in early 1992
discussed it rapid rise in market share and also mentioned, surprisingly in the face of
other evidence I report on below, that Packard Bell received high quality ratings. 61 The
facts appear to be quite to the contrary.
An article in 1993 reports:62
“Still, Packard Bell's title as king of the retailers is getting a lot harder to hang on to. For the five years ended in 1991, it had a net loss of $10
61 Packard Bell Demystifies Computer Buying, by Patrice Apodaca, Los Angeles Times, January 7, 1992, Part D; Page 9A. “According to a couple of recent surveys, Packard Bell's customers also give the computer maker high marks. Verity Group, a market research firm in Diamond Bar, found in a nationwide survey of more than 5,000 desktop computer owners conducted from November 1990, to November 1991, that Packard Bell ranked the highest in customer satisfaction. The common theme among those responding, Verity President Bill Matthies said, was that a Packard Bell computer "doesn't break and it's easy to use." Another survey, released last year by J. D. Power & Associates in Agoura Hills, found that Packard Bell ranked second among home-business computer users in terms of overall customer satisfaction”. 62 “Packard Bell Discovers A Bon Ami,” by Larry Armstrong, Business Week, July 5, 1993, Pg. 103.

48
million, which threatened to stall future growth… Packard Bell's sales spurted 37%, to $ 925 million, last year, and it expects revenues to pass $1.2 billion this year. That kind of selling pace .. has also led to a huge headache -- a high rate of returns. The cost of those returns even cost it an initial public offering, planned and then withdrawn last year. According to its IPO filing with the SEC, more than $ 140 million worth of shipments in 1991 -- about 17% -- were returned to the factory.”
By 1996, after two outside infusions of cash, things were deteriorating:63
Long known as a maker of discount computers, Packard Bell often teeters on the edge when it comes to the bottom line. Company officials admit that in recent years the firm had no earnings or slim margins at best. ... Tight margins prompted Packard Bell to seek NEC and Groupe Bull of France, which sold it Zenith Data, as partners. Each company now owns 19.9% of Packard Bell and each holds two of the company's nine board seats.
Finally after selling a majority share to NEC of Japan and laying off over 40% of
its workers:
Packard Bell NEC has literally bled market share and red ink -- $ 1.5 billion over the past three years. Packard Bell, with which the Japanese electronics giant merged its U.S. PC operations in a $ 300 million deal in 1996, has been in free fall.64
With this, I think, it is safe to label Packard Bell as a never-had-it.
There are two dimensions involved in the quality of personal computers. First,
there is the performance of the computer itself. Performance differences usually are
measured in terms of speed – how fast a calculation is performed, how quickly the screen
can draw a complex diagram. Performance differences in similarly configured PCs,
however, might be thought to have less variation than is the case for products in many
other industries since PCs are almost always made from off the shelf parts, tending to
decrease quality differences across brands using the same components.
63 Packard Bell Plugs Ahead On Long Trek To Profits, by Russ Britt, October 17, 1996, Pg. A8, Investor's Business Daily. 64 Packard Bell NEC Hits The Restart Button, by Peter Burrows, June 28, 1999, Pg. 38, Business Week.

49
Fig 8.1: Reliability and Service
-2
-1.5
-1
-0.5
0
0.5
1
1.5
2
1990 1992 1993 1993.1 1994 1995 1996 1998
AST Dell
HP PB
The second element of quality is the reliability and service performance of vendors.
Computers are more complicated products than many others and often require repairs, or
at least some serious consumer handholding, since problems can arise with either the
hardware or software, often caused by the behavior of befuddled consumers. Although all
products have this repair and service component, it is probably of far greater importance
for computers, because consumers have less experience and the product is far more
complicated.
Reliability and Service measurements are reported in Figure 8.1 for the four
firms.65 They are ranked by Z-scores, so that any positive score represents an above
average performance. It is clear that Dell and HP are both considerably above average
and AST is close to average. Packard Bell is considerably below average, even in the
early 1990s, contrary to the article mentioned above that lauded Packard Bells quality.
The difference between the sharpbender and the never-had-it is very large. Again, it
is difficult to check the lost-it and found-it categories since the time periods do not mesh,
but HP looks like it could be a found-it, although AST does show much evidence of a
lost-it.
65 Reported in PC Magazine from reader surveys. Averages are based on a large number of computer brands.

50
The results for actual computer performance (bang-for-the-buck, so it includes
price) provide similar confirmation of the importance of quality. Again, it is not clear that
price plays an important separate role.66
F ig 8 .2: PC 'Bang for buck'
-2.5
-2
-1.5
-1
-0.5
0
0.5
1
1.5
2
2.5
1988
1989
pcw
1989
1990
1991
1991
1992
pcw
1992
1992
.1
1992
PC
C
1993
1993
PC
C
1995
PC
C
1994
PC
C
1995
1995
.1
1996
pcc
1997
ppc
1998
1998
.1
AST ResearchDe llHew lett PackardP B
Dell computer is clearly the best computer in terms of performance, in line with its
classification as a sharpbender. Its superiority is more apparent here than in Figure 8.1.
Packard Bell does badly in the few reviews in which it is rated. AST seems to fall
slightly, but so does hp. Overall, between both sets of measurements, there is little
evidence here of HP as a found-it or AST as a lost-it.
To test our main hypothesis I compare Dell and Packard Bell to the average score
in both of these charts. In terms of reliability (8.1) Dell is above average in 8 of 8
instances, Packard Bell below average in 7 of 7 instances. In chart 8.2, Dell is above
average 17 of 20 times, and Packard Bell below average in 3 of 3 instances. In total 32
out of 35 measurements are consistent with a positive linkage between quality and
economic performance.
66 Packard Bell does not show up in most of these rankings, apparently, because it didn’t want to be tested. These magazines ask manufacturers to send them machines for testing and Packard Bell did not often send in machines and so was not included.

51
IX. Consumer Electronics
Summary: Good fit on primary. No support for secondary tests.
Sharpbender Never-had-it Found-it Lost-it
Sony Zenith Matsushita Pioneer
The very large number of products made by firms in the consumer electronics
industry, defined as products largely used for entertainment – television, radio, stereos –
makes the task of determining quality a difficult one. Although the focus is on consumer
electronics, some of these firms do a considerable business in other industries. Sony, for
example, has moved into computers. Matsushita is a large conglomerate that is involved
with many businesses including automation controls, wiring and building products. Still,
each firm is heavily involved in consumer electronics.
The primary test will compare Sony, the sharpbender, with Zenith, the never-had-it.
The measure of quality comes from Consumer Reports reviews of home electronics
products – televisions, VCRs, camcorders, receivers, speakers, integrated stereo systems,
CDs, and cassette players. In each year several of these products are reviewed. But in
each year there is a portfolio of such products reviewed that, hopefully, provides
sufficient information to allow correct generalizations in making quality judgments.
Figure 9.1 illustrates the overall finding on quality. Quality scores were calculated
by averaging the Z-scores for each producers reviewed products. Positive values are
above average and negative values indicate below average performance.

52
Figure 9.1: Consumer Electronics
-2.5
-2
-1.5
-1
-0.5
0
0.5
1
1.5
2
2.5
1986 1987 1991 1992 1996 1997 1998
Sony
Matsushita
Pioneer
Zenith
Since the data go back to 1986, the time periods mesh fairly closely with the
McKinsey time period, except that two additional years are included. Figure 9.1 reveals
that through 1996 Sony produced the highest quality and above average products,
consistent with its role as a sharpbender. Zenith is below average for the early
observations but rises above average from 1992 through 1997. Zenith’s position as a
never-had-it has not changed in the later years since Zenith has essentially gone
bankrupt.67 The primary hypothesis is only partially supported, therefore.
Pioneer, the lost-it, does as badly or worse than Zenith, according to the quality
results and never appears to have ‘had it’ so as to later have lost it. Matsushita, the found-
it, does not provide any evidence of an increase in quality over the period. Thus there is
no evidence here to support the secondary hypotheses. Neither however, is there any
evidence to support the contrary position of a negative relationship between quality and
economic performance.
67 According to a company data report on Zenith by FIS (owned by Moody’s until sold to Mergent in 1998) “The company has incurred losses in all but one of the years since 1985, and is currently experiencing severe financial difficulties. The company's projected cash flows for 1998 and future years were insufficient to meet all of the company's working capital requirements, cash debt service obligations and capital expenditures. As a result, during the first quarter of fiscal 1998, management developed and began implementing an operational restructuring to enhance the long-term viability of the company by reducing production costs and concentrating on areas in which the company believes it can operate profitably.”

53
To quantify these results for the primary hypothesis, we count the number of times
Sony is above average and the number of time Zenith is below average. This works out to
11 out of 14, which might seem overly strong. Alternatively, we can count the number of
times Sony surpasses Zenith, which is 5 of 7. In keeping with the conservative nature of
this analysis, the 5 of 7 will be used.

54
X. Hard Drives (Systems components)
Summary: Moderate support, in that the poorest performer in terms of profitability
also had the lowest quality scores, and the firm was an outlier in each dimension. The
difference between the other firms during the time period for which quality data were
found was too small to classify them separately from one another.
Sharpbender Never-had-it Found-it (reclassified as Moderate)
Quantum (reclassified as “Moderate”) Maxtor Seagate, Western Digital
This is a McKinsey ‘industry’, but the firms were not all in the same market, and it
was not possible to obtain useful quality data for several of the firms. One market where
it was possible to generate quality data was the hard drive market, which included three
firms in the original McKinsey grouping (Quantum, Seagate, Western Digital). A fourth
company (Maxtor) appeared in many of the product quality comparisons, and since
Maxtor also specialized in hard drive production, I included it in the sample.
The quality data cover the period 1993 to 1998, which does not mesh very well
with the McKinsey years. At best, part of the second period used in the McKinsey study
overlaps with this data, and several years in this data extend beyond the McKinsey data.
In addition, Maxtor only has stock market data for the last two years and thus could not
be categorized using stock market returns.

55
Fig 10.1: Hard Drive Manufacturer Return on Assets
-70%
-60%
-50%
-40%
-30%
-20%
-10%
0%
10%
20%
30%
199819971996199519941993199219911990
QuantumMaxtorSeagateW estern Digital
Instead, it is useful to turn to an accounting measure, the return on assets. 68 Figure
10.1 portrays the return on assets for the four firms.69
Only one firm differs from the others by any significant margin in the 1993 to 1998
period, and that is Maxtor, which performs very poorly relative to the other firms.70 The
test then, in this industry, will have to be Maxtor’s quality relative the others, which are
not expected to differ greatly from one another.
68 Return on assets is measured as the sum of net income after taxes plus interest paid divided by total assets. For 1990-1992 we could not determine interest paid and so for those years the return is measured using only net income and total assets. The difference was slight relative to the variation in returns over time and across firms. 69 These figures are taken from the reports filled with the SEC as reported in Edgar Online. 70 Maxtor’s average return on assets over this period was –21%, compared to 6% for Quantum and Western Digital, and 3% for Seagate.

56
Fig 10.2: Hard Drive Quality
-2
-1.5
-1
-0.5
0
0.5
1
1.5
2
1993 1993 1994 1994 1994 1995 1996 1997 1997 1997 1998 1998
Seagate QuantumWestern Digital Maxtor
Figure 10.2 provides the quality measurements.71 These are Z-scores, so values
above zero mean that the product was above average and vice versa. Maxtor trails the
pack but it is somewhat difficult to distinguish between the others, although Seagate
appears to be superior to the others. To simplify comparisons, the average Z-score is
reported below, and it is clear that Maxtor is last, Seagate first, and Quantum and
Western Digital virtually tied.
Seagate Quantum Western Digital Maxtor
0.471816244 -0.20028644 -0.142761634 -1.09540377
What then to conclude? Maxtor, having by far the lowest quality product also had
by far the poorest returns. The variation in economic performance between the other three
firms was quite small, and this is consistent with the small variation in quality of this
period. I take this as moderate evidence in favor the hypothesis linking quality and
performance.
The quantitative measurement is centered on Quantum, the never-had-it. In seven
quality observations, it was both below average and below the other firms in the chart in
5 cases.
71 Many of these reviews explicitly took value into account, but others appeared not to include price or value as a separate factor.

57
XI. Networking
Summary: General support, but some inconsistencies, thus weak to middling
support.
Sharpbender Middling or lower Middling Middling
Cisco (FI) Bay Networks (NHI) Newbridge (SB) 3-Com (LI)
This is a McKinsey market, but one of the firms (Cabletron) is not in the same
business as the others. A networking firm that was not included in the Evergreen project
was Bay Networks and I decided to include it in the comparisons.72 This was convenient
because Bay seems the closest in this group to a never-had-it, although its performance is
not quite different enough to warrant that classification.
The stock chart above shows the stock performance of these firms starting in mid
1991(when Bay’s data begins) for a period of time consistent with the quality
measurements.73 Cisco is the sharpbender since 1990 (although Newbridge was so
classified in the original McKinsey data).74 Both Newbridge and 3com have small run-
ups in their stock prices (the latter in 1997 and the former in 1994) but neither comes
72 In 1998 Bay Networks was taken over by Nortel in a friendly acquisition. 73 A chart similar to the one shown, but beginning in 1990 has Cisco dominant from the very beginning but the dominance is so great that it makes it difficult to tell the other firms apart, they are grouped so closely at the bottom. 74 In the classification table above, the original McKinsey ranking is listed next to the name of the firm.

58
close to Cisco’s overall performance. The firms other than Cisco are not markedly
different from one another, although Bay trails the others virtually all of the time.75
The accounting data tell a similar though not totally consistent story.76 Figure 11.1
reveals that Cisco earned the highest rate of return. Newbridge is fairly clearly second in
terms of the accounting data, with 3Com and Bay trailing.77
Fig. 11.1: Networking Accounting Returns
-0.5-0.4-0.3-0.2-0.1
00.10.20.30.40.50.6
1990 1991 1992 1993 1994 1995 1996 1997 1998
CiscoNewbridge3ComBay
Both performance measures, therefore, agree that Cisco is clearly the leader.
Whether there is enough of a difference between the other three firms for us to declare,
for example, that Newbridge performed better than 3Com and Bay, or that Bay is at the
bottom of the pack, is hard to state with any confidence. We do not, therefore, have a
sharp test between a winner and a single loser although it is possible to compare Cisco’s
quality with that of the other three firms.
The quality results are found in Figure 11.2, measured as Z-scores.78 Cisco, in
seven comparison rankings, comes in above average in all cases but one. 3Com is about
75 The symbols for the firms are: Bay – Bay Networks, NN – Newbridge, COMS – 3Com, CSCO – Cisco Systems. 76 Measured as operating income divided by total assets. 77 The average return for Cisco was 39%, for Newbridge, 25%, for 3Com, 9% and for Bay, 10%. 78 CW stands for Computer World, Dc stands for Data Communications, PCM for PC Magazine, and VB for VarBusiness.

59
as good. Newbridge and Bay do not fare as well, generally coming in with below average
scores.
Fig 11.2: Networking Hardware Quality
-2.5
-2
-1.5
-1
-0.5
0
0.5
1
1.5
2
1992cw 1994cw 1995dc 1995pcm 1996vb 1997dc 1997vb 1998vb
Qu
alit
y M
easu
re
BayCisco3Com
Cisco’s above average quality performance is consistent with its superior economic
results, but its failure to surpass 3Com in terms of quality is not consistent with the prime
hypothesis, although its superiority over Bay and Newbridge is consistent with this
hypothesis. Overall, I conclude that there is weak to middling support for the hypothesis
here.
Putting a quantitative value on these results, it is obvious that the number of
observations where Cisco is above normal should be included (5 out of 6 with one neutral
observation). In keeping with my conservative assessment of the hypothesized linkage of
quality and performance, counting the number of times Newbridge is above average also
seems reasonable, since it was classified as a sharpbender and also earned fairly high
accounting returns. It only scores above average in 1 of 4 instances, so that the evidence
here is 6 out of 10 cases support the linkage.

60
XII. Database:
Summary: The better economic performers had higher quality, but the differences
in economic performance were far greater than would be suggested by the differences in
quality. Software has a characteristic of ‘winner-take-all’, however, amplifying such
differences in quality. Therefore, this can be taken as evidence in support of the general
hypothesis. No test of secondary.
Strong Performers
(Sharpbender)
Found-It Weak Performer (lost-it)
Oracle, Microsoft Computer Associates Sybase
Databases come in two flavors: desktop databases (both flat and relational) for
individual or small business use, and the heavy-duty ‘server’ version that interacts with
large organizations. The major market consists of the heavy-duty version and that will be
the focus here.
The never-had-it in the McKinsey classification is Adobe, a company better known
for its font controlling technology, drawing programs, and now Internet document
processing technology, than for any database software, so it will be dropped. The
remaining firms in this market are Oracle, Microsoft, Sybase and Computer Associates.
Microsoft, of course, has many other products and this product does not represent
anything close to a majority of its revenues, so the economic performance of Microsoft is
not likely to be strongly influenced by the quality of its database product. Oracle and
Sybase have their fortunes closely tied to their database products and will be, therefore,
the focus of this analysis.
The McKinsey classification indicates that Oracle outperforms Sybase, at least in
the later years. The stock chart below confirms that classification.

61
Similar results are found with accounting profits, as revealed in Figure 12.1.79
There it is seen that Oracle has a far better economic performance on average over the
last decade than Sybase, consistent with the stock market results, averaging a 21% return
over the period to Sybase’s 3% return.
Fig 12.1: Accounting Returns for Oracle and Sybase
-0.15-0.1
-0.050
0.050.1
0.150.2
0.250.3
1989 1990 1991 1992 1993 1994 1995 1996 1997 1998
Oracle
Sybase
Our test here, then, will focus on the quality differential between Oracle and
Sybase. Although it has been common to examine price as well, the complex pricing
arrangements of these database products (server products that depend on the number of
licenses to determine the price) makes the latter analysis somewhat difficult. One product
may be less expensive for 5 user licenses, while a second product may be less expensive
for 500 users.
79 Measured as operating income divided by total assets.

62
Fig 12.2: Database Quality
-2
-1.5
-1
-0.5
0
0.5
1
1.5
2
1988
pc
1992
cw
1992
cw
1992
pcm
1993
pcm
1994
pcm
1996
crn
1996
IW
1996
vb
1997
pcw
1997
vb
1998
B
1998
crn
1998
pc
1998
vb
Oracle Sybase Microsoft
Figure 12.2 provides the results of the compilation of product reviews. The scores
on the vertical axis are Z-scores, so that a value above zero indicates an above average
product, and a value below zero indicates a below average product. The dates and
magazines providing the reviews from which these scores were taken are indicated on the
horizontal axis.80
Just glancing at Figure 12.2 does not make clear an obvious ‘winner’ or ‘loser’.
These scores bounce around a great deal from review to review and the rankings of the
products also bounce around. Oracle has an average Z-score of .128 compared to
Sybase’s average score of -.115, not a terribly large difference. As already noted,
however, the nature of software markets is that leading firms have performance
differentials far out of line with the quality differentials due to the winner-take-all nature
of these markets. Note as well that in several instances only one of the firms gets ranked
(the lines are interpolated through missing values).
In the head to head encounters between the two company’s products Oracle wins 6
times, Sybase wins 2, and there is 1 tie. Because of the nature of the market, counting the
80 PC stands for Personal Computing, PCM for PC Magazine, B for Byte, CW for Computer World, IW for InfoWorld, CRN for Computer Reseller News, PCW for PC World, and VB for VarBusiness.

63
number of times Oracle is above average and the number of times Sybase is below
average seems inappropriate (it would have made little difference, with 15 of 24 cases
consistent with the hypothesized linkage). This will be reported as 6 out of 9 in the
overall chart. I conclude, therefore, that there is weak to moderate evidence in support of
the main hypothesis of a link between quality and economic performance.

64
XIII. Airlines
Summary: Strong support for primary hypothesis. Secondary hypothesis is not
tested.
Excellent (SB) Poor (NHI)
Southwest [1.6, 2, 1.8] Continental [.02, 37, .7]; TWA
Because the airline industry is not one of the original McKinsey markets, there
were no original sharpbenders, never-had-its, lost-its or found-its. My classification of
firms, then, bears some discussion.
Identifying the sharpbender is, fortunately, quite easy. Although both Southwest
and United would be classified as sharpbender using the original McKinsey methodology
(using 1995 as the ending year), Southwest slightly outperformed United, and in the years
following 1995 only Southwest continued to outperform the industry.81 The accounting
profit measures found in Figure 13.1 also show Southwest to be the best performer. This
chart is somewhat busy looking but Southwest has by far the highest average return.82
Southwest, therefore, is classified as the sharpbender.
Finding a never-had-it proved somewhat more difficult. TWA had less than
complete data for the period in terms of stock market performance. Two airlines, Pan
American and Eastern disappeared after poor financial performance, so that they might
be considered to qualify as never-had-its while they continued to operate. Continental
airline’s stock went on a roller-coaster ride, falling by 98% of its value relative to other
airlines in the first period, rising 3700% in the next period, but generating only 73% of
the performance of its rivals during the 96-97 years.
81 The numbers in parentheses in the classification table represents the 5 year market returns for each firm in the two McKinsey periods and a third period that goes through 1998. 82 Southwest averaged 7.31% compared to 3.70% for United, .81% for TWA, 3% for US Air, 3.51% for Delta, -2.44% for Continental, and 4.24% for American.

65
Fig 13.1: Airline Return on Assets
-15%
-10%
-5%
0%
5%
10%
15%
1986 1987 1988 1989 1990 1991 1992 1993 1994 1995 1996 1997
Ret
urn
on
Ave
rag
e A
sset
sAmerican Airlines Inc. US Airways Group Inc.Continental airlines Inc. Delta Airlines Inc.Southwest Airlines Trans World AirlinesUnited Airlines
The accounting returns can clarify this seeming mélange of results, although there
is no clear year-by-year never-had-it. However, on average, Continental averages by far
the worst in the group with TWA also considerably below average.83 These accounting
returns also make it clear how hard it is to find serious candidates here for the found-it or
lost-it monikers. I will not even attempt to do so in this market.
The airline industry has one of the richest data sets of quality measurements of any
industry that we have encountered. Not only is the number of comparisons numerous, the
comparisons are based on different criteria. One set is based on numerical scores
measured by the government, in this case the Department of Transportation.84 Such
rankings, based on ‘objective’ measurements as opposed to subjective ‘perceptions’ are
purported to measure ‘true’ quality, as would the rankings from Consumer Reports, as I
have already discussed. The other component of quality rankings for airlines come from
travel and general sources, such as Conde Nast, MSNBC, Money Magazine, Travel and
Leisure Magazine, and so forth.
83 The returns are: American Airlines Inc: 4.24%; US Airways: 3.00%; Continental: -2.44%; Delta: 3.51%; Southwest: 7.31%; Trans World Airlines: 0.81%; United: 3.70%. 84 The DOT data has been analyzed by researchers from the University of Nebraska, who provide yearly rankings on airlines.

66
Figure 13.2 represents the quality performance of airlines by their Z-scores, so that
positive scores represent firms above the mean and negative scores represent firms whose
products are below average in quality. The data on quality reveal that Southwest had far
higher quality than the contrasting putative never-had-it group, and although I have tried
to eliminate clutter and so have not included the quality data on all airlines, Southwest
also has the highest overall quality of any other airline, with an average Z-score of 1.64,
meaning that it was more than one and a half standard deviations above the industry
mean.85
Fig 13.2: Airline Quality
-2
-1.5
-1
-0.5
0
0.5
1
1.5
2
2.5
3
DO
T19
89
DO
T19
90
DO
T19
91
CR
1991
DO
T19
92
DO
T19
94
DO
T19
95
CR
1995
DO
T19
97
MS
NB
C97
DO
T19
98
Mon
ey97
CN
98
FF98
CR
1999
Southwest ContinentalEastern Pan AmTWA USAir
Results from the two types of quality rankings are fairly similar. The surveys
(Consumer Reports, Money, Conde Nast, MSNBC, Family Fun) provide similar scores to
the conformance measures from the Department of Transportation.86 Southwest is almost
always reported to be one of the highest quality airlines while Continental and TWA are
among the worst (as were two defunct airlines, Pan American and Eastern, which were
85 The average Z scores for the other national airlines were: Delta .448; American .224; Northwest -.570; USAir -.327; United .074; Continental -.641; TWA -.804. 86 One survey ranking (Travel and Leisure Magazine) was not included because it provided results at variance with the others. It appears that readers of this magazine are far more upscale than typical airline passengers and thus their choices are not representative of the population of airline consumers. This is discussed earlier in the report.

67
included to show that airlines that are doing really poorly also score badly on these
ratings).
Some of these ratings attempt to adjust for price, while most do not. It appears not
to make a great deal of difference.
Based upon these results, I conclude that there is strong support here for the view
that quality leads to superior economic performance on the part of the competing firms,
measured either by stock market performance or by accounting returns.
The quantitative measures are based on the share of above average scores for
Southwest (14 of 15) and the share of below average scores for TWA (14 of 15) and
Continental (14 of 15). This could be listed as 42 of 45 observations in favor of a positive
linkage, but in keeping with the conservative bent of the study, I will report the results as
14 out of 15.

68
XIV. Car Rental Firms
Summary: Best performing firms also have the highest quality. Fairly strong
support for basic hypothesis. No attempt to test secondary hypothesis.
Good Poor
Hertz Dollar/Thrifty
Avis
This is not an original McKinsey industry group. It is an industry, however, where
quality rankings were available and where the major companies specialized fairly closely
in the specific industry. Unfortunately, the firms in this industry have gone through major
transformations in the last few years and virtually none of them had stock market returns
available for more than a handful of years. I used accounting profits to detect successful
versus unsuccessful firms.
Hertz is the largest automobile rental company. Avis, as its advertisements used to
say, is the perennial number two in size. Dollar and Thrifty are both owned by Dollar
Thrifty Automotive Group (DTG). AutoNation only entered the car rental business in
1996 and 1997 with the acquisition of Alamo and National car rental units, but I couldn’t
get useful measures of profitability for rental units alone.87
Fig 14.1: Car Rental Company Return on Assets
-5%
-3%
-1%
1%
3%
5%
7%
9%
11%
13%
1988 1989 1990 1991 1992 1993 1994 1995 1996 1997 1998
Avis Budget
DTG Hertz

69
Figure 14.1 represents the return on assets for the five leading car rental companies.
The most successful firms are Hertz and Avis, with Budget being more variable and
somewhat lower. Dollar/Thrifty is the laggard of the group.88
Next I investigate the quality of the products of these firms. Figure 14.2, which
represents Z-scores for these brands, reveals that Hertz and Avis are the two leading
brands in terms of quality.89 Budget, Dollar and Thrifty all provide below average
performance.
Fig 14.2: Car Rental Quality
-3
-2
-1
0
1
2
3
4
5
6
7
Zagat 90 CN 96 CN 97 ZAGAT 97 FF 98 CN 98
Avis Budget
Dollar/DTG Hertz
Thrifty/DTG
All in all, the agreement between financial performance and quality is reasonably
strong. The measures of quality, illustrated in Figure 14.1, reveal that Hertz and Avis
provide the best service. The other firms are all fairly closely grouped and quite low. The
Dollar/Thrifty brands are always below average, consistent with their poor performance
in measured accounting returns. Budget’s poor quality is not completely consistent with
its mediocre financial performance as measured by accounting returns.
Since the quality observations of the firms with strongest and weakest economic
performance all match the above/below classification, quantitative measurements could
87 Recently AutoNation has announced that it is going to spin off its car rental units. 88 The returns are: Hertz 7.32%, Avis 7.19%, Budget 6.10%, and DTG 2.03%. 89 Quality is determined by reviews in Conde Nast, Zagat, and Family Fun magazines.

70
overstate the true strength somewhat – 7 of 7 for the below average and 12 of 12 for the
above average. Since Budget does as poorly as Dollar/Thrifty in quality, but has an
economic performance closer to Hertz and Avis, I will include it as a ‘winner’ to lower
these quantitative scores, in keeping with the extremely conservative methodology I am
using to test for a positive relationship. This then alters the score to 21 of 25 instead of 19
of 19.

71
XV. Internet Aggregators
Summary: Strong support for primary hypothesis. No test of secondary hypothesis
possible.
This is a very new category since the Internet did not start becoming an important
presence until 1995. The firms in this category began life generally as search engines,
intended to help users of the Internet find material from the enormous number of web
sites. These search engines then evolved a strategy of generating advertising revenues,
leading them to try to induce users to remain at the site as long as possible so as to
maximize potential audience size and advertising revenues.
The major players are Excite, Infoseek, Lycos, and Yahoo. The time period is far
too short to use the McKinsey methodology of never-had-it and sharpbenders, but that is
more than compensated for by the fact that we get a chance to discover the importance of
quality at the embryonic stage of an industry. Will quality have the same impact for
immature companies and industries that it has for more seasoned firms? This is one
industry that may provide the beginnings of an answer.
Before discussing the issue of quality, it is necessary to explain the categorization
of the firms. In almost any dimension, Yahoo is the success story of this group. It has by
far the largest market capitalization, is the only firm to be generating profits, has the
largest sales, and the greatest stock appreciation.
Relative stock appreciation can be gleaned from the following chart, which
illustrates stock market appreciation. Yahoo is the top line, followed a considerable
distance below by Excite and Lycos with very similar paths to each other, and with
Infoseek a clear trailer. All of these firms have achieved excellent stock market
appreciation, since these measurements occurred during the great Internet stock run-up of
Sharpbender Never-had-it Middling Middling
Yahoo Infoseek Lycos Excite

72
1998-99. Even Infoseek, the laggard of the group, beat the overall market returns over
this period.
Because of this, I have classified Yahoo as the short term sharpbender and Infoseek
as the never-had-it. As already mentioned, the time period is too short to be able to
discuss found-its or lost-its.
How does the quality of the product compare with these stock market
performances? The sharpbender, Yahoo, clearly dominates the field, as well as the never-
had-it, Infoseek, in the quality dimension. Infoseek does poorly in quality, but is not
necessarily the worst although it did come in last in four of the seven comparison
rankings below. Lycos may actually be as bad, coming in last in two of five occasions.

73
Fig. 15.1: Quality of Search Engine/Portals
-2
-1.5
-1
-0.5
0
0.5
1
1.5
1996 PCMag
1996 USAToday
1997 PCMag
1997 PCComputing
1997Kiplinger
1998 PCMag
1998 PCWorld
Excite Infoseek
Lycos Yahoo
It is worth noting that Yahoo is even more highly regarded than indicated in the
above chart. There were a good number of reviews that were not amenable to charting
because they did not provide scores. These reviews almost always found Yahoo to be the
leading product. Of these reviews, two in 1996 found Yahoo to be the best,90 two in 1997
split between Excite and Yahoo,91 and three in 1998 list Yahoo as the best.92 In the chart
above, Infoseek comes in last four of five times, and second on the other occurrence.
These results are quite consistent with the hypothesized positive link between
quality and performance. It is interesting that quality seems to be important in this
embryonic industry just as it is in the more mature industries.
In quantitative terms, we could count the number of times that Yahoo is above
average (6 of 6) and Infoseek below average (3 of 7), or we could count the number of
90 USA Today, 9/21/96, The Best Ways to Navigate the Net, by Bruce Haring, pg. D10; Business Week, 2/12/96; What Hath Yahoo Wrought? by John Verity, pg. 88; Fortune, Dec 9, 1996; Yahoo! Still Searching for Profits on the Internet, by Janice Maloney, pg. 174. 91 Excite gets the nod in ComputerWorld, April 1997, Comparing Internet Search Engines, by Andrew Kingoff, pg 117; Yahoo gets the nod in PC Magazine Dec 2, 1997, Your Complete Guide to Searching the Net, by David Lidsky, pg. 227; Yahoo and Infoseek tie for first in Kiplinger's Personal Finance Magazine, Oct 1997, Seek and Ye May Find, by Kathy Yakal, pg 131. 92 PC Magazine Dec 1, 1998, Find It On The Web, by David Lidsky, pg201; PC World Feb 10, 1998, The Top 100 Websites, by Tracy Kerievsky, pg 100; PC World Jan 6, 1998, The Best of 1997,by Jake Kirchner, pg 100.

74
times that Yahoo surpasses Infoseek in quality (5 of 5, one tie). To be consistent with the
conservative strategy throughout, I will report 9 of 14 in Table 2.93
93 Reporting 5 of 5 provides a higher level of statistical significance than does 9 of 14.

75
XVI. Cruise Lines
Summary: Best performing firm also has the highest quality. Medium-strong
support for the basic hypothesis. No test of secondary hypothesis.
This market was not an original McKinsey market. The cruise line market was
chosen because there were several sources of ratings, and because several of the major
players had their business focused on this market. In the end there are only two useful
firms in the market, Carnival and Royal Caribbean. Princess is an important line, but it is
owned by P&O, a British firm with many other interests that dwarf its cruise business.
American Classic Voyages owns the American Hawaii cruise ship, but its major business
consists of river cruises on paddlewheel steamboats and data on quality are unavailable
for these boats and is very sparse for the Hawaii ocean cruiser.
The terms 'Sharpbender' and 'never-had-it' are of limited value here, since there is
little reason to believe that the companies would fit into these categories if there were a
long enough period of stock market returns to calculate meaningful categories, which
there is not.94 Instead, I set a more modest goal--measuring the relative economic
performance of these companies and then comparing their performance to the quality of
their products.
Figure 16.1 charts the return on assets for the two companies.95 Carnival clearly has
better performance, according to accounting figures. The cumulative stock market returns
for the two companies provide results very similar to those derived using return on
assets.96
94 The period for which we have data for Royal Caribbean extends from April 1993 to April 1999. 95 Return on Assets is defined as (gross) operating income divided by assets. 96 Carnival stock outperforms Royal Caribbean (including dividends) by a factor of 1.24
Better Worse
Carnival Royal Caribbean
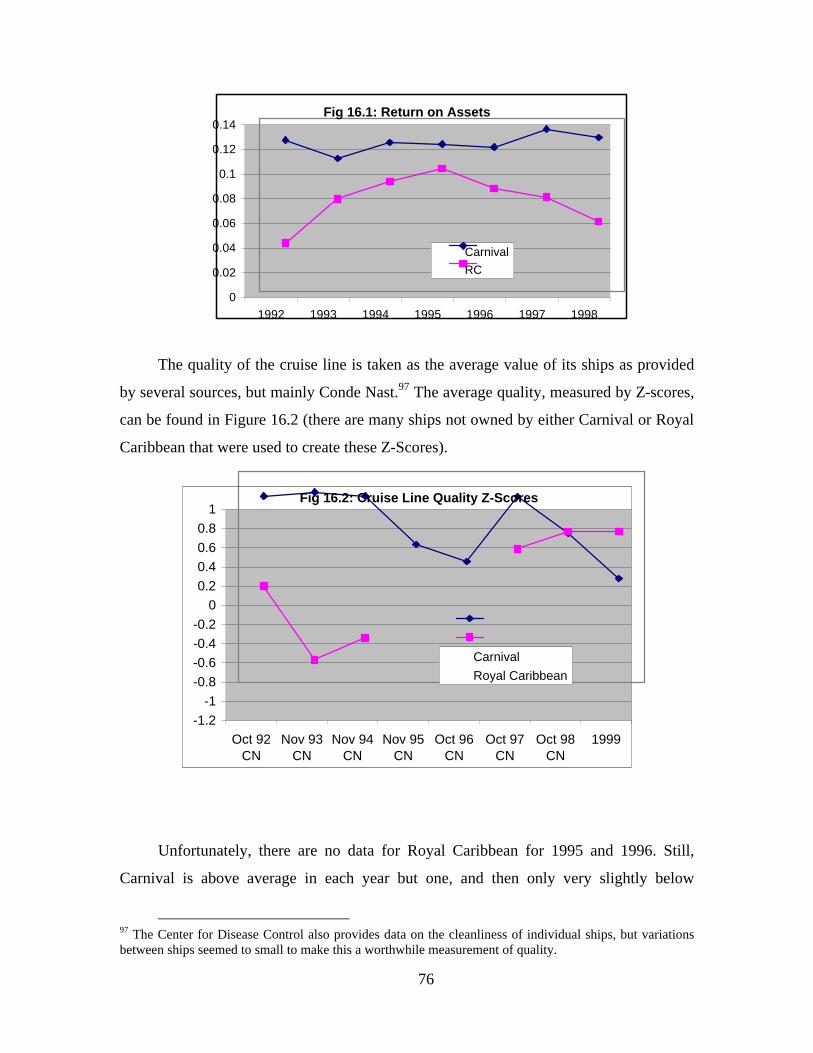
76
Fig 16.1: Return on Assets
0
0.02
0.04
0.06
0.08
0.1
0.12
0.14
1992 1993 1994 1995 1996 1997 1998
CarnivalRC
The quality of the cruise line is taken as the average value of its ships as provided
by several sources, but mainly Conde Nast.97 The average quality, measured by Z-scores,
can be found in Figure 16.2 (there are many ships not owned by either Carnival or Royal
Caribbean that were used to create these Z-Scores).
Fig 16.2: Cruise Line Quality Z-Scores
-1.2-1
-0.8-0.6-0.4-0.2
00.20.40.60.8
1
Oct 92CN
Nov 93CN
Nov 94CN
Nov 95CN
Oct 96CN
Oct 97CN
Oct 98CN
1999
CarnivalRoyal Caribbean
Unfortunately, there are no data for Royal Caribbean for 1995 and 1996. Still,
Carnival is above average in each year but one, and then only very slightly below
97 The Center for Disease Control also provides data on the cleanliness of individual ships, but variations between ships seemed to small to make this a worthwhile measurement of quality.

77
average. Royal Caribbean is significantly below average in three years and slightly above
average in three years. Certainly, the evidence indicates that Carnival was of higher
overall quality, particularly in the early to mid 1990s.
The evidence is not totally unambiguous here, but it clearly favors the hypothesis
that quality leads to better performance.
Since we do not have economic performance where these firms can be compared
with some form of industry average, the appropriate comparison is to compare the two
firms to one another. The firm with the superior economic performance also wins 4 of 6
head to head comparisons.
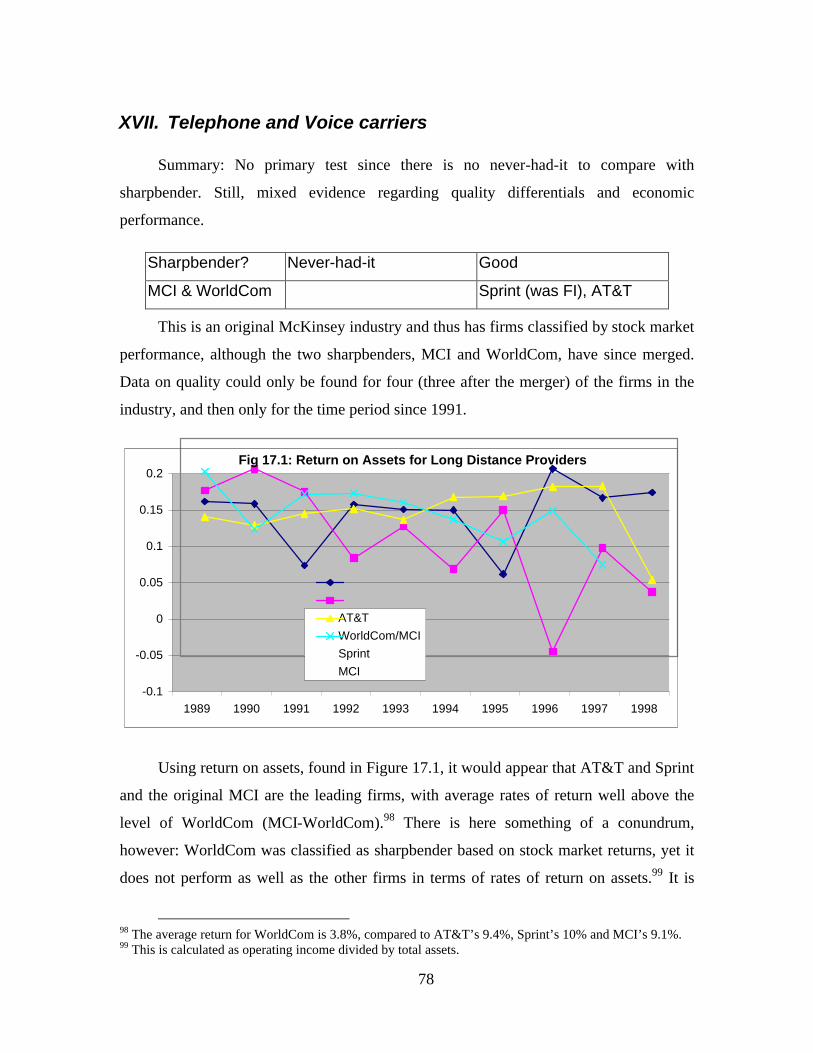
78
XVII. Telephone and Voice carriers
Summary: No primary test since there is no never-had-it to compare with
sharpbender. Still, mixed evidence regarding quality differentials and economic
performance.
This is an original McKinsey industry and thus has firms classified by stock market
performance, although the two sharpbenders, MCI and WorldCom, have since merged.
Data on quality could only be found for four (three after the merger) of the firms in the
industry, and then only for the time period since 1991.
Fig 17.1: Return on Assets for Long Distance Providers
-0.1
-0.05
0
0.05
0.1
0.15
0.2
1989 1990 1991 1992 1993 1994 1995 1996 1997 1998
AT&TWorldCom/MCISprintMCI
Using return on assets, found in Figure 17.1, it would appear that AT&T and Sprint
and the original MCI are the leading firms, with average rates of return well above the
level of WorldCom (MCI-WorldCom).98 There is here something of a conundrum,
however: WorldCom was classified as sharpbender based on stock market returns, yet it
does not perform as well as the other firms in terms of rates of return on assets.99 It is
98 The average return for WorldCom is 3.8%, compared to AT&T’s 9.4%, Sprint’s 10% and MCI’s 9.1%. 99 This is calculated as operating income divided by total assets.
Sharpbender? Never-had-it Good
MCI & WorldCom Sprint (was FI), AT&T

79
possible that the different time periods are responsible for this, or perhaps that WorldCom
stock price has performed far ahead of anticipated profits.
How, should these firms be classified relative to one another in terms of economic
performance? WorldCom accounting performance is at the bottom of the pack, with little
to distinguish the other firms from one another. Yet the stock performance of WorldCom
is the most spectacular of the group, achieved during a period of remarkable growth. This
inconsistency makes it very hard to use WorldCom in rank these firms based on
economic performance. MCI, on the other hand, was classified as a sharpbender, and also
earned high accounting returns, particularly in the early 1990s. We should expect its
quality to be high during this period of time.
What is the evidence on quality? Figure 17.2 presents this evidence. Most of the
data come from Data Communication Magazine, which survey’s its readers, but some of
it also comes from JD Powers (represented by a JD in the chart). The survey’s in Data
Communication, in the later years, includes separate measures for overall quality and
overall value (the latter measures are represented by a V next to the year). In the former
case, the evidence includes a measure of quality and a measure of value.
Fig 17.2: Long Distance Quality
-2.5
-2
-1.5
-1
-0.5
0
0.5
1
1.5
2
2.5
3
1991
1992
1993
1994
1995
1996
1996
V19
96jd
1997
1997
V19
97jd
1998
1998
V19
98jd
1999
1998
V19
99jd
AT&T MCISprint WorldCom

80
From 1991 through 1993, Sprint has the worst quality, but from 1995 until 1998
MCI has lowest quality. AT&T is the best during the first half of the decade. There are
only a few instances when the quality of WorldCom is measured, but it does very well in
those instances.
Regarding the linkage hypotheses, the evidence here is mixed. There is no ‘never-
had-it’ to compare with a sharpbender. WorldCom cannot be used to test the hypotheses
because it is unclear whether WorldCom is a high or low economic performer. MCI,
however, has below average quality. Because of this, I view this industry as a very weak
negative due to MCI’s lack of consistency in its economic and quality performance.
Taking MCI as a sharpbender, and examining its quality reveals that it was above
average only 2 of 10 times prior to its merging with WorldCom.100 This would seem to
overstate the confidence we can have in the result, but following the conservative pattern
of the study, I will use this value.
100 The merger began in late 1997 so I will use the statistics through 1997.

81
XVIII. Discount Brokerage Firms
Summary: There is a strong correspondence between the economic performance of
these companies and the quality of their product. There is some uncertainty about the
measures of economic performance, however, so I classify this as medium level support.
This is another non-McKinsey industry chosen because quality rankings were
available. Although there are many discount brokerage firms, there are not many that are
also publicly traded. Examining the universe of publicly traded discount brokers where
the brokerage service is the major activity of the firm provided four firms: Schwab, J. B.
Oxford, E*Trade, and National Discount Brokers.
The first question concerns the economic performance of these firms as measured,
first, by stock market returns. Of the two firms in existence since 1990, Schwab does
much better than JB Oxford (approximately 7:1).101 Unfortunately, E*Trade and National
Discount Brokers do not have stock returns for such a lengthy period of time.102
101 This is based on pure price appreciation and does not include dividends, which would affect Schwab but not J.B. Oxford. 102 SCH is Schwab, NDB is National Discount Broker, EGRP is E*Trade and JBOH is J. B. Oxford.
Good Poor Middling
Charles Schwab J.B. Oxford, E*Trade National Discount Broker

82
In recent years, the firms vary as to which one performs the best, except that
National Discount Brokers performs poorly in this later period.
It is useful to turn, once again, to accounting magnitudes to measure performance.
Because these firms are financial in nature, however, using return on assets is a
questionable choice. Instead, the return on sales can be used.103 The results are found in
Figure 18.1. The data in this chart indicate that Schwab is the leader (although it might be
somewhat difficult to discern by eye), and since it avoids any very severe slumps, it
might be classified as a sharpbender.104 National Discount Brokers is second, except for a
very poor showing in 1990. The worst performance is J.B. Oxford. E*Trade does
relatively badly in four of the six years for which data exist.
Fig 18.1: Economic Performance of Discount Brokers
-0.4
-0.3
-0.2
-0.1
0
0.1
0.2
0.3
1990 1991 1992 1993 1994 1995 1996 1997 1998
EtradeSchwabNDB (Nat Dis Broker)JB Oxford
The performance data, therefore, are somewhat mixed. Both stock returns and
accounting returns indicate that Schwab is the best. National Discount Brokers, however,
fares far more poorly in the stock market than it does with the accounting data. Because
there is so little stock market information for these firms, however, I am going to rely on
the accounting data. I will classify the firms as Schwab best, National Discount Brokers
second, followed by E*Trade and J.B. Oxford trailing.
103 Measured as profit before taxes divided by total revenue. 104 Schwab has an average return of 18%, whereas National Discount Brokers averages about 9%, E*Trade earns only 6% and J. B. Oxford average just about a zero return.

83
I turn now to the investigation of quality. The results can be found in Figure
18.2.105
F ig . 18 .2 : Q u a lity o f D i s c o u n t B r o k e r s
-1.5
-1
-0.5
0
0 .5
1
1 .5
2
1 9 9 3 K 1 9 9 4 S M 1 9 9 5 S M 1 9 9 6 S M 1 9 9 7 S M 1 9 9 8 S M 1 9 9 9 S M
C h a r l e s S c h w a b
N a t i ona l D i scoun t B roke r
E t rade
The reader might well note that there is no data for J. B. Oxford. I will return to that
in a moment. First, however, note that Charles Schwab is ranked first, National Discount
Broker second, and E*Trade last. Thus, immediately, there is a strong correspondence
between the quality rankings and the accounting performance data. This would be very
strong evidence in support of the hypothesis linking quality and performance, except that
there is some question about the strength of the performance measures.
J. B. Oxford is another story altogether, but one that is consistent with its poor
economic performance. The history of J. B. Oxford is not pretty - it engaged in or at least
flirted with fraudulent and deceptive practices. In 1991, when it was called the Otra
Securities Group, a Glendale, California trade-processing company, it was accused of
defrauding tens of thousands of investors at 25 brokerage firms of as much as $5 million
in allegedly excessive fees.106 Then in 1992 the Otra Securities Group changed its name
to RKS Financial Group Inc.107 In 1993 it became a target of suit alleging some 100,000
105 In this chart, SM stands for Smart Money and K for Kiplinger, the sources of the quality estimates. The scores represent Z-Scores based on rankings of a large number of discount brokers, so that scores above zero indicate above average performance and vice-versa. 106 Wall Street journal, 7/16/91, Investors’ Suit Cites ‘Excessive’ Account Fees, by Michael Siconolfi, pg C1. 107 Wall Street journal, 6/2/92, Business briefs, no author, pg B6

84
dormant accounts were sold off without the owners’ authorizations to pay brokerage
maintenance fees, with illegal short selling to boot.108 In the spring of 1993, a group of
investors led by Irving Kott acquired a controlling interest in RKS Financial. Kott had a
lengthy criminal history in the securities industries dating back to the 1960s. A March
1994 expose in Business Week highlighted Kott’s “consulting” role. Shortly after that
story appeared, RKS announced that is was pulling out of the full-service brokerage
business.
In September 1994, RKS changed its name to J. B. Oxford and took on new top
managers and a new business strategy. However, it kept Irving Kott as a consultant.
Oxford maintained that Kott was a brilliant marketer, while industry officials said that
because Kott was only a ‘consultant’, and his felony conviction had occurred more than
five years earlier, there were essentially no restrictions on his working for a licensed
brokerage firm.109
An article in Time Magazine highlighting fraudulent brokerage firms described
Kott in these terms: “No one has been a better practitioner of the craft than Irving Kott, a
sharp operator who has played a powerful, behind the scenes role at brokerage firms in
his native Canada, Continental Europe, Britain and the U.S. In his biggest caper, Kott’s
brokerage customers lost as much as $400 million…. Kott is a powerful figure behind the
scenes at JB Oxford & Co., a small discount brokerage with big pretensions whose parent
company, JB Oxford Holdings, has become a darling of a group of online investors.” 110
Kott’s name did not appear in any of JB Oxford’s SEC filings, because, the
company said, Kott was nothing more than a consultant. Says Time: “In reality, he
wields so much influence that several former employees told Time they regarded him as
the de facto CEO.”
108 The National Law Journal, 12/13/93, Stock fees suit a class action; more allegations added, by Gail Cox, pg. 3. 109 Wall Street Journal, 5/3/95, Convicted Swindler is Securities Consultant, by John Emshiller, pg. C1. 110 Time, 12/9/96, The Secret Life of JB Oxford: Around the World with Irving Kott, by Larry Gurwin, pg. 52.

85
In 1996, the NASD fined the firm’s former broker-dealer, RKS, $50,000 for failing
to disclose to investors negative information about a stock the firm sold to customers in
1992. In 1997 Federal agents raided the offices of JB Oxford Holdings. Oxford’s offices
in Basel, Switzerland were also raided.111 In 1997, JB Oxford said it severed its
controversial relationship with Irving Kott, although his son was then running the
company.112 Finally, in May of 1998 a Tennessee investor group paid $6 million to buy a
47% interest in JB Oxford and claimed to remove Kott’s influence.113
Even though we do not have direct information on the quality of Oxford’s
performance, it seems very unlikely that the quality could have been very high
considering that the firm was putting so much of its efforts into circumventing the law.
The evidence relating quality to performance is, therefore, consistent for all the
firms in this industry.
Quantitative measurements will not provide the full impact of the findings in this
industry. Schwab is above average in 6 of 7 instances, and that is the measurement that
shall be used.
111 WSJ, 8/20/97, FBI Agents raid JB Oxford’s offices in California, by Andy Pasztor, pg A4 Also, The Los Angeles Times, 8/20/97, FBI Agents raid Beverly Hills Brokerage Firm, by Debora Vrana, pg D1 112 WSJ, 9/18/97, JB Oxford Holdings says it has severed ties with Consultant, no author, no page cited. 113 The Los Angeles Times, 5/28/98, Investor Group to buy control of JB Oxford, by Debora Vrana, pg 2

86
XIX. Cosmetics
Summary: Moderate to weak evidence against the hypothesis linking quality and
performance.
This is not an original McKinsey industry. Some product reviews were available,
however, as well as information on several firms specializing in this industry. Some of
the major firms are Avon, Estee Lauder, Revlon, L'Oreal, Mary Kay, and Proctor and
Gamble. Performance data could only be found for three of these firms, however. Stock
market data were too sketchy to calculate the McKinsey classifications, except for Avon,
which appeared as a never-had-it, although its performance in 1997-1999 was above
average. It seems more informative to use accounting measures of performance here and
Figure 19.1 provides data on rates of return on assets.114
Fig 19.1: Cosmetics Return on Assets
-0.9
-0.7
-0.5
-0.3
-0.1
0.1
0.3
1992 1993 1994 1995 1996 1997 1998
Avon
Estee Lauder
Revlon
Avon is seen to have a remarkably poor performance until 1997, Revlon's
performance is middling, but Estee Lauder performs consistently well.
114 Measured as operating income divided by total assets.
Best Terrible but then found it Middling
Estee Lauder Avon Revlon

87
How do these economic performances contrast with the quality of products? It is
important to be somewhat careful here because the quality of cosmetics is difficult to
gauge, with much of the appeal of these products having to do with marketing and the
creation of that difficult to define concept, glamour.
The measure of quality used, in part because it is the only measure available, comes
from Consumers Reports. Being the hardnosed, anti-fluff type of organization that they
are, they judge these products based on very practical considerations that may not be of
utmost, or even moderate concern to most shoppers.
Nevertheless, the results are presented in Figure 19.2. There are only four years of
data, and for each year the results are based only on a single product. The lettering next to
the year indicates the product examined.115 Scores are Z-scores. The average scores for
each company are very close to one another, with no apparent pattern to the scores.
Fig. 19.2: Cosmetics Quality
-1
-0.8
-0.6
-0.4
-0.2
0
0.2
0.4
0.6
0.8
1
1988LS 1991EMU 1994MS 1995NP
Avon Estee Lauder
Revlon
Comparing these two charts, there is no support for the view that quality bears any
relationship to the economic performance of the firm. Avon might have been expected to
perform poorly, but it is above average (positive scores) in 3 of the 4 comparisons. The
evidence is not entirely negative for the hypothesis, however. Estee Lauder, which might
have been expected to be above average, is above average in three of the four
115 LS is lipstick, EMU is eye make-up, NP is nail polish, and MS is mascara.

88
comparisons but it only beats Avon 1 of 3 times. Given the weakness and dearth of
quality measures, I do not believe that much can be made of this.
In keeping with my policy of stacking the deck somewhat against the hypothesis of
positive linkage, I will take the 1 of 3 as the quantitative result.