Embed Size (px)
Citation preview
1 Tim Schröder Product Carbon Footprint GROHE BLUE® kitchen tap
1
Product Carbon Footprint for the GROHE BLUE® kitchen tap
International Sustainable Built Environment Conference
Doha, 28-30 January 2014
Tim Schröder
Prof. Dr. Jutta Geldermann
Chair of Production and Logistics
Georg-August-University Göttingen
www.produktion.uni-goettingen.de
2 Tim Schröder Product Carbon Footprint GROHE BLUE® kitchen tap
2
Agenda
1. Introduction of Grohe AG and the GROHE BLUE® kitchen tap
2. Motivation for Product Carbon Footprint Analysis
3. Supply Chain and Life Cycle Net
4. Assumptions and Allocations
5. Results
6. Conclusion
3 Tim Schröder Product Carbon Footprint GROHE BLUE® kitchen tap
3
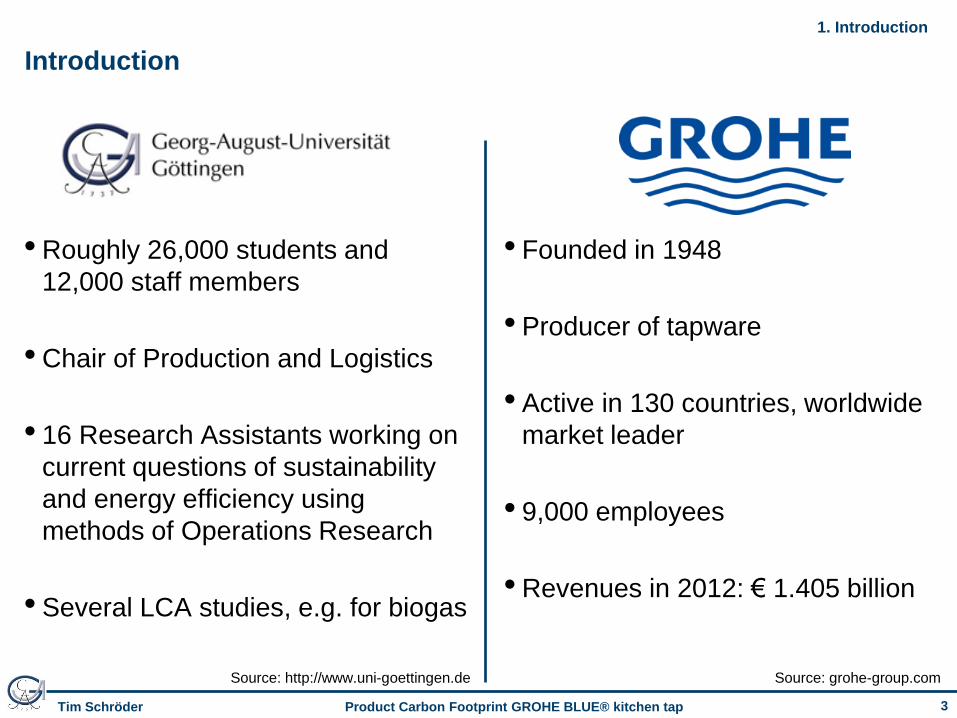
Introduction
• Roughly 26,000 students and
12,000 staff members
• Chair of Production and Logistics
• 16 Research Assistants working on
current questions of sustainability
and energy efficiency using
methods of Operations Research
• Several LCA studies, e.g. for biogas
• Founded in 1948
• Producer of tapware
• Active in 130 countries, worldwide
market leader
• 9,000 employees
• Revenues in 2012: € 1.405 billion
Source: grohe-group.com Source: http://www.uni-goettingen.de
1. Introduction
4 Tim Schröder Product Carbon Footprint GROHE BLUE® kitchen tap
4
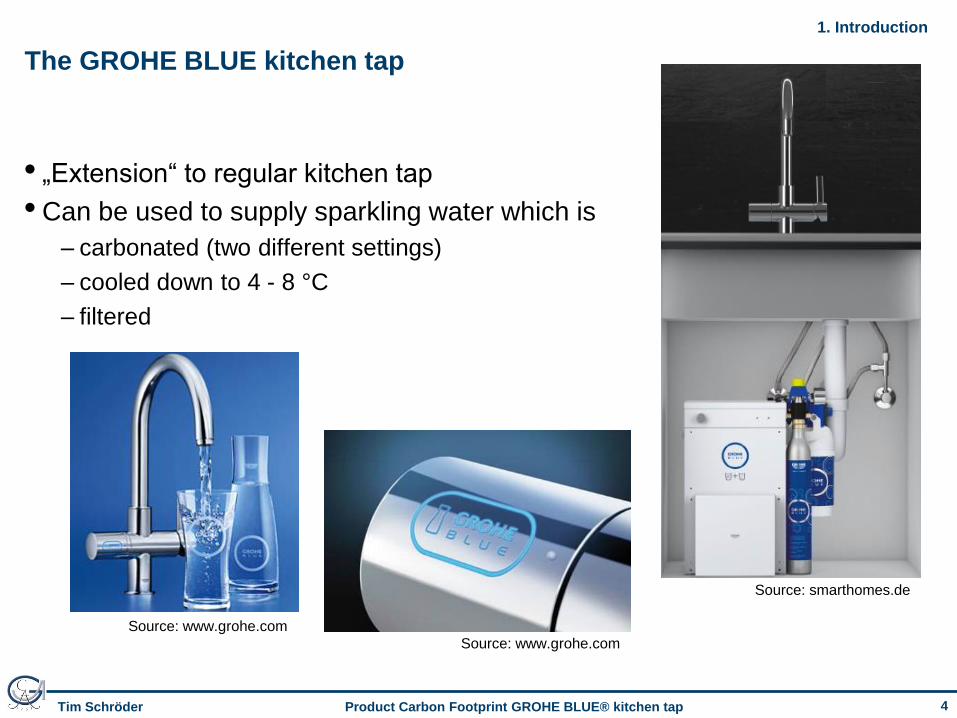
The GROHE BLUE kitchen tap
• „Extension“ to regular kitchen tap
• Can be used to supply sparkling water which is
– carbonated (two different settings)
– cooled down to 4 - 8 °C
– filtered
Source: www.grohe.com
Source: smarthomes.de
Source: www.grohe.com
1. Introduction
5 Tim Schröder Product Carbon Footprint GROHE BLUE® kitchen tap
5
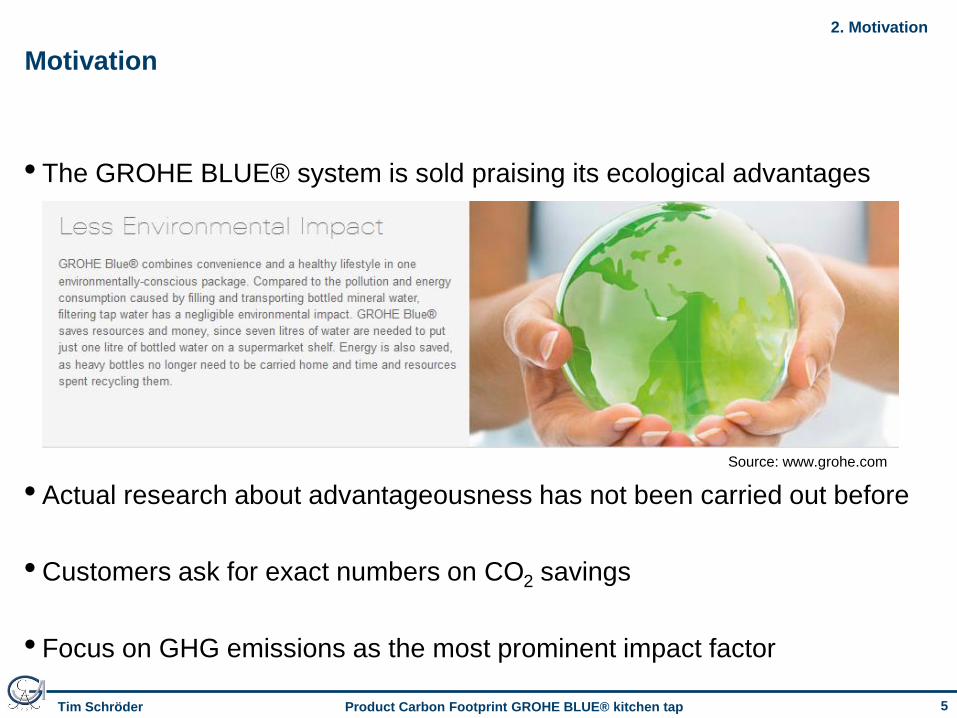
Motivation
• The GROHE BLUE® system is sold praising its ecological advantages
• Actual research about advantageousness has not been carried out before
• Customers ask for exact numbers on CO2 savings
• Focus on GHG emissions as the most prominent impact factor
Source: www.grohe.com
2. Motivation
6 Tim Schröder Product Carbon Footprint GROHE BLUE® kitchen tap
6
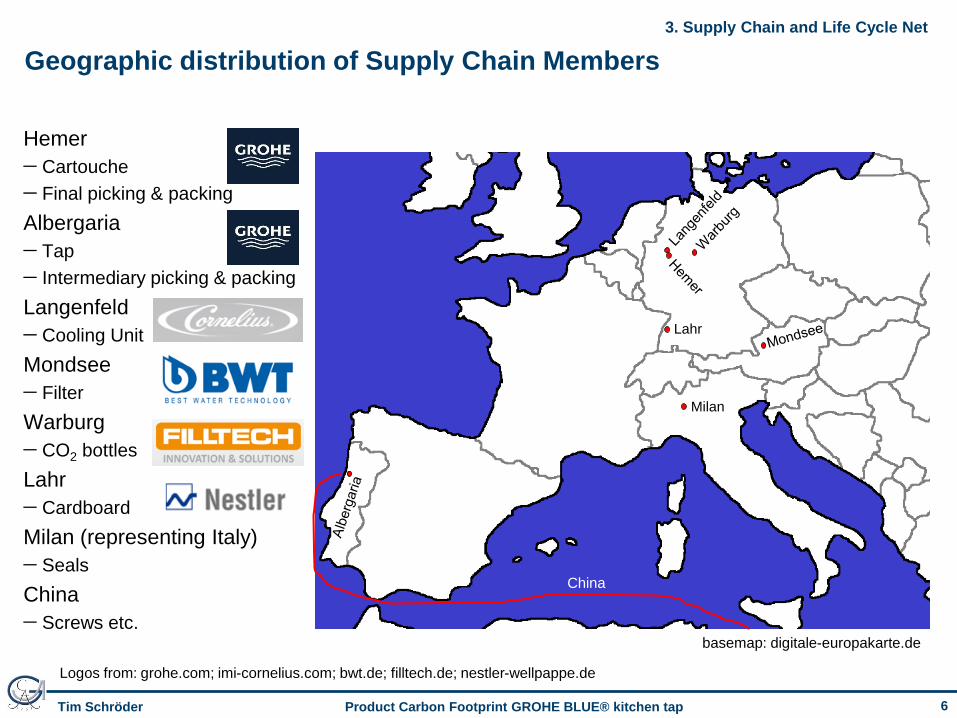
Geographic distribution of Supply Chain Members
basemap: digitale-europakarte.de
Lahr
Milan
China
Hemer
Cartouche
Final picking & packing
Albergaria
Tap
Intermediary picking & packing
Langenfeld
Cooling Unit
Mondsee
Filter
Warburg
CO2 bottles
Lahr
Cardboard
Milan (representing Italy)
Seals
China
Screws etc.
Logos from: grohe.com; imi-cornelius.com; bwt.de; filltech.de; nestler-wellpappe.de
3. Supply Chain and Life Cycle Net

7 Tim Schröder Product Carbon Footprint GROHE BLUE® kitchen tap
7
Umberto Modeling of the GROHE BLUE Kitchen Tap Life Cycle
3. Supply Chain and Life Cycle Net
Cooling unit 1 liter drinking water
Several
components
Commodities supply
tap
disposal/
recycling
• Petri-net modelling in Umberto NXT LCA
• Five Life Cycle Phases: Raw Materials, Manufacture, Distribution, Consumer
Use and Disposal Recycling

8 Tim Schröder Product Carbon Footprint GROHE BLUE® kitchen tap
8
Baseline Scenarios
Usage in Corporate Environment and Private Household
• Installation instead of regular kitchen tap
• Replacing drinking water supply in bottles or jugs
4. Assumptions and Allocations
Scenario Corporate Env. Private Household
Number of users 30 4
Consumption per day p.c. 0.7 1
Number of days p.a. 220 365
Lifetime in years 5 10
Total consumption 33,000 10,220
9 Tim Schröder Product Carbon Footprint GROHE BLUE® kitchen tap
9
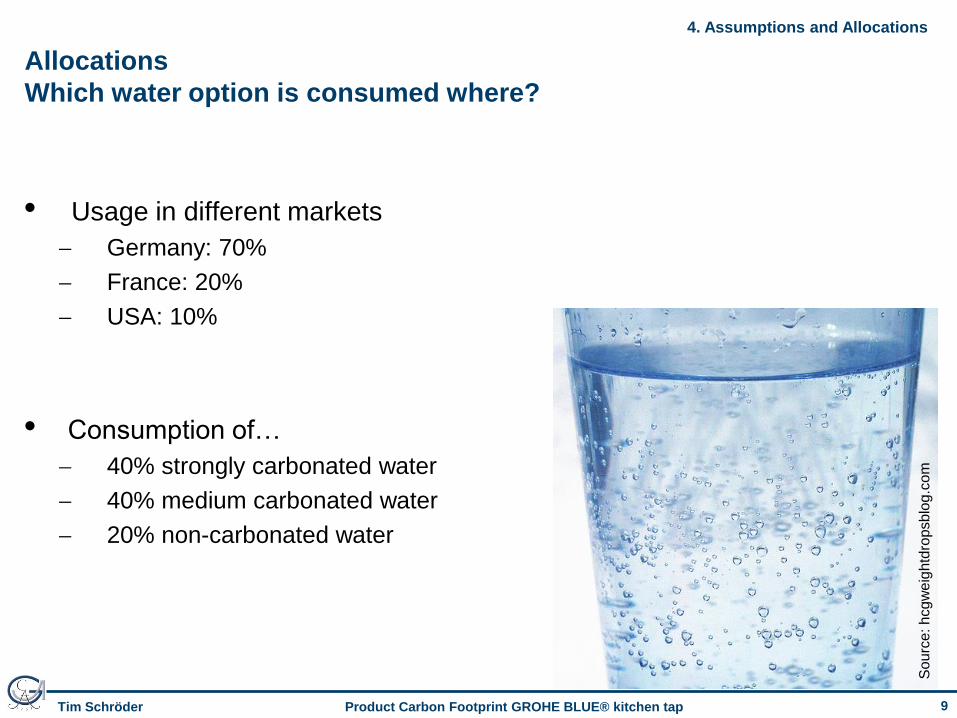
Allocations
Which water option is consumed where?
• Usage in different markets
Germany: 70%
France: 20%
USA: 10%
• Consumption of…
40% strongly carbonated water
40% medium carbonated water
20% non-carbonated water
4. Assumptions and Allocations
So
urc
e: h
cg
we
igh
tdro
psb
log
.co
m

10 Tim Schröder Product Carbon Footprint GROHE BLUE® kitchen tap
10
Results
• 17.96 g CO2-Eq / l in a corporate environment
• 41.96 g CO2-Eq / l in a private household
5. Results
11 Tim Schröder Product Carbon Footprint GROHE BLUE® kitchen tap
11
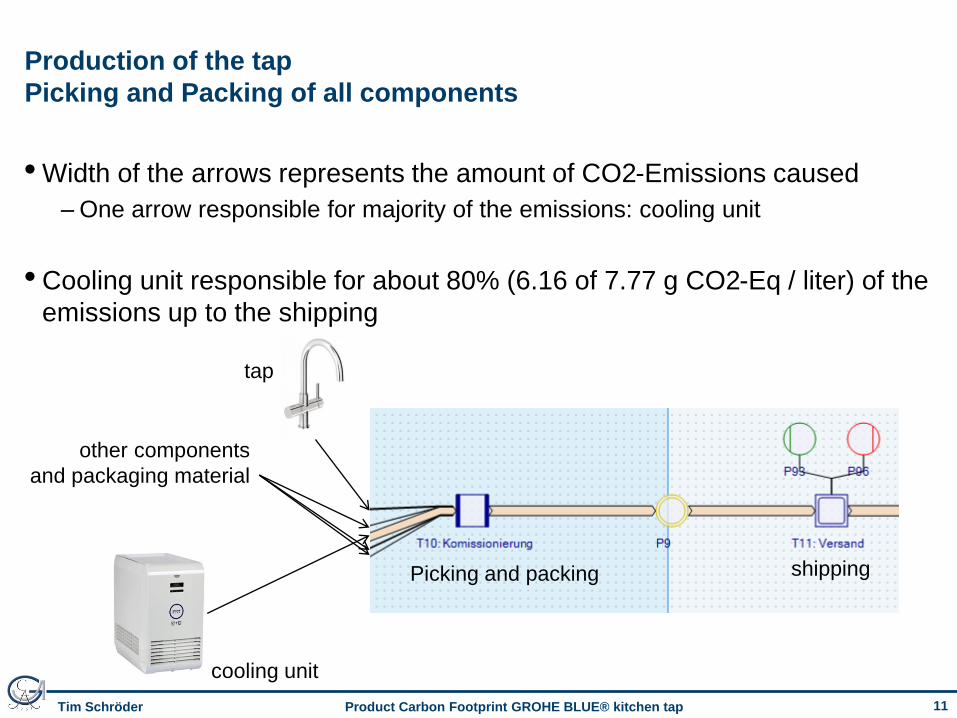
Production of the tap
Picking and Packing of all components
• Width of the arrows represents the amount of CO2-Emissions caused
– One arrow responsible for majority of the emissions: cooling unit
• Cooling unit responsible for about 80% (6.16 of 7.77 g CO2-Eq / liter) of the
emissions up to the shipping
shipping Picking and packing
other components
and packaging material
cooling unit
tap
12 Tim Schröder Product Carbon Footprint GROHE BLUE® kitchen tap
12
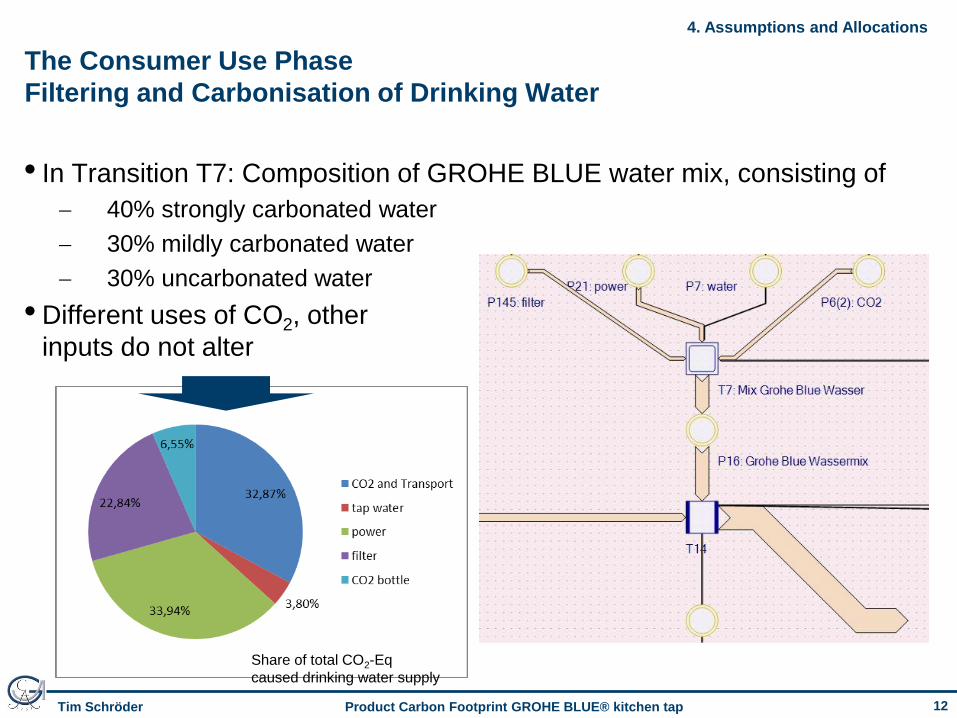
The Consumer Use Phase
Filtering and Carbonisation of Drinking Water
• In Transition T7: Composition of GROHE BLUE water mix, consisting of
40% strongly carbonated water
30% mildly carbonated water
30% uncarbonated water
• Different uses of CO2, other
inputs do not alter
4. Assumptions and Allocations
Share of total CO2-Eq
caused drinking water supply

13 Tim Schröder Product Carbon Footprint GROHE BLUE® kitchen tap
13
Comparator System
GROHE BLUE® drinking water has distinctly lower GHG Emissions
5. Results
17.96 41.96
0
100
200
300
400
500
600
Beverage IndustryEnvironmental
Rountable (2012)
Lieback/Schumacher(2010)
Jungbluth (2006),Flaschen
Dettore (2009),Flaschen
Amienyo et al.(2013)
Jungbluth (2006),Wasserspender
Dettore (2009),Wasserspender
Basisszenario 'Unternehmen' Basisszenario 'Privathaushalt'
g C
O2-E
q / liter
14 Tim Schröder Product Carbon Footprint GROHE BLUE® kitchen tap
14
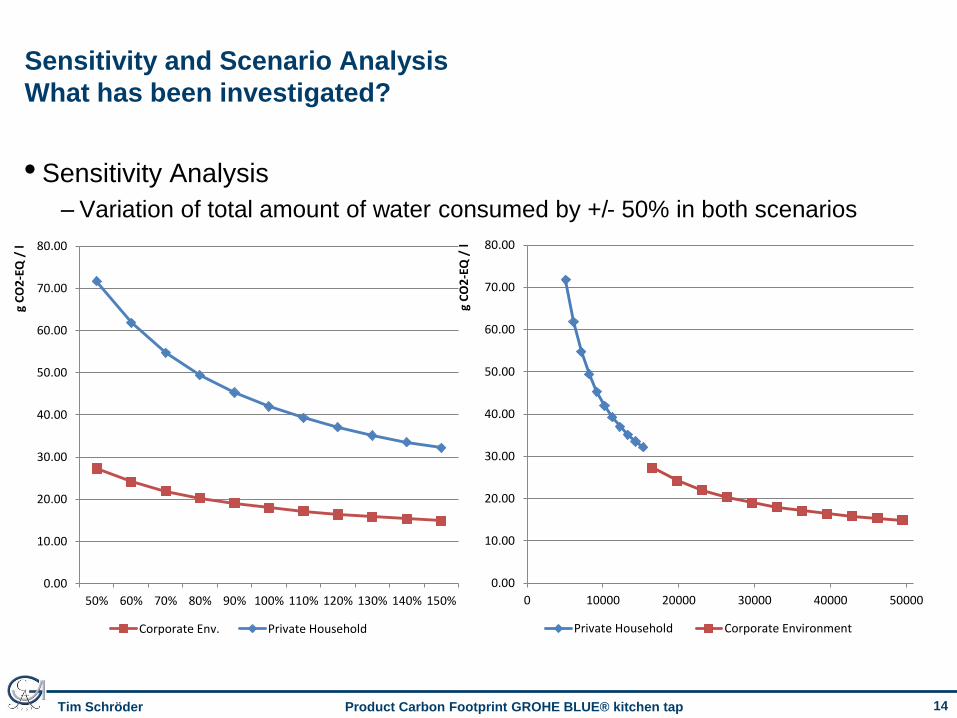
Sensitivity and Scenario Analysis
What has been investigated?
• Sensitivity Analysis
– Variation of total amount of water consumed by +/- 50% in both scenarios
0.00
10.00
20.00
30.00
40.00
50.00
60.00
70.00
80.00
0 10000 20000 30000 40000 50000
g C
O2
-EQ
/ l
Private Household Corporate Environment
0.00
10.00
20.00
30.00
40.00
50.00
60.00
70.00
80.00
50% 60% 70% 80% 90% 100% 110% 120% 130% 140% 150%
g C
O2
-EQ
/ l
Corporate Env. Private Household

15 Tim Schröder Product Carbon Footprint GROHE BLUE® kitchen tap
15
Scenario Analysis
• Scenario
– release of the total amount of the highly climate damaging coolant (R134a)
– All three markets set as single sales market
– All three kinds of water set as only kind of water consumed
– use of green power (wind power) in the consumer use phase
– exclusion of the tap production.
0
5
10
15
20
25
30
35
40
45
50
only GER only FRA only USA strongly carb. med. carb. non-carb. wind energy coolant release tap excluded
corporate private base private base corporate
g C
O2
-Eq / liter
16 Tim Schröder Product Carbon Footprint GROHE BLUE® kitchen tap
16
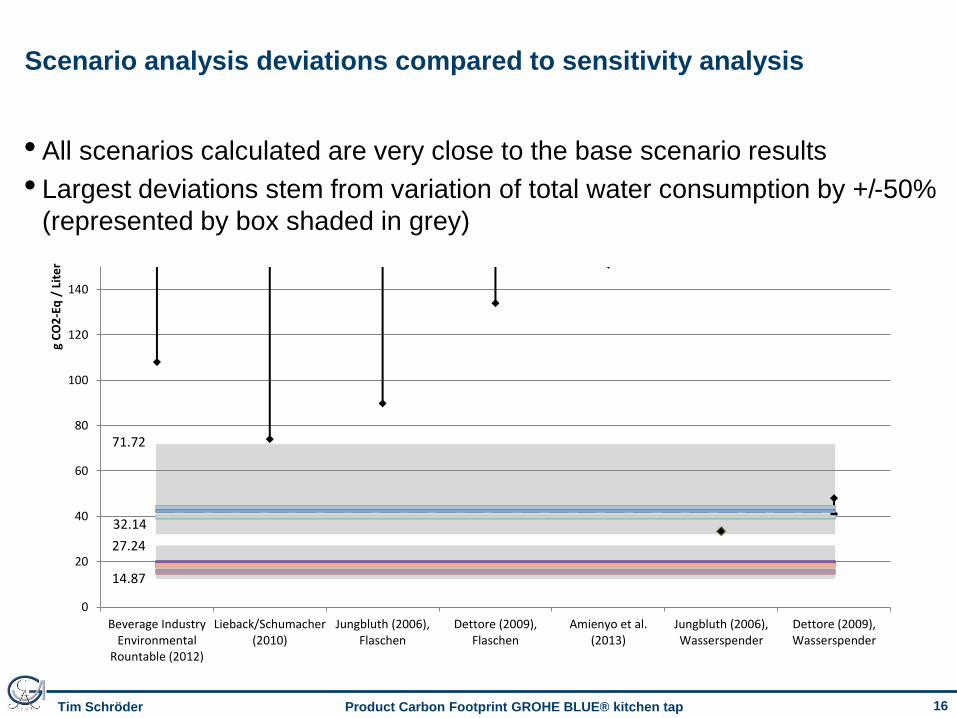
Scenario analysis deviations compared to sensitivity analysis
• All scenarios calculated are very close to the base scenario results
• Largest deviations stem from variation of total water consumption by +/-50%
(represented by box shaded in grey)
32.14
0
20
40
60
80
100
120
140
Beverage IndustryEnvironmental
Rountable (2012)
Lieback/Schumacher(2010)
Jungbluth (2006),Flaschen
Dettore (2009),Flaschen
Amienyo et al.(2013)
Jungbluth (2006),Wasserspender
Dettore (2009),Wasserspender
g C
O2
-Eq
/ L
ite
r
71.72
14.87
27.24

17 Tim Schröder Product Carbon Footprint GROHE BLUE® kitchen tap
17
Conclusions
• Advantageousness in terms of GHG emissions of carbonated drinking water
supply with a GROHE BLUE kitchen tap is evident and robust
• Largest contributors to the product carbon footprint are “Raw Materials” and
“Consumer Use” phase, which account for about 90 % of the GHG emissions
• Customers’ requests for actual numbers of CO2-Eq savings can be met
• General environmental friendliness can not be assessed conclusively since
other environmental impacts were not analyzed

18 Tim Schröder Product Carbon Footprint GROHE BLUE® kitchen tap
18
Contact
Tim Schröder
E-Mail: [email protected]
Phone: +49 551 / 39 - 106 99
Prof. Dr. Jutta Geldermann
E-Mail: [email protected]
Phone: +49 551 / 39 - 72 57
Chair of Production and Logistics
Platz der Göttinger Sieben 3
D – 37073 Göttingen

19 Tim Schröder Product Carbon Footprint GROHE BLUE® kitchen tap
19
Literature
• Aniemyo, D., Gujba, H., Stichnothe, H., Azapagic, A. (2013): Life cycle
environmental im-pacts of carbonated soft drinks, in: International Journal of
Life Cycle Assessment, Vol. 18, Issue 1, January 2013, pp. 77-92.
• Beverage Industry Environmental Roundtable (2012): Research on the
Carbon Footprint of Bottled Water, 2012,
http://bieroundtable.com/files/Bottled%20Water%20Final%20DEP.pdf
• Dettore, C. G. (2009): Comparative Life Cycle Assessment of Bottled vs. Tap
Water, Ann Arbor, 2012, http://css.snre.umich.edu/css_doc/CSS09-11.pdf
• Jungbluth, N. (2006): Vergleich der Umweltbelastungen von Hahnenwasser
und Mineralwasser, in: Gas Wasser Abwasser GWA, 03/2006, S. 215-219.
• Lieback, J., Schumacher, S. (2010): Klimaschutz im Wasserglas, in
UmweltMagazin, 9/2010, S. 62-63.