Embed Size (px)
Citation preview

Tallaksen 2013
Producer Interest In Supplying Corn Stover Biomass
Joel Tallaksen, Biomass ScientistWest Central Research and
Outreach CenterMorris, MN
MN Renewable Energy RoundtableWaseca April 30th

Tallaksen 2013
Using Agricultural Biomass
• Reasons for using biomass for energy– Low cost feedstock– Environmental benefits over fossil fuels
• Wide variety of uses– Cellulosic ethanol– Gasification and combustion– Bioplastics and other compounds
• Corn is king for ag biomass

Tallaksen 2013
Assumptions of Biomass Availability
• USDA and DOE- Billion Ton Report
• Price- based on hay market
• Supply- did not consider some factors– Conservation– Producer interest
• Also, the price needed to interest producers

Tallaksen 2013
Reality of Biomass Availability
• Stover biomass is not fun to collect– Labor– Capital– Time
• Prices are fairly low for the amount of effort
• Can interfere with crop harvesting• Removes potential nutrients and carbon

Tallaksen 2013
Assumptions and Reality Collide
• Some farmers seemed interested.
• Other farmers were very concerned about removing material.
• Little definitive data on Minnesota farmers’ interest in harvesting material.
• Need for definitive study in Minnesota.

Tallaksen 2013
Two Study Components
• Interest survey– Written survey asking producers about their
level of interest and what factor influence that interest
• Mapping availability– Based on interest, production, and
conservation, mapping likely spots with increased biomass availability.

Tallaksen 2013
Part I: Survey
• Interest• Knowledge• Factors influencing decision• Economic considerations• Impacts of harvesting• Demographic influences
Covered in 8 pages, 27 Questions

Tallaksen 2013
Methodology
• Spring 2012• 2500 surveys sent
– USDA NRCS ACRE program participants• Random selected from roughly 50,000
• Data compiled into a large spreadsheet• Statistical analysis- R statistical software

Tallaksen 2013
Sent Surveys and Responses
14.5 % response rate

Tallaksen 2013
Producer Participation Interest
If a regional market for biomass existed, would you be interested in participating by selling biomass from lands you manage?

Tallaksen 2013
Self Assessed Knowledge
Would you agree that you have a good understanding of issues related to collecting agricultural biomass for use in energy or bioproducts manufacturing?

Tallaksen 2013
Sources of InformationAverage producer interest for those receiving information from each source. based on a scale of 1 (not at all interested) to 5 (very interested).
Information Source Av. Int. n Percent(>=Int)Agricultural Magazine 3.19 284 0.39Farmers 3.17 83 0.40Farm Shows 3.30 69 0.48Commodity Groups 3.19 58 0.41Univ. Extension 3.14 57 0.42USDA (ARS and NRCS) 3.40 40 0.47Other 3.42 38 0.50Not Heard 3.12 28 0.43Soil & Water Con. Dist. 3.80 15 0.60
Where you have previously learned about biomass harvesting?

Tallaksen 2013
Factors Important in Interest
How important would the following factors be for making management decisions about biomass harvesting in your operation?

Tallaksen 2013
Influence of the Different FactorsCorrelation Between Decision Factors and InterestAverage level of interest among producers was compared with the averageimportance producers gave each factor.
Factor gamma p.valueFactors Significantly Added Income 0.34 <1e-04*Associated With Added Jobs 0.28 <1e-04*
Increased Interest Ability To Sell On Contract 0.22 0.0022*
Improved Planting 0.17 0.0127*
Weather/timing 0.01 0.9420
Land Rental Agreements -0.03 0.6694
Extra Labor -0.09 0.1997
Extra Time -0.13 0.0773
Equipment Maintenance -0.13 0.0731
Associated with Nutrient replacement -0.20 0.0147*Decreased Interest Maintaining Soil Quality -0.38 <1e-04*

Tallaksen 2013
Producer Perceived Harvest Impacts
If (30-50-70%) of biomass is removed do you feel the factor listed on the left will increase, stay the same or decrease?

Tallaksen 2013
Correlating impacts and interest
• There was a correlation between the amount of interest and the perceived impacts:
Those interested in biomass harvestingthought there would be less impacts than those not interest in harvesting

Tallaksen 2013
Interest in Tillage Changes
Which of the following farming practices would you consider implementing if you were to begin harvesting biomass on your land?
Note: strong correlation between willingness to change and biomass harvest interest.

Tallaksen 2013
Economic Influences
After paying all costs, at what profit level would you consider selling biomass from your croplands (assuming current grain prices)?
Tallaksen 2013
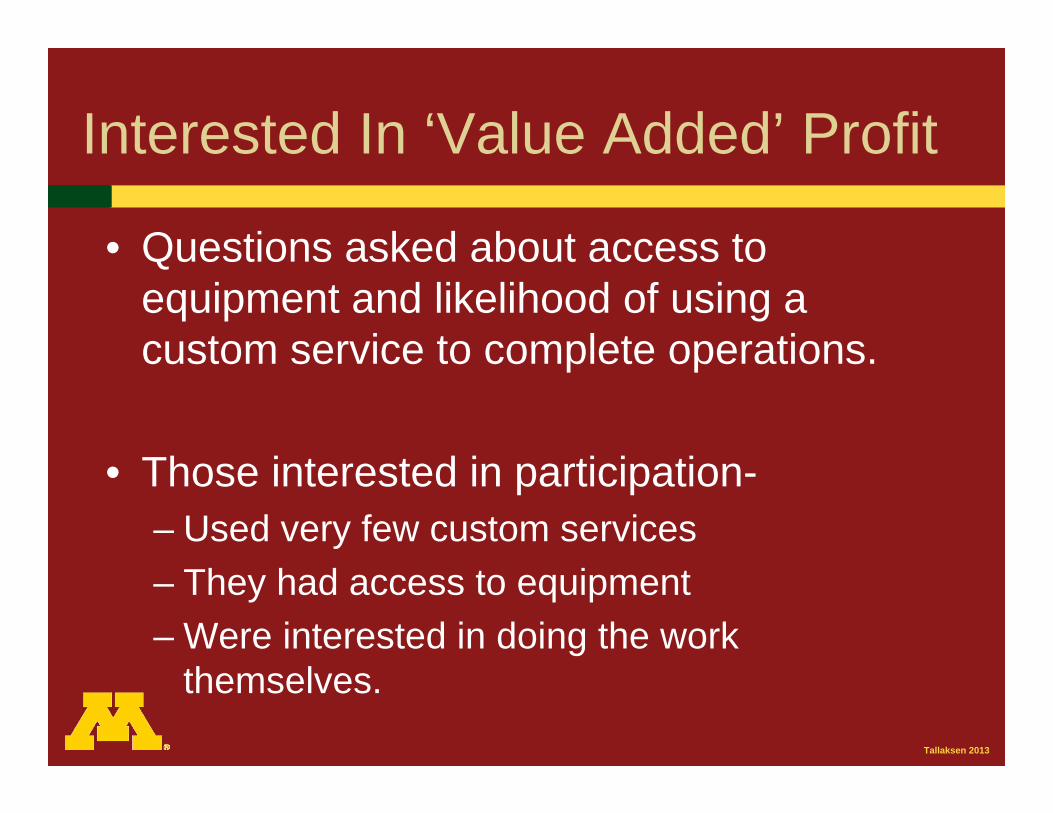
Interested In ‘Value Added’ Profit
• Questions asked about access to equipment and likelihood of using a custom service to complete operations.
• Those interested in participation-– Used very few custom services– They had access to equipment– Were interested in doing the work
themselves.

Tallaksen 2013
Significant Demographic Patterns
• Livestock- Dairy producers less interested
• Other crops- People with pasture interested
• Years Farming – ‘Younger’ more interested– 0 to 30 years of farming
• Location did appear to have an impact

Tallaksen 2013
Regional Variation in Interest
Figure 17 Maps of Three and Four Zone Producer Grouping.

Tallaksen 2013
Rough Profile of Interested Producer
• ‘Younger’• Have access to equipment• Might be in an area with lower
yielding/marginal lands• Might need added income• Not likely to be a dairy farmer

Tallaksen 2013
Using the Interest Data
• Many of the decided are firm in their positions, so undecided producers are needed.
• Undecided producers are key to assuring biomass supplies– Providing information– Answering their concerns– Giving a fair price for biomass

Tallaksen 2013
Part 2: Biomass Mapping
Where should I build my biomass plant?

Tallaksen 2013
Mapping Biomass Availability
• County Level Estimates– Corn production data– Producer Interest– Biomass needing to remain for conservation
• Specific Multi-County Regions Modeled– Eight with geographical & ecological variations– Used county level data– Two supply radii per region: 50 & 70 miles

Tallaksen 2013
Methods
• The mass of corn stover has a unique 1 to 1 relationship with the mass of grain.
• By looking at grain yields and acreage in a given area, we can estimated total biomass (2011 USDA-NASS data used) .
• Using GIS software, the yield data was mapped to individual counties.
• Regional estimates combine county data with producer interest and conservation.

Tallaksen 2013
Sample of County Results
County
Harvested CornAcres
2011Yield
Tons per Acre
Total Tons* County
HarvestedCorn Acres
2011 Yield
Tons perAcre
TotalTons*
Anoka 6,700 119 3.34 22,399 Morrison 70,200 144 4.02 282,260
Becker 42,400 122 3.40 144,245 Mower 205,000 178 4.99 1,022,294
Benton 39,000 109 3.05 119,137 Murray 175,200 169 4.72 826,594
Big Stone 91,500 111 3.10 283,870 Nicollet 119,400 162 4.52 540,261
Blue Earth 194,600 172 4.82 937,738 Nobles 203,500 176 4.93 1,002,848
Brown 157,300 164 4.60 723,202 Norman 73,800 118 3.30 243,422
Carver 55,900 155 4.33 242,293 Olmsted 116,500 183 5.12 596,946
Chippewa 144,700 155 4.34 628,403 Otter Tail 145,400 133 3.72 540,655
Chisago 26,700 135 3.77 100,552 Pine 13,000 134 3.75 48,703
*Biomass tonnage at 15.5% Moisture

Tallaksen 2013
Statewide Biomass Production Map
County Corn Stover Production Density.Density of biomass production in each county calculated by taking total county production and dividing by the size in acres of the entire county. Counties with no or extremely limited corn production colored in white.

Tallaksen 2013
Selected Minnesota Regions
• Selected county seats– Had rail access– Along state highway– Typically had industry– Typically high population

Tallaksen 2013
Ada Region (70 Mile Radius)
Area in Harvested Corn Yield Total StoverCounty Radius Corn Acres bu/acre Produced
Becker 905,542 41,504 121.5 141,197Beltrami 76,000 Clay 674,328 113,500 113.7 361,339Clearwater 615,309 2,241 104.2 6,540Hubbard 124,345 Mahnomen 373,431 Marshall 275,213 2,892 114.5 9,272Norman 561,639 73,800 117.8 243,422Otter Tail 546,948 55,850 132.8 207,672Pennington 382,362 Polk 1,279,618 60,300 124.6 210,375Red Lake 277,055 14,000 120.7 47,314Wilkin 303,389 56,617 120.9 191,659
6,395,179 420,704 1,418,789
Minnesota Counties shown for example

Tallaksen 2013
50 Mile Radius Total Production
Participation All Above Ground Biomass (tons)Region Low High Minnesota Border TotalAda 43.75% 56.25% 932,710 825,683 1,758,393Fergus Falls 56.67% 68.33% 2,381,478 603,192 2,984,669St. Cloud 47.06% 69.61% 2,824,189 - 2,824,189Morris 48.84% 67.44% 4,584,719 437,981 5,022,700Olivia 50.00% 67.42% 7,692,575 - 7,692,575Mankato 38.03% 57.04% 9,047,653 177,616 9,225,270Worthington 27.03% 51.35% 5,702,238 4,692,915 10,395,153Austin 36.59% 58.54% 6,193,375 4,274,700 10,468,075

Tallaksen 2013
High and Low Participation Models

Tallaksen 2013
50 Mile Radius Total Production
Region Purchasable Biomass
Ada 725,996Fergus Falls 1,691,313St. Cloud 1,329,030Morris 2,452,947Olivia 3,846,287Mankato 3,508,201Worthington 2,809,501Austin 3,830,269
Region Purchasable Biomass
Ada 933,424Fergus Falls 2,039,524St. Cloud 1,965,857Morris 3,387,403Olivia 5,186,660Mankato 5,262,302Worthington 5,338,051Austin 6,128,011
Low participation High participation

Tallaksen 2013
Important Conservation Concerns
• Erosion
• Soil Carbon
• Soil Nutrients
There is not yet a firm consensus on the best method to account for soil conservation in biomass availability models. Soils, slopes, and yield variations make predictions very complex. Area is SE Minnesota where
erosion is an important concern

Tallaksen 2013
50 Mile Radius After Conservation
Region Purchasable Biomass
Ada 362,998 Fergus Falls 845,656 St. Cloud 664,515 Morris 1,226,473 Olivia 1,923,144 Mankato 1,754,101 Worthington 1,404,750 Austin 1,915,134
RegionPurchasable Biomass
Ada 466,712 Fergus Falls 1,019,762 St. Cloud 982,929Morris 1,693,701 Olivia 2,593,330 Mankato 2,631,151 Worthington 2,669,026 Austin 3,064,006
Low participation High participation

Tallaksen 2013
Regional Conclusions
• There is a good deal of biomass
• Multiple facilities would need to consider possible competition in selecting a location
• Larger Facilities best located in S. Minn.
• Conservation may not be adequately covered in the model

Tallaksen 2013
Estimated Ranges for Stover Facilities
• Based on:– County data– Soils– Populated areas

Tallaksen 2013
Notes On Using This Information
• Data is a snapshot of biomass availability• Interest will vary significantly over time
– Grain prices– Weather – Price paid
• Still need more guidance on conservation• These models and the GIS data can be
updated as new data is added

Tallaksen 2013
Acknowledgements• Aaron Rendahl, U of M, School of Statistics• Dan and Britta, U of M student interns• USDA- NRCS• USDA- NASS
• Organizations whose support made this work possible:

Tallaksen 2013
Interest vs Corn PriceCorrelation between Corn Price and Participation Interest Statistical analysis indicated price and interest were significantly associated at p=0.001
Participation Interest Mean Corn Price
Very Interested $5.04
Interested $4.58
Undecided $4.39
Not Interested $3.94
Not at all $4.60
How low would the price of corn need to be before you would consider selling biomass to supplement the corn grain income?


![La Catedral(Stover Ed.)[1]](https://img.dokumen.tips/doc/110x75/55cf9135550346f57b8b8a5c/la-catedralstover-ed1.jpg)