Embed Size (px)
Citation preview

Electricity Supply Resource Procurement Plan
South Dakota 2016

Table of Contents
2016 South Dakota Electricity Supply Resource Procurement Plan Page i-i
TABLE OF CONTENTS
SUBJECT PAGE
CHAPTER 1 - EXECUTIVE SUMMARY ......................................... 1-1
The 2016 South Dakota Integrated Resource Plan ..................................1-1
Southwest Power Pool ...............................................................................1-1
Load Requirements ....................................................................................1-2
o Energy ...............................................................................................1-2
o Capacity ............................................................................................1-3
Existing Resources ....................................................................................1-5
o Retirement Study .............................................................................1-6
Grid Reliability ............................................................................................1-6
Resource Options .......................................................................................1-8
Portfolio Modeling and Analysis ...............................................................1-8
Conclusions ................................................................................................1-9
CHAPTER 2 – Southwest Power Pool MARKET ......................... 2-1
Regional Transmission Organization .......................................................2-1
Transition to SPP ........................................................................................2-1
SPP Overview .............................................................................................2-1
o Day Ahead Market ............................................................................2-3
o Real Time Balancing Market ...........................................................2-5
o Auction Revenue Rights (ARR) and Transmission
Congestion Rights (TCR) ....................................................2-5
NorthWestern Participation in the SPP Integrated Marketplace .............2-5
Capacity Requirement ................................................................................2-6
SPP Transmission Planning Process .......................................................2-6
Opportunities for NorthWestern within SPP’s ITP Process ....................2-7

Table of Contents
2016 South Dakota Electricity Supply Resource Procurement Plan Page i-ii
SUBJECT PAGE
CHAPTER 3 – EXISTING PORTFOLIO RESOURCES .................. 3-1
Existing Portfolio Resources Discussion ................................................3-1
o Big Stone Plant ................................................................................3-2
o Neal Energy Center Unit 4 ..............................................................3-3
o Coyote Station .................................................................................3-3
Peaking Units ..............................................................................................3-4
Demand Side Management ........................................................................3-6
Wind Units ...................................................................................................3-8
o Beethoven ........................................................................................3-8
o Titan I ...............................................................................................3-8
o Oak Tree ...........................................................................................3-8
o Capacity Evaluation of Wind ...........................................................3-8
Capacity and Energy Agreements ............................................................3-10
Energy Resource Mix .................................................................................3-10
Capacity Resource Mix ..............................................................................3-15
Retirement Study ........................................................................................3-17
CHAPTER 4 – NEW RESOURCES ................................................ 4-1
New Resources Overview ..........................................................................4-1
Thermal Resources ....................................................................................4-1
o Technology Study ............................................................................4-1
o Defining New Gas-Fired Resources ...............................................4-2
o Resource Siting ...............................................................................4-3
RFP for Capacity .........................................................................................4-5
o SPP Screening Studies for Long Term Service Requests ...........4-6
Grid Reliability ............................................................................................4-6
Demand Side Management ........................................................................4-8

Table of Contents
2016 South Dakota Electricity Supply Resource Procurement Plan Page i-iii
SUBJECT PAGE
Wind Resources .........................................................................................4-9
Utility Scale Solar PV .................................................................................4-9
Qualifying Facilities ....................................................................................4-10
Energy Storage ...........................................................................................4-11
CHAPTER 5 FORECASTS ............................................................. 5-1
Historic Growth of Energy .........................................................................5-1
Historic Growth of Capacity Demand .......................................................5-1
Load Forecasting ........................................................................................5-3
o Energy ...............................................................................................5-3
o Capacity ............................................................................................5-8
Commodity Forward Prices .......................................................................5-11
Natural Gas Price Forecast ........................................................................5-11
Electricity Price Forecast ...........................................................................5-11
Coal Price Forecast ....................................................................................5-12
Conclusions ................................................................................................5-13
CHAPTER 6 PORTFOLIO MODELING AND ANALYSIS .............. 6-1
Modeling Overview .....................................................................................6-1
Portfolio Analysis .......................................................................................6-1
o Summary of Results ........................................................................6-3
Evaluation of Capacity Resource Additions ............................................6-8
o Input Assumptions for Capacity Resource Additions ..................6-10
Conclusions ................................................................................................6-12
CHAPTER 7 ENVIRONMENTAL .................................................... 7-1
Environmental Trends that Influence the 2016 Plan ................................7-1

Table of Contents
2016 South Dakota Electricity Supply Resource Procurement Plan Page i-iv
SUBJECT PAGE
Introductory Statement ..............................................................................7-1
Greenhouse Gas Emissions ......................................................................7-1
New Source Performance Standards ........................................................7-2
Existing Source Performance Standards .................................................7-2
Carbon Costs ..............................................................................................7-3
Summary of Key Environmental Risks: Jointly Owned Facilities ..........7-4
Regional Haze Rule ....................................................................................7-4
o Big Stone Plant ................................................................................7-4
o Coyote Station .................................................................................7-4
o Neal Unit 4 ........................................................................................7-5
o Regional Haze SIP Revisions ..........................................................7-5
Mercury and Air Toxics Rule .....................................................................7-5
Coal Combustion Residuals ......................................................................7-6
o Big Stone Plant ................................................................................7-6
o Coyote Station .................................................................................7-6
Summary of Key Environmental Risks: Owned Facilities ......................7-7
Other Environmental Considerations .......................................................7-8
Wind Generation .........................................................................................7-8
Summary .....................................................................................................7-8
CHAPTER 8 CONCLUSIONS AND ACTION PLAN ....................... 8-1
Conclusion ..................................................................................................8-1
Portfolio Management ................................................................................8-1
Action Plan ..................................................................................................8-2

Table of Contents
2016 South Dakota Electricity Supply Resource Procurement Plan Page i-v
FIGURES AND TABLES FIGURE PAGE
1-1 Historical Load – Retail Sales 2006- July 2016 ........................................1-3
1-2 Capacity Requirements and Available Peak Capacity ............................1-4
1-3 2014 Actual vs. 2016 Forecast Energy Resource Mix .............................1-5
2-1 Regional Transmission Organizations / Independent
System Operators ................................................................................. 2-2
3-1 Map of NorthWestern’s Electric Generation Resources .........................3-1
3-2 NorthWestern SD Energy Supply Mix .......................................................3-11
3-3 2015 SPP Generation Mix ..........................................................................3-11
3-4 Resource Allocation History – System Load vs. Energy
Production & Net Market Purchases ......................................................3-13
3-5 2015 Load Duration Curve .........................................................................3-14
3-6 2005-2015 Annual Purchased Power Costs .............................................3-15
3-7 Summer Peaking Capacity Resource Mix 2014 & 2016 ...........................3-16
3-8 2012–2016 Capacity Portfolio vs. Annual Reserve Requirement ...........3-17
5-1 Historical Load – Retail Sales 2006 – July 2016 .......................................5-1
5-2 Historical Electric Demand (Capacity) 2003 – 2015 .................................5-2
5-3 Historical and Forecast System Load .......................................................5-4
5-4 2014 Actual vs. 2016 Forecast Energy Resource Mix .............................5-5
5-5 NorthWestern Supply Portfolio Monthly ATC Resource
Stack Base Case ....................................................................................5-6
5-6 Monthly ATC Market Purchases & Sales ..................................................5-7
5-7 Annual Purchased Power Cost and Associated MWh ............................5-8
5-8 Capacity Requirements and Available Peak Capacity ............................5-10
6-1 10-Year NPV of Portfolio Costs Renewables, 2017-2026 (2017$) ...........6-4
6-2 10-Year NPV of Portfolio Costs Thermal, 2017-2026 (2017$) ..................6-5
6-3 Annual Portfolio Costs Base and Renewables ........................................6-6

Table of Contents
2016 South Dakota Electricity Supply Resource Procurement Plan Page i-vi
FIGURE PAGE
6-4 Annual Portfolio Cost Base, Thermals, and Clean Power Plan ..............6-6
6-5 Net Position Base and Renewable Portfolios ..........................................6-7
6-6 Net Position for Base, Thermal, and Clean Power Plan Portfolios ........6-8
6-7 Annualized Gross Margin Profit by Market Product for
Wartsila 50SG and P&W Swiftpac 60 Generation ...............................6-9

Table of Contents
2016 South Dakota Electricity Supply Resource Procurement Plan Page i-vii
TABLE PAGE 1-1 Locational Generation and Loads .............................................................1-7
3-1 Generation Asset Summary .......................................................................3-2
3-2 Thermal Peaking Units ...............................................................................3-5
4-1 Technology Assessment Configurations .................................................4-2
4-2 Resource Definition and Cost Summary ..................................................4-3
4-3 Siting Study Locations and Rankings ......................................................4-4
4-4 Locational Generation and Loads .............................................................4-7
4-5 Storage Technologies and Cost ................................................................4-12
5-1 Historical Yearly Winter Peak Load ..........................................................5-3
5-2 Summer Peak Load 10-Year Forecast ......................................................5-9
5-3 Base Case Electricity and Natural Gas Price Forecasts .........................5-12
5-4 Coal Price Forecasts ..................................................................................5-13
6-1 Resource Plan Portfolio Assumptions .....................................................6-3
6-2 Generation Asset Input Assumptions ......................................................6-10
6-3 Summary of Energy Market Price Inputs for South Dakota ....................6-11
6-4 Summary of Ancillary Market Price Inputs for South Dakota .................6-11
7-1 Environmental and Natural Resource Permits .........................................7-7

Volume 1, Chapter 1 – Executive Summary
2016 South Dakota Electricity Supply Resource Procurement Plan Page 1-1
CHAPTER 1 EXECUTIVE SUMMARY
The 2016 SD Electricity Supply Resource Procurement Plan
The 2016 South Dakota Electricity Supply Resource Procurement Plan (“Plan”) evaluates
NorthWestern Energy’s (“NorthWestern”) electric load-serving obligation and guides
NorthWestern’s resource procurement process in South Dakota for the next 10 years. The
Plan sets forth resource options that maintain cost-effective electric service for our
customers in South Dakota and meet Southwest Power Pool (“SPP”) requirements. This
document sets forth a plan to at least study the older generation units in NorthWestern’s
fleet of generation resources and explore opportunities to enhance grid reliability. The Plan
also analyzes a range of environmental and market uncertainties that have the greatest
potential to impact customer needs and long-term procurement options.
NorthWestern’s resource plan is updated biennially and evolves with any significant
changes in legislation, regional operational or planning needs, and environmental
requirements. The Plan’s conclusions are intended to provide guidance regarding
NorthWestern’s resource investments on behalf of its South Dakota customers. Within this
changing resource planning landscape, NorthWestern will maintain flexibility when
implementing this Plan.
Southwest Power Pool
NorthWestern joined the SPP in October 2015. NorthWestern participates in several
aspects of the SPP Integrated Marketplace including the Day-Ahead Market, Real-Time
Balancing Market, and the Auction Revenue Rights / Transmission Congestion Rights
Market. As a participant in SPP, NorthWestern must abide by market rules and

Volume 1, Chapter 1 – Executive Summary
2016 South Dakota Electricity Supply Resource Procurement Plan Page 1-2
requirements including the requirement to maintain a specified level of Planning Reserve
Margin (“PRM”).
Load Requirements
Energy
NorthWestern’s assets are located in the newly developed Upper Missouri Zone (“UMZ”)
of SPP. This zone was created by SPP to designate the addition of the Integrated System
(“IS”) with regional participants and NorthWestern. Both the UMZ and SPP are very long
in electric energy supply and renewable resources. As a result, the need for additional base
load energy-producing resources will be limited for a period of time unless the existing
resources or loads change significantly. As a member of SPP, NorthWestern will tailor
supply resource planning activities for energy, capacity and ancillary services to fit within
the definition and characteristics of the SPP market and operational protocols.
NorthWestern’s total system energy need has grown over the last 10 years at an average
rate of approximately 29,000 megawatt-hours (“MWh”) per year. System energy
requirements for a 12-month period ending July 31, 2016 were around 1.65 million MWh
as shown in Figure 1-1 below.
(Remaining page blank for figure.)

Volume 1, Chapter 1 – Executive Summary
2016 South Dakota Electricity Supply Resource Procurement Plan Page 1-3
Figure 1-1 Historical Load – Retail Sales 2006 – July 2016
Capacity
NorthWestern’s peak capacity needs have increased by an average annual amount of 2.6
megawatts (“MW”) per year since 2003, with a peak load of 341 MW in 2012. Peak load
in 2016 was 331 MW. Currently, NorthWestern’s owned and contracted resources have a
combined summer peaking capacity of approximately 390 MW. Going forward,
NorthWestern’s capacity planning will have the added requirement of meeting SPP’s PRM.
The PRM is defined as the difference between an entity’s firm capacity and its peak
demand, divided by its peak demand. Starting in 2017, SPP will require a minimum PRM
of 12% which, based on a forecasted peak, results in a capacity requirement of
approximately 379 MW in 2017.
0
200
400
600
800
1,000
1,200
1,400
1,600
1,800
2006 2007 2008 2009 2010 2011 2012 2013 2014 2015
MW
h (
Th
ou
san
ds
)
Historical Load (includes Losses)2006 - July 2016
Load Linear (Load MWh)
Average Annual Growth = 29,000 MWh
12-mo end July 2016
Volume 1, Chapter 1 – Executive Summary
2016 South Dakota Electricity Supply Resource Procurement Plan Page 1-4
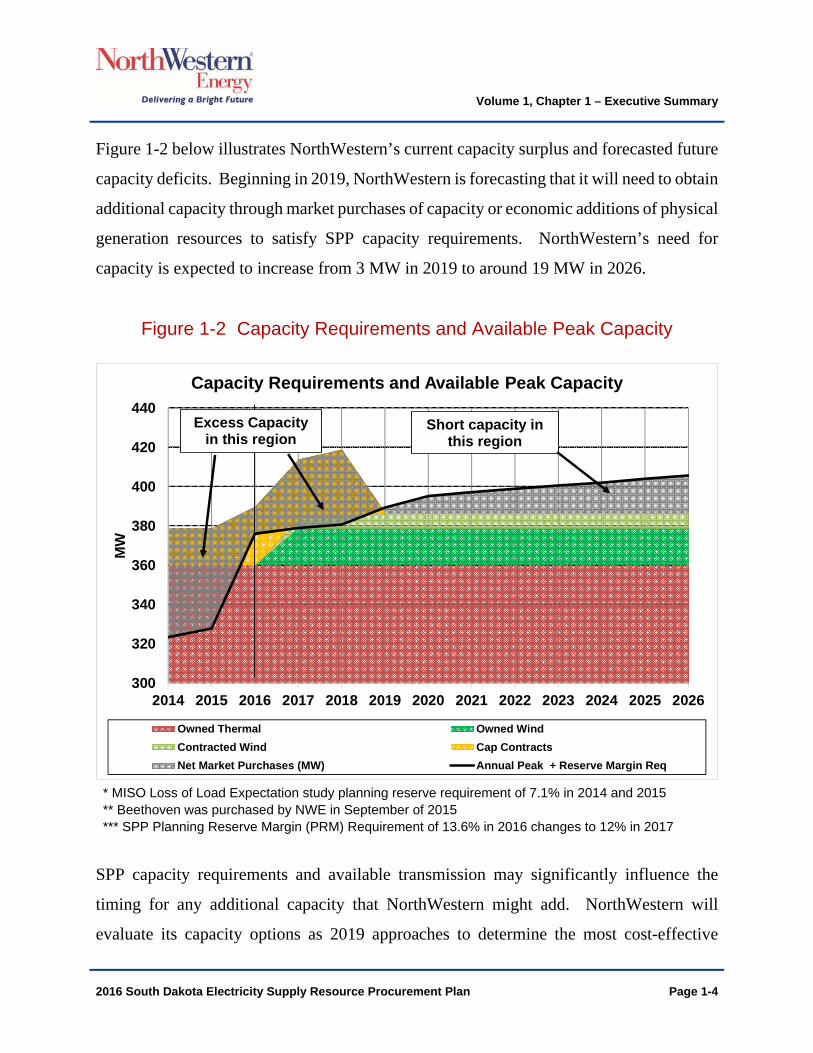
Figure 1-2 below illustrates NorthWestern’s current capacity surplus and forecasted future
capacity deficits. Beginning in 2019, NorthWestern is forecasting that it will need to obtain
additional capacity through market purchases of capacity or economic additions of physical
generation resources to satisfy SPP capacity requirements. NorthWestern’s need for
capacity is expected to increase from 3 MW in 2019 to around 19 MW in 2026.
Figure 1-2 Capacity Requirements and Available Peak Capacity
* MISO Loss of Load Expectation study planning reserve requirement of 7.1% in 2014 and 2015 ** Beethoven was purchased by NWE in September of 2015 *** SPP Planning Reserve Margin (PRM) Requirement of 13.6% in 2016 changes to 12% in 2017
SPP capacity requirements and available transmission may significantly influence the
timing for any additional capacity that NorthWestern might add. NorthWestern will
evaluate its capacity options as 2019 approaches to determine the most cost-effective
300
320
340
360
380
400
420
440
2014 2015 2016 2017 2018 2019 2020 2021 2022 2023 2024 2025 2026
MW
Capacity Requirements and Available Peak Capacity
Owned Thermal Owned Wind
Contracted Wind Cap Contracts
Net Market Purchases (MW) Annual Peak + Reserve Margin Req
Short capacity in this region
Excess Capacity in this region

Volume 1, Chapter 1 – Executive Summary
2016 South Dakota Electricity Supply Resource Procurement Plan Page 1-5
capacity additions and will examine economic opportunities to replace aging generation
infrastructure and enhance grid reliability.
Existing Resources
In 2015, NorthWestern’s energy supply portfolio added 99.5 MW of intermittent wind
resources. This increase in wind shifts the resource mix that provides energy for
NorthWestern’s load. Figure 1-3 (duplicated from figure 5-4) shows the shift in resources
that provide energy for NorthWestern’s load comparing 2014 actuals to 2016 forecast.
Intermittent wind will make up 25% of the supply for the portfolio reducing the amount of
coal generation needed. Annual net market purchase figures remain stable as any
reductions due to increased wind generation are balanced by increased economic purchases
due to lower market prices. The forecast for 2016 also will see additional natural gas
generation due to the dispatch requirements of SPP. SPP will continue to economically
dispatch NorthWestern’s registered resources.
Figure 1-3 2014 Actual vs. 2016 Forecast Energy Resource Mix
Continued low market prices allow NorthWestern to make economical purchases in lieu of
operating higher-priced internal resources, resulting in lower costs to customers. The 13
Peaking Gas and Diesel0.7%
Baseload Coal83.2%
Wind (Owned & Contracted), 5.5%
Net Market Purchases10.6%
2014 Energy Resource Mix(1.67 GWh Total)
Peaking Gas and Diesel
2.5%
Baseload Coal60.8%
Wind (Owned & Contracted)
25.3%
Net Market Purchases11.4%
2016 Energy Resource Mix(2.00 GWh Total)

Volume 1, Chapter 1 – Executive Summary
2016 South Dakota Electricity Supply Resource Procurement Plan Page 1-6
peaking units, with a combined 193 MW nameplate capacity, are available to supply
capacity but do not generate a significant amount of energy annually.
Retirement Study
With the economic dispatch regime of SPP, NorthWestern must re-examine how best to
serve its customers’ needs. NorthWestern’s entry into SPP has lowered customers’ rates,
and has changed NorthWestern’s dispatch of resources. An evaluation of NorthWestern’s
older generation assets for possible retirement and replacement is needed to determine how
to best serve the long-term needs of our customers.
NorthWestern is working with an engineering consulting firm to develop a Retire and
Replacement Study for the natural gas-fired and oil-fired generating units. The study will
examine heat rates, parts availability, and book value and will provide a cost benefit
analysis for replacement of those assets with proxy technology selections. The economic
contributions of each asset to the overall resource portfolio will also be evaluated.
NorthWestern expects that the study will be completed in July 2017, and the results will
be used to inform its resource development plans for South Dakota.
Grid Reliability
Historically, NorthWestern operated generating plants throughout its South Dakota service
territory, including Webster, Aberdeen, Faulkton, Redfield, Clark, Huron, Woonsocket,
Highmore, Chamberlain, and Yankton. These plants were originally built for base load
generation, supplying power around-the-clock for the communities served. As the
transmission system was expanded, these same units continued to provide peaking energy,
as well as contingency reserves and reliability support, to those same communities.

Volume 1, Chapter 1 – Executive Summary
2016 South Dakota Electricity Supply Resource Procurement Plan Page 1-7
Resource development plans for South Dakota will be undertaken with the goal of
increasing grid reliability when addressing resource portfolio requirements. Strategically
locating generation assets across the system, while meeting the overall system capacity
requirement, adds an additional level of reliability. It also provides additional capability
for integrating current and future renewable generating resources, which can be widely
distributed within NorthWestern’s system. Table 1-1 compares current generating
capability of existing generation assets to 2015 peak loads at select locations within South
Dakota.
Table 1-1 Locational Generation and Loads
The table shows that generation in Huron exceeded peak demand in 2015, while Aberdeen
generation nearly matches peak demand. In comparison, Mitchell had a peak demand of
about 54 MW in 2015 and currently has no generation capability. Yankton’s existing
generation can only support about 25% of its 2015 peak demand. The other communities
listed in Table 1-1 either represent larger population centers that previously had generation
or remote locations with limited/partial contingency back-up capability. Locating
economic generation capacity at these locations could provide economic system capacity
while increasing reliability.

Volume 1, Chapter 1 – Executive Summary
2016 South Dakota Electricity Supply Resource Procurement Plan Page 1-8
Resource Options
The Plan examines natural gas, wind, solar photovoltaics (“PV”), Demand Side
Management (“DSM”), and energy storage resources as possible additions to the portfolio.
DSM programs were implemented in late 2014 and have expanded to include prescriptive
rebates for residential and commercial electric new construction customers. Utility-scale
energy storage technologies were also evaluated to update estimates of costs and
capabilities and to identify potential value in the context of the SPP Market. Lithium-ion,
vanadium flow, and sodium sulfur batteries, as well as pumped-storage hydro and
compressed air storage systems, were considered as potential future additions though not
modeled in this Plan.
Portfolio Modeling and Analysis
NorthWestern modeled a number of resource options using the PowerSimmTM suite from
Ascend Analytics (“Ascend”). The eight portfolios examined are described in greater
detail in Chapter 6:
Base – Existing assets plus market purchases.
50 MW Wind – Base plus 50 MW wind.
100 MW Wind – Base plus 100 MW wind.
50 MW Solar – Base plus 50 MW solar.
100 MW Solar – Base plus 100 MW solar.
Recip – Base plus two reciprocating engines in 2022 and one reciprocating engine
in 2024.
Combustion Turbine – Base plus one combustion turbine in 2022.
Clean Power Plan – Base case plan under Clean Power Plan compliance.

Volume 1, Chapter 1 – Executive Summary
2016 South Dakota Electricity Supply Resource Procurement Plan Page 1-9
The Base portfolio is the least cost net present value (“NPV”) portfolio, but with slightly
higher risk than thermal or wind portfolios. NorthWestern is in a position where it must
make market purchases in order to fulfill its load-serving obligation in all portfolios other
than the 100 MW Wind portfolio. Possible future environmental regulations as measured
in the Clean Power Plan portfolio increase costs only slightly over the Base portfolio.
The Recip portfolio has a lower NPV cost than the renewable portfolios or the Combustion
Turbine portfolio. Peaking generation that can rapidly and efficiently respond to the SPP
market price signals has additional value over less flexible or less efficient generation.
Reciprocating engines provide capacity, deliver dispatchable economic energy, and
provide ancillary services.
Conclusions
This Plan sets forth the criteria by which NorthWestern will evaluate future resource
decisions, including addressing its future capacity requirements, potential plant
retirements, and enhancements to grid reliability. Existing uncertainties discussed in the
Plan, such as the regulation of carbon emissions and other regulatory considerations, will
have a significant influence on the type and timing of future resource choices. SPP
requirements will also greatly influence resource decisions, as will transmission
availability, or the lack thereof.

Chapter 2 – SPP Market
2016 South Dakota Electricity Supply Resource Procurement Plan Page 2-1
CHAPTER 2 SOUTHWEST POWER POOL (SPP) MARKET
Regional Transmission Organization
Transition to SPP
NorthWestern’s transmission, load, and generating resources in the state of South Dakota
are located within what was formerly the Balancing Authority (“BA”) of the Western Area
Power Administration Upper Great Plains Region (“Western-UGP”). The Western-UGP
region was comprised of approximately 10,000 miles of transmission owned by Western,
Basin Electric Power Cooperative (“Basin”), and Heartland Consumers Power District
(“Heartland”) and collectively known as the Integrated Transmission System (“IS”). On
October 1, 2015, NorthWestern along with Western-UGP, Basin, and Heartland, joined the
SPP.
SPP Overview
SPP is one of the seven Regional Transmission Organizations (“RTOs”) / Independent
System Operators (“ISOs”) in the United States. Figure 2-1 below shows a map of the latest
RTOs in North America. RTOs independently administer the transmission grids within
their foot prints and host markets where their members and other participants transact.1
The key characteristic of an RTO market is that the RTO is responsible for committing the
units of the Market Participants within the footprint. The SPP Integrated Marketplace offers
a Day-Ahead Market and Real Time Balancing Markets. The Integrated Marketplace offers
5-Minute Settlements.
1 The terms RTO and ISO are used synonymously for ease of reference in this document.

Chapter 2 – SPP Market
2016 South Dakota Electricity Supply Resource Procurement Plan Page 2-2
Figure 2-1: Regional Transmission Organizations / Independent System
Operators
SPP was founded in 1941 and now operates as an RTO in 14 states (AR, IA, KA, LA, MN,
MO, MT, NE, NM, ND, OK, SD, TX, and WY) with 94 members including investor-
owned, municipal systems, generation and transmission cooperatives, and other entities. In
additional to the Integrated Marketplace founded in 2014, which encompasses the Day-
Ahead, Real-Time, Operating Reserve, and Transmission Congestion Rights Markets, SPP
is a centralized Balancing Authority, Reliability Coordinator, and Regional Entity.
The SPP Integrated Marketplace offers five products, which are grouped into two
categories: Energy and Operating Reserve. The products under the Operating Reserve
category are classified as: Regulation Reserve, which includes Regulation-Up Reserve and

Chapter 2 – SPP Market
2016 South Dakota Electricity Supply Resource Procurement Plan Page 2-3
Regulation-Down Reserve; and Contingency Reserve, which includes Spinning Reserve
and Supplemental Reserve.
The SPP Integrated Marketplace encompasses different processes: Day Ahead Market
(“DA Market”), Reliability Unit Commitment (“RUC”), Real-Time Balancing Market
(“RTBM”), Reserve Market, Auction Revenue Rights (“ARR”)/Transmission Congestion
Rights (“TCRs”).
Day Ahead Market
The key objective of the DA Market is to enable Market Participants to offer and bid for
Energy and Operating Reserve products. The DA Market uses specialized systems and
algorithms to co-optimize the availability of Energy and Operating Reserves, to ensure that
the available resources are able to meet the load demand and operating reserve obligations
for the next Operating Day. The DA Market is financially binding. Market Participants
submit Resource Offers for generation into the DA Marketplace. Each Market Participant
that serves load must offer enough capacity to cover the bid-in load and Operating Reserve
requirements for the next Operating Day.
A Demand Bid in the DA Market is a proposal made by a Market Participant to purchase
Energy at a specified location and period of time in the Day-Ahead Market. Only a Market
Participant with a registered load may submit demand bids for the registered load
Settlement Location. Market Participants are required to submit their Day-Ahead Demand
bids, Resource Offers, and outage notifications, along with certain other information to
SPP by 9:30 a.m. each day. Once the Market runs its processes, SPP publishes the results
of the DA Market which include hourly information for each Market product award and
the Locational Marginal Price (“LMP”) for each Settlement Location for each hour. The
LMP is the cost to serve the next increment of load at the specified Settlement Location.

Chapter 2 – SPP Market
2016 South Dakota Electricity Supply Resource Procurement Plan Page 2-4
In addition, SPP also publishes the Marginal Clearing Price (“MCP”) for each Operating
Reserve product for each Reserve Zone. The MCP for an Operating Reserve product is the
cost to provide the next capacity increment for the Operating Reserve product at the
specific Reserve Zone.
A key activity in the DA Market is the RUC process. The RUC is a mechanism used by
SPP to create a reliable operating plan for the next Operating Day to ensure that there is
enough capacity available and committed to cover the system load and Operating Reserved
requirements forecasted for that day. The key objective of the DA and RUC processes is
to create an operating schedule that will minimize the total commitment costs based on
availability of generation resource offers, system load, and Operating Reserve
requirements forecast for the next Operating Day. SPP requires that each Market
Participant submit offers for both DA and RT for any registered resource that is not on
planned, forced, or other approved outage. Any Resource committed by the RUC process
or the Reliability Assessment processes for the next Operating Day are subject to Make-
Whole Payment if they meet the eligibility criteria.
The MWP is a unique feature in the DA Market, with the objective to make any Resource
committed in the DA financially whole. The MWP guarantees that the Market Participant
receive enough revenues to cover certain costs (e.g., Startup cost, No-load cost, etc.) for
the Energy and Operating Reserve offers for a given Operating Day as long as the Resource
meets the required criteria. In Summary, the DA uses DA offer data to optimize the
operating plan for the next Operating Day. The Market Participant is required to offer
enough capacity to cover the load. The DA Market clearing involves matching Resource
Offers to the Load Bids. The Market Participant is required to submit offers for all
Resources that are not on an outage. The RUC uses the load forecasts projected by SPP to
optimize the committed resources.
Chapter 2 – SPP Market
2016 South Dakota Electricity Supply Resource Procurement Plan Page 2-5
Real Time Balancing Market
In the RTBM, SPP optimizes the real-time load and generation committed by the DA and
RUC processes. The purpose of the RTBM is to minimize the total production costs by
evaluating online Resources’ Real-Time Offers and statuses and the short-term load
forecasts and their Operating Reserve requirements. The execution of the RTBM takes
place on 5-minute intervals. Resources committed in the RTBM receive dispatch
instructions for Energy and Operating Reserve every 5 minutes with the designated
amount. SPP issues setpoint instructions on 4-second intervals indicating the required
Energy and Operating Reserve deployment for each committed Resource. If there is a
Reliability event taking place during the given Operating Day, SPP may issue a manual
directive in addition to the setpoint instructions to alleviate the emergency condition. The
dispatched amounts cleared in the RTBM are settled on RTBM LMPs, which are calculated
and posted for each 5-minute interval.
Auction Revenue Rights (ARR) and Transmission Congestion Rights (TCR)
The SPP Integrated Marketplace offers Market Participants the opportunity to participate
in the ARR and TCR processes. These tools can be used to hedge against congestion risk
between, for example, the generation LMP and the load LMP. Market Participants are
allocated ARRs based on firm transmission reservations. The ARRs can be self-converted
to TCRs or sold in the ARR Auction. TCR holders are paid (or charged) the difference
between the DA LMPs at the source and sink on the TCR path.
NorthWestern Participation in the SPP Integrated Marketplace
As indicated earlier, there are five different products that a Market Participant can offer in
the SPP Integrated Marketplace. NorthWestern owns facilities located in the SPP Footprint
that are used to supply Energy into the Market. In order for a Market Participant to do
business with SPP, it must register its Assets (including load and generation), with the
Chapter 2 – SPP Market
2016 South Dakota Electricity Supply Resource Procurement Plan Page 2-6
exception of Behind the Meter generation that is less than 10 MW. NorthWestern
participates in the DA Market, the RTBM, and in the ARR/TCR processes.
Capacity Requirement
As a load-serving member of SPP, NorthWestern is obligated to meet the capacity
requirements outlined in Attachment AA of the SPP Open Access Transmission Tariff
(“OATT”). PRM is defined as the difference between an entity’s firm capacity and its net
peak demand, divided by its net peak demand. SPP requires that each load responsible
entity have a minimum PRM of 12%. Note that NorthWestern’s smaller, Behind-the-Meter
generation resources (Faulkton, Clark, and the mobile units) may be counted toward the
Required Capacity Margin calculation. See Chapters 3 and 5 for information on
NorthWestern’s compliance with this requirement.
SPP Transmission Planning Process
SPP’s Integrated Transmission Planning (ITP) process is a three-year process that focuses
on obtaining a reasonable balance between long-term transmission investments and
congestion costs to customers. The three-year planning cycle includes a 20-year assessment
(ITP20), a 10-year assessment (ITP10), and annual Near-Term assessments (ITPNT) of the
region. ITP20 identifies potential projects that are generally 300kV and above, while ITP10
focuses on facilities that are 100kV and above. ITPNT looks out over the next 5-7 years
and includes at all applicable voltage levels. For each of these ITP assessments, SPP runs
multiple scenarios through their model to identify potential needs. Along with economic
and reliability studies, SPP also considers different carbon reduction scenarios within the
planning process. See Attachment O within the SPP OATT for additional details on SPP’s
planning process.

Chapter 2 – SPP Market
2016 South Dakota Electricity Supply Resource Procurement Plan Page 2-7
Opportunities for NorthWestern within SPP’s ITP Process
SPP’s ITP process is an open process that allows proposed transmission facilities to come
from several different areas of the Tariff. These areas are: transmission service requests,
generation interconnection service requests, ITP upgrades, the balanced portfolio process,
the high priority study process, requests for sponsored upgrades, and interregional projects.
Each of these potential upgrades has its own evaluation and approval process, along with
its own method of cost allocation on how the project will be funded
Upgrades that are studied and approved in the SPP planning process qualify for regional
and zonal cost allocation. Upgrades that do not achieve SPP approval also do not qualify
for cost allocation. If the requestor still chooses to construct the upgrade without SPP
approval, the cost of the project is directly assigned to the requestor. SPP refers to these
projects as a Sponsored Upgrades. Directly assigning costs to the requestor is also common
in transmission service and generation interconnection requests, if upgrades are needed to
grant the request for service or interconnection. See Attachment J in the SPP OATT for
more information on cost allocation.
All projects within the SPP have the potential to impact NorthWestern from reliability and
economic standpoints. Projects that are approved to address system needs also present
possible construction opportunities for interested stakeholders. For these reasons
NorthWestern actively monitors and participates in SPP working group meetings, to
understand system needs and the solutions being proposed. Attachment Y in the SPP
OATT outlines the criteria that qualifies certain upgrades to be Competitive Upgrades,
where qualified applicants have the opportunity to submit project proposals to construct,
own, and maintain the Competitive Upgrade. Proposals submitted for Competitive
Upgrades enter into SPP’s Transmission Owner Selection Process (TOSP). The proposals
that meet all TOSP criteria are then evaluated by an Industry Expert Panel (IEP) which
Chapter 2 – SPP Market
2016 South Dakota Electricity Supply Resource Procurement Plan Page 2-8
makes a recommendation of project selection to the SPP Board of Directors. Upgrades that
do not meet the criteria of a Competitive Upgrade default to the incumbent transmission
owner for construction and ownership.

Chapter 3 – Existing Portfolio Resources
2016 South Dakota Electricity Supply Resource Procurement Plan Page 3-1
CHAPTER 3 EXISTING PORTFOLIO RESOURCES
Existing Portfolio Resources Discussion
NorthWestern uses a mixture of resources to meet the existing energy and capacity needs
of its South Dakota customers and requirements of SPP. As described in this section, the
South Dakota portfolio includes base load coal generation, natural gas and diesel peaking
generation, owned wind generation, wind Power Purchase Agreements (“PPAs”), capacity
and energy purchase agreements, and DSM programs. NorthWestern’s portfolio of
resources are distributed throughout and surrounding its South Dakota service territory, as
shown in Figure 3-1.
Figure 3-1 Map of NorthWestern’s Electric Generation Resources
Chapter 3 – Existing Portfolio Resources
2016 South Dakota Electricity Supply Resource Procurement Plan Page 3-2
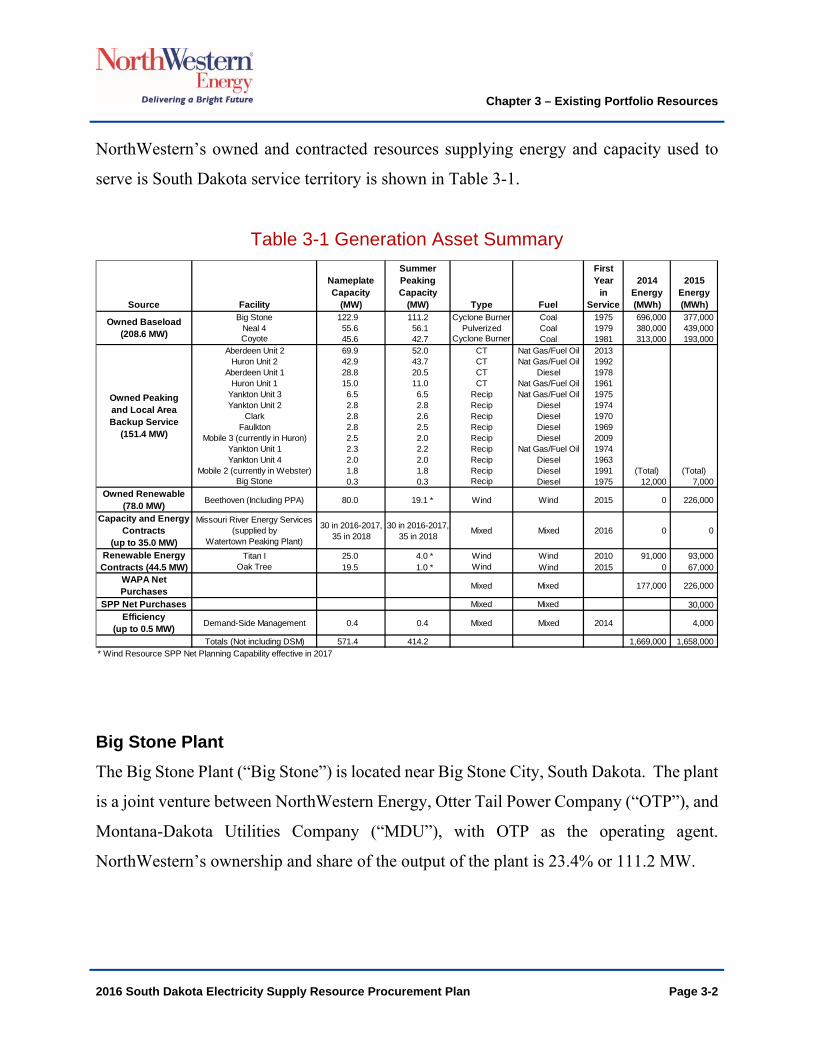
NorthWestern’s owned and contracted resources supplying energy and capacity used to
serve is South Dakota service territory is shown in Table 3-1.
Table 3-1 Generation Asset Summary
Big Stone Plant
The Big Stone Plant (“Big Stone”) is located near Big Stone City, South Dakota. The plant
is a joint venture between NorthWestern Energy, Otter Tail Power Company (“OTP”), and
Montana-Dakota Utilities Company (“MDU”), with OTP as the operating agent.
NorthWestern’s ownership and share of the output of the plant is 23.4% or 111.2 MW.
Source Facility
Nameplate Capacity
(MW)
Summer Peaking Capacity
(MW) Type Fuel
First Year
in Service
2014 Energy (MWh)
2015 Energy (MWh)
Big Stone 122.9 111.2 Cyclone Burner Coal 1975 696,000 377,000Neal 4 55.6 56.1 Pulverized Coal 1979 380,000 439,000Coyote 45.6 42.7 Cyclone Burner Coal 1981 313,000 193,000
Aberdeen Unit 2 69.9 52.0 CT Nat Gas/Fuel Oil 2013Huron Unit 2 42.9 43.7 CT Nat Gas/Fuel Oil 1992
Aberdeen Unit 1 28.8 20.5 CT Diesel 1978Huron Unit 1 15.0 11.0 CT Nat Gas/Fuel Oil 1961
Yankton Unit 3 6.5 6.5 Recip Nat Gas/Fuel Oil 1975Yankton Unit 2 2.8 2.8 Recip Diesel 1974
Clark 2.8 2.6 Recip Diesel 1970Faulkton 2.8 2.5 Recip Diesel 1969
Mobile 3 (currently in Huron) 2.5 2.0 Recip Diesel 2009Yankton Unit 1 2.3 2.2 Recip Nat Gas/Fuel Oil 1974Yankton Unit 4 2.0 2.0 Recip Diesel 1963
Mobile 2 (currently in Webster) 1.8 1.8 Recip Diesel 1991Big Stone 0.3 0.3 Recip Diesel 1975 12,000 7,000
Owned Renewable (78.0 MW)
Beethoven (Including PPA) 80.0 19.1 * Wind Wind 2015 0 226,000
Capacity and Energy Contracts
(up to 35.0 MW)
Missouri River Energy Services (supplied by
Watertown Peaking Plant)
30 in 2016-2017, 35 in 2018
30 in 2016-2017, 35 in 2018
Mixed Mixed 2016 0 0
Titan I 25.0 4.0 * Wind Wind 2010 91,000 93,000Oak Tree 19.5 1.0 * Wind Wind 2015 0 67,000
WAPA Net Purchases
Mixed Mixed 177,000 226,000
SPP Net Purchases Mixed Mixed 30,000Efficiency
(up to 0.5 MW)Demand-Side Management 0.4 0.4 Mixed Mixed 2014 4,000
Totals (Not including DSM) 571.4 414.2 1,669,000 1,658,000* Wind Resource SPP Net Planning Capability effective in 2017
(Total) (Total)
Owned Peaking and Local Area Backup Service
(151.4 MW)
Owned Baseload (208.6 MW)
Renewable Energy Contracts (44.5 MW)

Chapter 3 – Existing Portfolio Resources
2016 South Dakota Electricity Supply Resource Procurement Plan Page 3-3
Big Stone is a coal-fired, cyclone burner, non-scrubbed base load plant that was placed in
service in 1975. The unit is rated at 475 MW. The fuel source is Powder River Basin sub-
bituminous coal delivered by Burlington Northern Santa Fe Railway Company.
To meet new emission reduction requirements of the Regional Haze Rule, an Air Quality
Control System (“AQCS”) retrofit was installed at Big Stone and put into service in
December 2015. The project consists of the addition of a Flue Gas Desulfurization
(“FGD”) system (scrubber and baghouse), a Selective Catalytic Reduction (“SCR”)
system, Separated Over Fire Air (“SOFA”) system, and an Activated Carbon Injection
(“ACI”) system for the control of mercury emissions. NorthWestern’s share of the capital
cost was approximately $98 million with Allowance for Funds Used During Construction
(“AFUDC”).
Neal Energy Center Unit 4
Neal Energy Center Unit 4 (“Neal 4”) is a pulverized coal, non-scrubbed base load plant
located near Sioux City, Iowa. It is a joint venture among 14 power suppliers and was
placed in service in 1979. MidAmerican Energy Company is the principal owner and
operating agent for the plant. With a total plant rating of 646 MW in 2013, NorthWestern’s
ownership share is approximately 56.1 MW, or 8.68%. The fuel source for Neal 4 is
Powder River Basin sub-bituminous coal delivered by the Union Pacific Railroad.
Environmental compliance projects to control sulfur oxide, nitrogen oxide, and mercury
emissions from Neal 4 were completed in 2013 and 2014 at a cost of approximately $24
million for NorthWestern’s share.
Coyote Station
Coyote Station (“Coyote”) is located near Beulah, North Dakota and began commercial
operations in 1981. The owners of the plant are OTP (35%), Minnkota Power Cooperative
Chapter 3 – Existing Portfolio Resources
2016 South Dakota Electricity Supply Resource Procurement Plan Page 3-4
(30%), MDU (25%), and NorthWestern (10%). OTP is the managing partner. Coyote is a
coal-fired, cyclone burner, dry-scrubbed base load plant. The total plant rating is 427 MW
(transmission limited). NorthWestern’s ownership share of Coyote is 42.7 MW, or 10%.
The fuel source is North Dakota lignite from an adjacent coal mine that is owned by Dakota
Westmoreland.
An ACI system was installed in 2015 to bring Coyote into compliance with the final
Mercury and Air Toxics Standards (“MATS”) rule. An Advanced Overfire Air (“AOA”)
system for nitrous oxide control was installed in the spring of 2016. These retrofits were
part of a larger boiler project to replace the lower boiler wall and redesign the cyclone entry
to accommodate the AOA. Testing for other toxic emissions revealed that Coyote was well
within compliance. NorthWestern’s share of capital costs for this project was $2.2 million.
Based on current compliance test results, NorthWestern anticipates that Coyote will be able
to qualify as a Low Emitting Electrical Generating Unit (“LEE”).
Peaking Units
NorthWestern’s peaking units, shown in Table 3-2 below (sorted by age), consist of nine
reciprocating internal combustion engine (“Recip”) units and four simple cycle combustion
turbine (“CT”) units. With a combined summer peaking capacity of 149.8 MW1, these
facilities are situated in seven different locations across NorthWestern’s service territory.
The age of these units ranges from 65 years old to three years old with several older than
35 years. The higher heating value (“HHV”) heat rates are also given for each unit. The
most recent addition, Aberdeen Unit 2, benefits from significant improvements in
technology and is much more efficient than the others. This lower heat rate increases the
economic opportunities for this resource to be offered into the SPP market.
1 All capacity values listed in the Peaking Units section refer to summer peaking capacities.

Chapter 3 – Existing Portfolio Resources
2016 South Dakota Electricity Supply Resource Procurement Plan Page 3-5
Table 3-2 Thermal Peaking Units
The smaller Recip units use diesel or are dual-fueled with natural gas and fuel oil and
combine to provide a total capacity of 22.5 MW. SPP is currently evaluating its process
for determining qualifications of thermal plants with nameplate capacity under 10 MW that
are not entered into the SPP market to be registered as capacity-contributing resources.
The smallest three Recips, Big Stone, Mobile 2, and Mobile 3, have not been entered into
the SPP Market by NorthWestern and therefore their summer peaking capacity, totaling
4.1 MW, may not qualify under SPP capacity requirements. The four larger CT units are
Aberdeen 1 & 2 and Huron 1& 2. Aberdeen 1 is a 20.5 MW diesel-fueled CT in operation
since 1978. Aberdeen 2 is 52.0 MW dual-fueled (natural gas/fuel oil) CT in operation since
2013. Huron 1 is 11.0 MW dual-fueled CT in operation since 1961. Huron 2 is a 43.7
MW dual-fueled CT in operation since 1992.
Facility
SPP Qualified Summer Peaking
Capacity (MW) Type Fuel
HHV Heat Rate at Maximum
Capacity (BTU/kWh)
First Year
in Service
Huron Unit 1 11.030 CT Nat Gas/Fuel Oil 17,000 1961
Yankton Unit 4 2.000 Recip Diesel 15,000 1963
Faulkton 2.500 Recip Diesel 15,000 1969
Clark 2.600 Recip Diesel 15,000 1970
Yankton Unit 2 2.750 Recip Diesel 15,000 1974
Yankton Unit 1 2.170 Recip Nat Gas/Fuel Oil 15,000 1974
Yankton Unit 3 6.500 Recip Nat Gas/Fuel Oil 15,000 1975
Big Stone 0.269 Recip Diesel 15,000 1975
Aberdeen Unit 1 20.520 CT Diesel 13,500 1978
Mobile 2 (currently in Webster) 1.750 Recip Diesel 15,000 1991
Huron Unit 2 43.700 CT Nat Gas/Fuel Oil 14,000 1992
Mobile 3 (currently in Huron) 2.000 Recip Diesel 15,000 2009
Aberdeen Unit 2 52.000 CT Nat Gas/Fuel Oil 9,419 2013
Chapter 3 – Existing Portfolio Resources
2016 South Dakota Electricity Supply Resource Procurement Plan Page 3-6
Demand Side Management
NorthWestern received final approval from the PUC to begin implementation of a two year
pilot DSM Plan in June 2014. The approved DSM Plan included a tracker mechanism in
which electric DSM program costs and an Electric Lost Margin adder of 30% be recovered.
An electric Energy Efficiency Program rate was developed to track and recover the electric
DSM program costs and Electric Lost Margin adder. The Programs, offered under the
Efficiency Plus (“E+”) sub-brand, were officially rolled out to customers on October 1,
2014. NorthWestern contracted with DNV▪GL (“DNV”) to implement the South Dakota
E+ Programs and perform the residential in-home energy audits.
The Year 1 E+ program offerings were focused solutions targeting existing residential and
commercial customers. The electric E+ program offerings included:
E+ Audit for the Home – Free onsite energy audit for residential electric space and/or water heat customers.
E+ Residential Lighting – Rebates available to residential customers for ENERGY STAR® hard-wired compact fluorescent lamp (“CFL”) fixtures in existing or new construction homes. A one-time in-store CFL coupon was also offered through participating retailers.
E+ Commercial Lighting – Prescriptive and custom rebates offered in existing and new construction for the replacement of less efficient lighting products with high efficiency technologies.
E+ Commercial Existing Construction Electric Rebate Program – Rebates available for qualifying measures including insulation, programmable thermostats, variable frequency drives, and refrigeration and ENERGY STAR measures.
E+ Residential Existing Construction Electric Rebate Program – Rebates available for qualifying measures including insulation, programmable thermostats, and air conditioning measures.
Through customer participation in Year 1, E+ programs resulted in electric savings of about
1.34 million kilowatt hours (“kWh”) or 0.15 average megawatts (“aMW”). These savings
were primarily driven through commercial lighting rebates.

Chapter 3 – Existing Portfolio Resources
2016 South Dakota Electricity Supply Resource Procurement Plan Page 3-7
During Year 1, partnerships with retailers and relationships with area trade allies were
developed. In early March, trade allies (i.e. distributors, electrical contractors, engineers,
architects, heating, ventilation, and cooling (“HVAC”) contractors, insulation contractors,
building contractors) were invited to attend any of four E+ program workshops in Aberdeen
and Mitchell. The workshops provided information about the E+ program offerings so that
trade allies may successfully market the programs to their customers.
Year 2 program offerings were expanded from the list above to include:
E+ Residential Lighting – Expanded to not only include ENERGY STAR hard-wired CFL fixtures in existing or new construction homes, but also included an occupancy sensor rebate.
E+ Commercial New Construction Electric Rebate Program – Rebates available to electric customers for qualifying refrigeration, air conditioning, and ENERGY STAR measures that exceed code.
E+ Residential New Construction Electric Rebate Program – Rebates available to electric customers for qualifying insulation, programmable thermostat, weatherizing, and ENERGY STAR measures that exceed code.
E+ Business Partners Program – Customized incentives available to commercial and industrial customers for electric conservation in both new and existing facilities. Examples of custom projects include improvements to HVAC systems, refrigeration, air handling, and pumping systems.
Additional recruitment of trade allies continued through Year 2, as did interactions with
individual commercial customers to identify and develop commercial rebate projects.
South Dakota rebate programs for Year 2 were granted extension from the PUC through
December 31, 2016. Between July 1, 2016 and September 30, 2016, E+ programs have
saved 2.94 million kWh or 0.34 aMW with a majority of savings coming from commercial
customers installing variable frequency drives in existing facilities.

Chapter 3 – Existing Portfolio Resources
2016 South Dakota Electricity Supply Resource Procurement Plan Page 3-8
Wind Units
Beethoven
In May 2015, BayWa r.e. Wind LLC completed the construction of the 80 MW Beethoven
wind project near Tripp, South Dakota, and NorthWestern began receiving generation
under a PPA. In September 2015, NorthWestern completed the purchase of Beethoven.
Beethoven consists of 43 GE-1.85/87 turbines, each capable of generating 1.85 MW, and
an adjacent expansion site capable of supporting an additional 50 MW of wind generation.
The SPP qualified peaking capacity of this facility for 2016 is 19.1 MW.
Titan I
Rolling Thunder I Power Partners, LLC entered into a PPA with NorthWestern for the
generation of its 25-MW Titan I (“Titan”) wind project that began commercial operation
in January 2010. The SPP-qualified peaking capacity of this facility for 2016 is 4.0 MW.
The Titan PPA extends through 2028.
Oak Tree
Oak Tree Energy, LLC (“Oak Tree”) entered into a PPA for the generation of its 19.5-MW
wind project. Commercial operations began in January 2015. The SPP-qualified peaking
capacity of this facility for 2016 is 0.975 MW.
Capacity Evaluation of Wind
Under the current SPP Planning Criteria2 (“Criteria”), the capacity contribution of a
renewable resource towards the SPP capacity requirement is determined by a Net Planning
2 SPP currently defines net planning capability of renewable resources and the recommended calculation methodology
in the SPP Planning Criteria, Version 1.0, released in November 20, 2015.

Chapter 3 – Existing Portfolio Resources
2016 South Dakota Electricity Supply Resource Procurement Plan Page 3-9
Capability (“NPC”) calculation as discussed in more detail later in this chapter. The results
of these NPC calculations for existing wind projects are reflected in Table 3-1 above.
For Titan, all six full calendar years of actual generation data were used (2010 – 2015).
Oak Tree had only one full calendar year of actual generation data available (2015). Since
this doesn’t meet the Criteria requirements of using the three most recent calendar years,
2013 - 2015, the SPP default wind NPC value of 5% was assigned.
For Beethoven, generation data for 2013 – 2015 were not immediately available since
Beethoven had only been in operation since March 2015. The Criteria allows for the use
of calculated generation data correlated with a reference tower within 50 miles if measured
data is not available for facilities in operation 3 years or less. Based on this rule, wind data
supplied as part of a DNV due diligence assessment completed prior to NorthWestern’s
acquisition of Beethoven was used to complete the period for January, 2013 – March 2015.
Hourly simulated generation values were calculated from this wind speed data using the
National Renewable Energy Laboratory (“NREL”) System Advisor Model tool. The SPP
2016 NPC calculation was performed using both actual and simulated generation values
for Beethoven.
The Criteria establish that NPC calculations shall be updated at least once every three years.
In addition, the NPC for Oak Tree will be calculated when the facility has accumulated
three years of generation data, in early 2018.
The significance of changing to the SPP methodology is that the accredited capacity
contribution of the wind fleet, previously valued at 0 MW, will become 24.1 MW in 2017.
The resulting increase of approximately 24 MW of available capacity reduces
NorthWestern’s expected need of up to 65 MW down to 41 MW.

Chapter 3 – Existing Portfolio Resources
2016 South Dakota Electricity Supply Resource Procurement Plan Page 3-10
Capacity and Energy Agreements
NorthWestern entered into a capacity agreement with MRES in 2014. The capacity
agreement provides 30 MW from summer 2016 through 2017, and 35 MW in 2018. The
power is provided by the Watertown Peaking Plant. The capacity price is a fixed contract
rate, while any energy produced is priced at the incremental cost of this unit. This MRES
contract addressed capacity needs previously secured under a contract with Basin for up to
19 MW through 2015.
Energy Resource Mix
Generation from the facilities described above is delivered to the SPP market to help meet
NorthWestern’s capacity and energy needs. In 2015, the energy resource mix, shown in
Figure 3-2, provided approximately 1,658,000 MWh of net generation in the following
percentages: 60.9% base load coal, 23.3% owned and contracted wind, 15.4% net market
purchases from Western Area Power Administration (“WAPA”) and SPP, and 0.4%
peaking natural gas and diesel.
(Remaining page blank for figure.)

Chapter 3 – Existing Portfolio Resources
2016 South Dakota Electricity Supply Resource Procurement Plan Page 3-11
Figure 3-2 2015 NorthWestern SD Energy Supply Mix
As an SPP member, all of NorthWestern’s generation to meet load is sold to SPP and all
the energy required to meet load is purchased from SPP. The 2015 SPP generation mix is
shown in Figure 3-3 below.
Figure 3-3 2015 SPP Generation Mix
Baseload Coal
60.9%
Peaking Gas and Diesel0.4%
Wind (Owned &
Contracted)23.3%
Net Market Purchases
15.4%
2015 Energy Resource Mix1,658,000 MWh
Coal, 55.1%
Natural Gas, 21.6%
Wind, 13.5%
Nuclear, 8.1%
Hydro, 1.5%
Other, 0.1%
SPP - 2015 Generation Mix236,715 GWh total

Chapter 3 – Existing Portfolio Resources
2016 South Dakota Electricity Supply Resource Procurement Plan Page 3-12
Coal-fired plants generated 55% of the total in 2015, while natural gas plants generated
around 22%, wind about 13.5%, and nuclear about 8.1%. DSM and other resources (fuel
oil, solar and biomass) make up only a small portion of the total.
Figure 3-4 below shows the historical relationship of NorthWestern’s system load to
energy production and energy purchases. The transition to SPP has not had a significant
impact on this relationship. Recent increases in net market purchases are a response to low
market prices, as thermal units continue to be dispatched economically. Wind generation
has increased significantly due to Oak Tree and Beethoven entering the portfolio in 2015,
which has also offset some thermal generation. Low natural gas prices and the availability
of energy in the wholesale market has enabled NorthWestern to make economy purchases
rather than generating with some of its higher cost units.
(Remaining page blank for figure.)

Chapter 3 – Existing Portfolio Resources
2016 South Dakota Electricity Supply Resource Procurement Plan Page 3-13
Figure 3-4 Resource Allocation History – System Load vs. Energy Production & Net Market Purchases
As depicted in Figure 3-5 below, NorthWestern made economy energy purchases in 69%
of the hours during 2015. After adjusting for unusually extended base load unit outages
during the year, the outage-adjusted level would have been about 40% or approximately
3,500 hours per year where NorthWestern would be purchasing from the market to meet
the load. That level reflects the slow increase in the market purchases (in the range of 20-
30% over the last ten years (outage-adjusted)). NorthWestern made economy energy
purchases in 65% of the hours during 2014.
-200
0
200
400
600
800
1,000
1,200
1,400
1,600
1,800
2007 2008 2009 2010 2011 2012 2013 2014 2015 12-moending
Sep 2016
MW
h i
n T
ho
usa
nd
s
Resource Allocation History System Load vs. Energy Production
& Net Market Purchases (MWh)
Baseload (Coal) Peaking (NG/Diesel) Wind (PPA & Owned) Net Market Purchases System Load
NorthWestern Joines SPP
October 2015

Chapter 3 – Existing Portfolio Resources
2016 South Dakota Electricity Supply Resource Procurement Plan Page 3-14
Figure 3-5 2015 Load Duration Curve
In recent years, customers have benefited from lower energy prices even as NorthWestern’s
market purchases have increased.
(Remaining page blank for figure.)
0
50
100
150
200
250
300
350
0% 10% 20% 30% 40% 50% 60% 70% 80% 90% 100%
LO
AD
-M
W
PERCENT OF TIME
2015 LOAD DURATION MIN 107 MW, MAX 306 MWMW, 60.2% LOAD FACTOR
2015 NW SYSTEM LOAD DURATION 2015 WIND + BASELOAD AVERAGE OUTPUT
2014 NW SYSTEM LOAD DURATION 2014 WIND + BASELOAD AVERAGE OUTPUT
ENERGY IN THIS ZONE SOLD TO THE WHOLESALE MARKET
2015 THEORETICAL SUPPLY CROSSOVER @ 69%
2014 THEORETICAL SUPPLY CROSSOVER @ 65%
ENERGY IN THIS ZONE FROM PEAKING UNITS OR PURCHASED
Even with the addition of 80 MW Beethoven in 2015, the extended Big Stone outage and emissions control retrofits completed on Coyote contributed to lower Wind + Baseload output in 2015.

Chapter 3 – Existing Portfolio Resources
2016 South Dakota Electricity Supply Resource Procurement Plan Page 3-15
Figure 3-6 2005 – 2015 Annual Purchased Power Costs
Capacity Resource Mix
NorthWestern is subject to capacity requirements set by SPP. SPP members are required
to maintain adequate generation to meet their peak load, plus a PRM of 12.0%. SPP
provides guidelines for its recommended methodology of evaluating the available peak
capacity or NPC of wind and solar resources. In the Criteria, the recommended method is
a specific monthly NPC calculation for all operating years of a facility (up to 10 years),
utilizing the top 3% of peak load hours for each month, and the generation value met or
exceeded 60% of these hours. Under this method, the existing fleet of wind resources are
capable of providing 24.1 MW of NPC capacity. Figure 3-7 below shows that
0
50
100
150
200
250
300
350
$0
$2
$4
$6
$8
$10
$12
$14
$16
$18
$20
2005 2006 2007 2008 2009 2010 2011 2012 2013 2014 2015
MW
h P
urc
has
es
(Th
ou
san
ds
)
Po
we
r C
os
ts (
Mill
ion
s)
Annual Purchased Power Costs(Excludes Demand Cost)
Purchased Power ($) Market MWh Purchases
On October 1, 2015, NWE joined SPP.
Prior to 2015, all Market Purchases came from WAPA.

Chapter 3 – Existing Portfolio Resources
2016 South Dakota Electricity Supply Resource Procurement Plan Page 3-16
NorthWestern meets its SPP capacity requirement primarily with owned coal and natural
gas peaking plants.
Figure 3-7 Summer Peaking Capacity Resource Mix, 2014 & 2016
SPP rules require that units larger than 10 MW be registered in the Integrated Marketplace.
Smaller units located behind the meter may be dispatched when needed and can be counted
toward the Member’s capacity requirements. Figure 3-8, below, shows the historical
capacity portfolio and annual reserve requirement.
(Remaining page blank for figure.)
Coal, 56.0%
Natural Gas,
30.8%
Diesel, 9.2%
Contract Purchases,
4.0%
2014 Summer Peaking Capacity (MW)(Total - 375 MW)
Coal, 53.9%
Natural Gas,
29.6%
Diesel, 8.8%
Contract Purchases,
7.7%
2016 Summer Peaking Capacity (MW)(Total - 390 MW)

Chapter 3 – Existing Portfolio Resources
2016 South Dakota Electricity Supply Resource Procurement Plan Page 3-17
Figure 3-8 2012 – 2016 Capacity Portfolio vs. Annual Reserve Requirement
Although the annual reserve requirement amount dipped in 2014 and 2015 due to a lower
peak demand in both years, NorthWestern’s reserve requirement percentage remained at
7.1% until 2016, when it became 13.6% under SPP.
Retirement Study
Table 3-1 shows NorthWestern’s existing resources and the year they entered service. A
number of NorthWestern’s generation units in that list were placed into service in the 1960s
and 1970s and may have exceeded their useful life. NorthWestern’s Thermal & Wind
Generation Department is working with HDR to develop a Retire and Replacement Study
for the natural gas-fired and oil-fired generating units. The study will examine efficiency,
reliability, parts availability, book value, and provide a cost benefit analysis for
200
250
300
350
400
450
500
2012 2013 2014 2015 2016
MW
Year
Capacity Portfolio vs.Annual Reserve Requirement
Owned Coal, NG, Diesel Capacity Purchases Annual Reserve Requirement

Chapter 3 – Existing Portfolio Resources
2016 South Dakota Electricity Supply Resource Procurement Plan Page 3-18
replacement of those assets with proxy technology selections. The economic contributions
of each asset to the overall resource portfolio will also be evaluated. NorthWestern expects
that the study will be completed in July 2017 and the results will be used to inform resource
development in South Dakota.

Chapter 4 – New Resources
2016 South Dakota Electricity Supply Resource Procurement Plan Page 4-1
CHAPTER 4 NEW RESOURCES
New Resources Overview
The 2016 Plan addresses capacity, wind, solar PV, DSM, and energy storage resources as
possible additions to the portfolio. The planning process involved analysis and
contributions from outside consultants Ascend, HDR, DNV GL, and other sources.
NorthWestern issued an RFP for capacity resources in early 2016. In parallel with the RFP
effort, HDR worked with the NorthWestern Generation Department to provide a siting and
technology study. This technology study identifies favorable sites to build a generation
asset and the technology best suited for the operating profile and site.
Thermal Resources
Technology Study
NorthWestern selected HDR, in a selection process that included 12 energy engineering
consulting firms, to provide both a Technology Assessment and a Siting Study to be used
in evaluating proposals submitted in response to an RFP for capacity. The Technology
Assessment, evaluated six different simple cycle configurations of CT and Recip
technology from various manufacturers capable of meeting the specified requirements and
other objectives. These six proxy units, shown in Table 4-1, were chosen as a
representative sampling of currently available technology types.
(Remaining page blank for table.)

Chapter 4 – New Resources
2016 South Dakota Electricity Supply Resource Procurement Plan Page 4-2
Table 4-1 Technology Assessment Configurations
NorthWestern and HDR met with the manufacturers of these units to learn more about
technical performance criteria, costs, available engineering, procurement, and construction
(“EPC”), and maintenance options. NorthWestern modeled each of these configurations
independently as an addition to the existing South Dakota supply portfolio/SPP system
using PowerSimm to determine their respective 45-year levelized cost of generation. The
potential benefits derived from their ability to serve the SPP ancillary services market and
increase reliability due to having multiple shafts were not included in this analysis. Results
of this study suggest that Recip technology would offer the most favorable economics to
NorthWestern and its customers over a 45-year project life based primarily on efficiencies,
fuel costs, and frequency of economic dispatch to the SPP market.
Defining New Gas-Fired Resources
NorthWestern modeled two specific natural gas-fired units from the technology study as
additions to the portfolio: Wartsila 18V50SG Recip (18 MW), and PW Power Systems
FT8 SWIFTPAC 60 aero-derivative CT (60 MW). The costs and operating characteristics
for these units are shown in Table 4.2 below.
Number of Units Manufacturer Model Type
Total Gross Output (MW)
1 GE LMS100PB Aeroderivative CT 102.94 Wartsila 18V50SG Recip 75.08 GE Jenbacher J920 Recip 68.62 GE LM6000PF Aeroderivative CT 86.41 PW Power Systems FT8 Swiftpac 60 Aeroderivative CT 60.42 Siemens SGT-800-47 Frame / Industrial CT 90.9

Chapter 4 – New Resources
2016 South Dakota Electricity Supply Resource Procurement Plan Page 4-3
Table 4-2 Resource Definition and Cost Summary
Resource Siting
In 2016, HDR performed a siting study which evaluated seven existing NorthWestern sites
and two new greenfield siting areas. Each site was ranked on a technical basis considering
several weighted factors including fuel supply, electric transmission, air quality, and ability
to enhance system reliability. In addition, sites were also ranked economically based on
their projected first year cost of generation (“COG”). These locations and their respective
technical and first year COG rankings are shown in Table 4-3. The results suggest that
NorthWestern’s existing Aberdeen location is the most favorable site to support a nominal
60-MW generation addition to the NorthWestern system.
Resource Description
Manufacturer and Unit
Net Capacity
(MW)
HHV Heat Rate (Btu/kWh)
Min Stable Load (MW)
Min Stable
Load Eff. (Btu/kWh)
Start-Up Time (min)
Capital Cost
($/kW)Fixed O&M ($/kW-yr)
Variable O&M
($/MWh) NOX SO2 CO2
Recip Wartsila 18V50SG 18.56 8,215 3.5 11,462 1 1,436$ $9.13 $7.71 0.19 0.0014 118
Aero-derivative
CT
PW Power Systems FT8 SWIFTPAC 60 59.50 9,266 28.3 12,012 2 1,400$ $13.03 $6.16 0.19 0.0014 118
Wind Generic Wind * 50 1,788$ $40.12
Wind Generic Wind * 100 1,788$ $40.12
Solar Generic Solar ** 50 1,999$ $36.00
Solar Generic Solar ** 100 1,929$ $36.00
** The Generic Solar resource is based on the DNV-GL indicative design and costs (Appendix C), and NREL SAM simulated production.
Emissions (Tons/MMBtu)Operating CharacteristicsTechnology Costs
* The Generic Wind resource is based on a weighted average production profile of three existing wind resources. Costs are based on Beethoven.

Chapter 4 – New Resources
2016 South Dakota Electricity Supply Resource Procurement Plan Page 4-4
Table 4-3 Siting Study Locations and Rankings
At the time of HDR’s siting study, NorthWestern learned that the natural gas infrastructure
would not be able to support any addition generation without upgrades at the Yankton site.
The study found that 1,000 to 2,000 dekatherms per day (“dkt/day”) of gas supply capacity
available at Mitchell, and an additional 2,000 dkt/day at Huron, would translate into
additions of nominal generation capacities of 9 MW at Mitchell (based on an average of
the range), and 11 MW at Huron, respectively. With the proximity of the Northern Border
Pipeline to the Aberdeen Generating Station, it was assumed that large quantities of natural
gas could be utilized in this area.
In September 2016, NorthWestern learned that additional gas supplies may become
available on Northern Natural Gas (“NNG”), the existing natural gas pipeline in Yankton,
Mitchell, and Huron. Having an available fuel supply increases the favorability of adding
generation at these three locations. The new information indicates an incremental 5,500
million cubic feet per day (“Mcf/day”) at Yankton. If NorthWestern secured that capacity
in Yankton, it could support up to 30 MW of additional generation. Electrical
interconnection and transmission system upgrades associated with this quantity of
generation would be minimal, consisting of just interconnection facilities.
Site Technical Rank First Year COG RankAberdeen 1 1
Huron 2 3Aberdeen South (greenfield) 4 2
Yankton 3 6Redfield (north of town at 115kV Substation) 6 5
Mitchell 5 7Clark 8 4
Raymond (greenfield) 7 9Webster 9 8

Chapter 4 – New Resources
2016 South Dakota Electricity Supply Resource Procurement Plan Page 4-5
At Mitchell, the new information indicates an incremental 4,000 Mcf/day, which could
potentially support additional generation up to 22.2 MW. At Huron, the incremental
opportunity is 13,000 Mcf/day. NorthWestern anticipates that amount of additional natural
gas supply at Huron could support up to 70 MW of new generation. No additional gas
capacity was identified in Aberdeen. However, with the proximity of the Northern Border
Pipeline to the Aberdeen Generating Station, it is assumed that large quantities of natural
gas could be utilized in this area. Upon further investigation of the Air Quality permit for
the Aberdeen Generation Station, it was discovered that emissions from Aberdeen’s Unit
1 could reduce the starts and operating hours of a new unit(s).
RFP for Capacity
Due to expiring contracts, support of known and future load growth, and the need to
maintain a PRM of 12%, NorthWestern’s 2014 Plan identified the need for up to 65 MW
of additional capacity within the planning horizon. In February 2016, NorthWestern issued
an RFP for capacity products that also meet the requirements for accreditation and dispatch
as defined by the SPP OATT. The goal was to identify cost-effective technology to supply
at minimum a nominal 60 MW of capacity by early 2019. The operating profile for the
self-build option was planned to provide real-time dispatch, ancillary services, and be
economically dispatched within the SPP market.
NorthWestern received bids from seven companies in response to the RFP. NorthWestern
is still evaluating the need for additional resources and is in discussions with the most
economical resource identified in the RFP. As discussed in Chapter 3 of the 2016 Plan,
changes in SPP methodology are anticipated to increase the accredited capacity
contribution of the wind fleet, previously valued at 0 MW, to 24.1 MW for 2017.
Chapter 4 – New Resources
2016 South Dakota Electricity Supply Resource Procurement Plan Page 4-6
SPP Screening Studies for Long Term Service Requests (“LTSR”)
NorthWestern issued LTSR to SPP for transmission from the proposed locations from
several of the RFP bids. In addition, NorthWestern requested that SPP perform screening
studies to determine the impacts on the SPP system and provide an approximation of
transmission remediation costs resulting from the addition of 55 MW of generation at these
sites. The screening studies modeled transmission service from each site to
NorthWestern’s load. The result of all three studies indicated that limiting constraints exist
within the SPP regional transmission system for the requested transfer of capacity. Two
of the sites would require transmission upgrades that had completion date estimates as early
as the end of 2019, well beyond NorthWestern’s capacity addition planning goal of COD
in early 2019. One proposal would not require transmission upgrades.
Grid Reliability
NorthWestern’s delivery system is comprised of 3,550 miles of transmission and
distribution assets, along with 124 substations. This system has interconnections with
transmission facilities of OTP, MDU, Xcel Energy Inc., and WAPA. It also has emergency
interconnections with the transmission facilities of East River Electric Cooperative Inc.
(“EREC”) and West Central Electric Cooperative. Effective October 1, 2015,
NorthWestern is now a transmission-owning member of SPP for South Dakota
transmission operations.
Historically, NorthWestern Energy operated generating plants throughout its South Dakota
service territory, including Webster, Aberdeen, Faulkton, Redfield, Clark, Huron,
Woonsocket, Highmore, Chamberlain, and Yankton. These plants were originally built for
base load generation, operating 24/7 supplying power for the communities served. As the
transmission system has expanded, these same units have continued to provide peaking
power and energy as well as contingency and reliability to those same communities.

Chapter 4 – New Resources
2016 South Dakota Electricity Supply Resource Procurement Plan Page 4-7
However, a number of these units have exceeded their expected life, and some have been
retired.
From a distribution/transmission operations perspective, distributing generation assets
across the system, to meet the overall system capacity requirement, adds an additional level
of reliability. It also provides additional capability for integrating current and future
renewable generating resources, which can be widely distributed within NorthWestern’s
system. For example, if 25 MW of wind generation falls offline, it would be more efficient
to start up three smaller 9-MW units compared to a 50 MW plant. Installing smaller units,
distributed throughout NorthWestern’s service territory has the potential to provide
scalability and flexibility in meeting the system needs, while also providing additional
system reliability. Table 4-4 compares current generating capability of existing generation
assets to 2015 peak loads.
Table 4-4 Locational Generation and Loads
The table shows that generation in Huron exceeded peak demand, while Aberdeen
generation nearly matches peak demand. In comparison, Mitchell had a peak demand of
about 54 MW and currently has no generation capability. Yankton’s existing generation
can only support about 25% of the peak demand. The other communities listed in the table

Chapter 4 – New Resources
2016 South Dakota Electricity Supply Resource Procurement Plan Page 4-8
either represent larger population centers that previously had generation or remote
locations with limited/partial contingency back-up capability. For example, Webster has a
radial 69-kilovolt (“kV”) feed with an emergency tie to EREC. Clark is on a radial 69-kV
line, with an emergency tie to WAPA via Watertown Municipal. Chamberlain and
Highmore both have extended 69-kV line exposure (50 miles +/-) and are located at or near
the ends of our system although both have emergency ties to EREC.
During the 2005 ice storm, all of the distributed generating assets, as well as a host of
rented assets, were utilized for an extended period of time to provide service throughout
the event. In comparison, some of EREC’s customers were without power, in some cases
for 3 to 5 weeks, until miles of line could be rebuilt. With its customers being able to
receive continuous service, NorthWestern was able to focus all of its available resources
reconstructing downed transmission and distribution assets. Tornados, blizzards, and
equipment failures are among the many reasons that support locating new generation,
where possible, throughout NorthWestern’s service territory.
Demand Side Management
NorthWestern’s ended its electric E+ programs for South Dakota in October 2016, with the
exception of the Energy Audit for the Home, as the budget was met. For more information
on those programs, see the Existing Resources Chapter1. Using the knowledge gained from
the two year pilot DSM Plan and updated avoided costs and energy efficient measure
information, NorthWestern designed and filed a proposed 2017 DSM Plan on November
18, 2016.
1 For more information on those programs, see Chapter 3.

Chapter 4 – New Resources
2016 South Dakota Electricity Supply Resource Procurement Plan Page 4-9
Wind Resources
Wind is an intermittent generation resource, meaning that generation levels fluctuate
greatly in a short time period. It is not uncommon for actual generation to deviate
considerably from forecasted generation within the hour. NorthWestern used a weighted
average production profile from the three wind resources in the energy supply portfolio
when developing the generation expectations for the generic wind resources. The resource
characteristics and costs of the 50-MW and 100-MW wind resources modeled in
PowerSimm are shown in Table 4-2. NorthWestern used the capital and operating costs
from Beethoven when developing the costs for the generic wind resources.
Utility Scale Solar PV
Solar resources are intermittent in nature. The movement of clouds can change solar
production from maximum output to zero production in a matter of seconds. Solar
resources, however, do provide capacity during NorthWestern’s summer peak. To develop
a greater understanding of solar PV resources, NorthWestern contracted with DNV to
provide a solar resource design.
In 2015, DNV supplied NorthWestern with a generic scalable solar PV resource designed
to be suitable for Montana locations2. Other than specifying that the proxy resource be
sized somewhere around 3 MW, DNV was left to determine the appropriate size,
components, etc. DNV’s indicative design is a 3.02 MWDC (2.5 MWAC) solar PV project
using Canadian Solar polycrystalline silicone-based modules and SMA Sunny Central
inverters. The design uses single-axis tracking with conventional backtracking. DNV also
applied estimates for soiling losses (which includes snow cover), shading losses, and
2 NorthWestern believes that this generic Solar PV design would also be suitable for solar resources located in South
Dakota.

Chapter 4 – New Resources
2016 South Dakota Electricity Supply Resource Procurement Plan Page 4-10
energy losses associated with equipment failures, unplanned outages, planned downtime,
and solar PV degradation over time.
DNV provided NorthWestern with capital cost estimates for the indicative design. The
cost of solar facilities has continued to decline, so NorthWestern contracted with DNV to
update the capital costs contained in the original study. DNV provided NorthWestern with
an updated study, “Indicative Design, Energy, and Cost Estimation for 2.5 MWAC
Photovoltaic Project,” on October 1, 2016. To model larger solar PV resources, DNV also
advised NorthWestern that it would be reasonable to scale the indicative design up to 50
MW and 100 MW using the NREL Technical Report, “NREL/TP-6A20-647463.” Solar
PV production was modeled using the DNV supplied indicative design and typical
meteorological year weather data (“TMY3”) for Huron, South Dakota using the NREL
SAM. The modeled cost of utility scale solar PV is shown in Table 4-2.
Qualifying Facilities
Juhl Energy, Inc. (“Juhl”) proposed three wind projects (Brule, Aurora, and Davison) that
could potentially qualify under the Public Utilities Regulatory Policy Act of 1978 for
Qualifying Facility (“QF”) contracts. Each of the proposed facilities would have a net
nameplate capacity of about 20 MW, and an anticipated commercial operation date
between the end of 2017 and the end of 2018. Juhl filed a complaint with South Dakota
PUC on June 23, 2016 to seek resolution of a dispute with NorthWestern in determining
the avoided cost for these potential QF projects. SD PUC established a procedural
schedule, and an evidentiary hearing is currently set for April 11, 2017.
3 This report is available at: www.nrel.gov/publications.

Chapter 4 – New Resources
2016 South Dakota Electricity Supply Resource Procurement Plan Page 4-11
Energy Storage
Utility-scale battery storage, particularly lithium-ion technology, is still evolving but on
the edge of being a cost-effective alternative to fossil-fueled plants for some of the needed
services described above. Many demo projects under 3 MWh have been in existence, but
only a few 10+ MWh systems have been deployed in the U.S. Used for years in electric
vehicles and consumer products, lithium-ion technology developments and increased
manufacturing continue to drive costs down. Other technologies, such as flow and molten
salt batteries, have some beneficial properties but their consideration has been limited due
to higher relative costs and fewer utility-scale demonstration projects.
Pumped storage hydro (“PSH”) uses off-peak or renewable power to pump water upstream
to a storage reservoir, so that it is available to flow downstream through a turbine to
generate electricity when needed. This relatively mature technology has benefitted
recently from enhanced control capabilities. With the ability to quickly adjust speed and
switch from pumping to generation, new PSH technology can be used to provide ancillary
services including frequency regulation. These plants require appropriate geology and
reservoirs which limit site selection and can lead to permitting and environmental concerns.
Compressed Air Energy Storage (“CAES”) utilizes the release of compressed air to spin a
turbine/generator. CAES requires large geological features, such as a mined salt dome or
a previously used natural gas reservoir capable of storing the air. This limits potential site
locations.
Recent capital cost estimates for lithium -ion systems are around $3,330/kW. Projections
estimate a 6-12%/year decrease in costs over the next 5 years, with these rates slowing in
subsequent years. PSH had an average capital cost estimated at around $2,920/kW.
Proposed PSH projects in NorthWestern’s Montana and South Dakota service areas had

Chapter 4 – New Resources
2016 South Dakota Electricity Supply Resource Procurement Plan Page 4-12
rough estimated costs of approximately $2,250/kW4 and $1,800/kW5 (in $2016),
respectively. Table 4-5 lists various energy storage technologies and estimates of their
related costs.
Table 4-5 Storage Technologies and Cost
Energy storage has the potential to provide multiple grid services including transmission
upgrade deferral, integration of renewable energy, distribution system reliability, peaker
replacement, and frequency regulation. As a new member of SPP, NorthWestern will
continue to evaluate internal needs as they apply to the regional SPP balancing footprint.
The relative importance of each service that storage can provide will influence the choice
of location and technology. Understanding the multiple value streams and defining cost-
benefit analysis methodologies that aggregate these values will be key to justifying the
4 Gordon Butte Pumped Storage Hydro states that its 400-MW project will cost approximately $900M ($2016).
http://gordonbuttepumpedstorage.com/news/ 5 A feasibility study was conducted on the proposed Gregory County PHS, wind farm, and transmission line project
to connect the South Dakota wind energy with MISO. The projected capital costs were estimated to be $4 - $5 billion
in 2011 for the entire project. PSH costs were estimated at $2B for 1,200 MW. ($2012)
Storage Technology
Capital Cost
($/kW)
Fixed O&M
($/kW-yr)
Variable O&M
($/MWh)
Roundtrip Efficiency
(%)
Design Life
(Years)
Compressed Air Energy Storage $2,030 $18.90 $0.80 70% 25
Pumped Storage Hydro $2,920 $15.30 $0.10 80% 50
Li-ion Batteries $3,330 $22.50 $0.00 82% 20
Flow Batteries (Vanadium Redox) $4,570 $30.00 $43.00 74% 20
Sodium Sulfur (NaS) Molten Batteries $5,410 $26.90 $29.50 78% 20

Chapter 4 – New Resources
2016 South Dakota Electricity Supply Resource Procurement Plan Page 4-13
economics in the near term. These methodologies are not well-established in the industry
and thus determining an accurate levelized cost of storage poses new challenges.

Chapter 5 – Forecasts
2016 South Dakota Electricity Supply Resource Procurement Plan Page 5-1
CHAPTER 5 FORECASTS
Historic Growth of Energy
NorthWestern’s total system load has grown over the last 10 years at an average rate of
25,000 MWh per year. System energy requirements for the 12-month period ending July
31, 2016 were around 1.65 million MWh, as shown in Figure 5-1 below.
Figure 5-1 Historical Load – Retail Sales 2006 – July 2016
Historic Growth of Capacity Demand
NorthWestern has also experienced continued growth in capacity demand, or peak loads,
over the past 13 years as shown in Figure 5-2 below. During this period, summer peak
loads have grown about 2.6 MW per year. Although year-to-year weather-dependent peaks
0
200
400
600
800
1,000
1,200
1,400
1,600
1,800
2006 2007 2008 2009 2010 2011 2012 2013 2014 2015 2016
MW
h (
Th
ou
san
ds
)
Historical Load (includes Losses)2006 - July 2016
Load Linear (Load MWh)
Average Annual Growth = 25,000 MWh
12-months ending July 31, 2016

Chapter 5 – Forecasts
2016 South Dakota Electricity Supply Resource Procurement Plan Page 5-2
vary, the overall growth has been fairly consistent as illustrated in Figure 5-2 below. Figure
5-2 also shows the system average maximum temperature on the peak load day.
Figure 5-2 Historical Electric Demand (Capacity) 2003-2015
NorthWestern’s electric service territory is characterized by predominantly residential and
small commercial customers with a small number of light-industrial customers. This type
of retail customer class has a high demand for space heating and cooling relative to their
base load requirements. As a result, the system annual load profile has significant seasonal
variation, with maximum demands occurring during winter and summer extreme
temperature periods. Average annual load factors are typically in the 50% to 60% range.
0
20
40
60
80
100
120
0
50
100
150
200
250
300
350
2003 2004 2005 2006 2007 2008 2009 2010 2011 2012 2013 2014 2015
MW
NorthWestern EnergyHistorical Electric Demand
2003-2015
Demand System Average of Max Day Temp (°F) Linear (Demand)
Average Annual Growth = 2.6 MW/YR

Chapter 5 – Forecasts
2016 South Dakota Electricity Supply Resource Procurement Plan Page 5-3
During the last 10 years, the highest summer peak load occurred on August 1, 2011. This
system peak load of 341 MW occurred during a period of extreme high ambient
temperatures, with a system-averaged maximum daily temperature of 100.5 degrees
Fahrenheit. The normal average temperature for NorthWestern’s peak loads is typically
under 100 degrees. As the NorthWestern load continues to grow, the peak usage will also
continue to grow and be affected by sustained extreme warm temperatures. Winter peak
loads shown in Table 5-1 below remain below summer peak loads, but in recent years
winter peak loads have been growing faster than summer peak loads.
Table 5-1 Historical Yearly Winter Peak Load
Load Forecasting
NorthWestern has been able to meet much of the energy and capacity needs of its customers
over the last several years with owned resources. NorthWestern supplements the energy
demand with spot market purchases from SPP and capacity with short-term capacity
agreements. Continued growth in energy and capacity demand will require the expansion
of NorthWestern’s portfolio to meet customer needs.
Energy
The historical energy load annual growth remains relatively steady at approximately
25,000 MWh per year. Growth continues to be observed in new residential construction
with a steady interest from the commercial sector within NorthWestern’s service region.
Year Peak MW Day
2015 301 January 13, 2015
2014 286 January 6, 2014
2013 265 December 23, 2013
2012 274 January 19, 2012
2011 278 January 7, 2011
Annual Year Winter Peak Load

Chapter 5 – Forecasts
2016 South Dakota Electricity Supply Resource Procurement Plan Page 5-4
NorthWestern is also in the process of negotiating supply contracts for two new large
industrial loads that may come online in the next few years. One of these loads would be
near Redfield and is projected to have an annual consumption of 50-80 million kWh. This
project does not have a firm completion date but could start commercial operation in 2017.
The other, located in Aberdeen, is projecting an estimated annual energy use of 48.4 million
kWh with a commercial operation date in March 2019. Considering a continuation of the
historical growth rate with these new large industrial loads, the forecasted system energy
requirements for 2025 are expected to be near 2.1 million MWh as shown in Figure 5-3
below. However, unforeseen increases in industrial activity or energy conservation within
NorthWestern’s service territory could significantly affect the forecasted usage.
Figure 5-3 Historical and Forecast System Load
0
500
1,000
1,500
2,000
2,500
2006 2008 2010 2012 2014 2016 2018 2020 2022 2024
MW
h in
Th
ou
san
ds
Historical & Forecast Retail Load
Retail Load
Historical Forecast

Chapter 5 – Forecasts
2016 South Dakota Electricity Supply Resource Procurement Plan Page 5-5
In 2015, NorthWestern’s energy supply portfolio added 99.5 MW of intermittent wind
resources. This increase in wind shifts the resource mix that provides energy for
NorthWestern’s load. Figure 5-4 shows the shift in resources that provide energy for
NorthWestern’s load comparing 2014 actuals to 2016 forecast. Intermittent wind will
make up 25% of the supply for the portfolio reducing the amount of coal and market
purchases. Annual net market purchase figures remain stable as any reductions due to
increased wind generation are balanced by increased economic purchases due to lower
market prices. The forecast for 2016 also will see additional natural gas generation due to
the dispatch requirements of SPP. SPP will economically dispatch all of NorthWestern’s
registered resources.
Figure 5-4 2014 Actual vs. 2016 Forecast Energy Resource Mix
Figure 5-5 below details the resources that are used to serve NorthWestern’s load
requirements in around-the-clock (“ATC”) hours as modeled in the PowerSimm software.
The combination of economically dispatched thermal units and Company-owned and
contracted for renewable resources leaves NorthWestern slightly short of fulfilling its load-
serving obligations during most hours.
Peaking Gas and Diesel0.7%
Baseload Coal83.2%
Wind (Owned & Contracted), 5.5%
Net Market Purchases10.6%
2014 Energy Resource Mix(1.67 GWh Total)
Peaking Gas and Diesel2.5%
Baseload Coal60.8%
Wind (Owned & Contracted)
25.3%
Net Market Purchases11.4%
2016 Energy Resource Mix(2.00 GWh Total)

Chapter 5 – Forecasts
2016 South Dakota Electricity Supply Resource Procurement Plan Page 5-6
Figure 5-5 NorthWestern Supply Portfolio Monthly ATC Resource Stack Base Case
The expected load growth through 2026 may increase the need for NorthWestern to provide
a market flexible resource to serve this obligation. A minimal level of market purchases
are expected to be needed over the planning horizon. Figure 5-6 portrays the forecasted
market sales and purchases over the next 10 years. The effects of increased NorthWestern
load and lower economic dispatch of thermal units due to depressed market prices leave
NorthWestern with a higher level of market purchases than market sales through 2026.
‐
50
100
150
200
250
300
Jan‐17
Jul‐17
Jan‐18
Jul‐18
Jan‐19
Jul‐19
Jan‐20
Jul‐20
Jan‐21
Jul‐21
Jan‐22
Jul‐22
Jan‐23
Jul‐23
Jan‐24
Jul‐24
Jan‐25
Jul‐25
Jan‐26
Jul‐26
aMW Energy
NorthWestern Supply PortfolioMonthly ATC Resource Stack ‐ Base Case
Wind
Huron
Yankton
Aberdeen GS2
Neal
Coyote
Big Stone
Load

Chapter 5 – Forecasts
2016 South Dakota Electricity Supply Resource Procurement Plan Page 5-7
Figure 5-6 Monthly ATC Market Purchases & Sales
NorthWestern will continue to evaluate, also keeping in mind availability of transmission,
if and when the addition of a base load or load-following resource is most cost effective or
needed for reliability.
Figure 5-7 represents the forecast for total purchased power costs and the amount of
forecasted MWh to be purchased. In 2026 estimated purchase power costs are expected to
be almost $12 million for the base case.
‐
10,000
20,000
30,000
40,000
50,000
60,000
70,000
Jan‐17
Jun‐17
Nov‐17
Apr‐18
Sep‐18
Feb‐19
Jul‐19
Dec‐19
May‐20
Oct‐20
Mar‐21
Aug‐21
Jan‐22
Jun‐22
Nov‐22
Apr‐23
Sep‐23
Feb‐24
Jul‐24
Dec‐24
May‐25
Oct‐25
Mar‐26
Aug‐26
MWh
Monthly ATC Market Purchases & Sales
Market Purchases
Market Sales

Chapter 5 – Forecasts
2016 South Dakota Electricity Supply Resource Procurement Plan Page 5-8
Figure 5-7 Annual Purchased Power Cost and Associated MWh
Capacity
As a member of SPP, NorthWestern is currently required to carry 13.6% of capacity in
excess of its peak load to meet the PRM requirement. Effective 2017, SPP will require a
12% PRM. Historic peak loads show an average growth rate of around 1% per year over
the last 10 years. The peak load forecast is based on a 10-year historical correlation of
peak loads with two factors: system-averaged maximum ambient temperature on peak load
days and annual load. A regression analysis was used to determine the dependence of peak
loads on each of these two variables. Using a nominal “design” peak load temperature of
100º F and a 10-year historical trend-based load forecast, the results were used to generate
a peak load trend from 2017 through 2026. The two new large industrial loads discussed
above were added to these forecasted peak loads, and the resulting values were used to
$0
$2
$4
$6
$8
$10
$12
$14
2017 2018 2019 2020 2021 2022 2023 2024 2025 20260
100
200
300
400
500
600
Po
wer
Co
sts
(Mill
ion
s)
MW
h P
urc
has
es (
Th
ou
san
ds
)
Annual Purchased Power Costs(Excludes Demand Cost)
Market Purchase MWh Market Purchase Cost

Chapter 5 – Forecasts
2016 South Dakota Electricity Supply Resource Procurement Plan Page 5-9
determine the SPP PRM. The 2017-2026 peak load forecast is shown in Table 5-2 along
with the total capacity obligation including the 12% PRM1.
Table 5-2: Summer Peak Load 10-Year Forecast
Figure 5-8 below displays NorthWestern’s forecasted future capacity deficits and
surpluses, based on predicted future capacity obligations compared to existing capacity
commitments (existing generation plus third-party capacity contracts). Beginning in 2019,
NorthWestern is forecasting that it will need to obtain additional capacity either through
adding internal generation or securing third-party contracts, in order to meet its system
capacity requirement. In the current forecast, this need will increase annually from 3 MW
in 2019 to around 19 MW in 2026.
1 This is the SPP-prescribed level.
Year Summer Peak
(MW)
Summer Peak with 12% Reserve Margin (MW)
2017 338 379
2018 340 381
2019 348 389
2020 353 395
2021 355 397
2022 356 399
2023 358 401
2024 359 402
2025 361 404
2026 362 406

Chapter 5 – Forecasts
2016 South Dakota Electricity Supply Resource Procurement Plan Page 5-10
Figure 5-8 Capacity Requirements and Available Peak Capacity
* MISO Loss of Load Expectation study planning reserve requirement of 7.1% in 2014 and 2015 ** Beethoven was purchased by NWE in September of 2015 *** SPP Planning Reserve Margin (PRM) Requirement of 13.6% in 2016 changes to 12% in 2017
NorthWestern will evaluate capacity options as 2019 approaches to determine the most
cost-effective capacity additions. Along with projected growth, changes to the planning
reserve requirement and available transmission may significantly influence the timing for
any additional capacity. As discussed in Chapter 4, this Plan evaluates comparisons of
different types of capacity facilities that may provide additional benefits to NorthWestern
customers.
300
320
340
360
380
400
420
440
2014 2015 2016 2017 2018 2019 2020 2021 2022 2023 2024 2025 2026
MW
Capacity Requirements and Available Peak Capacity
Owned Thermal Owned Wind
Contracted Wind Cap Contracts
Annual Peak + Reserve Margin Req
Short capacity in this region
Excess Capacity in this region
Chapter 5 – Forecasts
2016 South Dakota Electricity Supply Resource Procurement Plan Page 5-11
Commodity Forward Prices
NorthWestern relies on current expectations of forward/forecast prices, market
expectations of price-implied volatility, fundamental market relationships, rate of mean
reversion, and correlations of simulated prices through time in order to capture variability
in the simulation of commodity prices. The simulated forward/forecast commodity prices
include power at the SPP North trading hub, natural gas at the Ventura, and coal used for
generation at Big Stone, Coyote, and Neal. The forecasted commodity prices provide the
expected values from the average of simulation results. The forecasts that are used in this
plan will be utilized in evaluation of other potential future resources.
Natural Gas Price Forecast
NorthWestern’s long-term natural gas forecast is a combination of current forward market
prices and the application of long-term price escalation factors. The near-term Ventura
forward prices are obtained from the Intercontinental Exchange (“ICE”) until October
2017. The forward curve is then escalated after October 2017 through the remainder of the
planning horizon at the escalation rate from the Energy Information Administration
(“EIA”) 2016 Annual Energy Outlook nominal Henry Hub gas price projection for SPP
North in the No Clean Power Plan reference case.
Electricity Price Forecast
NorthWestern uses the same methodology for its electricity price forecast as is used for its
natural gas forecast. Forward market electricity prices are provided by ICE through
December 2018. The electricity price is then escalated using the same escalation rate as
the natural gas forecast.

Chapter 5 – Forecasts
2016 South Dakota Electricity Supply Resource Procurement Plan Page 5-12
Table 5-3 details the mean heavy load, light load, and around the clock electric and natural
gas price forecasts that are modeled in PowerSimm.
Table 5-3 Base Case Electricity and Natural Gas Price Forecasts
Coal Price Forecast
The coal price forecasts for Big Stone, Coyote, and Neal are used to fuel each of the plants.
Estimated prices are used for Coyote from 2017 through 2021, Big Stone from 2017
through 2024, and Neal from 2017-2025. After the estimated prices, the coal prices are
escalated throughout the remainder of the planning horizon using the 20-year average
inflation escalation for Gross Domestic Product as provided by the U.S. Bureau of
Economic Analysis. Table 5-4 details the projected coal forecasts.
(Remaining page blank for table.)

Chapter 5 – Forecasts
2016 South Dakota Electricity Supply Resource Procurement Plan Page 5-13
Table 5-4 Coal Price Forecasts
Conclusions
Energy load growth has remained relatively stable over the last 10 years. NorthWestern is
also in the process of planning for two large industrial loads coming online in the next few
years. Beginning in 2019, NorthWestern is forecasting that it will need to obtain additional
capacity either through adding internal generation or third-party contracts, in order to meet
its system capacity requirement. Based on the current forecast, this need will increase
annually from 3 MW in 2019 to around 19 MW in 2026.
Chapter 6 –Portfolio Modeling and Analysis
2016 South Dakota Electricity Supply Resource Procurement Plan Page 6-1
CHAPTER 6 PORTFOLIO MODELING AND ANALYSIS
Modeling Overview
For the 2016 Plan, NorthWestern used the PowerSimm™ suite of products from Ascend.
PowerSimm™ is a modeling software that NorthWestern uses to model costs and risks to
its portfolio. PowerSimm™ uses a stochastic simulation approach to consider uncertainty
over the planning horizon. The stochastic simulations allow NorthWestern to quantify the
effects of variation of load, renewable generation, thermal generation, and commodity
prices on a simulated portfolio.
Portfolio Analysis
NorthWestern modeled a range of potential conditions with varying levels of renewables,
thermal capacity additions, and the effect of environmental policies. NorthWestern’s base
case resource portfolio (“Base”) includes existing resources with no planned additions. The
Base portfolio depends on market purchases to meet current and future portfolio needs.
The Base escalates the natural gas and electric prices based on EIA’s forecast of natural
gas prices at SPP interconnects in the Annual Energy Outlook “No Clean Power Plan”
reference case. The Base portfolio also provide the “base” upon which all other resource
portfolios are modeled.
Table 6-1 below lists the portfolios that NorthWestern modeled and the modeling
assumptions for those portfolios. Additional renewable resources, wind and solar, were
modeled to analyze the effect of varying levels of renewable resources on NorthWestern’s
resource portfolio. These portfolios are: the “50 MW Wind” case, the “100 MW Wind”
case, the “50 MW Solar” case, and the “100 MW Solar” case.

Chapter 6 –Portfolio Modeling and Analysis
2016 South Dakota Electricity Supply Resource Procurement Plan Page 6-2
Two portfolios analyze the addition of thermal resources to the Base portfolio. The
“Recip” portfolio includes two 18 MW Wartsila internal combustion engines located in
Yankton entering the portfolio in 2022 and one 18 MW Wartsila located in Mitchell in
2024. The “Combustion Turbine” portfolio adds one 60 MW Pratt and Whitney
combustion turbine located in Huron to the portfolio in 2022.
NorthWestern also analyzed the effect of prospective future environmental regulations in
the “Clean Power Plan” portfolio. This portfolio uses the reference case from the EIA’s
Annual Energy Outlook for the escalation of natural gas and electric prices, which assumes
Clean Power Plan compliance.
(Remaining page blank for table.)

Chapter 6 –Portfolio Modeling and Analysis
2016 South Dakota Electricity Supply Resource Procurement Plan Page 6-3
Table 6-1 Resource Plan Portfolio Assumptions
Assets Natural Gas/Power Forecast
Base Portfolio
Big Stone Coyote Neal
Aberdeen 1 Aberdeen 2 Huron 1 Huron 2
Peaking Plants Titan
Beethoven OakTree
Simulated monthly forwards from current Intercontinental Exchange market prices. Natural gas and electric prices use ICE through October 2017 while electricity uses ICE through December 2018 respectively. Extended through the 2026 by using nominal natural gas escalation from EIA Southwest Power Pool / North No Clean Power Plan Reference case.
50 MW Wind
Base +50MW wind in
2018 Same as base
100 MW Wind
Base +100MW wind in
2018 Same as base
50 MW Solar
Base +50MW solar in
2018 Same as base
100 MW Solar
Base +100MW solar in
2018 Same as base
Recip
Base + 2 recip in 2022 + 1 recip in 2024 Same as base
Combustion Turbine
Base +1 ct in 2022 Same as base
Clean Power Plan Base
Same as base for current prices. Escalation uses the EIA Southwest Power Pool / North Clean Power Plan Reference case.
Summary of Results
Portfolio modeling with PowerSimm produces a total NPV of term costs for each portfolio.
The total NPV costs are segregated into components of existing fixed and capital costs,
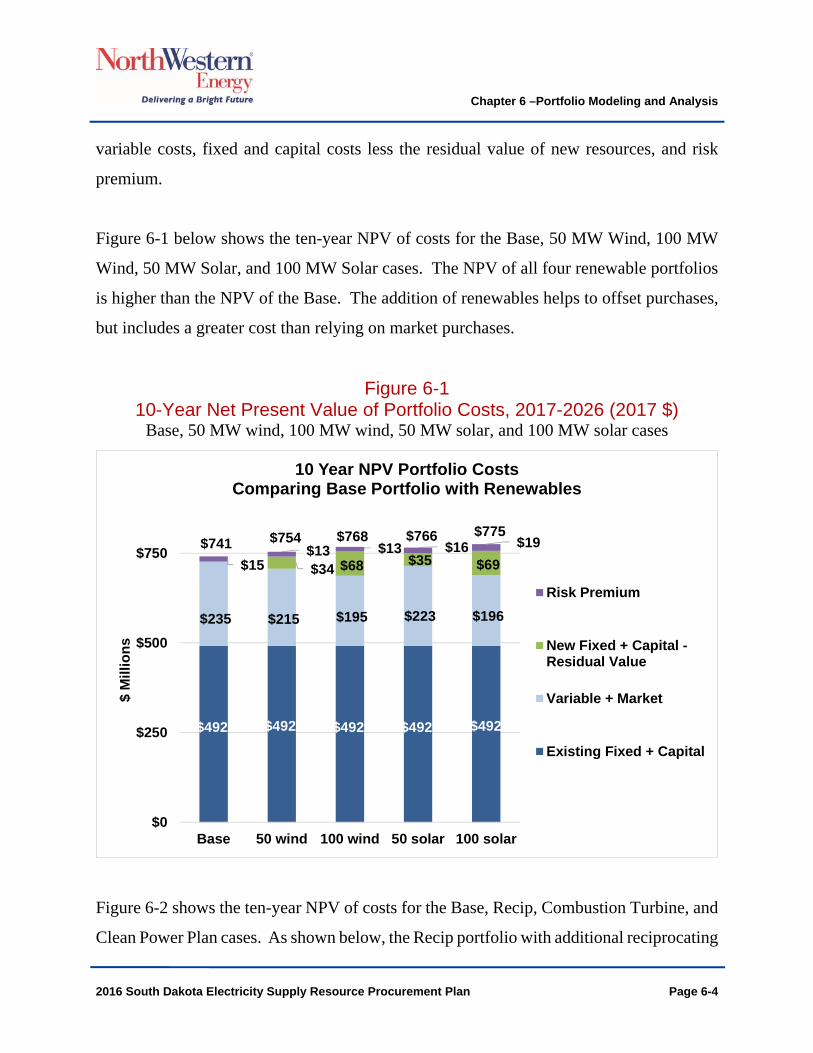
Chapter 6 –Portfolio Modeling and Analysis
2016 South Dakota Electricity Supply Resource Procurement Plan Page 6-4
variable costs, fixed and capital costs less the residual value of new resources, and risk
premium.
Figure 6-1 below shows the ten-year NPV of costs for the Base, 50 MW Wind, 100 MW
Wind, 50 MW Solar, and 100 MW Solar cases. The NPV of all four renewable portfolios
is higher than the NPV of the Base. The addition of renewables helps to offset purchases,
but includes a greater cost than relying on market purchases.
Figure 6-1 10-Year Net Present Value of Portfolio Costs, 2017-2026 (2017 $)
Base, 50 MW wind, 100 MW wind, 50 MW solar, and 100 MW solar cases
Figure 6-2 shows the ten-year NPV of costs for the Base, Recip, Combustion Turbine, and
Clean Power Plan cases. As shown below, the Recip portfolio with additional reciprocating
$492 $492 $492 $492 $492
$235 $215 $195 $223 $196
$34 $68 $35 $69 $15 $13 $13 $16 $19 $741 $754 $768 $766 $775
$0
$250
$500
$750
Base 50 wind 100 wind 50 solar 100 solar
$ M
illio
ns
10 Year NPV Portfolio Costs Comparing Base Portfolio with Renewables
Risk Premium
New Fixed + Capital -Residual Value
Variable + Market
Existing Fixed + Capital

Chapter 6 –Portfolio Modeling and Analysis
2016 South Dakota Electricity Supply Resource Procurement Plan Page 6-5
engines is more economical than the Combustion Turbine portfolio. The lower heat rate
and increased flexibility of reciprocating engines more than offsets their higher capital
costs. The Clean Power Plan portfolio shows slightly increased costs over the Base
portfolio.
Figure 6-2 10-Year Net Present Value of Portfolio Costs, 2017-2026 (2017 $)
The annual portfolio costs for the Base and renewable portfolios are displayed below in
Figure 6-3, and the annual portfolio costs of the Base, thermals, and Clean Power Plan
portfolios are shown in Figure 6-4. Portfolio costs have decreased from the 2014 Plan.
$492 $492 $492 $492
$235 $232 $235 $235
$14 $45 $15 $14 $14
$15
$741 $753
$786 $742
$0
$250
$500
$750
Base Recip CombustionTurbine
CleanPower Plan
$ M
illi
on
s
10 Year NPV Portfolio Cost Utilizing Base Portfolio with Thermal
Risk Premium
New Fixed + Capital -Residual Value
Variable + Market
Existing Fixed + Capital
Total

Chapter 6 –Portfolio Modeling and Analysis
2016 South Dakota Electricity Supply Resource Procurement Plan Page 6-6
Figure 6-3 Annual Portfolio Costs – Base and Renewables
Figure 6-4 Annual Portfolio Costs – Base, Thermal, and Clean Power Plan
Figures 6-1 through 6-4, above, exhibit the economics of the NorthWestern supply
portfolio in terms of cost and risk. In contrast, the net positions of each supply portfolio are
shown below in Figure 6-5 and Figure 6-6. The net position charts show the amount of
energy purchased or sold in each portfolio in the SPP market based on utilizing the most
90
100
110
120
130
140
150
2017 2018 2019 2020 2021 2022 2023 2024 2025 2026
Co
st (
$Mill
ion
)Annual Portfolio Costs Base and Renewable
Scenarios
Base 50 wind 100 wind 50 solar 100 solar
90
100
110
120
130
140
150
2017 2018 2019 2020 2021 2022 2023 2024 2025 2026
Co
st
($M
illio
n)
Annual Portfolio Costs : Base, Thermals, and Clean Power Plan
Base Recip Combustion Turbine Clean Power Plan

Chapter 6 –Portfolio Modeling and Analysis
2016 South Dakota Electricity Supply Resource Procurement Plan Page 6-7
economic resources to meet NorthWestern’s load obligations and using NorthWestern’s
resources to supply energy to the SPP market when it makes economic sense to do so.
Renewable resources are modeled as must-run, must-take resources. The Net Position
figures show that NorthWestern must rely on market purchases to fulfill its load serving
obligation in every scenario other than the 100 MW Wind portfolio, as shown by the
negative net position values of all portfolios except the 100 MW Wind.
Figure 6-5 Net Position Base and Renewable Portfolios
Figure 6-6 below details the physical net position of the base portfolio compared to the
thermal portfolios and the Clean Power Plan scenario. The addition of thermal resources
helps to reduce the amount of market purchases through the study horizon, but market
purchases are still required to fulfill NorthWestern’s load-serving obligation.
(500,000)
(400,000)
(300,000)
(200,000)
(100,000)
0
100,000
200,000
2017 2018 2019 2020 2021 2022 2023 2024 2025 2026
Net
Po
siti
on
(M
Wh
)
Base 50 Wind 100 Wind 50 Solar 100 Solar

Chapter 6 –Portfolio Modeling and Analysis
2016 South Dakota Electricity Supply Resource Procurement Plan Page 6-8
Figure 6-6 Net Position for Base, Thermal, and Clean Power Plan Portfolios
Evaluation of Capacity Resource Additions
NorthWestern evaluated various thermal generation technologies because of the capacity
deficiency that arrives in 2022. An 18 MW Wartsila 50SG reciprocating engine and a 60
MW Pratt and Whitney (“P&W Swiftpac 60”) combustion turbine were assessed to
determine the potential economic value of each asset under observed market conditions of
SPP. While both assets are gas-fired generators, the differentiating factors reside in their
efficiency and flexibility.
The SPP market provides market prices on 5-minute increments and places an economic
premium on resources that can provide the flexibility to react in an ever-changing market.
Flexible resources that can economically deliver regulation energy and 10-minute spinning
reserves carry additional value in SPP. The combined effect of a volatile 5-minute energy
market and an attractive ancillary service market delivers a clear price signal to generators
that have the ability to:
(450,000)
(400,000)
(350,000)
(300,000)
(250,000)
(200,000)
(150,000)
(100,000)
(50,000)
0
2017 2018 2019 2020 2021 2022 2023 2024 2025 2026
Ne
t P
os
itio
n (
MW
h)
Base Recip Combustion Turbine Clean Power Plan

Chapter 6 –Portfolio Modeling and Analysis
2016 South Dakota Electricity Supply Resource Procurement Plan Page 6-9
Startup and shutdown within 5 minutes;
Have negligible start-up costs; and
Run at minimum load efficiently to provide regulation services.
A comparison of the economic performance of the Wartsila 50 SG engine versus the P&W
Swiftpac 60 reinforces the value of flexible generation and efficiency. Peaking generation
that can rapidly and efficiently respond to the SPP market price signals has additional value
over less flexible or less efficient generation.
Figure 6-7 Annualized Gross Margin Profit by Market Product for Wartsila 50SG and P&W Swiftpac 60 Generation
Figure 6-7 quantifies the additional value that the Wartsila 50SG provides over the P&W
Swiftpac 60 combustion turbine. These generators realize revenue from three principal
SPP markets: 1) Day-ahead energy, 2) Real-time energy, and 3) Ancillary services.
Because the Wartsila 50SG engines have a lower heat rate and greater operating flexibility,
the Wartsila provides more value than the P&W Swiftpac 60 combustion turbine. The
$0
$20
$40
$60
$80
$100
$120
$140
$160
$180
Wartsila 50 SG P&W Swiftpac 60
$/kW
-yr
Day-Ahead Energy Real-Time Energy Ancillary Services

Chapter 6 –Portfolio Modeling and Analysis
2016 South Dakota Electricity Supply Resource Procurement Plan Page 6-10
Wartsila engines have an annual gross margin profit of $166/kW-yr versus $92/kW-yr for
the P&W Swiftpac 60.
Input Assumptions for Capacity Resource Additions
The input assumptions and modeling results captured the physical and economic attributes
of each generator relative to market prices. The operating characteristics of each generator
operating in South Dakota are shown in Table 6-2.
Table 6-2 Generation Asset Input Assumptions
The market prices for each commodity are summarized in Tables 6-3 and 6-4.
(Remaining page blank for table.)
Asset Characteristic Wartsila 18V50SG Pratt and Whitney Swiftpac 60Output (ISO) 18.56 MW 59.5 MWEfficiency - HHV (ISO) 8,215 Btu/kWh 9,266 Btu/kWhMinimum stable load 3.5 MW 28.3 MWEfficiency at minimum stable load 11,462 Btu/kWh 12,012 Btu/kWhStart-up time 1 min 2 minStart-up cost (maintenance) 0 $/start 200 $/startStart-up fuel cost 5.50 $/MW/start 53.02 $/MW/startVOM $7.71/MWh $6.16/MWhNox 0.19 T/MMbtu 0.19 T/MMbtuSO2 .0014 T/MMbtu .0014 T/MMbtu
CO2 118 T/MMbtu 118 T/MMbtu

Chapter 6 –Portfolio Modeling and Analysis
2016 South Dakota Electricity Supply Resource Procurement Plan Page 6-11
Table 6-3 Summary of Energy Market Price Inputs for South Dakota
Table 6-4 Summary of Ancillary Market Price Inputs for South Dakota
CommodityPrice
Interval (Units)
Average Price Price Volatility
Peak Off-Peak Peak Off-Peak
Gas Price (DA) Daily $2.95/MBtu 29%
Power (DA) Hourly $20.16/MWh $22.29/MWh 39% 44%
Power (RT) 5 Minutes $21.24/MWh $19.53/MWh 181% 168%
CommodityPrice Interval
(Units)Average Price Price Volatility
Peak Off-Peak Peak Off-Peak
10 minute Spin (DA)
Hourly $7.87/MW $5.68/MW 552% 563%
10 minute Non-Spin (DA)
Hourly $3.0/MW $2.07/MW 1438% 1531%
Regulation Up (DA)
Hourly $13.20/MW $10.34/MW 330% 312%
Regulation Down (DA)
Hourly $6.31/MW $7.01/MW 132% 50%
10 minute Spin (RT)
5 Minutes $3.84/MW $3.38/MW 550% 571%
10 minute Non-Spin (RT)
5 Minutes $1.48/MW $1.39/MW 1305% 1205%
Regulation Up (RT)
5 Minutes $11.22/MW $10.07/MW 289% 287%
Regulation Down (RT)
5 Minutes $9.30/MW $9.50/MW %135 138%

Chapter 6 –Portfolio Modeling and Analysis
2016 South Dakota Electricity Supply Resource Procurement Plan Page 6-12
Conclusions
NorthWestern modeled varying levels of renewables, thermals, and environmental
compliance against the current Base portfolio. The Base portfolio was the least-cost NPV
portfolio, but has slightly higher risk than the thermal or wind portfolios. NorthWestern is
in a position where it must make market purchases in order to fulfill its load-serving
obligation in all portfolios other than the 100 MW Wind portfolio. Possible future
environmental regulations, as indicated in the Clean Power Plan portfolio, increase costs
only slightly over the Base portfolio.
The Recip portfolio has a lower NPV cost than the renewable portfolios or the Combustion
Turbine portfolios. Peaking generation that can rapidly and efficiently respond to the SPP
market price signals has additional value over less flexible or less efficient generation.
Reciprocating engines provide capacity, deliver economic energy, and provide ancillary
services. NorthWestern will continue to analyze the appropriate generation technologies
that provide capacity and additional value in the SPP market.

Chapter 7 – Environmental
2016 South Dakota Electricity Supply Resource Procurement Plan Page 7-1
CHAPTER 7 ENVIRONMENTAL
Environmental Trends that Influence the 2016 Plan
Introductory Statement
Environmental considerations continue to be a critical aspect of NorthWestern’s resource
planning process. We are committed to providing utility services that reliably and cost-
effectively meet our customers’ needs, while protecting the quality of the environment.
We are vigilant in monitoring the impacts of our operations on the environment, in
complying with the spirit, as well as the letter, of environmental laws and regulations, and
in responsibly managing the natural resources under our stewardship.
The electric utility sector is heavily regulated by state and federal environmental laws such
as the Clean Air Act, the Clean Water Act, the Endangered Species Act, the Migratory Bird
Treaty Act, and laws regulating waste generation and disposal. High-level considerations
of environmental regulations are discussed below.
Greenhouse Gas Emissions
No single law or public policy issue has had as great an influence on resource planning as
the Clean Air Act. The new regulations covering greenhouse gas (“GHG”) emissions from
new and existing electric generating units vividly demonstrate the potential impacts of the
Act and have injected substantial uncertainty into the planning process. Coal-fired
generation plants are under particular scrutiny due to their level of GHG emissions. As
discussed in Chapter 3 and depicted in Figure 3-2, our South Dakota energy supply
resource mix includes 60.9% of base load coal-fired energy generation provided by jointly

Chapter 7 – Environmental
2016 South Dakota Electricity Supply Resource Procurement Plan Page 7-2
owned coal plants located in three states – the Big Stone Plant in South Dakota, the Coyote
Station in North Dakota, and the Neal 4 Plant in Iowa.
New Source Performance Standards (NSPS)
On October 23, 2015, the final standards of performance to limit GHG emissions from
new, modified, and reconstructed fossil fuel generating units and from newly constructed
and reconstructed stationary combustion turbines were published in the Federal Register
(“FR”). The standards reflect the degree of emission limitations that the U.S.
Environmental Protection Agency (“EPA”) believes are achievable through the application
of its designated “best systems of emission reduction” (“BSER”). Parties are currently
challenging this regulation. EPA’s carbon dioxide (“CO2”) emissions limit for fossil fuel-
fired electric utility steam generating units precludes the construction of any new base load
coal-fired plants because the BSER include carbon capture and storage systems which are
not yet ready for commercial use. New base load natural gas combined cycle and simple
cycle combustion turbines are also required to meet a CO2 emissions standard. Non-base
load simple cycle combustion turbines are required to meet a heat input-based standard.
New reciprocating engines would not be affected by the NSPS. NorthWestern’s analyses
in this plan factored in consideration of the NSPS for combustion turbines.
Existing Source Performance Standards
In a separate action that dramatically affects existing power plants, the final rule titled,
“Carbon Pollution Emission Guidelines for Existing Stationary Sources: Electric
Generating Units” was also published in the FR on October 23, 2015. This rule establishes
guidelines for states to follow in developing plans to reduce GHG emissions from existing
electric generating units under Section 111(d) of the Clean Air Act. EPA refers to this rule
as the Clean Power Plan (“CPP”). The CPP specifically establishes CO2 emission
performance rates for existing fossil fuel-fired electric utility steam generating units and

Chapter 7 – Environmental
2016 South Dakota Electricity Supply Resource Procurement Plan Page 7-3
stationary combustion turbines. States have the option to develop their own
implementation plans or adopt a federal implementation plan. The EPA gave states the
option to develop compliance plans based on CO2 emission rates (pounds (“lbs.”) of CO2
per MWh) or CO2 mass (tons) emissions. The CPP established dates by which states were
required to submit plans. Initial plans were due to EPA by September 2016, although states
had the option to seek a two-year extension to finalize their plans.
These deadlines are now on hold since the legality of the CPP is being challenged by
several states (including South Dakota), utilities, trade groups and other companies. On
February 9, 2016, the U.S. Supreme Court issued a stay of the implementation of the final
CPP. The stay does not, however, alleviate uncertainty from a planning perspective. The
stay will remain in effect until the U.S. Court of Appeals enters a decision on the
substantive challenges to the CPP and the Supreme Court either denies a petition for a writ
of certiorari following that decision or enters a judgment following grant of a petition for
a writ of certiorari. The U.S. Court of Appeals heard oral arguments on September 27,
2016. Timing of the final resolution of the legal challenges to the CPP is difficult to predict,
but a decision could be made by late 2017 or early 2018.
Despite the Supreme Court’s decision to stay the CPP, there remains significant risk
regarding the uncertainty of the ultimate disposition of carbon emissions reductions in the
states where NorthWestern’s jointly owned affected power plants are located.
Carbon Costs
Estimated potential future costs associated with the regulation of CO2 emissions from
thermal power plants represent one of the risks that NorthWestern considered in its
modeling analysis. In the 2014 Plan, NorthWestern accounted for the potential costs
resulting from CO2 reduction regulation by including a cost for carbon. In this 2016 Plan
Chapter 7 – Environmental
2016 South Dakota Electricity Supply Resource Procurement Plan Page 7-4
analysis a cost is not assigned directly to carbon emissions, but is included in the market
prices produced by the EIA in its Annual Energy Outlook for the SPP North Reference
case. These prices are included in the escalation to the natural gas and electric prices in
the modeling under the Clean Power Plan portfolio.
Summary of Key Environmental Risks: Jointly Owned Facilities
Regional Haze Rule
The Regional Haze Rule addresses visibility impairment in Class I areas. Class I areas
include national parks and wilderness areas. Facilities built between 1962 and 1977 with
emissions in specified quantities that contribute to visibility impairment in Class I areas
are required to install best available retrofit technology (“BART”) to control emissions.
Big Stone Plant
Big Stone Plant has been online since 1975 and therefore was BART-eligible. Air
dispersion modeling for Big Stone indicated the plant contributed to visibility impairment
at Class 1 areas in South Dakota, North Dakota, Michigan and Minnesota. Therefore, Big
Stone Plant was required to install and operate BART which the South Dakota Department
of Environment and Natural Resources determined to be selective catalytic reduction in
conjunction with separated over-fire air for control of nitrogen oxides (“NOX”), a scrubber
for reducing sulfur dioxide (“SO2“), and a bag-house to control particulate matter. The air
quality control system comprised of this equipment was commissioned on December 29,
2015 and is fully operational.
Coyote Station
Coyote Station has been online since 1981 and therefore was not BART-eligible. Although
the unit was not BART-eligible, the North Dakota Regional Haze State Implementation

Chapter 7 – Environmental
2016 South Dakota Electricity Supply Resource Procurement Plan Page 7-5
Plan (“SIP”) required Coyote Station to reduce NOX emissions by July 2018. To satisfy
the SIP, separated over-fire air equipment was installed during a spring 2016 planned
maintenance outage.
Neal Unit 4
In Iowa, no source specific or unit specific emissions limits or compliance schedules were
developed for the regional haze SIP. Iowa relied on the Cross-State Air Pollution Rule to
equal BART.
Regional Haze SIP Revisions
States are required to revise their regional haze implementation plans and submit them to
EPA by July 31, 2018, and every 10 years thereafter. However, on April 25, 2016, EPA
signed a proposed rule to delay the July 31, 2018 revision date until July 31, 2021.
Currently, Neal Unit 4 does not anticipate any compliance issues with the Regional Haze
Rule in the near future. For Big Stone Plant and Coyote Station, it is as yet uncertain how
future regional haze SIP revisions may affect them. However, NorthWestern, along with
the other joint owners, believes Coyote Station could be faced with additional NOx and SO2
reductions.
Mercury and Air Toxics Rule
MATS became effective April 16, 2012, requiring new and existing coal-fired facilities to
achieve emissions standards for mercury, acid gases, and other hazardous pollutants.
Existing sources were required to comply with the new standards by April 16, 2015.
All of the jointly owned coal-fired power plants in our portfolio – the Big Stone Plant in
South Dakota, the Coyote Station in North Dakota and the Neal 4 Plant in Iowa – are
currently in compliance with the MATS rule. Therefore, we assume in the Plan there will

Chapter 7 – Environmental
2016 South Dakota Electricity Supply Resource Procurement Plan Page 7-6
be no additional material upgrades required for additional MATS compliance obligations
for any of the plants.
Coal Combustion Residuals
“The Disposal of Coal Combustion Residuals from Electric Generating Utilities” was
published in the FR on April 17, 2015. These regulations set forth requirements for the
disposal of coal combustion residuals (“CCR”) as non-hazardous waste under the solid
waste provisions in subtitle D of the Resource Conservation and Recovery Act. The rule
establishes requirements for new and existing CCR landfills and surface impoundments.
The requirements cover groundwater protection, operating criteria, record keeping and
notification, and public information posting. Several new requirements will apply to the
Big Stone Plant and the Coyote Station. Neal 4 is already in compliance since all ash is
dry disposed.
Big Stone Plant
Big Stone Plant operates a dry disposal site that is already regulated, permitted, and
inspected by the South Dakota Department of Environment and Natural Resources. Big
Stone Plant also has a surface impoundment used to temporarily handle boiler slag sluiced
to the impoundment before it is disposed in the dry disposal site or beneficially reused.
Currently Big Stone Plant is conducting the required background groundwater monitoring
program for the impoundment. Background groundwater monitoring must completed by
October 19, 2017, and a location restriction determination must be made by October 19,
2018.
Coyote Station
The Coyote Station operates a dry disposal site that is already regulated, permitted and
inspected by the North Dakota Department of Health. The Coyote Station also operates

Chapter 7 – Environmental
2016 South Dakota Electricity Supply Resource Procurement Plan Page 7-7
three surface impoundments used to temporarily handle and dewater boiler slag sluiced to
the impoundments before it is disposed in the dry disposal site or beneficially reused.
Similar to Big Stone Plant, Coyote Station is conducting the required background
groundwater monitoring programs for the impoundments.
Summary of Key Environmental Risks: Owned Facilities
Each of NorthWestern’s owned generation facilities operates under air quality operating
permits issued by the South Dakota Department of Environmental and Natural Resources.
The permits typically set visibility limits and emissions limits for total suspended
particulate matter, SO2, NOX, carbon monoxide, and volatile organic carbons. In
accordance with these permits, NorthWestern maintains control equipment, conducts
sampling, testing, measurement, recordkeeping, compliance certification, and reporting
and pays an annual air fee.
Table 7-1 Environmental and Natural Resource Permits
StationTitle V Operating
Permit #Expiration Date
Aberdeen 28.0801-03 February 17, 2020
Huron 28.0801-04 June 12, 2020
Yankton 28.0801-07 March 6, 2020
Clark 28.0801-18 October 17, 2019
Faulkton 28.0801-28 May 12, 2021

Chapter 7 – Environmental
2016 South Dakota Electricity Supply Resource Procurement Plan Page 7-8
Other Environmental Considerations
Wind Generation
In siting the 80 MW Beethoven Wind Farm, the developer and now NorthWestern as the
owner/operator follow the U.S. Fish and Wildlife Service’s (“USFWS”) Land-Based Wind
Energy Guidelines, which are voluntary guidelines for addressing wildlife conservation
concerns. The Bird and Bat Conservation Plan for the project is being implemented, and
post-construction monitoring is underway to determine impacts of operations on birds and
bats. Results of the monitoring will help inform NorthWestern of any operational or other
mitigation that may be necessary. At this time we do not foresee additional material
mitigation at our wholly owned wind facility.
The USFWS has regulatory authority to administer the following regulations that could
affect siting or operating a wind farm in South Dakota: the Migratory Bird Treaty Act, the
Bald and Golden Eagle Protection Act, the Endangered Species Act as amended, the
National Wildlife Refuge System Improvement Act of 1997, and the National
Environmental Policy Act. New wind generation in South Dakota will be subject to the
aforementioned regulations.
Summary
NorthWestern’s planning process will continue to be impacted by environmental and
wildlife regulations and legislation that will affect current and future thermal and
renewable generation resources. Providing reliable, cost-effective energy in an
environmentally safe manner remains one of NorthWestern’s commitments. We will
continue to comply with environmental statutes and guidelines while fulfilling our
responsibility to our customers.

Chapter 7 – Environmental
2016 South Dakota Electricity Supply Resource Procurement Plan Page 7-9
NorthWestern modeled a portfolio that included CPP compliance. The CPP portfolio
included escalation in the natural gas and electric prices that were provided by the EIA
Annual Energy Outlook Reference case for CPP Compliance. See Chapter 6 for the
modeling results of the CPP portfolio.

Chapter 8 – Conclusions and Action Plan
2016 South Dakota Electricity Supply Resource Procurement Plan Page 8-1
CHAPTER 8 CONCLUSIONS AND ACTION PLAN
Conclusion
This Plan evaluates NorthWestern’s electric load-serving obligation and guides
NorthWestern’s resource procurement process in South Dakota for the next 10 years. The
Plan is updated biennially and evolves with any significant changes in legislation, regional
operational or planning needs, and environmental requirements. The Plan’s conclusions
are intended to provide guidance regarding NorthWestern’s resource investments on behalf
of its South Dakota customers.
Portfolio Management
SPP requirements will also guide NorthWestern’s planning process, and NorthWestern
remains committed to full participation in SPP and full implementation of all SPP
requirements. Given the economic dispatch regime of SPP, NorthWestern will examine
how best to serve its customers’ needs in a manner consistent with its current fleet of
generation resources.
Capacity continues to be of concern and NorthWestern will continue to evaluate its
capacity needs, and the best means to meet those needs. An evaluation of NorthWestern’s
older generation assets for possible retirement and replacement will be undertaken in 2017.
Additionally, opportunities to enhance grid reliability in a cost effective manner will also
be studied. These evaluations, along with the other analysis contained in the Plan, will be
used to determine how to best serve the long-term needs of our customers.

Chapter 8 – Conclusions and Action Plan
2016 South Dakota Electricity Supply Resource Procurement Plan Page 8-2
Additionally, NorthWestern expects that the action plan items listed below will
significantly influence NorthWestern’s actions between resource plans. To facilitate the
implementation of this Plan, NorthWestern set forth the following action plan.
Action Plan
1. Presentation to the South Dakota Public Utilities Commission (“PUC”). The 2016
Electric Integrated Resource Plan will be presented to the PUC in December of
2016.
2. Retirements. NorthWestern will work with an engineering consulting firm to
develop a Retire and Replacement Plan for the natural gas-fired and oil-fired
generating units. The study will examine efficiency, reliability, parts availability,
and book value, and it will provide a cost benefit analysis for replacement of those
assets with proxy technology selections. The economic contributions of each asset
to the overall resource portfolio will also be evaluated. NorthWestern expects that
the study will be completed in July 2017 and the results will be used to inform its
resource development plans for South Dakota.
3. Capacity. Expiration of the current capacity agreement with MRES after the 2018
summer season will create a capacity shortfall beginning in 2019. NorthWestern’s
current capacity forecast shows that it will be 3 MW short in 2019, increasing to
around 19 MW short in 2026. NorthWestern will evaluate market purchases of
capacity and economic additions of physical generation resources to satisfy capacity
requirements.

Chapter 8 – Conclusions and Action Plan
2016 South Dakota Electricity Supply Resource Procurement Plan Page 8-3
4. Grid Reliability. NorthWestern will continue to study the value that can be attained
by locating future resource additions at sites that are strategically located throughout
NorthWestern’s South Dakota Service territory, to help increase grid reliability.
5. Generation Technologies. NorthWestern will continue to monitor and evaluate
generation technologies that have the potential to help NorthWestern meet its load-
serving obligation at lowest total cost to its customers.
6. Environmental. NorthWestern’s current planning efforts continue to center on
technologies that comply with proposed environmental regulations. NorthWestern
will continue to monitor CPP proposed rules and will incorporate any additional
environmental regulations/requirements into its planning processes as necessary.
7. SPP Operations. NorthWestern will continue the integration of its planning to meet
SPP planning criteria. SPP requirements for resource capacity contribution and
peak load forecasting will be adhered to as those standards continue to develop.
Resource planning will necessarily reflect those changes.
8. SPP Transmission Planning. NorthWestern will continue to monitor and participate
in SPP working groups dedicated to the transmission planning process.
NorthWestern will also continue to evaluate the results of SPP studies, along with
the system needs that are realized from the studies.