Embed Size (px)
Citation preview

Procidia™ i|Ware PC™ - Introduction
Procidia Procidia™, a family of process control solutions, provides complete control & operation capability, based on the latest in Internet technology. At the heart of this controller technology is a full line of control products, including configuration software, OPC servers, and HMI operator interface software.
The model 353 is a panelboard controller used on new or retrofit panelboard applications. These controllers can be used in simple loop applications. They are also capable of extended control and data acquisition applications by using remote Ethernet I/O modules and the Ethernet communication option in the controller.
A rack mounted version of the loop controller is the 353R (also referred to as the i|Pac™). Using the same hardware and software as the 353, it enables rack mounting of the controller. The 353R includes I/O modules that use a Universal serial bus (Ubus) with full plug & play capability. Standard modules include a full range of analog & discrete types. Up to 31 modules can be added on the Universal serial bus, greatly extending the I/O capability of the controller.
Controllers can be fully configured and operated from a local faceplate. Graphical configuration software, i|Config™, is also available. The i|Config software enables controller configuration using drag & drop function blocks and simple point & click line drawing. Logic configurations can be accomplished using Boolean function blocks or ladder logic design. On-line monitoring of function block outputs or the logic operations using color changes help troubleshoot the control system design.
Simple loop control applications can be easily operated from the local faceplate but for local unit control applications a small flat panel PC called i|Station™ will greatly improve the operator's capability. i|Station is a panel mounted PC that uses touch screen technology for operator interaction. i|Ware PC is a HMI software program that runs on i|Station. The i|Ware PC software can also be installed on a plant workstation using the Windows NT, 2000, or XP operating systems.
Contents • Installation • Modbus OPC Server • LIL OPC Server • Ethernet OPC Server • GraphWorX32 • Alarm Viewer (w/Ethernet)

• POP UP Faceplates • System Connections • Licensing • Demonstration • Control Basics • Control Solutions
i|Ware PC™ i|Ware PC HMI software is an OPC (OLE for Process Control) Client/Server Application used for Human Machine Interface (HMI). i|Ware PC is an advanced application solution built using the Genesis32 software from Iconics. Both the i|Ware PC client and server are autoconfiguring when connected to a 353 controller. The i|Ware PC client is furnished with a complete HMI application which auto configures operator faceplates & detail screens. The HMI application has been designed for operation from a touch screen PC or a workstation using the standard point & click mouse technology. OPC Servers can be located on the local workstation or on a remote server.
OPC (OLE for Process Control)
OLE™ for Process Control (OPC™) is the latest ttechnology for connecting data sources to HMI client applications. It enhances the interface between client and server applications by providing a standard mechanism to communicate data from a data source to any client application. In other words, OPC is Plug-n-Play in the field of HMI and Automation. The i|Ware PC product is furnished with three (3) standard OPC servers, a Modbus server, a Modbus Ethernet server, and a LIL (Local Instrument Link) server. The Modbus OPC server is normally used to connect a COM port on the PC to the RS232/RS485 port on the controller. Multiple OPC servers can run concurrently in a PC serving multiple COM ports each connected to individual controller groups. The Modbus Ethernet server is used when an Ethernet board has been installed in the controller (models 353 and 353R (i|Pac) are available with the Ethernet option board).
The main difference between traditional client-server architecture and OPC based client-server architecture is shown in figure 1.1.
Fig. 1.1. Traditional Client-Server Architecture

In the traditional case, servers or devices have different interfaces / drivers for each client application. Each arrow line above represents different driver or interface software. Although the protocol of a device or a server may not change, the architecture of different client applications (from different vendors) is different. This leads to increased work, costs and time. If the device or server’s protocol is changed or updated, then the client application also needs to change.
Fig. 1.2. OPC based Client-Server Architecture
OPC Architecture was introduced by the OPC Foundation mainly to overcome the above issue. In this case, a device/ server will have only one standard driver which is an OPC Compliant Server and all the client packages can be connected to it as the clients themselves are OPC Compliant Clients.
i|Ware PC Basic Edition
i|Ware PC™ is a family of 32 bit OPC Client and Server Applications for Windows. All applications are multi-threaded and feature ActiveX™ and Visual Basic for Applications™ (VBA) technology. The i|Ware PC Basic Edition is a HMI Client that is fully autoconfiguring. The OPC Server auto builds a complete OPC database of a configured controller. The i|Ware PC™ HMI client, when connected to this OPC database, automatically builds faceplates and detail screens that enables full operation of the controller from the HMI client. In additional, graphic screens, that further enhance the operation of the process, can be easily added and linked to the OPC database. Controller and Analog detail screens include a Trend Viewer that queries ATD (Analog Trend Display) blocks in the controller and provides short term historical trending when directly connected to the Modbus/Ethernet port of the controller. The Trend Viewer is then updated with new values using persistent trending. When using the LIL OPC Server persistent trending is used to populate the trend graph on the controller detail screen.

The following OPC client applications are included in i|Ware PC Basic Edition:
o GraphWorX32™ o Trend Viewer™ o Persistent Trending™
The following OPC server applications are included:
o Procidia Modbus OPC Server o Procidia Modbus Ethernet OPC Server o Procidia LIL (Local Instrument Link) OPC Server
GraphWorX32
GraphWorX32 combines drawing, operating procedures, quality reporting, and management directly into operator displays using ActiveX Controls and Visual Basic for Applications (VBA) Scripting Language.
Key features include:
o True 32 bit, Multi-Treading, Multi-Platform Design o Universal OPC Connectivity o Powerful Display creation and animation tools o Scalable and Fixed scale displays o Embedding of ActiveX Controls and OLE Objects o 50 ms Dynamic Animation Updates o Web friendly - Can be embedded into Visual Basic and HTML Pages o ActiveX Document Server - Can be viewed using Web Browsers such as
Microsoft Internet Explorer o Advanced Symbol Library o TrendWorX32 and AlarmWorX32 objects can be embedded o Built-in Expressions and Calculations o Time Saving Graphics Templates
i|Ware PC Enterprise Editions
The Enterprise Edition includes all the features of the Basic Edition and in addition includes two powerful software modules AlarmWorX32 and TrendWorX32 that extend the capability of the operator PC.
AlarmWorX32

Although alarm & event states are managed in the controller and acknowledged from the standard HMI GraphWorX32 faceplates, additional alarm & event logging can be provided by the AlarmWorX32 module. Alarms & events that occur in the controller can be logged, time stamped, and stored on the PC hard drive for later review. Additional features are available as shown below that can greatly enhance a plant operator workstation
Key features include:
o True 32 bit, Multi-Treading, Multi-Platform Design o Multi-Media Voice Annunciation of Alarms o Internet compatibility – Alarm ActiveX Controls can be embedded into
Visual Basic and HTML internet/intranet based WEB pages o Telephone Voice System - Dial-in / Dial-out to hear alarms, values and
acknowledge alarms (individually, by page or area) o Personal Scheduler - to notify only on-duty personal o Historical Alarm Analysis - Pareto charts, reports, histograms, etc. o Real-time Alarm Summary Display with Sorting and Filtering o Alarm Troubleshooting System - On-screen alarm and operator help
information o Alarm Server runs as an NT Service o Alarm Configuration and Alarm Explorer
TrendWorX32
Although the Basic Edition provides historical trending stored in the ATD (Analog Trend Display) blocks in the controller additional long term historical trending can be provided by the TrendWorX32 module included in the Enterprise Edition.
Key features include:
o Multi-Media Voice Annunciation of Alarms o Remote Paging and E-mail - Internet compatibility o OPC Flexible Trending ActiveX Container o Scaleable and Distributed OPC o Integrated MS Visual Basic for Applications o Includes several powerful ActiveX Controls o Mix Real-time and Historical Data o Supports ADO and many OLEDB Provides o Supports MS Access, MS SQL, Oracle and MS Exchange o Extensive Reporting Capability o Supports time based, X Vs Y, Logarithmic, Bar type and Strip Chart
Recorder trend type displays

Procidia™ i|Ware PC™ - Installation
This chapter provides information about:
o System Requirements o Software Installation o Software Uninstallation o Online Help and Technical Support
System Requirements
To use the iWare PC™ software, you must have one the following hardware and software components:
a. i|Station™ (available from SIEMENS with i|Ware PC™ installed) b. Plant WorkStation (recommended features)
o Pentium 2 Ghz or higher processor. o 512 MB (or more) of RAM o At least 6 GB of available hard disk space. o 3.5-inch (1.44 MB) disk drive. o CD ROM Drive o SVGA 1024x768 monitor resolution (256 colors) or better. o Microsoft Windows NT 4.0 Service Release 6a, Windows 2000, Windows
XP Professional, Microsoft DCOM and Microsoft Internet Explorer 6.0 or newer.
o A mouse or other compatible pointing device
Note: Before installing i|Ware PC™ software, be sure that all other applications, such as Microsoft Office or any anti-virus software are disabled.
Installing the Software
Start the Microsoft Windows operating system. The software is installed from the Procidia iWare Product CD. If you are upgrading from IWARE version 2.0x you must read the instructions regarding an upgrade in the Licensing document before installing version 3.00.
Note:
• Login as an Administrator before installing i|Ware PC™

• After installation, verify that file sharing of the configuration files folder has been enabled. Share as Config.
• After installation, verify that file sharing of the recipe folder has been enabled. Share as recipe.
AutoPlay CD
The Procidia CD is AutoPlay and will automatically start when inserted into the CD drive. To start AutoPlay manually, right click on My Computer, select Explore, select the CD drive (e.g. D:), right click the drive and select AutoPlay as show in the figure below. The Procidia CD will AutoPlay and the opening screen will appear.
Opening Screen
The opening screen will provide selections for this Getting Started, Software & Documentation. Select Software to start the installation procedure. Click on the Installation Overview button for a text file that provides an overview of the installation steps.
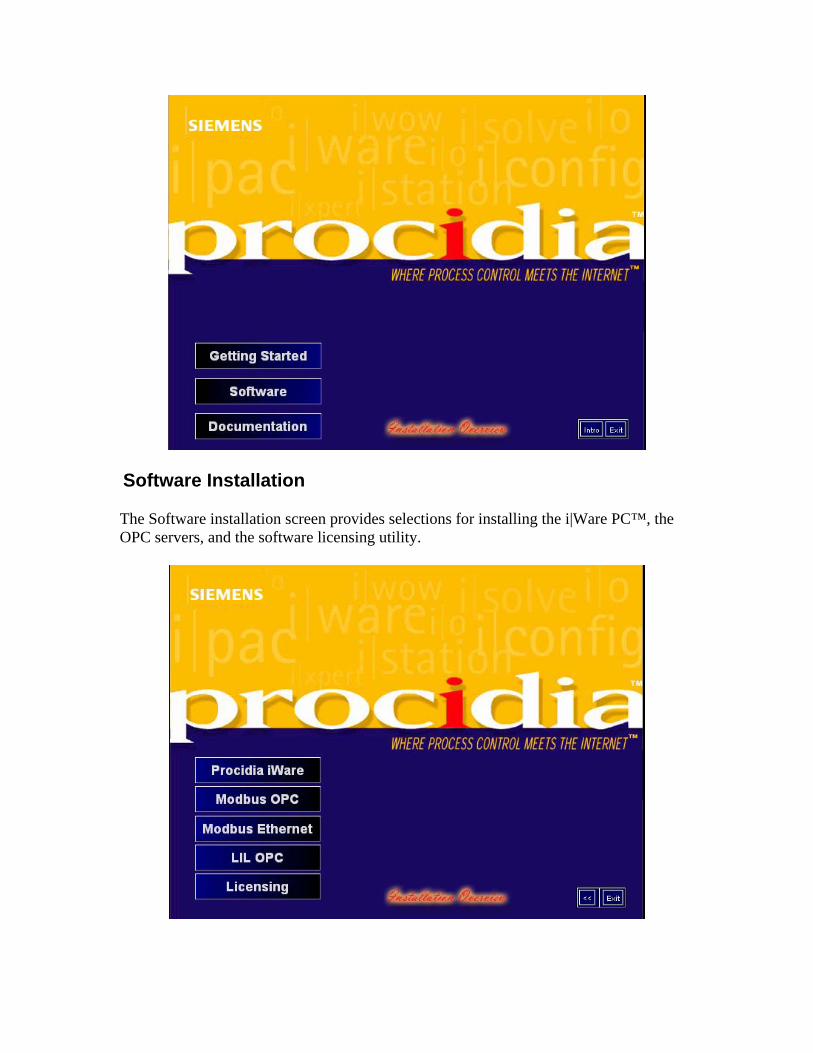
Software Installation
The Software installation screen provides selections for installing the i|Ware PC™, the OPC servers, and the software licensing utility.
Procidia
Select Procidia iWare to install the iWare software. Follow the instructions in the dialog boxes on the screen. You may be asked to install one or more Microsoft components that the iWare software needs to run (e.g. Internet Explorer version 6.0 or higher, DCOM and Microsoft Data Access Components). Each time the computer should be rebooted and the i|Ware installation restarted. For most typical installation accept all default settings.
OPC Servers
Select the OPC server or servers to be used on this system (i.e. Modbus OPC). Follow the instructions in on screen dialog boxes. Accept the default files path names.
License
Select the Licensing button to install the Procidia i|Ware license utility. The licensing software will be started automatically after the Procidia iWare installation.
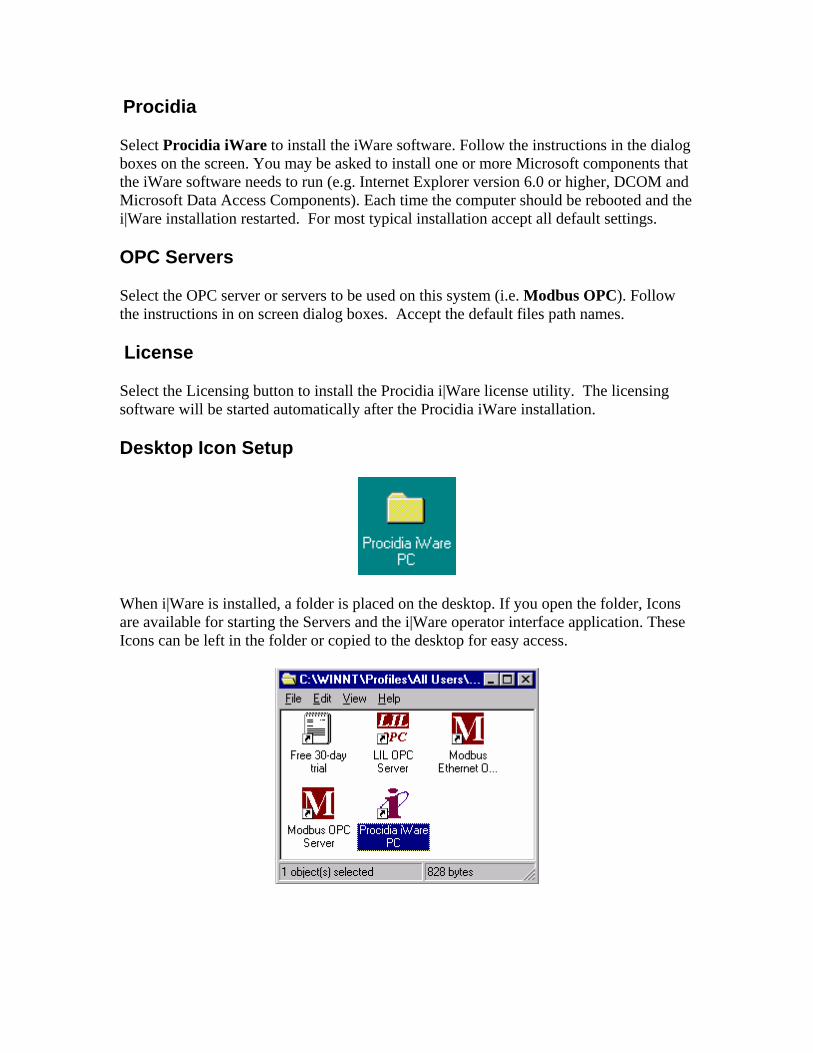
Desktop Icon Setup
When i|Ware is installed, a folder is placed on the desktop. If you open the folder, Icons are available for starting the Servers and the i|Ware operator interface application. These Icons can be left in the folder or copied to the desktop for easy access.

Procidia i|Ware PC - Modbus OPC Server
Introduction
A Modbus OPC Server is included on the i|Ware PC software CD. The Modbus OPC Server gathers data from a controller and provides (serves) data to an HMI client running in an i|Station or other computer workstation running iWare PC. The OPC server will auto build a complete database when connected to a controller or controllers. This section describes the steps necessary to auto build the database for the first time.
Connecting i|Station to the Controller/s
After a controller has been configured for an application, the COM port on the i|Station is connected to the RS232 P1 connection on the 353R (i|Pac™) rack mounted controller. Multiple 353 panel mounted controllers are connected using RS485/RS232 converters connected to the RS485 port on the 353’s. More information on the use of a RS485/RS232 converter can be found in the installation section of the 353 user manual, UM353. When connecting multiple 353 controllers it is advisable to use multiple COM ports to optimize the communication update times. The Modbus OPC server supports up to 4 COM ports. For example, (16) 353 controllers could be configured into (4) groups of (4) controllers.

Start the Modbus OPC Server
1. Start the Procidia Modbus OPC Server using the Modbus OPC Server Icon that was placed on the desktop (located in the Procidia i|Ware PC folder) during the installation procedure.
2. Select File/New to clear any existing configuration 3. Select Load CFG using the icon to the left of the ? icon on the tool bar 4. Select the COM port connected to the controller.

5. Select the … button next to the Com port to enable configuration of the Port Properties
6. When connected to a single 353 the Station Address should be 1 & Number of Stations 1.
7. Select OK which will initiate the Load Configuration process. 8. The Modbus OPC Server will auto build the data base from the controller
configuration. 9. When using multiple Com ports repeat the previous steps.
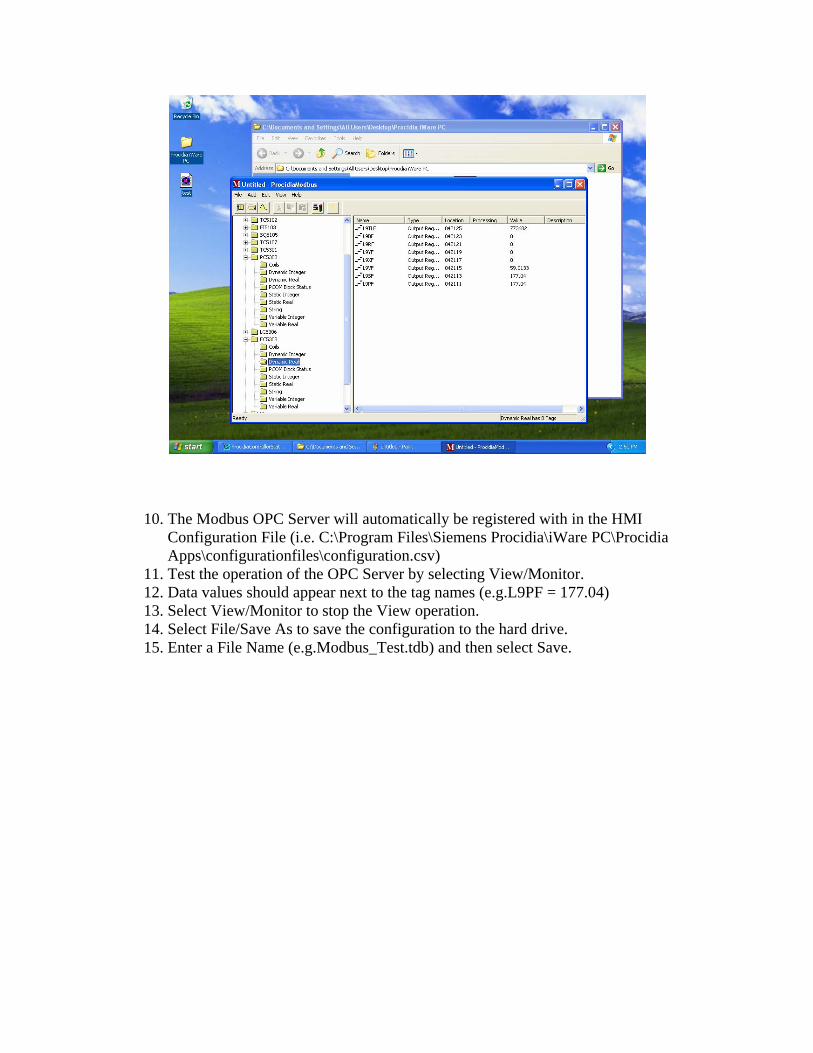
10. The Modbus OPC Server will automatically be registered with in the HMI Configuration File (i.e. C:\Program Files\Siemens Procidia\iWare PC\Procidia Apps\configurationfiles\configuration.csv)
11. Test the operation of the OPC Server by selecting View/Monitor. 12. Data values should appear next to the tag names (e.g.L9PF = 177.04) 13. Select View/Monitor to stop the View operation. 14. Select File/Save As to save the configuration to the hard drive. 15. Enter a File Name (e.g.Modbus_Test.tdb) and then select Save.
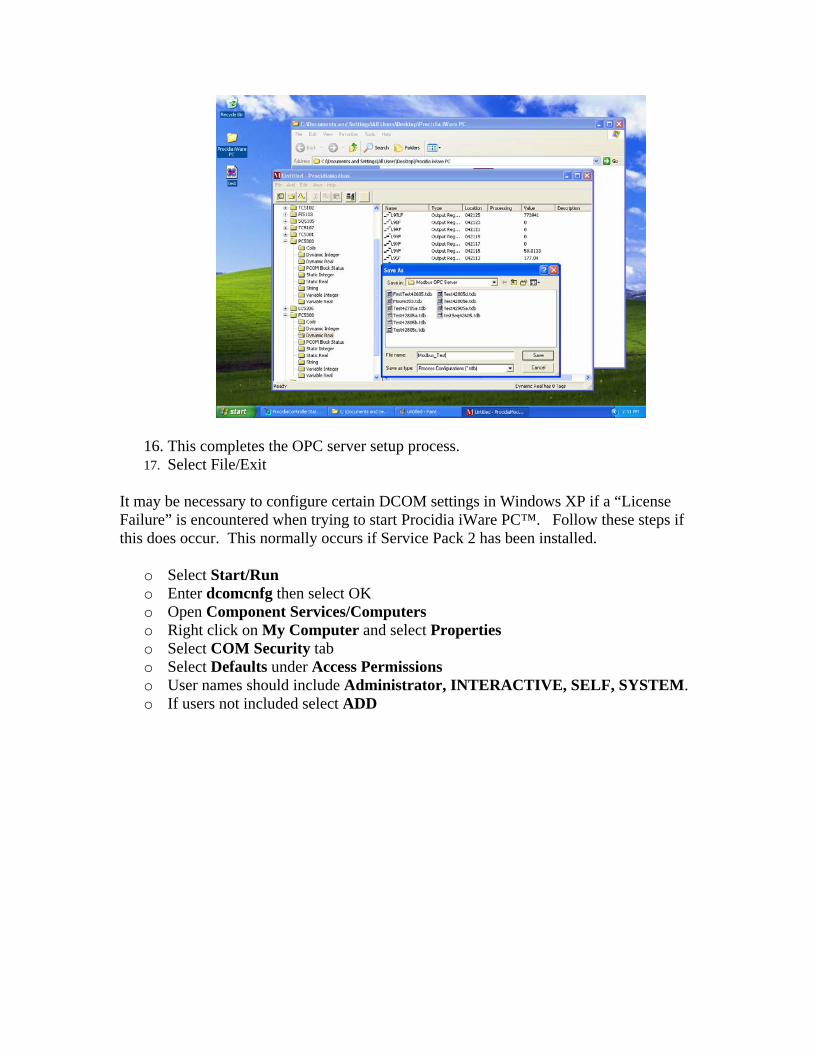
16. This completes the OPC server setup process. 17. Select File/Exit
It may be necessary to configure certain DCOM settings in Windows XP if a “License Failure” is encountered when trying to start Procidia iWare PC™. Follow these steps if this does occur. This normally occurs if Service Pack 2 has been installed.
o Select Start/Run o Enter dcomcnfg then select OK o Open Component Services/Computers o Right click on My Computer and select Properties o Select COM Security tab o Select Defaults under Access Permissions o User names should include Administrator, INTERACTIVE, SELF, SYSTEM. o If users not included select ADD

o Select Advanced in the Select Users or Groups dialog box. o Select Find Now o Select Name(RDN) to be added. Then OK (use Ctrl key to select multiple names) o Names should now be included under Access Permissions. o Select Edit Default.. under Launch and Activatiion Permissions. o Administrators, INTERACTIVE, SYSTEM should be included. o Make sure the Local Launch & Local Activation boxes are checked o Use ADD to add users as required.

Procidia i|Ware™ PC - LIL OPC Server
Introduction
A LIL OPC Server is included on the i|Ware PC™ software CD. The LIL OPC Server gathers data from a controller and provides (serves) data to an HMI client running in i|Station™ or other PC running iWare PC™ software. The OPC server will auto build a complete database when connected to a controller or controllers. This section describes the steps necessary to auto build the database for the first time.
Connecting i|Station to the Controller/s
After a controller has been configured for an application, the COM port on the i|Station (Workstation PC) is connected to the RS232 connection on the model 320 Independent Computer Interface (ICI). The model 320 is connected to the LIL along with the controllers [353, 353R (aka i|Pac™), 352P] on the LIL. Legacy 352 family products can also be included but the OPC server database must be configured manually.
Start the LIL OPC Server
18. Start the Procidia LIL OPC Server using the LIL OPC Server Icon that was placed on the desktop (located in the Procidia iWare PC folder) during the installation procedure.
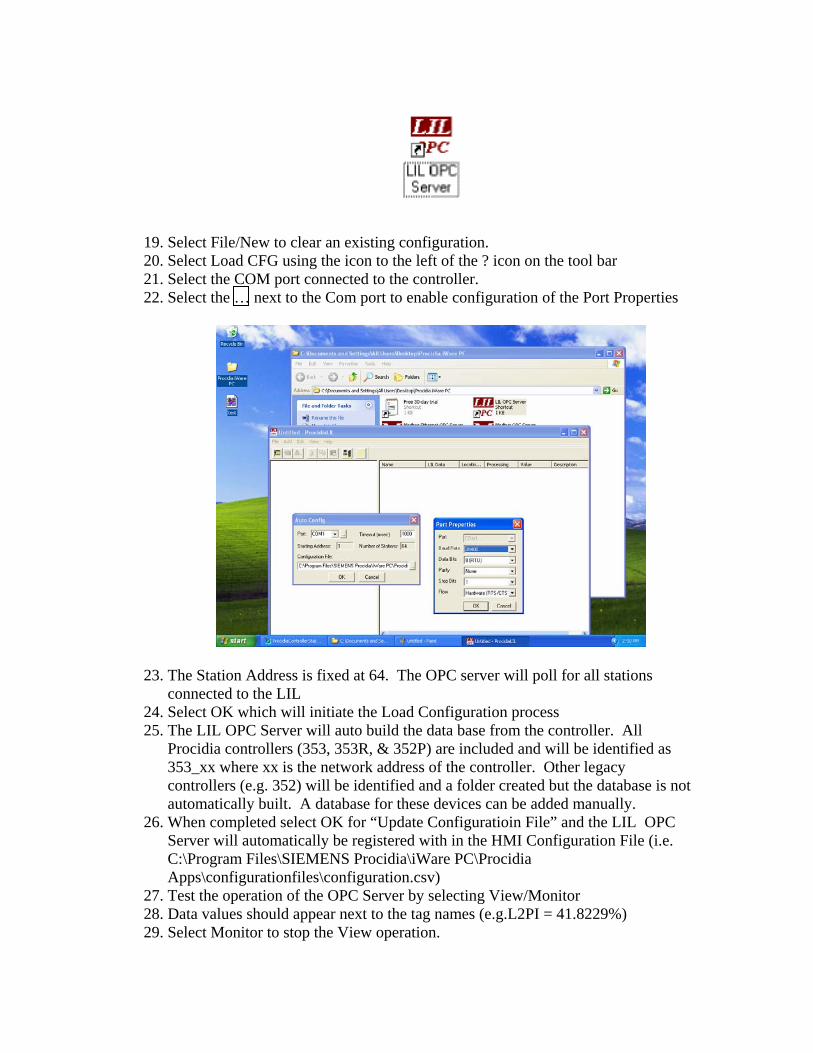
19. Select File/New to clear an existing configuration. 20. Select Load CFG using the icon to the left of the ? icon on the tool bar 21. Select the COM port connected to the controller. 22. Select the … next to the Com port to enable configuration of the Port Properties
23. The Station Address is fixed at 64. The OPC server will poll for all stations connected to the LIL
24. Select OK which will initiate the Load Configuration process 25. The LIL OPC Server will auto build the data base from the controller. All
Procidia controllers (353, 353R, & 352P) are included and will be identified as 353_xx where xx is the network address of the controller. Other legacy controllers (e.g. 352) will be identified and a folder created but the database is not automatically built. A database for these devices can be added manually.
26. When completed select OK for “Update Configuratioin File” and the LIL OPC Server will automatically be registered with in the HMI Configuration File (i.e. C:\Program Files\SIEMENS Procidia\iWare PC\Procidia Apps\configurationfiles\configuration.csv)
27. Test the operation of the OPC Server by selecting View/Monitor 28. Data values should appear next to the tag names (e.g.L2PI = 41.8229%) 29. Select Monitor to stop the View operation.
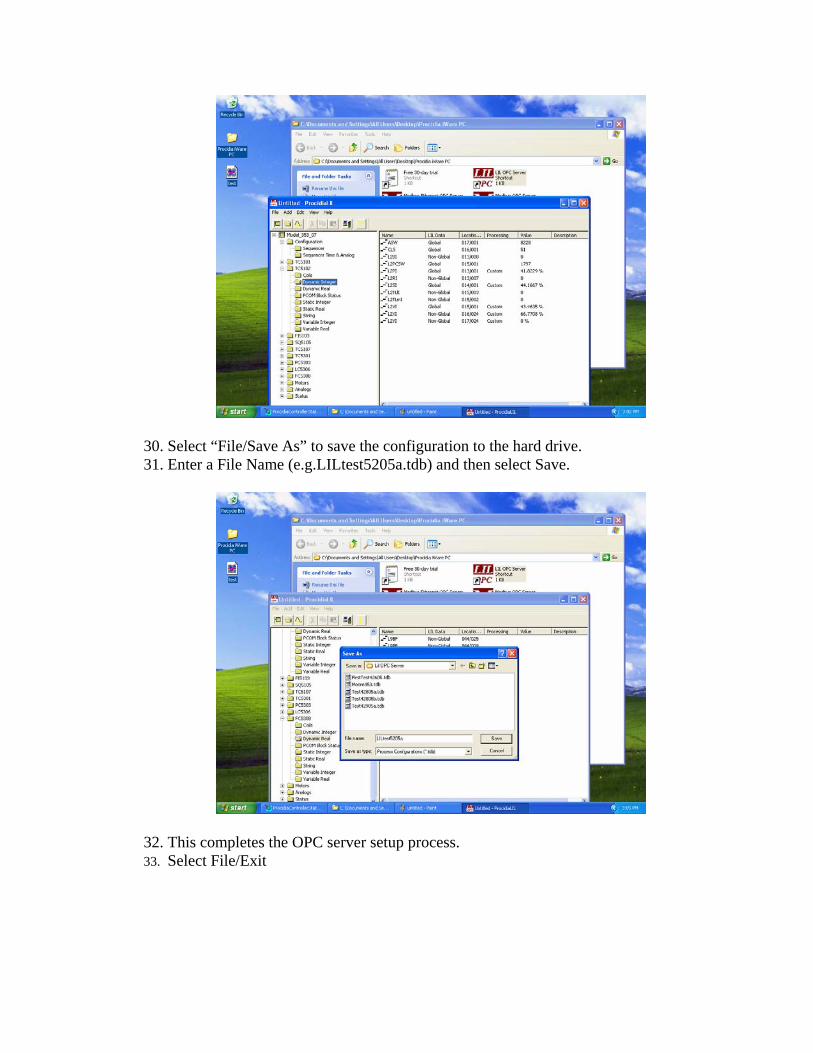
30. Select “File/Save As” to save the configuration to the hard drive. 31. Enter a File Name (e.g.LILtest5205a.tdb) and then select Save.
32. This completes the OPC server setup process. 33. Select File/Exit

Procidia i|Ware PC - Modbus Ethernet OPC Server
Introduction
A Modbus Ethernet OPC Server is included on the i|Ware PC™ software CD. The Modbus Ethernet Server gathers data from controller/s and provides (serves) data to HMI client/s running in i|Station or other Workstations running i|Ware PC. The Modbus Ethernet Server is also an alarm server for the 353 alarms. More details can be found in the Procidia iWare PC Alarm Viewer chapter. The OPC server will auto build a complete database when connected to a controller or controllers. This section describes the steps necessary to auto build the database for the first time.
Connecting i|Station/s to the Controller/s
Start the Modbus Ethernet OPC Server
1. Start the Procidia Modbus Ethernet OPC Server using the Modbus Ethernet OPC Server Icon that was placed on the desktop (located in the Procidia iWare PC folder) during the installation procedure.
2. Select File New and enter a file name for the database (e.g. NewTestENserver.mdb) and then select save.
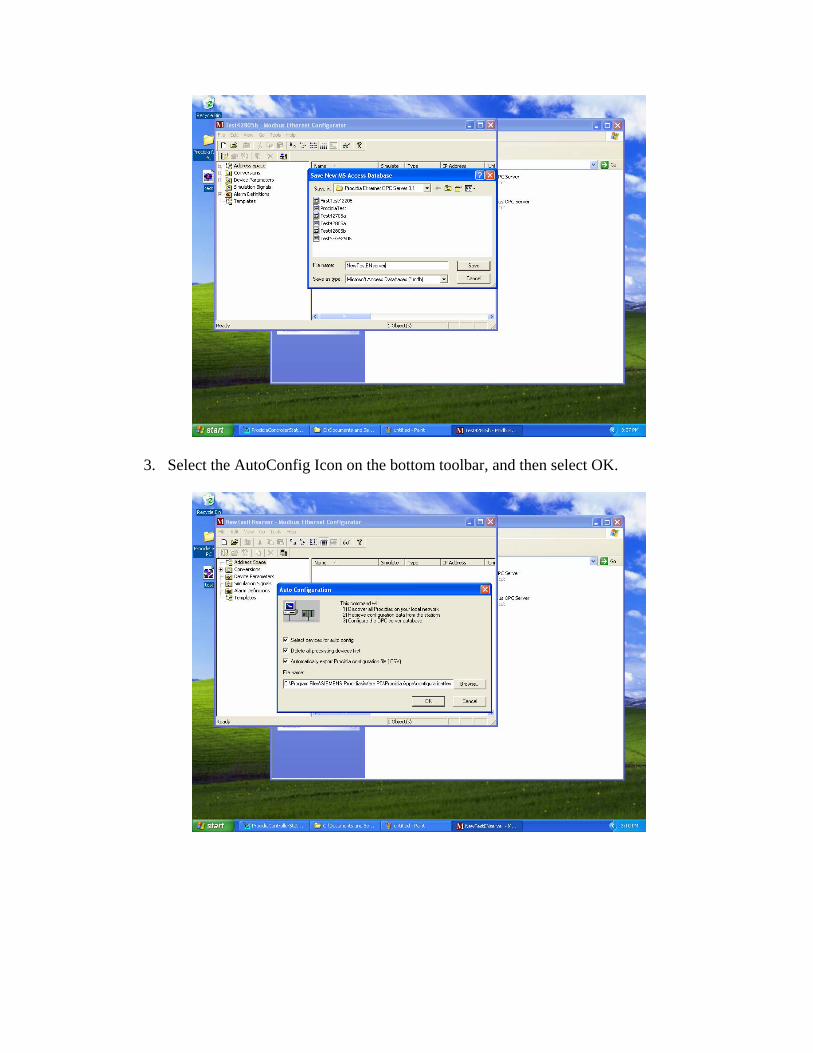
3. Select the AutoConfig Icon on the bottom toolbar, and then select OK.

4. Select Yes to select the new database as the active database
5. Using the check boxes, select from the list of discovered controllers on the Ethernet network those to be included in the OPC database. Select OK.
6. The Modbus Ethernet OPC Server will auto build the data base from the controller/s.
7. The Modbus Ethernet OPC Server will automatically be registered with in the HMI Configuration File (i.e. C:\Program Files\SIEMENS Procidia\iWare PC\Procidia Apps\configurationfiles\configuration.csv)
8. In some cases, when connecting to a large number of controllers, it is advisable to delete some of the folders that will not be used in order to reduce the overall size of the OPC database. Some folders that should be considered:
1. Sequencer Loop I/O Coils (contains Mask, Input states, Outputs states of the current Sequencer step)
2. Lonworks Discrete I/O (contains the Normal state, Mode, & Forced state of Lonworks remote Discrete I/O)
3. Configuration (includes folders for configuration parameters primarily used with Recipe Management)
1. Real Time Trips (used to modify on line configuration parameters for a select number of RTT blocks)
2. Sequencer (used to modify on line Sequencer Mask settings for all steps & groups - this is a big folder!)
3. Sequencer Time & Analog (used to modify on line Analog End Points & Time Period for all sequencer steps)
4. Timer Function Blocks (used to modify on line configurations of a select number of Timer Function Blocks)
9. Test the operation of the Server using the eyeglass Icon and then the data grouping to be viewed (e.g. Dynamic Real in the FC5308 loop for controller Reactor #5).

10. Data values should appear next to the tag names (e.g.Reactor #5.FC5308.Dynamic Real.L9VF = 66.66667)
11. Select the eyeglass Icon to stop the View operation. 12. This completes the Modbus Ethernet OPC server setup process. 13. Select File/Exit

Procidia i|Ware PC™ - GraphWorX32 Introduction
GraphWorX32 is a graphical HMI software program. The i|Ware PC Basic Edition includes the full GraphWorX32 software product and a complete autoconfiguring application. When the i|WarePC was installed, the following files were built and stored in the c:/Program Files/SIEMENS Procidia/iWare PC/Procidia Apps/ folder:
• ProcidiaStartup.gdf Procidia iWare PC Startup Screen • ProcidiaSystemStatus.gdf Procidia iWare PC System Status Screen • ProcidiaControllerStatus.gdf Procidia iWare PC Controller Status Screen • ProcidiaControllerOverview.gdf Procidia iWare PC Controller Loop
Overview Screen • ProcidiaControllerGroup.gdf Procidia iWare PC Controller Loop Group
Screen • ProcidiaLoopDetail.gdf Procidia iWare PC Controller Loop
Detail Screen • ProcidiaSequencerDetail.gdf Procidia iWare PC Sequencer Loop Detail
Screen • ProcidiaAnalogDetail.gdf Procidia iWare PC Analog Loop Detail
Screen • ProcidiaPopupBlank.gdf Procidia iWare PC Pop Up Blank Display • GraphicDisplay-1.gdf Procidia iWare PC Custom Graphic Screen
Template • ProcidiaAlarms.awv Procidia iWare PC Alarm Configuration • Free 30-day trial.txt Procidia iWare PC Free 30-day trial read me • Template.tdf Procidia Screen Template
Starting the Application
1. Start the Procidia iWare PC program using Procidia iWare PC Icon that was placed on the desktop (located in the Procidia iWare PC folder) during the installation procedure.

Procidia Banner
The banner appears on all application screens and provides certain system status information and drop down menu buttons that enable navigation to other screens within the application. The banner is part of a Procidia template that is used for creating all other screens.
Computer Date & Time
The date & time from the PC clock will appear in the upper right hand corner. The time and date can be changed using standard Windows procedures.
SYSTEM Button
The SYSTEM button, when selected, will open a drop down menu listing the tags of all OPC servers that have been configured as part of the system. Multiple servers located in various PCs located on the Ethernet network can be connected. More information on the System button features can be found in Procidia iWare PC SYSTEM Connections.html
CONTROLLER Button
The CONTROLLER button, when selected, will open a drop down menu listing the tags of all controllers connected to the selected OPC server. Selecting a tag in the drop down menu will open the Controller Status screen for that controller. When a system has more than (1) controller the NEXT button in the bottom right hand corner will be active to navigate to the next controller status screen. When the next screen is selected and there are more controllers the NEXT button will remain active. In addition, a PREVIOUS button in the bottom left corner will be active to return to the previous controller status screen.

OVERVIEWS Button
The OVERVIEWS button, when selected, will open a drop down menu listing the tags of all the controllers connected to the OPC server. Selecting a tag in the drop down menu will open the first overview screen for the controller with that tag. An overview screen provides up to (10) overview faceplates for loops in the controller. When a controller has more than (10) loops the NEXT button in the bottom right hand corner will be active to navigate to the next overview screen for that controller. When the next screen is selected and more that (20) loops are active in the controller the NEXT button will remain active. In addition, a PREVIOUS button in the bottom left corner will be active to return to the previous overview screen.
GROUPS Button
The GROUPS button, when selected, will open a drop down menu listing the tags of all the controllers connected to the OPC server. Selecting a tag in the drop down menu will open the first group screen for the controller having that tag. A group screen provides up to (4) faceplates for loops in the controller. If a controller has more than (4) loops the NEXT button in the bottom right hand corner will be active to navigate to the next group screen for that controller. When the next screen is selected and more that (8) loops are active in the controller the NEXT button will remain active. In addition, a PREVIOUS button in the bottom left corner will be active to return to the previous group screen.
GRAPHICS Button
The GRAPHICS button, when selected, will open a drop down menu listing the names of all the graphic files in the ProcidiaApps folder. Selecting a file name in the drop down menu will open the graphic screen with that name. The initial installation of iWare PC creates a graphic file (GraphicDisplay-1.gdf) that can be used as a template for creating a custom graphic screen. These screens include the Procidia banner. After this screen is customized to include desired graphics is should be saved as a new name. Any .gdf file in the ProcidiaApps folder that does not start with Procidia... will be listed in the drop down menu as a graphic file. Additional information can be found in the Graphic Screens section.

LOGIN Button
The LOGIN button, when selected, will open a dialog box for Security login when security is used.
BACK Button
The BACK button, when selected, returns to the previous screen
STATION ERROR Button
The Station Error button indicates an error condition in a one or more controllers connected to the OPC server. The button text will turn red when an error is present in a controller. Selecting the Station Error button will open the System Status screen.
SYSTEM EVENT Button
The System Event button will indicate alarm & event status of all controllers connected to the selected OPC server. When a controller connected to the OPC server has an active alarm or event that requires acknowledgement, the button text will flash from red to yellow. After all alarms are acknowledged but are still active the text will remain yellow. If no controller in the system has an active event or alarm but a previously active event still requires acknowledgement, the button text will flash from red to black. If there are no active events or alarms in any controllers connected to the server the button text will be black. Selecting the System Event button will open the System Status screen.
Un Buttons
These buttons are part of the banner template and can be used, if needed, during any custom configuration to navigate to a selected screen or other dynamic action. To change the function of a Un button in the template, open the template.tdf file in the ProcidiaApps folder using GraphWorX32. Open the Un button within configuration, change the wording of the button, and then link it to a dynamic action (e.g. loading a new screen, prefix the screen name in the ProcidiaApps folder with Procidia so that it does not show on the Graphics pull down menu). Save the template and a dialog box will open allowing you to update all the files that use the template.
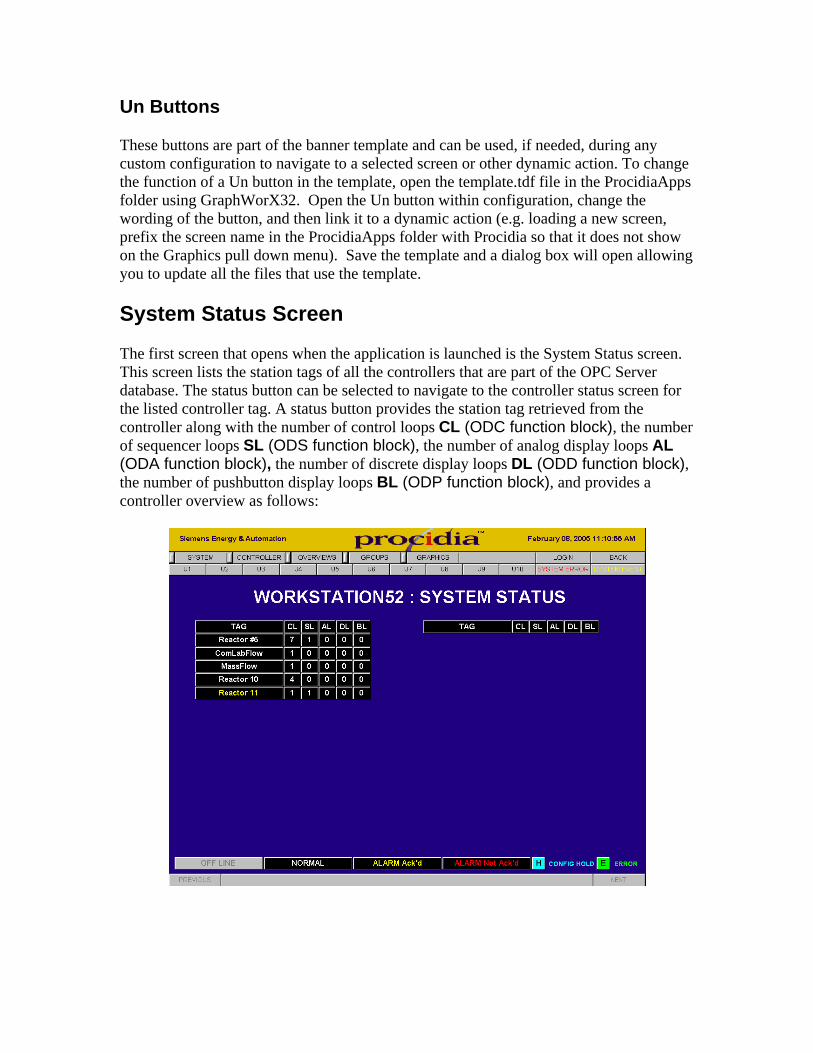
System Status Screen
The first screen that opens when the application is launched is the System Status screen. This screen lists the station tags of all the controllers that are part of the OPC Server database. The status button can be selected to navigate to the controller status screen for the listed controller tag. A status button provides the station tag retrieved from the controller along with the number of control loops CL (ODC function block), the number of sequencer loops SL (ODS function block), the number of analog display loops AL (ODA function block), the number of discrete display loops DL (ODD function block), the number of pushbutton display loops BL (ODP function block), and provides a controller overview as follows:
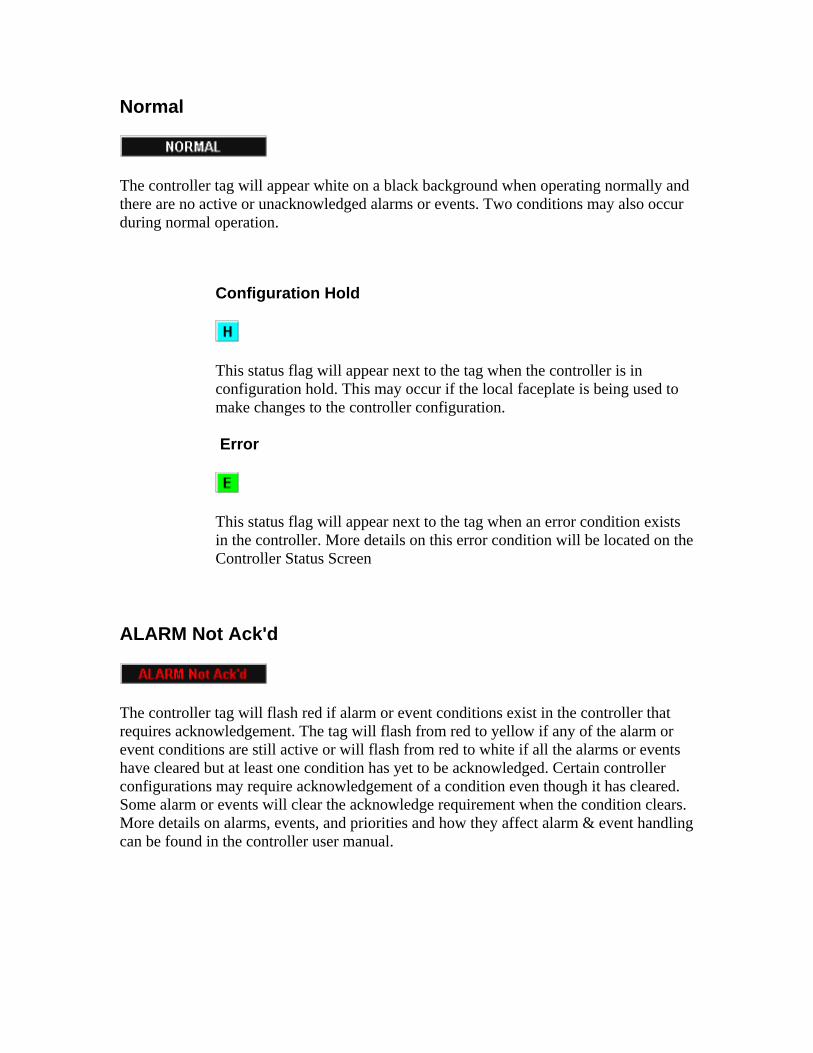
Normal
The controller tag will appear white on a black background when operating normally and there are no active or unacknowledged alarms or events. Two conditions may also occur during normal operation.
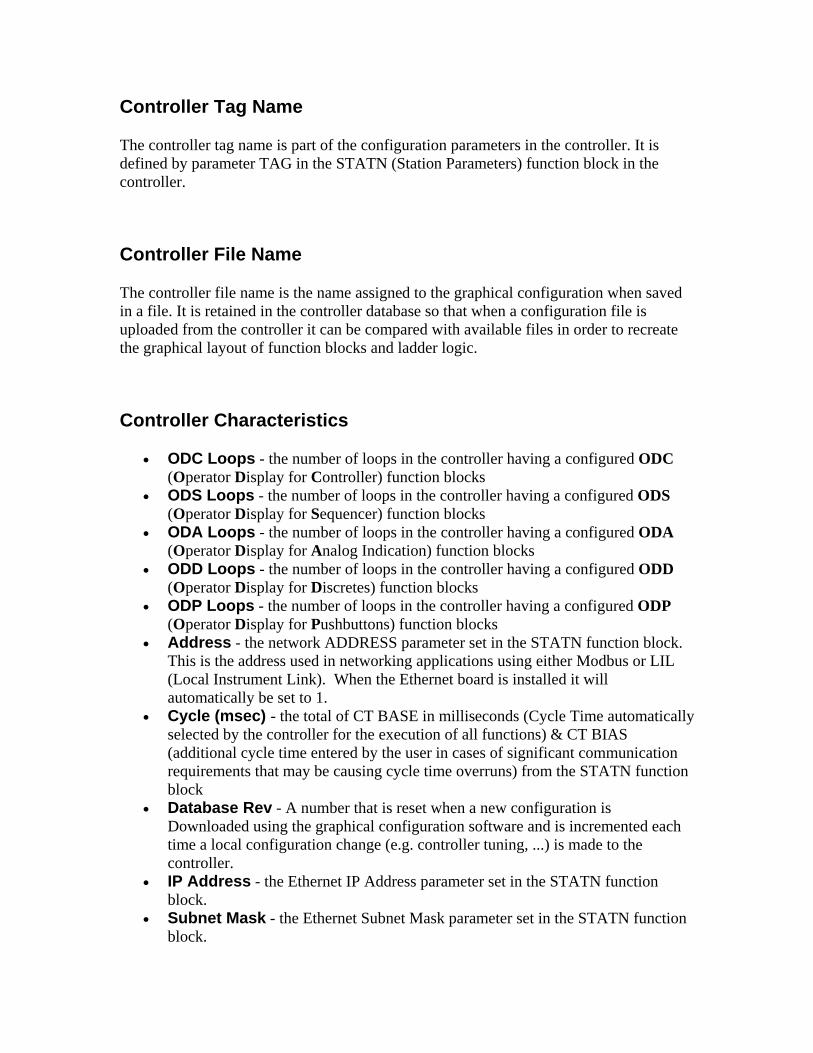
Configuration Hold
This status flag will appear next to the tag when the controller is in configuration hold. This may occur if the local faceplate is being used to make changes to the controller configuration.
Error
This status flag will appear next to the tag when an error condition exists in the controller. More details on this error condition will be located on the Controller Status Screen
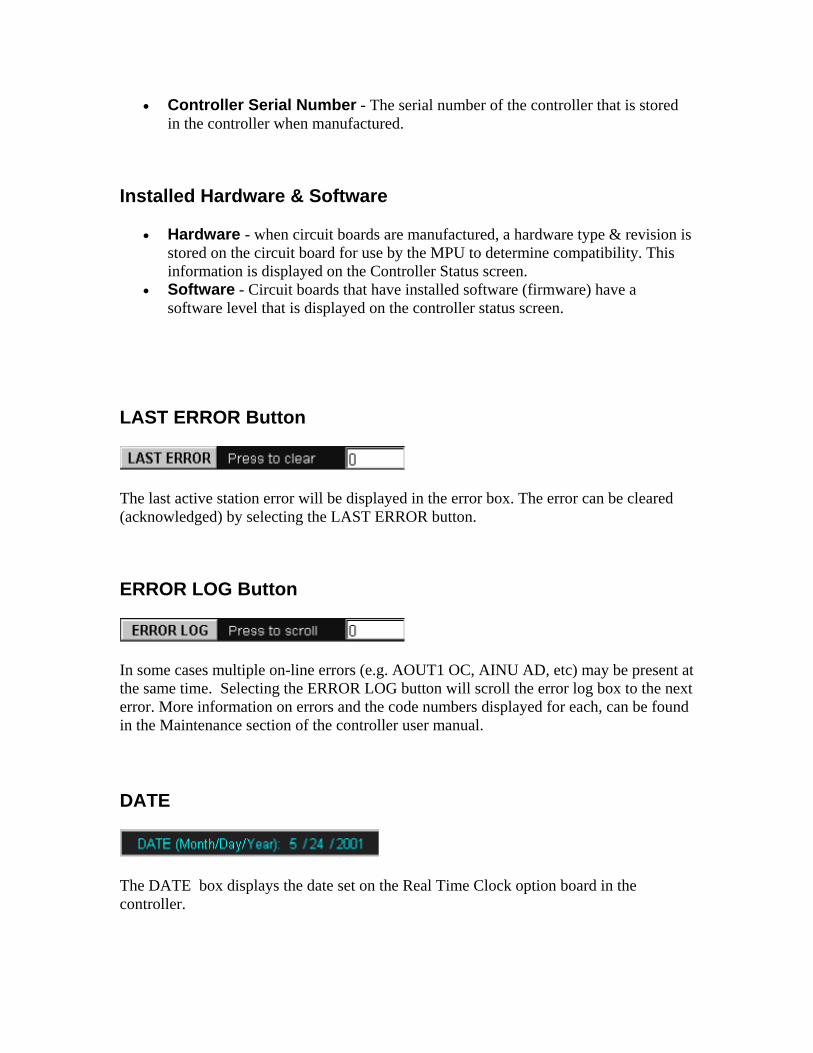
ALARM Not Ack'd
The controller tag will flash red if alarm or event conditions exist in the controller that requires acknowledgement. The tag will flash from red to yellow if any of the alarm or event conditions are still active or will flash from red to white if all the alarms or events have cleared but at least one condition has yet to be acknowledged. Certain controller configurations may require acknowledgement of a condition even though it has cleared. Some alarm or events will clear the acknowledge requirement when the condition clears. More details on alarms, events, and priorities and how they affect alarm & event handling can be found in the controller user manual.

ALARM Ack'd
The controller tag will appear steady yellow when all alarm or event conditions existing in the controller have been acknowledged but yet some may still be active.
OFF LINE
The controller tag will appear steady dark gray and the background in light gray when a station (controller) which is part of the OPC database is not communicating with the OPC server indicating that there has been a communication failure or the station is OFF LINE.
CONTROLLER Status Screens
Each controller connected to the system will have a Controller Status screen that provides the following details on the controller.
Controller Tag Name
The controller tag name is part of the configuration parameters in the controller. It is defined by parameter TAG in the STATN (Station Parameters) function block in the controller.
Controller File Name
The controller file name is the name assigned to the graphical configuration when saved in a file. It is retained in the controller database so that when a configuration file is uploaded from the controller it can be compared with available files in order to recreate the graphical layout of function blocks and ladder logic.
Controller Characteristics
• ODC Loops - the number of loops in the controller having a configured ODC (Operator Display for Controller) function blocks
• ODS Loops - the number of loops in the controller having a configured ODS (Operator Display for Sequencer) function blocks
• ODA Loops - the number of loops in the controller having a configured ODA (Operator Display for Analog Indication) function blocks
• ODD Loops - the number of loops in the controller having a configured ODD (Operator Display for Discretes) function blocks
• ODP Loops - the number of loops in the controller having a configured ODP (Operator Display for Pushbuttons) function blocks
• Address - the network ADDRESS parameter set in the STATN function block. This is the address used in networking applications using either Modbus or LIL (Local Instrument Link). When the Ethernet board is installed it will automatically be set to 1.
• Cycle (msec) - the total of CT BASE in milliseconds (Cycle Time automatically selected by the controller for the execution of all functions) & CT BIAS (additional cycle time entered by the user in cases of significant communication requirements that may be causing cycle time overruns) from the STATN function block
• Database Rev - A number that is reset when a new configuration is Downloaded using the graphical configuration software and is incremented each time a local configuration change (e.g. controller tuning, ...) is made to the controller.
• IP Address - the Ethernet IP Address parameter set in the STATN function block.
• Subnet Mask - the Ethernet Subnet Mask parameter set in the STATN function block.
• Controller Serial Number - The serial number of the controller that is stored in the controller when manufactured.
Installed Hardware & Software
• Hardware - when circuit boards are manufactured, a hardware type & revision is stored on the circuit board for use by the MPU to determine compatibility. This information is displayed on the Controller Status screen.
• Software - Circuit boards that have installed software (firmware) have a software level that is displayed on the controller status screen.
LAST ERROR Button
The last active station error will be displayed in the error box. The error can be cleared (acknowledged) by selecting the LAST ERROR button.
ERROR LOG Button
In some cases multiple on-line errors (e.g. AOUT1 OC, AINU AD, etc) may be present at the same time. Selecting the ERROR LOG button will scroll the error log box to the next error. More information on errors and the code numbers displayed for each, can be found in the Maintenance section of the controller user manual.
DATE
The DATE box displays the date set on the Real Time Clock option board in the controller.
TIME
The TIME box displays the time set on the Real Time Clock option board in the controller.
SET Button
The SET button opens a check box that enables the selection of which screen will be opened when the Loop button is selected.
RUN Button
If for any reason the station is in the Configuration HOLD mode, the RUN button can be used to return the controller to normal operation (i.e. RUN mode).
OOS Button (V2.0)
The OOS button (Alarms Out Of Service) can be used to mark all controller (station) alarms as Out Of Service. When alarms are marked out of service they will function normally and the OOS bit in the alarm status word will identify to HMI displays that alarms have been flagged as OOS. This feature is normally used when someone is working with the controller and wishes to identify this situation to others that may be monitoring the alarms within the system. The OOS text will change color when the Out of Service condition exists. The controller OOS button is available in controller firmware V2.0 & higher.
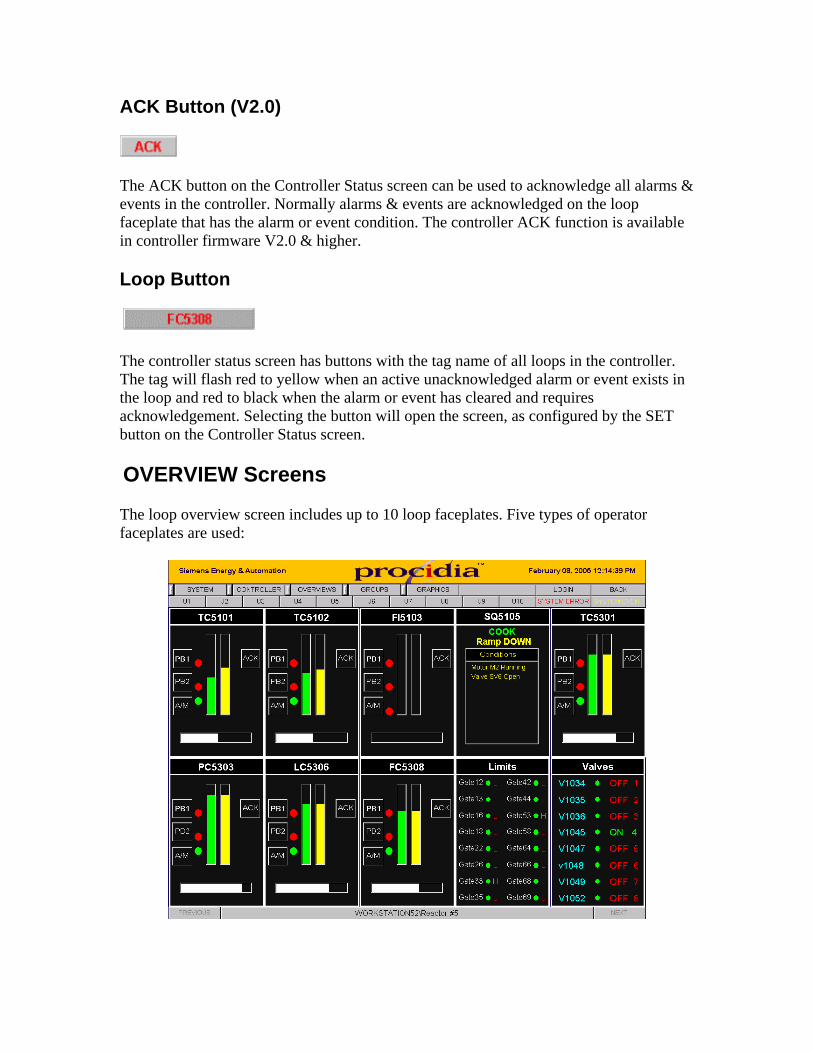
ACK Button (V2.0)
The ACK button on the Controller Status screen can be used to acknowledge all alarms & events in the controller. Normally alarms & events are acknowledged on the loop faceplate that has the alarm or event condition. The controller ACK function is available in controller firmware V2.0 & higher.
Loop Button
The controller status screen has buttons with the tag name of all loops in the controller. The tag will flash red to yellow when an active unacknowledged alarm or event exists in the loop and red to black when the alarm or event has cleared and requires acknowledgement. Selecting the button will open the screen, as configured by the SET button on the Controller Status screen.
OVERVIEW Screens
The loop overview screen includes up to 10 loop faceplates. Five types of operator faceplates are used:
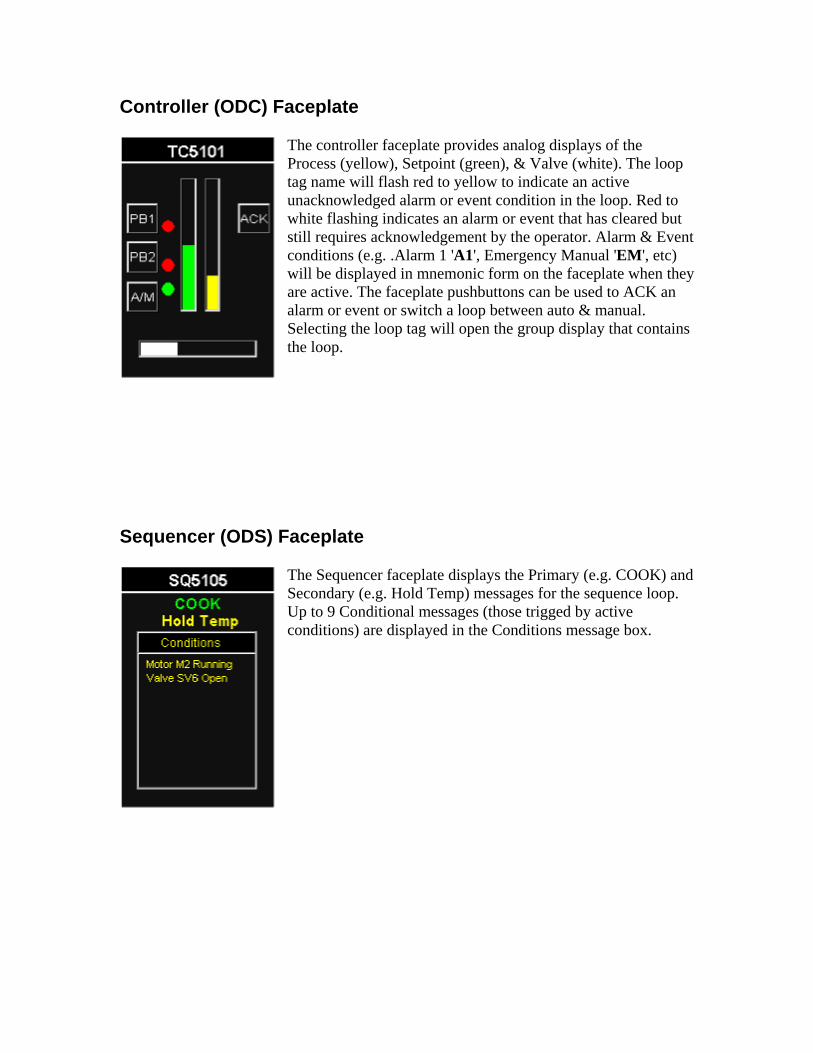
Controller (ODC) Faceplate
The controller faceplate provides analog displays of the Process (yellow), Setpoint (green), & Valve (white). The loop tag name will flash red to yellow to indicate an active unacknowledged alarm or event condition in the loop. Red white flashing indicates an alarm or event that has cleared bustill requires acknowledgement by the operator. Alarm & Evenconditions (e.g. .Alarm 1 'A1', Emergency Manual 'EM', ewill be displayed in mnemonic form on the faceplate when thare active. The faceplate pushbuttons can be used to ACK an alarm or event or switch a loop between auto & manual. Selecting the loop tag will open the group display that contai
to t
t tc)
ey
ns the loop.
Sequencer (ODS) Faceplate
d loop.
conditions) are displayed in the Conditions message box.
The Sequencer faceplate displays the Primary (e.g. COOK) anSecondary (e.g. Hold Temp) messages for the sequenceUp to 9 Conditional messages (those trigged by active

Analog Display (ODA) Faceplate
The Analog faceplate displays the four analog variables in bargraph form and are identified by the tag name of each variable as configured in the controller. The faceplate tag (e.g. Aux Ind) will flash red to yellow to indicate an active unacknowledged alarm or event condition in the loop. Red to white flashing indicates an alarm or event that has cleared but still requires acknowledgement by the operator
Discrete Display (ODD) Faceplate
The Discrete faceplate displays the sixteen discrete variables using a L for Low (0) or H for High (1). The Tag name of each point (e.g. SV-1) as configured in the controller is displayed. The auto/man status of each point is displayed using a green/red indicator. The tag name of the loop (e.g. Outputs) is displayed at the top of the faceplate.

Pushbutton (ODP) Faceplate
The Pushbutton faceplate displays the status of the eight pushbuttons. The ASCII tag for the feedback status (e.g. STOP), the status of the auto.man switch (green for auto and red for manual) are all displayed. The tag of each (e.g. M 101) as configured in the controller is also displayed. The loop tag (e.g. Motors) is displayed at the top of the faceplate
GROUP Screens
The loop group screen includes up to four loop faceplates. The center bar at the bottom of the screen displays the controller tag. When a controller has more than 4 loops, the Previous or Next button will be active to move to the next Group display. Five types of faceplates are provided based on the loop configuration.

Controller Faceplate
Full operation of the control loop can be achieved from the group faceplate. The loop tag will flash to indicate an alarm or event condition. The digital values of the Process, Setpoint, & Valve are displayed in engineering units. The Units of these variables are also displayed.
The analog values of the Process, Setpoint, & Valve are displayed along with the Max. Range & Min. Range in engineering units displayed at the top & bottom of the Process & Setpoint bars. The engineering range of the controller output is displayed along the top of the valve bar.
Alarm settings are displayed in analog form next to the Process bar. HI alarms are displayed as a bar projecting from the top down. LO alarms are displayed as a bar projecting from the bottom up. OR (Out of Range) alarms are displayed as a horizontal bar at the top & bottom. A deviation alarm is displayed as a vertical bar that is displaced by an amount equal to the trip point away from the Setpoint. A HI DEV alarm will be a bar extending upward, a LO DEV alarm will be a bar extending downward, and an ABS DEV will be two bars extending up & down.
of the setpoint bar will indicate the target value.
Setpoint Limits are indicated by a small green horizontal bar to the left of the Setpoint bar. When the control loop has a ramping setpoint that is actively
ramping, a green arrow to the left
The alarm window at the right will indicate the state of the 4 loop alarms. When a numbered background is red, that alarm is active. If the background is light blue that alarm is disabled and when black is enabled but not active. The OOS button can be used to mark the loop alarms as Out Of Service and will be displayed in light blue when alarms have been marked as Out Of Service.
The ACK is used to acknowledged alarm conditions. The D button will display a fourth digital variable (i.e. X variable, Y variable, T total) when configured in the loop. If more than one has been configured subsequent button presses will advance through the variable displays.

Sequencer Faceplate
Full operation of the sequencer loop can be achieved from the group faceplate. The loop tag will flash to indicate an alarm or event condition. The loop tag for a sequencer is actually the recipe message in controller firmware version 1.31 & lower. In most applications set the number of recipe messages in the ODS block to 1, and enter the loop tag as the recipe message. Firmware version 2.2 & higher includes a loop tag parameter for the ODS loop. Multiple recipe messages can be used when multiple local recipes are being used. See the sequencer detail screen description for more information on recipes. The Primary Message (e.g. CHARGE) and Secondary Message (e.g. Ingredient B) will be displayed at the top of the faceplate. Up to 9 Conditional messages (those trigged by active conditions) are displayed in the Conditions message box
The alarm window at the top left will indicate the state of the 4 loop alarms. When a numbered background is red, that alarm is active. If the background is light blue that alarm is disabled and when black is enabled but not active. The OOS button can be used to mark the loop alarms as Out Of Service.
The ACK is used to acknowledged alarm conditions. Pushbuttons PB1, PB2, & PB3 can be used for various functions. Pressing a button on the HMI faceplate will result as pressing the local faceplate of the controller.
Certain sequencer status such as StepNumber, Step Time, Remaining Time (of the step), Analog Output of the Sequencer, No. of Recipes (stored in the controller) and Current Recipe (stored in the controller being executed). Up to 9 recipes can be stored in the controller and selected from the local faceplate or the HMI detail screen. In addition the HMI can store multiple recipe files which can be loaded into the controller from the sequencer detail screen.
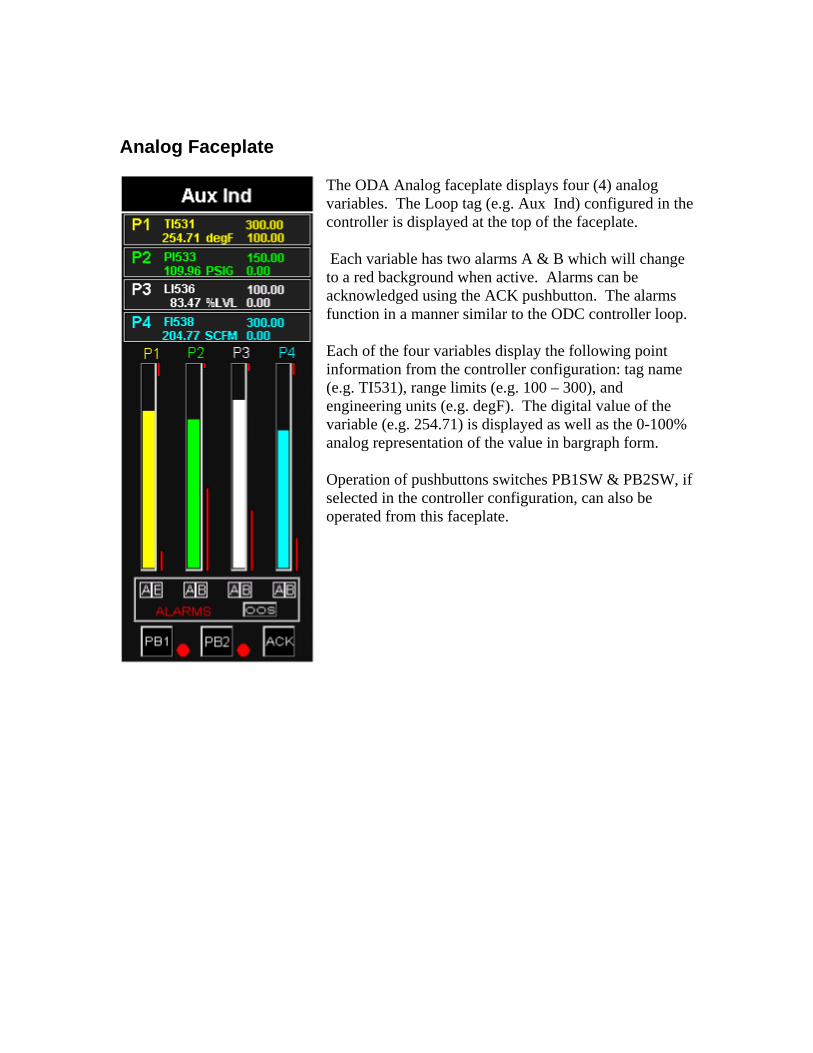
Analog Faceplate
The ODA Analog faceplate displays four (4) analog variables. The Loop tag (e.g. Aux Ind) configured in the controller is displayed at the top of the faceplate.
Each variable has two alarms A & B which will change to a red background when active. Alarms can be acknowledged using the ACK pushbutton. The alarms function in a manner similar to the ODC controller loop.
Each of the four variables display the following point information from the controller configuration: tag name (e.g. TI531), range limits (e.g. 100 – 300), and engineering units (e.g. degF). The digital value of the variable (e.g. 254.71) is displayed as well as the 0-100% analog representation of the value in bargraph form.
Operation of pushbuttons switches PB1SW & PB2SW, if selected in the controller configuration, can also be operated from this faceplate.

Discrete Faceplate
The ODD Discrete faceplate displays sixteen (16) discrete points. The Loop tag (e.g. Outputs) configured in the controller is displayed at the top of the faceplate.
Full operation of all sixteen points in the discrete loop can be achieved from the group faceplate. The tag name of each point (e.g. SV 1) as configured in the controller is displayed. The input (IN) and output (OUT) condition of each point is displayed as ON (1, HI, TRUE). When the point MODE is in A (auto) the output will equal the input. The mode of the poinbe changed by selecting the button and confirming the change. When in M (manual) the value of the output can be changed by selecting the output button to togglethe state and then confir
t can
ming the change.
Operation of pushbuttons switches PB1SW & PB2SW, if selected in the controller configuration, can also be operated from this faceplate.
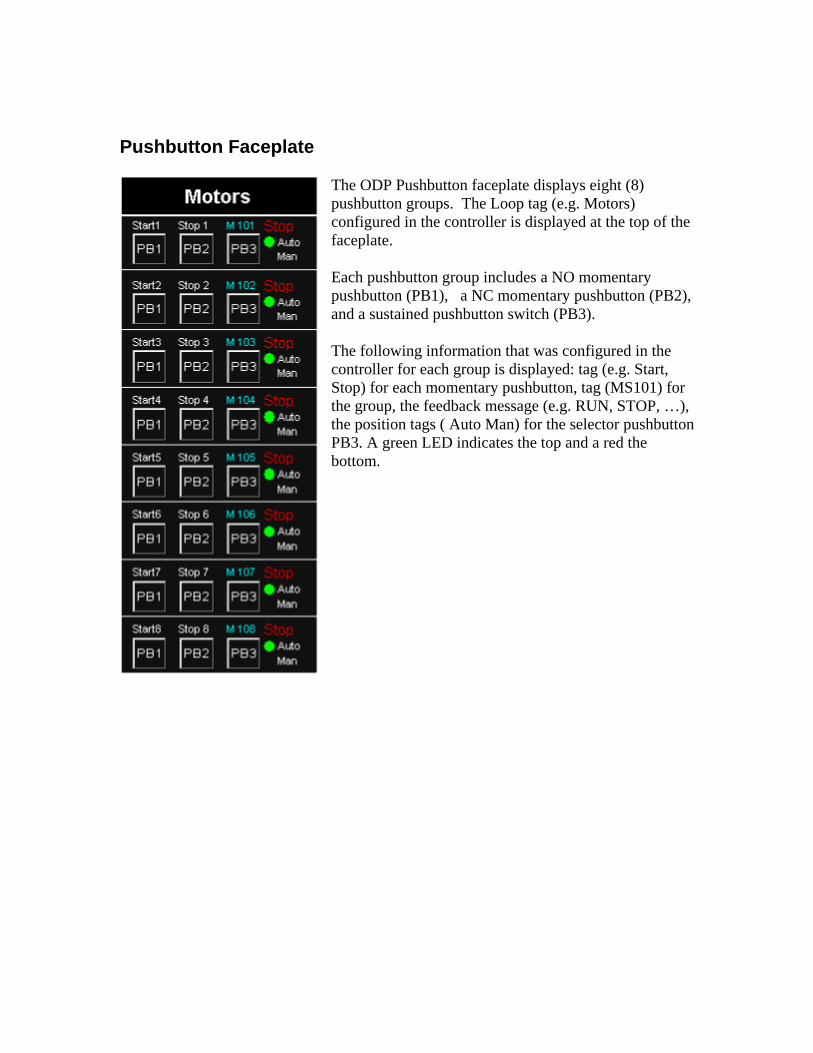
Pushbutton Faceplate
The ODP Pushbutton faceplate displays eight (8) pushbutton groups. The Loop tag (e.g. Motors) configured in the controller is displayed at the top of the faceplate.
Each pushbutton group includes a NO momentary pushbutton (PB1), a NC momentary pushbutton (PB2), and a sustained pushbutton switch (PB3).
The following information that was configured in the controller for each group is displayed: tag (e.g. Start, Stop) for each momentary pushbutton, tag (MS101) for the group, the feedback message (e.g. RUN, STOP, …), the position tags ( Auto Man) for the selector pushbutton PB3. A green LED indicates the top and a red the bottom.

Controller Detail Screen
The controller detail screen provides an operator faceplate, identical in function to that described on the group display. Two additional software modules, not part of the GraphWorX32 module, are used on the controller detail screen. The Trend Viewer module and the Persistent Trending module. When the screen is first displayed, the Trend Viewer displays the historical trend data from the ATD (Analog Trend Display) function blocks in the loop and then updates the display using the persistent trending feature. Use of the ATD function blocks for historical trending is available when using the Modbus and Ethernet OPC Servers.

SETPOINT
The SETPOINT box on the detail screen enables setting the following controller parameters:
o High setpoint Limit: Can be entered between -10% to 110% of the engineering range shown on the loop faceplate.
o Low setpoint Limit: Can be entered between -10% to 110% of the engineering range shown on the loop faceplate.
o Target setpoint. Can be entered between -10% to 110% of the engineering range shown on the loop faceplate
o Ramp Time: Can be entered between 0 to 3840 minutes. o Ramp Rate: Can be entered between 0 to 110 %/minute. o RAMP button: Can be selected to Start & Stop setpoint ramping.
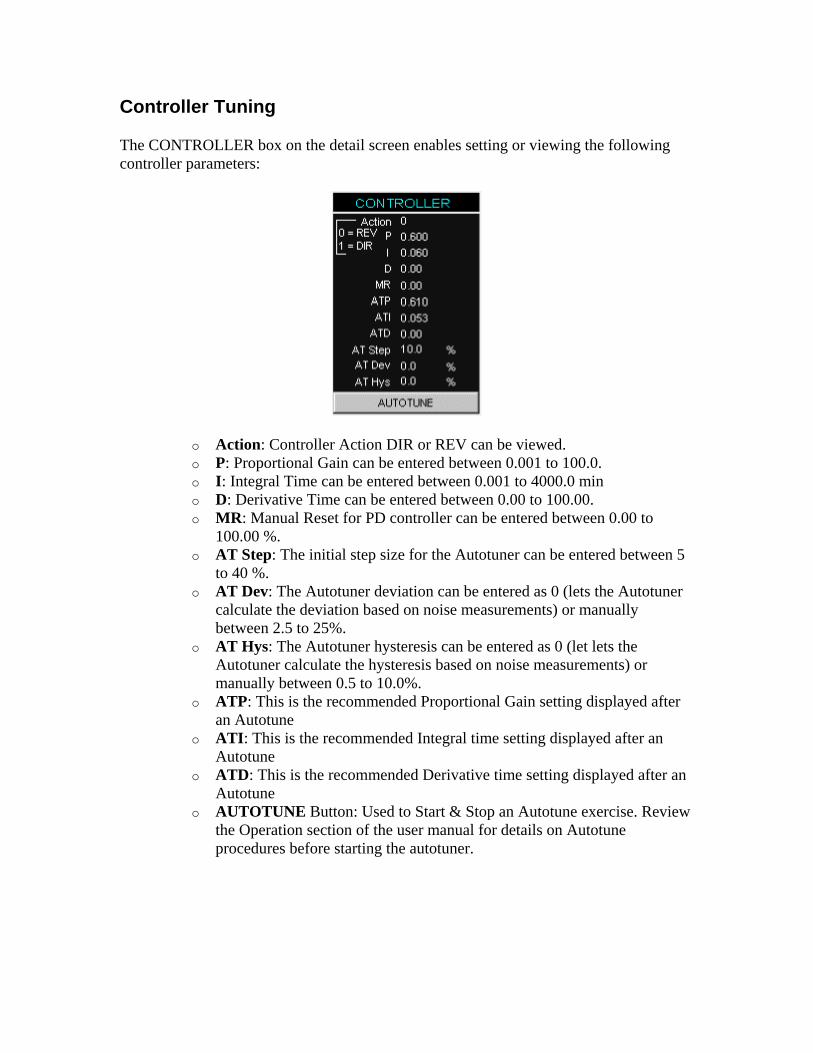
Controller Tuning
The CONTROLLER box on the detail screen enables setting or viewing the following controller parameters:
o Action: Controller Action DIR or REV can be viewed. o P: Proportional Gain can be entered between 0.001 to 100.0. o I: Integral Time can be entered between 0.001 to 4000.0 min o D: Derivative Time can be entered between 0.00 to 100.00. o MR: Manual Reset for PD controller can be entered between 0.00 to
100.00 %. o AT Step: The initial step size for the Autotuner can be entered between 5
to 40 %. o AT Dev: The Autotuner deviation can be entered as 0 (lets the Autotuner
calculate the deviation based on noise measurements) or manually between 2.5 to 25%.
o AT Hys: The Autotuner hysteresis can be entered as 0 (let lets the Autotuner calculate the hysteresis based on noise measurements) or manually between 0.5 to 10.0%.
o ATP: This is the recommended Proportional Gain setting displayed after an Autotune
o ATI: This is the recommended Integral time setting displayed after an Autotune
o ATD: This is the recommended Derivative time setting displayed after an Autotune
o AUTOTUNE Button: Used to Start & Stop an Autotune exercise. Review the Operation section of the user manual for details on Autotune procedures before starting the autotuner.

ALARMS
The ALARMS box on the detail screen enables setting the following alarm parameters:
o Limit: Each alarm (A1 - A4) limit can be entered between -10% to 110 % of the engineering range shown on the loop faceplate.
o Type: Each alarm (A1 - A4) type can be entered between 0 to 6. o EN: Each alarm (A1 - A4) can be enabled or disabled by entering a 1 or 0.
When an alarm is disabled, the alarm does not function

QUICK SET
The QUICK SET box on the detail screen enables setting the following parameters:
o Quickset Hold 1(QHD1) function block: The hold value of the block can be entered between -10% to 110% of the range. The range is displayed as Min. Range & Max. Range. The name of the QHD1 block which is entered during the controller configuration is also displayed (e.g. Bleed).
o Quickset Hold 2(QHD2) function block: The hold value of the block can be entered between -10% to 110% of the range. The range is displayed as Min. Range & Max. Range. The name of the QHD2 block which is entered during the controller configuration is also displayed (e.g. Temp Set).
o RATIO: This parameter is part of the RATIO function block and can be entered between the Low & High Ratio Limit settings which are defaulted as 1.00 & 30.00.
o BIAS: This parameter is part of the BIAS block and can be entered between the Low & High Bias Limit settings which are defaulted as -150.0% & +150.0%.
o Tot Preset 1: The totalizer preset 1 setting of the BTOT function block can be entered between 0 to 999999.
o Tot Preset 2: The totalizer preset 2 setting of the BTOT function block can be entered between 0 to 999999.
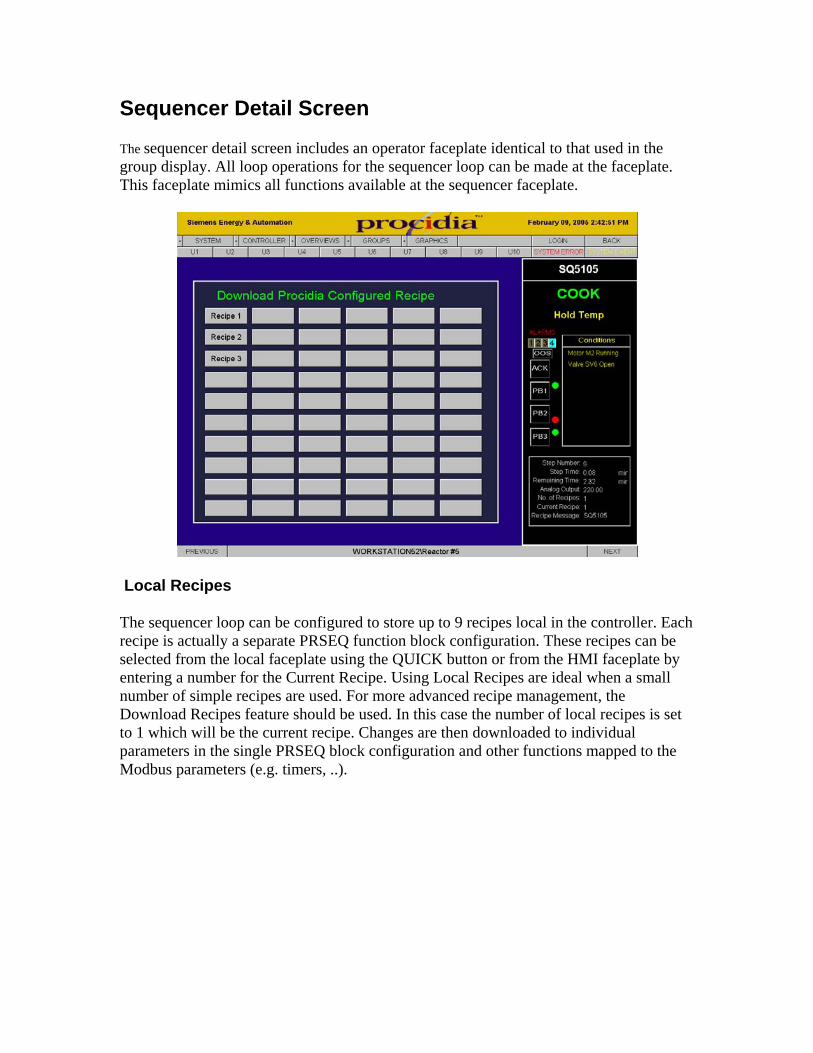
Sequencer Detail Screen
The sequencer detail screen includes an operator faceplate identical to that used in the group display. All loop operations for the sequencer loop can be made at the faceplate. This faceplate mimics all functions available at the sequencer faceplate.
Local Recipes
The sequencer loop can be configured to store up to 9 recipes local in the controller. Each recipe is actually a separate PRSEQ function block configuration. These recipes can be selected from the local faceplate using the QUICK button or from the HMI faceplate by entering a number for the Current Recipe. Using Local Recipes are ideal when a small number of simple recipes are used. For more advanced recipe management, the Download Recipes feature should be used. In this case the number of local recipes is set to 1 which will be the current recipe. Changes are then downloaded to individual parameters in the single PRSEQ block configuration and other functions mapped to the Modbus parameters (e.g. timers, ..).
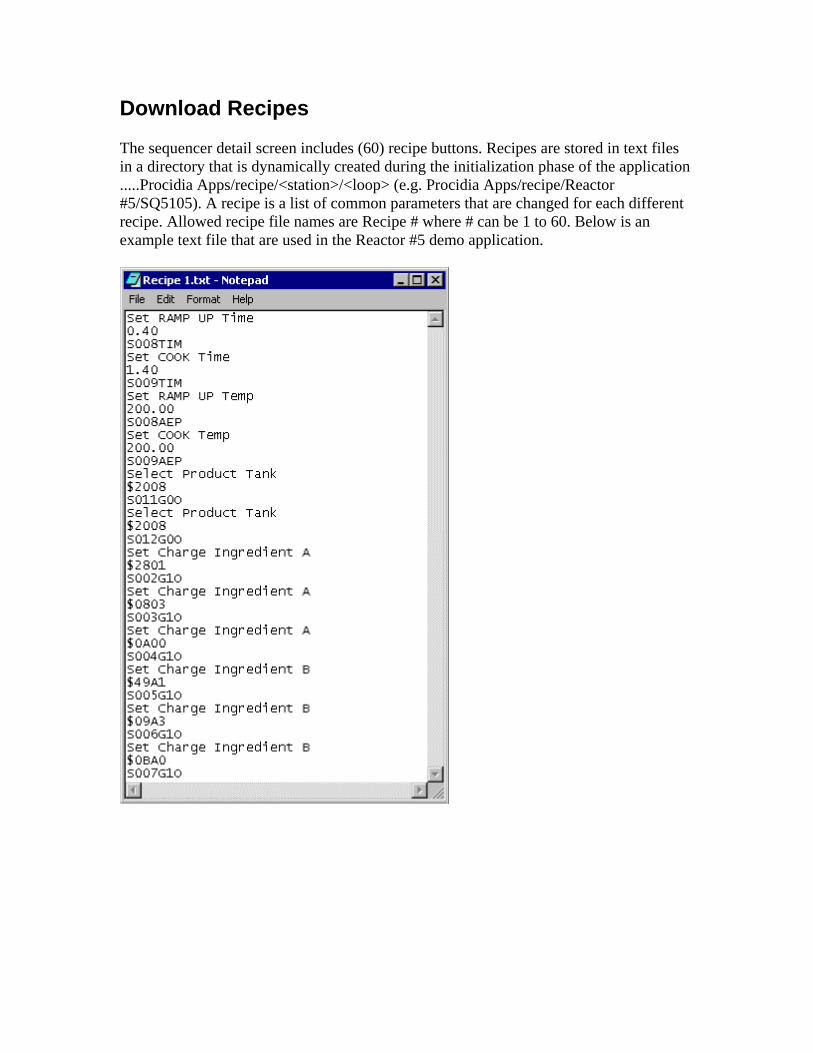
Download Recipes
The sequencer detail screen includes (60) recipe buttons. Recipes are stored in text files in a directory that is dynamically created during the initialization phase of the application .....Procidia Apps/recipe/<station>/<loop> (e.g. Procidia Apps/recipe/Reactor #5/SQ5105). A recipe is a list of common parameters that are changed for each different recipe. Allowed recipe file names are Recipe # where # can be 1 to 60. Below is an example text file that are used in the Reactor #5 demo application.

Names are displayed on the recipe buttons. Each recipe change consists of three lines in the file text file. The first line is the Objective (e.g. Select Product Tank), the second is the value (e.g. $2801). Sequencer masks are normally displayed in Hex notation (i.e. $xxxx). The third line is the OPC server parameter name (e.g. S012G0O). Configuration parameters that can be changed by downloading Write commands are documented in the controller User Manual under “Configuration Data Sequencer Loop”. Selecting a recipe button will open the dialog box shown. The dialog box displays the information from the recipe text file as illustrated below. Select the Download Recipe button to download the settings to the controller. The Verify Recipe button will read back all the parameters from the controller and display them in the Verify Value column. Values that do not match will be displayed in red.
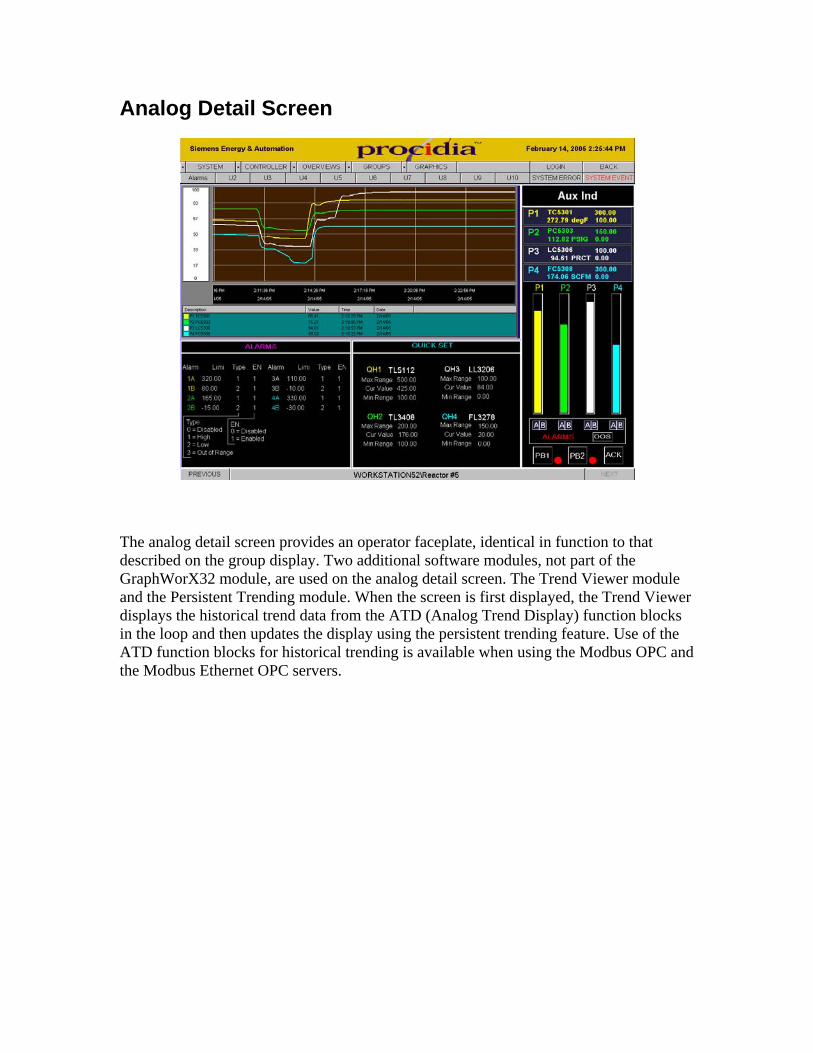
Analog Detail Screen
The analog detail screen provides an operator faceplate, identical in function to that described on the group display. Two additional software modules, not part of the GraphWorX32 module, are used on the analog detail screen. The Trend Viewer module and the Persistent Trending module. When the screen is first displayed, the Trend Viewer displays the historical trend data from the ATD (Analog Trend Display) function blocks in the loop and then updates the display using the persistent trending feature. Use of the ATD function blocks for historical trending is available when using the Modbus OPC and the Modbus Ethernet OPC servers.
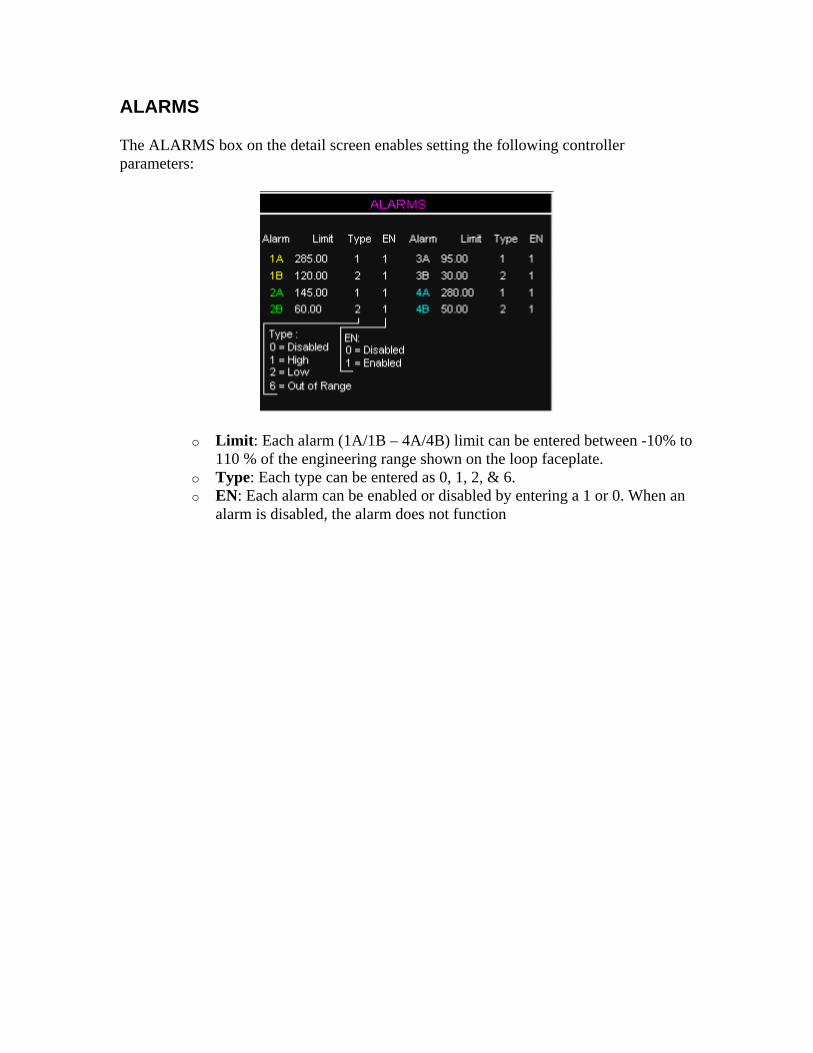
ALARMS
The ALARMS box on the detail screen enables setting the following controller parameters:
o Limit: Each alarm (1A/1B – 4A/4B) limit can be entered between -10% to 110 % of the engineering range shown on the loop faceplate.
o Type: Each type can be entered as 0, 1, 2, & 6. o EN: Each alarm can be enabled or disabled by entering a 1 or 0. When an
alarm is disabled, the alarm does not function
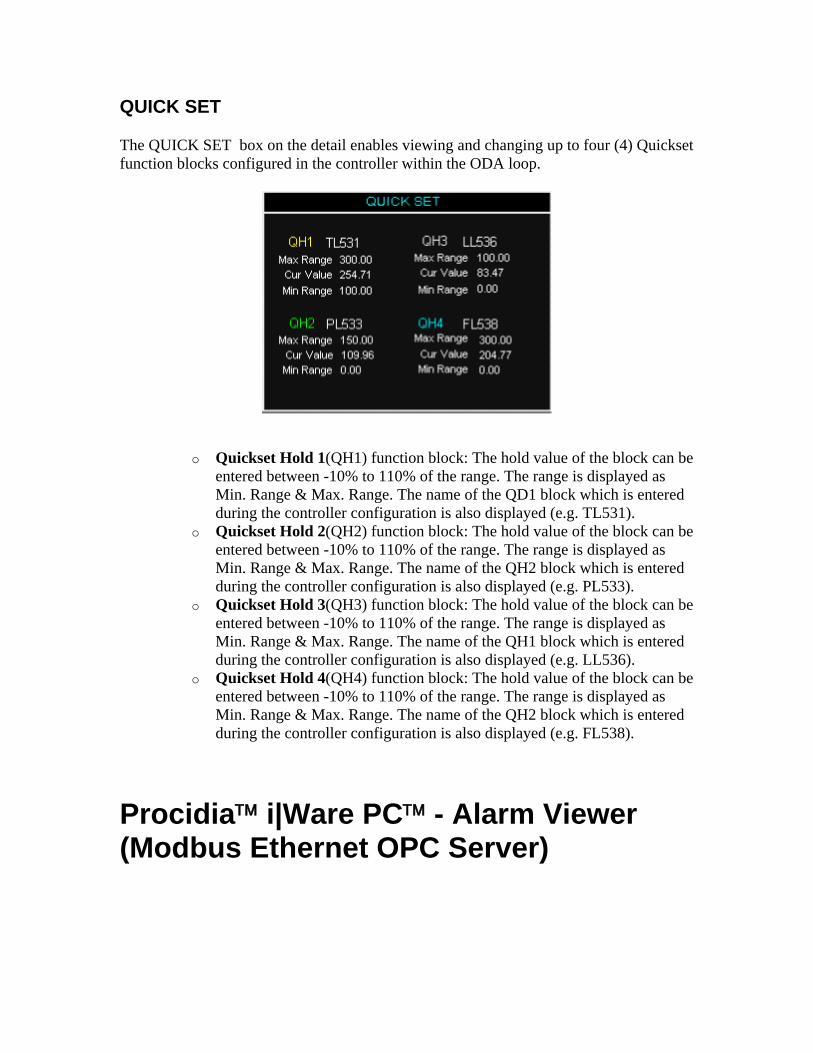
QUICK SET
The QUICK SET box on the detail enables viewing and changing up to four (4) Quickset function blocks configured in the controller within the ODA loop.
o Quickset Hold 1(QH1) function block: The hold value of the block can be entered between -10% to 110% of the range. The range is displayed as Min. Range & Max. Range. The name of the QD1 block which is entered during the controller configuration is also displayed (e.g. TL531).
o Quickset Hold 2(QH2) function block: The hold value of the block can be entered between -10% to 110% of the range. The range is displayed as Min. Range & Max. Range. The name of the QH2 block which is entered during the controller configuration is also displayed (e.g. PL533).
o Quickset Hold 3(QH3) function block: The hold value of the block can be entered between -10% to 110% of the range. The range is displayed as Min. Range & Max. Range. The name of the QH1 block which is entered during the controller configuration is also displayed (e.g. LL536).
o Quickset Hold 4(QH4) function block: The hold value of the block can be entered between -10% to 110% of the range. The range is displayed as Min. Range & Max. Range. The name of the QH2 block which is entered during the controller configuration is also displayed (e.g. FL538).
Procidia™ i|Ware PC™ - Alarm Viewer (Modbus Ethernet OPC Server)

This chapter provides information about using the Alarm Viewer with the Modbus Ethernet OPC Server. For other uses of the Alarm Viewer and the Alarm Server consult the help files in the documentation section:
Introduction
The Modbus Ethernet OPC Server is an Alarm & Event server as well as a Data server. As such, all alarm points in ODC (Control) and ODA (Analog Display) loops have been automatically configured as part of the OPC alarm database. If an Alarm Viewer is used in the HMI and connected to an this OPC server (it can be connected to multiple Modbus Ethernet OPC Servers on an Ethernet network) alarms will be posted in the viewer as they occur. Alarms can be acknowledged from the viewer or they can be acknowledged from a faceplate in the HMI or a local faceplate on the controller. In either case the viewer or the faceplate will identify them as acknowledged alarms. A file “ProcidaAlarms.awv” has been placed in the ProcidiaApps folder for use by the alarm viewer. This file will format the alarm display in the standard scheme used throughout i|Ware and will subscribe to the Modbus Ethernet Server on the local machine. Additional information on alarms in the 353 controllers can be found in the user manuals for the controller. Application documents which can be found on the Siemens web site http://www.sea.siemens.com/ia/product/incontrol.html , will provide additional information on alarms when using the Modbus & LIL OPC servers.
Alarm Viewer
1. Open a blank screen (e.g. CustomDisplay-1.gdf). 2. From the Edit menu select Insert New Object. 3. Select the AlarmWorX32 Viewer.
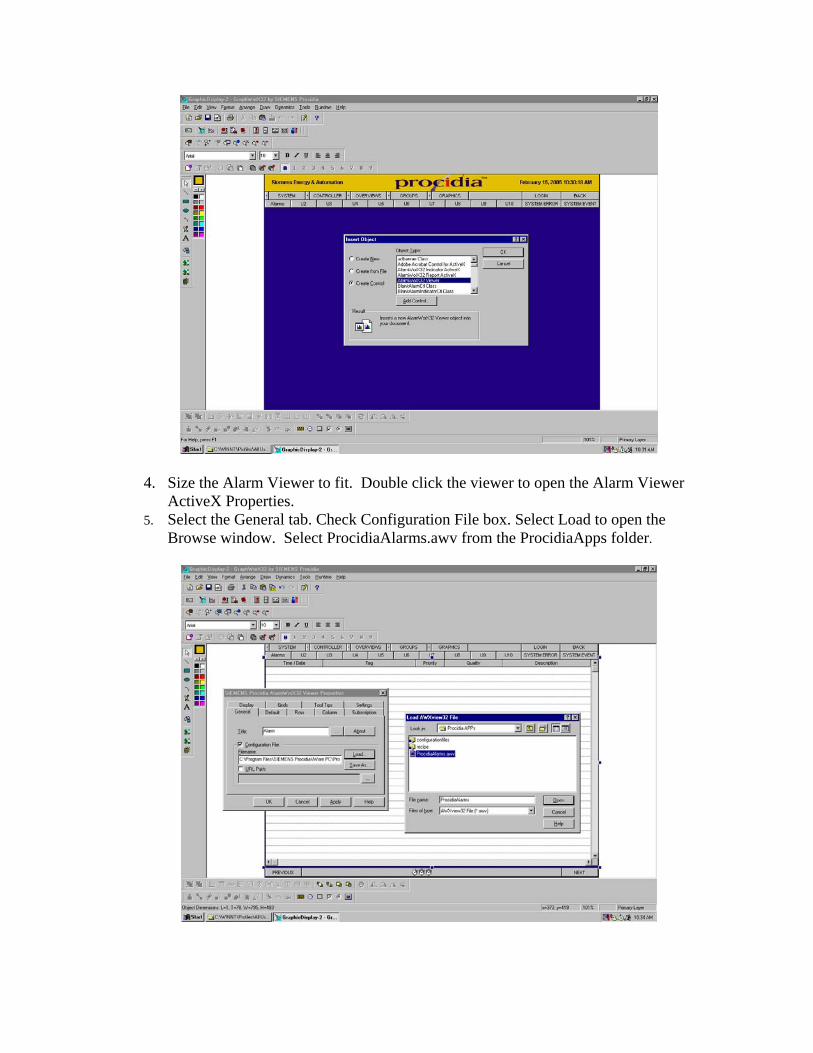
4. Size the Alarm Viewer to fit. Double click the viewer to open the Alarm Viewer ActiveX Properties.
5. Select the General tab. Check Configuration File box. Select Load to open the Browse window. Select ProcidiaAlarms.awv from the ProcidiaApps folder.

6. Select the Subscription tab. Delete any demo subscriptions that you do not want to populate the viewer. Select Add (give it a name), then Edit and the browse window will open. Locate the Alarm & Event server that you want to populate this viewer and then select OK.
7. Save the graphic file as a new name in the ProcidiaApps folder. Do not prefix the name with Procidia if the file is to be included in the Graphics pull down menu. If another link is to be provided such as using one of the Un buttons, then prefixing the file name with Procidia will prevent it from being included in the Graphics pull down menu.
8. During runtime, when this screen is selected, the viewer will connect to the Alarm & Event OPC server and publish any active alarms from the ODC or ODA loops in the server.
a. Active & Unacknowledged alarms will be displayed with yellow letters on a red background
b. Alarms that have cleared but not yet acknowledged will be displayed with white letters on a red background
c. Alarms that have been acknowledged but not cleared will be displayed with black letters on a yellow background


Procidia™ i|Ware PC™ - Faceplate PopUps
This chapter provides information about using the Procidia Faceplates from the Symbol Library to create Popup faceplates in custom graphic screens.
Introduction
The Symbol Library includes the Procidia Symbol Wizard that simplifies building faceplates and linking them to loops in an OPC server. This enables operator faceplates to be called while the graphic is being viewed without having to return to a group display for full operational control of the loop.
Creating a POP UP
9. Open a blank popup screen which is located in the ProcidiaApps folder (i.e. ProcidiaPopupBlank.gdf).
10. The PopUp screen has already been sized so that it fits a faceplate and it includes the ProcidiaSymbolWizard.
11. If the faceplate is not visible select View/Toolbars and uncheck the Symbols toolbar. The faceplate should now be visible in the faceplate sized window.
12. Double click the faceplate to open the Configure Faceplate window. a. Select the Loop Type (e.g. Control ODC, Sequencer ODS, etc…..) b. Open the browse window using the ….. icon and select the
configuration.csv file. This identifies the controllers & loops that are part of the configuration.
c. Select the Loop Type (e.g. Sequencer, ODS) d. Select the Controller (e.g. Reactor #5). e. Select the Loop (e.g. SQ5105). f. Select Generate to configure the faceplate that will be linked to the loop
selected.
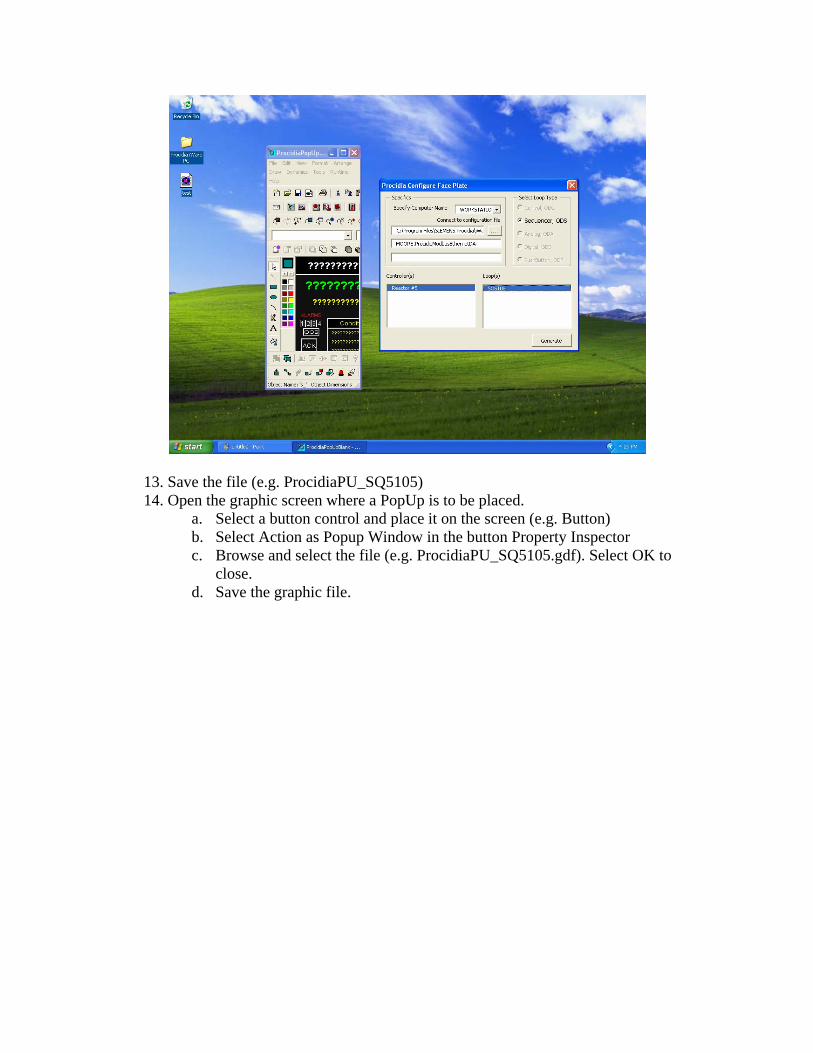
13. Save the file (e.g. ProcidiaPU_SQ5105) 14. Open the graphic screen where a PopUp is to be placed.
a. Select a button control and place it on the screen (e.g. Button) b. Select Action as Popup Window in the button Property Inspector c. Browse and select the file (e.g. ProcidiaPU_SQ5105.gdf). Select OK to
close. d. Save the graphic file.

15. Test the PopUp in runtime. When the button is selected on the graphic, the faceplate for the loop (e.g. SQ5105) will pop up.
16. Close the PopUp using the X in the upper right corner of the PopUp.
Procidia iWare PC – i|ware SYSTEM Connections
Introduction
The i|ware SYSTEM button can enable connection to another i|station or Workstation PC and connect to the OPC server that is contained in the configuration file for that i|station or Workstation PC.
i|station or Workstation Setup Requirements
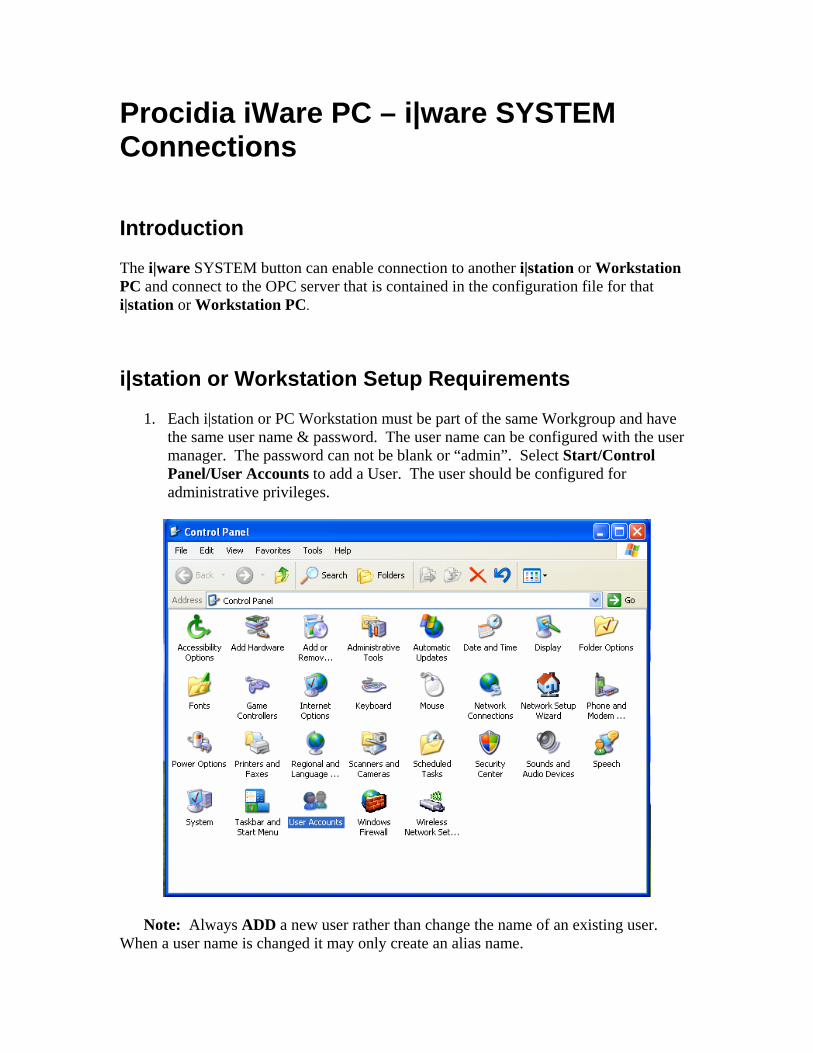
1. Each i|station or PC Workstation must be part of the same Workgroup and have the same user name & password. The user name can be configured with the user manager. The password can not be blank or “admin”. Select Start/Control Panel/User Accounts to add a User. The user should be configured for administrative privileges.
Note: Always ADD a new user rather than change the name of an existing user. When a user name is changed it may only create an alias name.
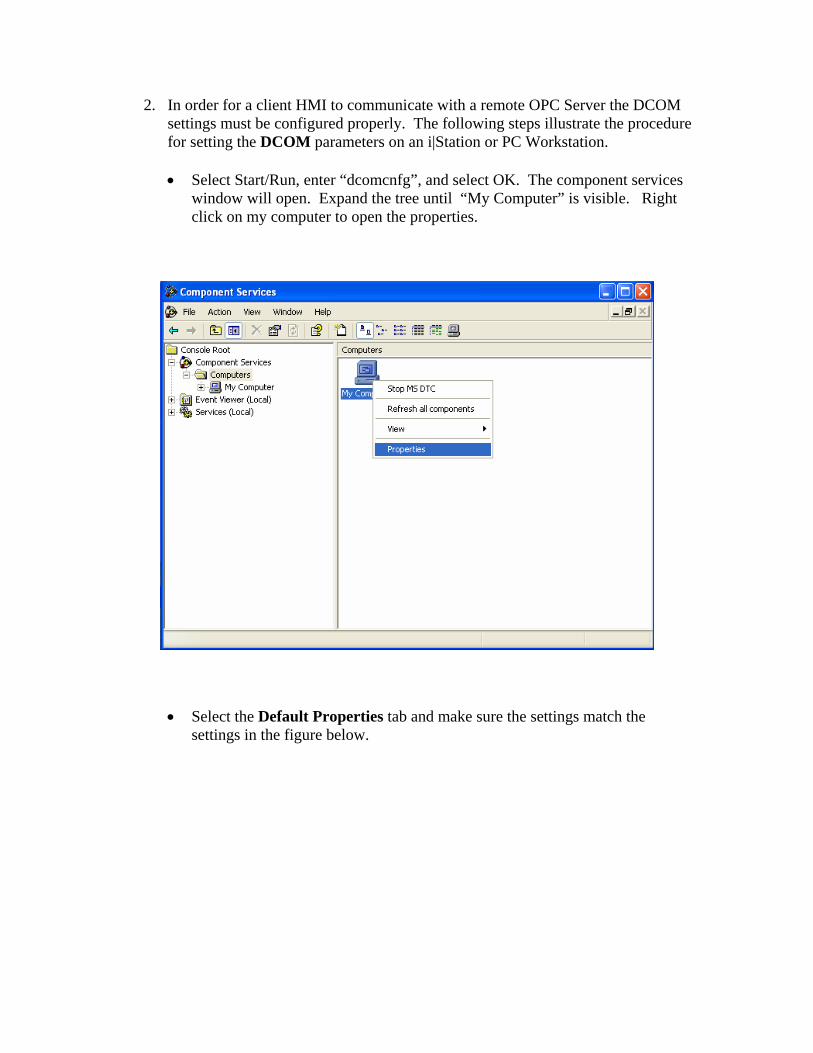
2. In order for a client HMI to communicate with a remote OPC Server the DCOM settings must be configured properly. The following steps illustrate the procedure for setting the DCOM parameters on an i|Station or PC Workstation.
• Select Start/Run, enter “dcomcnfg”, and select OK. The component services window will open. Expand the tree until “My Computer” is visible. Right click on my computer to open the properties.
• Select the Default Properties tab and make sure the settings match the settings in the figure below.

• Select the COM Security tab and select Edit Default under Access Permissions. Make sure Everyone, INTERACTIVE, NETWORK, SELF & SYSTEM are included and that all permissions are allowed.

• Select Edit Default under Launch Permissions. Make sure Everyone, INTERACTIVE, NETWORK, & SYSTEM are included and that all permissions are allowed.

3. Make the following changes to the Local Security Settings.
• Select Start/Settings/Control Panel/Administrative Tools and open the Local Security Policy window. Expand the tree view and select Security Options. Under Security Options select “Network Access: Sharing and security for local accounts”. Right mouse click and select properties. Select “Classic - local users authenticate as themselves”. Close the local security settings window.

4. Reboot the PC and login with the user name and password. It may also be necessary to turn off the firewall in WindowsXP.
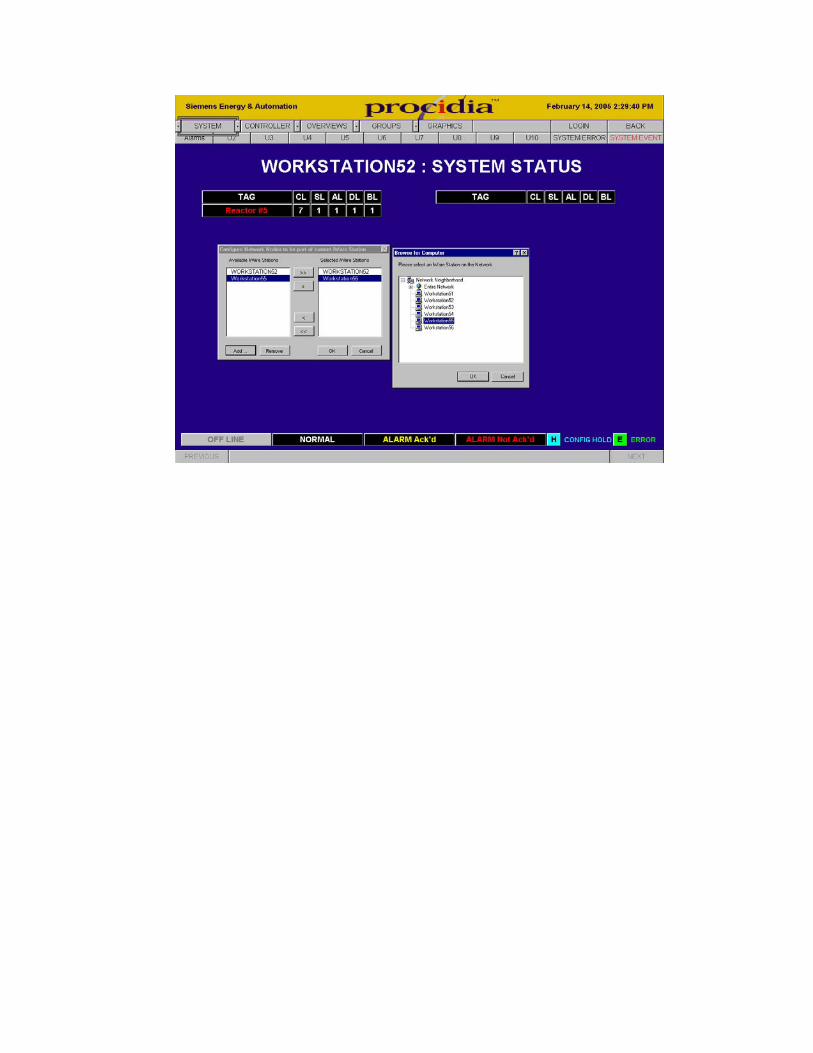
5. When i|ware is running, select the SYSTEM button. The SYSTEM dropdown will list all configured i|stations. To add new i|stations or Workstation PCs, select Configure. This will open the “Configure Network Nodes to be part of the Current iWare Station” dialog box. Select the Add button to open the browse window. Locate the i|station or Workstation PC name from the list and select OK. This will add the i|station or Workstation PC to the “Available iWare Station” list. A station can be added to the “Selected iWare Station” list using the > button. This will permit i|ware running in the i|station or Workstation PC to connect to OPC servers in other i|stations or Workstation PCs.

Procidia iWare PC - Licensing
Introduction Procidia software licensing is in the form of a site key after the i|Ware software has been installed on the computer. Several versions of iWare PC are available:
• Model iWARE-B05-Vxxx Basic PC Edition o GraphWorX32 o Trend Viewer o Persistent Trending o 500 active data point count
• Model iWARE-E05-Vxxx Enterprise PC Edition o GraphWorX32 o TrendWorX32 o AlarmWorX32 o Trend Viewer o Persistent Trending o 500 active data point count
• Model iWARE-E15-Vxxx Enterprise PC Edition o GraphWorX32 o TrendWorX32 o AlarmWorX32 o Trend Viewer o Persistent Trending o 1500 active data point count
• Model iWARE-EUL-Vxxx Enterprise PC Edition o GraphWorX32 o TrendWorX32 o AlarmWorX32 o Trend Viewer o Persistent Trending o Unlimited active data point count
Active Data Point Count
The number of active data points supported depends on the package. This is the number of accumulated data points viewed from OPC Servers running locally and on the Network Nodes, etc., connected to the client applications. This number is also known as point count.

Client Units
The licensing options are based on the client application and the point count supported. The amount of Client Units listed determines which iWare PC products you will be able to use. Each product has a set number of Client Units required for use and will not run if the available number of Client Units is less than the number required to run the product.
Demo Mode
The iWare PC software can run under demo mode for 2 hours without a Site Key. A total of 32 active data points are supported in this mode. The Software will check for a key on initialization and revert to DEMO mode if no protection key is detected.
Site Keys for Windows NT, 2000, & XP
You must install the Software Licensing before you can run i|Ware PC software under Windows in a non-demo mode. The Software Site Key handles licensing of i|Ware PC without requiring a hardware protection key. Licensing encrypting information is stored within the Windows system. If i|Ware PC authorization is not present, it will automatically run in DEMO MODE for 2 hours. If upgrading follow the steps in “Upgrading i|Ware” first.
Caution: Set the System Date and Time properly before installing the Software Licensing Utility. Changing the time and date may affect time limited Licenses.
Upon successful installation of i|Ware, the installation wizard automatically creates a directory for the i|Ware PC Software Key licensing system. By default, the files are copied to the path: C:\Program Files\SIEMENS Procidia\Softlic
This directory will contain the GENLIC32.EXE utility used for any iWare PC system licensing transactions along with the Licensing files themselves.
Caution: Tampering with the installation directory or using a disk clean up program could accidentally destroy the license
Under Windows, a iWare PC special service is installed which runs at boot up and takes care of all the support needed to start the software protection system. The Softlic directory also contains the following files among other files:

o GENLIC32.RTS o GENLIC32.ENT o GENLIC32.KEY
These files give the user a license to use iWare PC. These files contain encrypted information relating to the PC used, options the user is allowed to activate, and file system/directory. If the directory is renamed after the license has been granted, the software protection key will NOT recognize the license under the new directory name. It is also advisable to not tamper with the system’s clock.
Installing the iWare PC Licensing Utility
The License Utility should have been installed as part of the iWare PC installation. If it was not installed refer to the Installation section of this manual for complete instructions.
Site Key Authorization
The executable file GENLIC32.EXE under the directory Program Files\SIEMENS Procidia\SOFTLIC, handles all the user interface required. The software licensing utility provides full authorization to any of the purchased i|Ware PC products.
Start the License Utility from the program folder SIEMENS Procidia / iWare PC Licensing from the Windows Start menu. The Actions menu of the License Utility allows you to authorize or modify the license status.
Temporary License
To authorize the temporary software license, run the License Utility program from the Windows Start menu. Select Start Programs / SIEMENS Procidia / iWare PC Licensing / License Utility. If you are running the Licensing Utility for the first time before authorizing your license on a computer, a dialog box for the Temporary License Authorization as shown below will display. The temporary licensing is a one time license and is for a period of 30 days. This can be used for product evaluation and trial purposes. To execute the temporary license, click on the Yes button.
Viewing the License
To view the software license, select Actions – View License from the menu bar of the Licensing Utility. The current license information will be displayed: The information shown include:
o Type of License o Period for which the license is valid o Number of Client Units
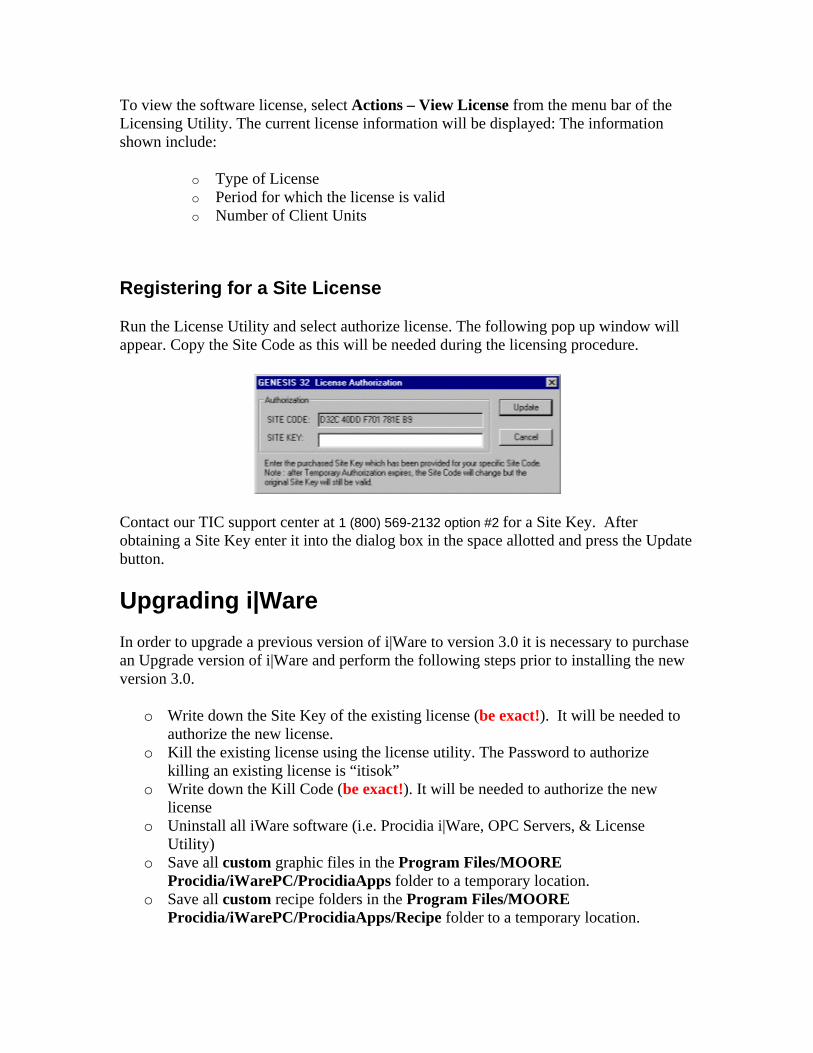
Registering for a Site License
Run the License Utility and select authorize license. The following pop up window will appear. Copy the Site Code as this will be needed during the licensing procedure.
Contact our TIC support center at 1 (800) 569-2132 option #2 for a Site Key. After obtaining a Site Key enter it into the dialog box in the space allotted and press the Update button.
Upgrading i|Ware In order to upgrade a previous version of i|Ware to version 3.0 it is necessary to purchase an Upgrade version of i|Ware and perform the following steps prior to installing the new version 3.0.
o Write down the Site Key of the existing license (be exact!). It will be needed to authorize the new license.
o Kill the existing license using the license utility. The Password to authorize killing an existing license is “itisok”
o Write down the Kill Code (be exact!). It will be needed to authorize the new license
o Uninstall all iWare software (i.e. Procidia i|Ware, OPC Servers, & License Utility)
o Save all custom graphic files in the Program Files/MOORE Procidia/iWarePC/ProcidiaApps folder to a temporary location.
o Save all custom recipe folders in the Program Files/MOORE Procidia/iWarePC/ProcidiaApps/Recipe folder to a temporary location.
o Save all OPC database files that will be used (.tdb for LIL & MB and .mdb for MB EN) to a temporary location.
o Delete the MOORE Procidia folder. You might want to copy this folder to a CD prior to deleting it, in case some files were not saved and will be needed.
o Reboot the computer before installing the new iWare version 3.00 software. o Install version 3.0 as described in this Installation section of this Getting Started
manual. o The 30 day license can be activated to enable IWARE to run until the new site
key is obtained o Copy the custom graphics that were saved into the Program Files/SIEMENS
Procidia/iWarePC/ProcidiaApps folder. Do not overwrite any files installed as part of the version 3.00 installation !!
o Copy the custom recipe folders that were saved into the Program Files/SIEMENS Procidia/iWarePC/ProcidiaApps/Recipe folder. Do not overwrite any files installed as part of the version 3.00 installation !!
o Copy the OPC database files to the appropriate folder (e.g. Program Files/SIEMENS Procidia/Modbus OPC Server for Modbus files.)
o Contact Siemens to obtain you new site key. In addition you will need the Kill Code & Site Key from the previous license when registering for the new i|Ware version 3.0 license.
TIC CONTACT INFORMATION
Telephone 1-800-333-7421
Fax: +1 215 283 6358
E-mail: [email protected]
Internet Site: www.sea.siemens.com/ia
Hours of Operation: 8 a.m. to 6 p.m. eastern time. Monday - Friday
Repair Service: 1-800-333-7421
Procidia iWare PC – Demonstration
Introduction
The i|ware CD contains files in the ProcidiaDemo folder that enable demonstration of the full capabilities of the i|ware software.
Controller Configuration
The ProcidiaDemo folder includes an i|Config file (DemoContrConfig) that can be loaded into any 353 (353, 353P, i|Pac, 353R) controller. This configuration can be used to demonstrate features of the HMI. The controller configuration can be used with Modbus, LIL, or Ethernet TCP/IP communication.
Setup Procedure
Download the configuration into a controller with firmware version 3.0 or higher. Connect to the controller via Modbus, LIL, or Ethernet and configure the OPC
Server. Copy a graphic (e.g. Reactor #5MB for Modbus communication) to the Procida
APPs folder Start the Procidia i|Ware application and demonstrate the features listed below.
Demonstration Features
The controller configuration includes the following loops:
TC5101 – Reactor Temperature – (ODC) - This loop is the primary for a cascade temperature loop. The setpoint is controlled from the sequencer in loop SQ5105 based on the recipe loaded into the controller. The loop detail screen illustrates the use of the ATD blocks that store trend data in the controller. This process value is also displayed on the Reactor #5 graphic display.
TC5102 – Jacket Temperature – (ODC) - This loop is the secondary in the cascade temperature loop. The setpoint is controlled from the primary controller TC5101. The loop detail screen illustrates the use of the ATD blocks that store trend data in the controller.
FI5103 – Charge Flow Indication – (ODC) - This loop simulates the charge flow to the reactor. It includes a batch totalizer. The totals from the batch totalizer are also displayed on the Reactor #5 graphic.
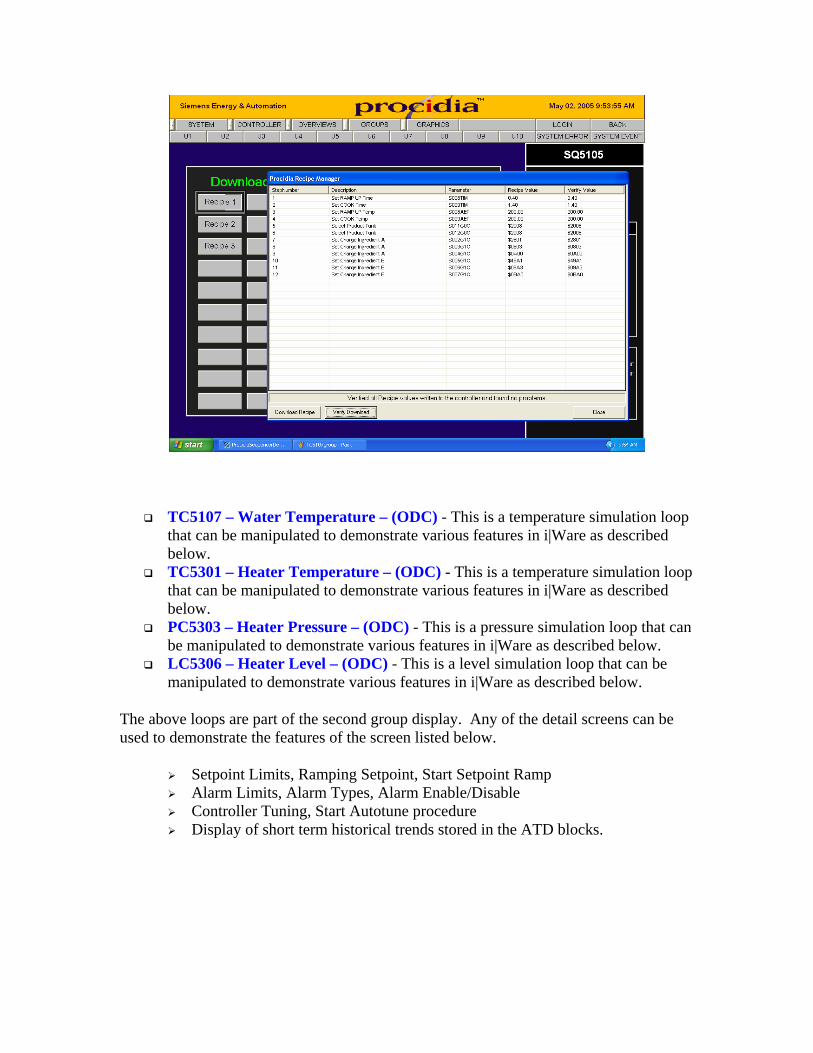
SQ5105 – Batch Sequencer – (ODS) – This loop controls the sequence of events in the batch simulation for Reactor #5. The detail screen includes a Recipe Manager that will read recipes from files located in the recipe folder and download them to the controller. The recipes are located in the following folder

when i|ware is installed: C:\Program Files\SIEMENS Procidia\iWare PC\Procidia APPs\recipe\Reactor #5\SQ5105. Note: When using LIL, the controller name defaults to Model_353_xx where xx is the station address which defaults to 07 in the demo software. When using LIL, copy the Reactor #5 folder and paste it into the recipe folder changing the name to Model_353_07.
The above loops are part of the first Group display which shows the operation of the batch sequence at the group level.
Recipe Manager on the SQ5105 detail screen:
TC5107 – Water Temperature – (ODC) - This is a temperature simulation loop that can be manipulated to demonstrate various features in i|Ware as described below.
TC5301 – Heater Temperature – (ODC) - This is a temperature simulation loop that can be manipulated to demonstrate various features in i|Ware as described below.
PC5303 – Heater Pressure – (ODC) - This is a pressure simulation loop that can be manipulated to demonstrate various features in i|Ware as described below.
LC5306 – Heater Level – (ODC) - This is a level simulation loop that can be manipulated to demonstrate various features in i|Ware as described below.
The above loops are part of the second group display. Any of the detail screens can be used to demonstrate the features of the screen listed below.
Setpoint Limits, Ramping Setpoint, Start Setpoint Ramp Alarm Limits, Alarm Types, Alarm Enable/Disable Controller Tuning, Start Autotune procedure Display of short term historical trends stored in the ATD blocks.

FC5308 – Heater Air Flow – (ODC) - This is a flow simulation loop that can be manipulated to demonstrate various features in i|Ware.
Motors – Motor Control Center – (ODP) - This simulates the use of an ODP loop for starting & stopping motors. In Auto, the motors are started & stopped automatically from a repeat cycle timer. In Manual, they can be started & stopped using the Start & Stop buttons on the HMI.
Analogs – Analog Displays – (ODA) - This simulates the use of an ODA loop for viewing and alarming up to four analog variables. The process variables from loops TC5301, PC5303, LC5306, & FC5308 are displayed. The detail screen illustrates the use of four ATD trend blocks for short term historical trending. The detail display can also demonstrate the use of alarm setting and the use of the Quick Set Hold blocks
Status – Motor & Valve Status – (ODD) - This simulates the use of an ODD loop for displaying the status of ON/OFF variables to motors & pumps. The state of the variable can be changed by using Manual. Changing the state will not affect the actual batch demo.

Graphic Display Reactor #5xx - This graphic can be selected from the Graphics dropdown menu when is located in the Procidia APPs folder. It illustrates typical graphic functions that can be created with the i|Ware PC™ software.
Procidia iWare PC – Control Basics
Introduction
The i|ware CD contains files in the ControlBasics folder including controller configurations & i|ware graphic screens that provide various process control simulations. These simulations were originally developed by John Warnock to train engineers in the tuning of loop controllers. Although modern loop controllers (e.g. 353) have built in auto tuning, manual manipulation of tuning parameters can help understand the affects that various tuning values have on the loop response. These simulations will also aid in understanding the characteristics of different processes.
Controller Configuration
The ControlBasics folder includes an i|Config file (ControlSimulation) that can be loaded into any 353 (353, 353P, i|Pac, 353R) controller. This configuration in conjunction with the i|ware software can be used to learn about various types of control loops. The controller configuration is designed to use either Ethernet or Modbus communications.
Setup Procedure
Download the ControlSimulation configuration into a controller that has firmware version 3.0 or higher.
Connect the PC to the controller via Ethernet or Modbus front port and configure the OPC Server.
Copy the appropriate graphic files from the ControlBasics folder to the Procida APPs folder
1. For Ethernet OPC Server; FlowControlEN, LevelControlEN, TempControlEN, & CascadeControlEN
2. For Modbus OPC Server; FlowControlMB, LevelControlMB, TempControlMB, & CascadeControlMB
Start the Procidia i|Ware application. From the GROUP displays put all control loops in Auto (green light A/M PB) and
FIC-402 in External Setpoint (green light PB2).

Control Simulations
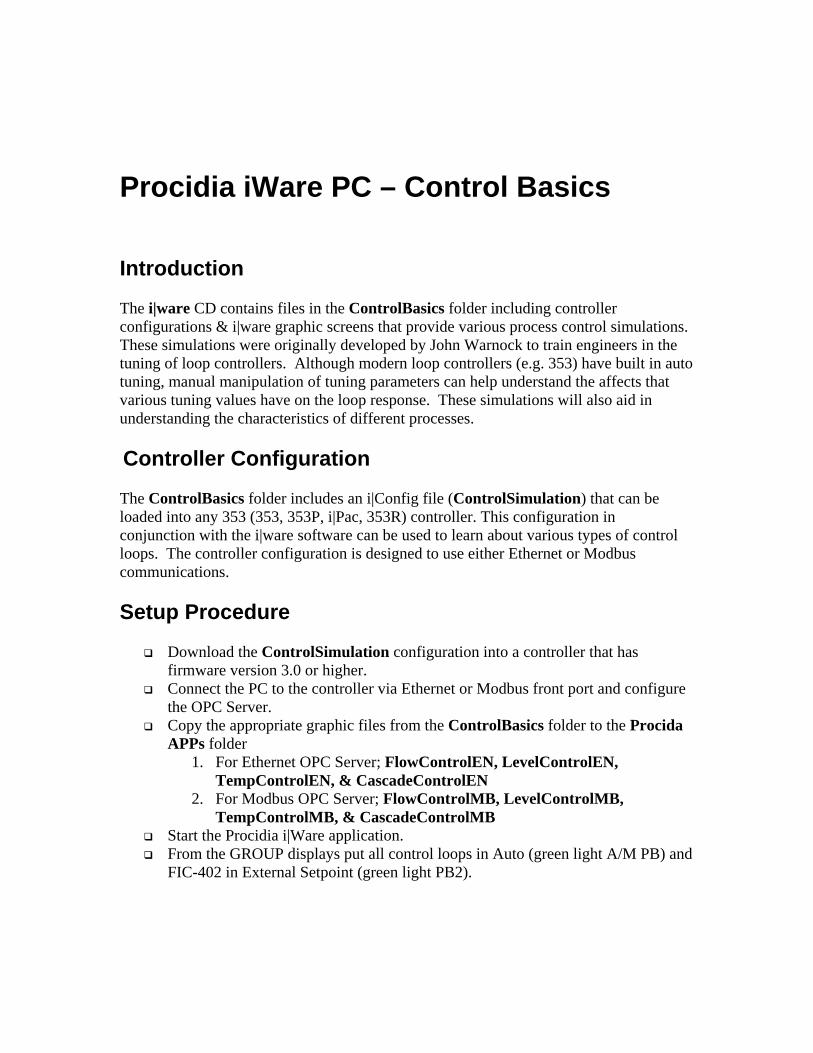
Flow Control
The Flow Control Simulation demonstrates various basic concepts. Some concepts may not apply to a flow control but are used to provide discussion points on various control variations. All demonstrations can be operated entirely from the graphic screens although Group Screens and Detail Screens which are auto built as part of i|Ware are also available.
Although this is a simple loop there are a number of basic control concepts that can be illustrated with this loop:
VALVE POSITIONER. When a valve positioner is used on a control valve, the tuning of the loop can be tighter providing better dynamic response. This may not be important in a flow control loop but for other loops, such as temperature, it is extremely important. Two buttons on the FlowControl graphic screen are used to change the controller tuning to match the response needed when a positioner is used and when it is bypassed. The ‘Tune..’ buttons are configured to provide the suggested tuning based on a fast Z-N response to setpoint changes. These may not be the settings one would use on a real process but have been used here for better illustration of the dynamic loop response. Other tuning values can be tried to visualize changes to the dynamic response. To demonstrate a valve without a positioner, select the BYPASS VP button. A green light with indicate the positioner is in the bypass mode and the red light that the positioner is being used. Set the correct tuning using the ‘Tune for BYPASS’ or ‘Tune for VP’ buttons.

PROCESS LOAD CHANGES. The LOAD button can be used to open the solenoid valve (light is green when open) which will simulate a load condition. With the solenoid valve open, the pressure at the flow control valve is lower and thus the loop gain will be lower. Under this condition a given change in the controller output will provide a smaller change in the flow rate than during a no load condition. The control response under a load condition will be sluggish. The trend display in the bottom right corner of the graphic illustrates the dynamic response of the loop. When the solenoid is turned off (red light is on), the dynamic response is much more oscillatory. This illustrates the non-linearity of many process control loops. If necessary this could be compensated by using an adaptive gain controller such as the PIDAG function block in the 353. The gain of the controller could be scheduled to correspond with the load changes of the process.
TREND DISPLAY. The trend display at the bottom right of the graphic illustrates the effects of a load change to the dynamic response of the loop. In the preceding figure, the first set of responses are with the positioner by-passed and the second set with normal positioner operation. The control response when a positioner is used is tighter and there was less deviation from setpoint.
SHUTDOWN CONDITION. A process shutdown can be demonstrated by using the ‘PUMP’ button. This button will turn the pump on & off. The light is green when the pump is running. It can be noted that when the pump is turned off the controller output will go high in an attempt to bring the flow up to setpoint. When this occurs and the pump is turned on, there will be a large overshoot of the process flow. This may not be serious in a flow loop but in some applications it could be critical. In order to prevent overshoot, the controller output can be forced to zero by using the ‘SWITCH’ button on the graphic. When the loop starts, the process will not overshoot the setpoint. It can be noted that under this condition the startup will be a little sluggish. When it is important that the startup comes up to setpoint as quickly as possible, a Batch Switch (BATSW) is available in the 353 library of function blocks. This function block can be tuned for response under a startup condition. This provides for optimum startup and the tuning provided by the Batch Switch does not affect the controller response under normal operating conditions.
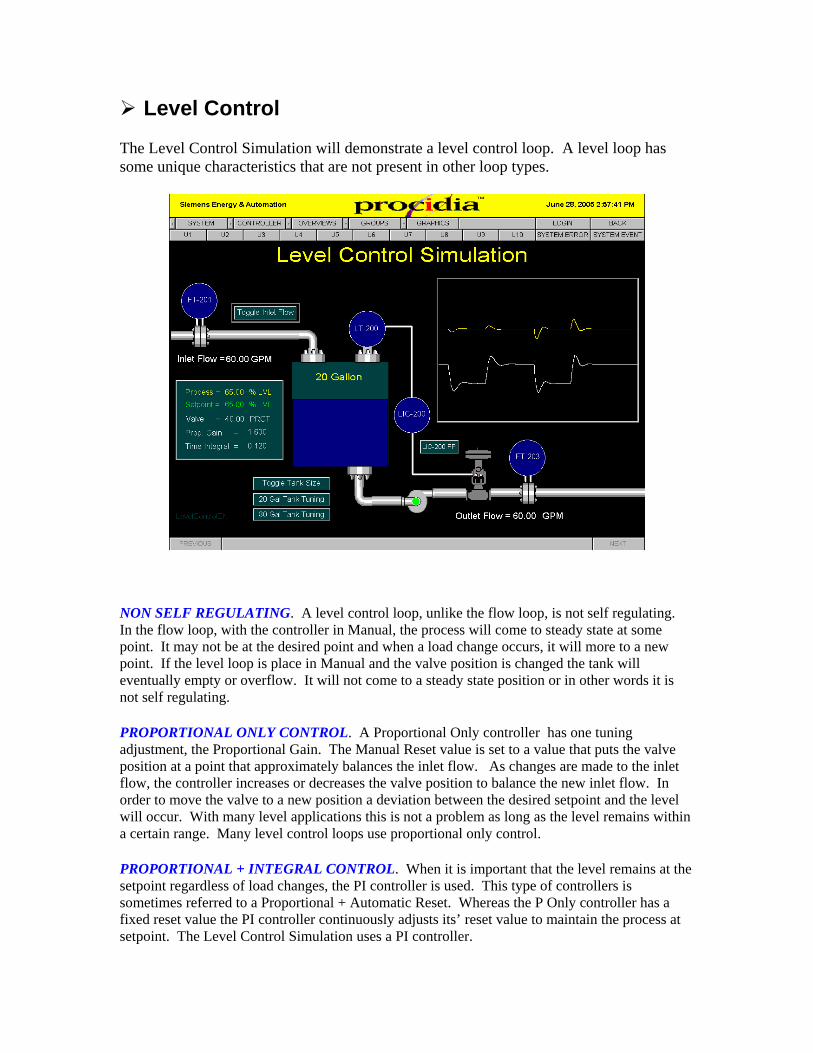
Level Control
The Level Control Simulation will demonstrate a level control loop. A level loop has some unique characteristics that are not present in other loop types.
NON SELF REGULATING. A level control loop, unlike the flow loop, is not self regulating. In the flow loop, with the controller in Manual, the process will come to steady state at some point. It may not be at the desired point and when a load change occurs, it will more to a new point. If the level loop is place in Manual and the valve position is changed the tank will eventually empty or overflow. It will not come to a steady state position or in other words it is not self regulating.
PROPORTIONAL ONLY CONTROL. A Proportional Only controller has one tuning adjustment, the Proportional Gain. The Manual Reset value is set to a value that puts the valve position at a point that approximately balances the inlet flow. As changes are made to the inlet flow, the controller increases or decreases the valve position to balance the new inlet flow. In order to move the valve to a new position a deviation between the desired setpoint and the level will occur. With many level applications this is not a problem as long as the level remains within a certain range. Many level control loops use proportional only control.
PROPORTIONAL + INTEGRAL CONTROL. When it is important that the level remains at the setpoint regardless of load changes, the PI controller is used. This type of controllers is sometimes referred to a Proportional + Automatic Reset. Whereas the P Only controller has a fixed reset value the PI controller continuously adjusts its’ reset value to maintain the process at setpoint. The Level Control Simulation uses a PI controller.

TANK CAPACITY. The level simulation includes two different tank sizes for the process conditions. The smaller tank will provide faster response to setpoint and load changes but will incur larger deviations from setpoint. When the tank size is changed, the correct controller tuning must be applied.
OVER DAMPED TUNING. Many level applications require over damped tuning so that dynamic level changes do not affect the downstream processes. The operator may decrease the tuning in order to dampen the tuning. However, level loops when using 2-mode control, can exhibit more than one point of instability. When the controller gain is decreased, the natural frequency of the loop will decrease. If the controller gain is decreased too far the loop may enter a second point of instability. The frequency of the loop will be very low which will give the indication that the loop is wandering but it is actually unstable. Increasing the Integral time will provide for a more damped response without the same problem that reducing the gain will cause. However, the loop will respond much slower and if larger upsets are experienced, the tank could overflow before the controller can bring the loop back to setpoint. Many uses prefer to use proportional only control to prevent this situation. The controller gain can be much higher with proportional control. This will work fine if it is not critical to keep the level at a fixed operating point.
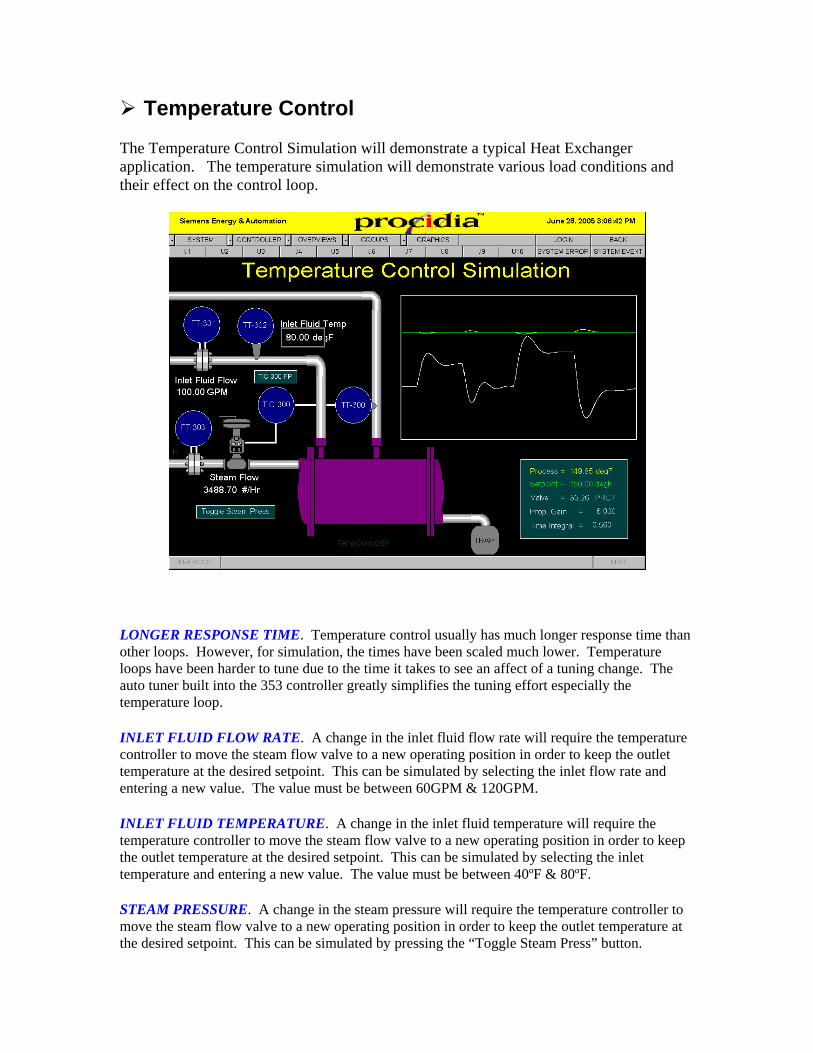
Temperature Control
The Temperature Control Simulation will demonstrate a typical Heat Exchanger application. The temperature simulation will demonstrate various load conditions and their effect on the control loop.
LONGER RESPONSE TIME. Temperature control usually has much longer response time than other loops. However, for simulation, the times have been scaled much lower. Temperature loops have been harder to tune due to the time it takes to see an affect of a tuning change. The auto tuner built into the 353 controller greatly simplifies the tuning effort especially the temperature loop.
INLET FLUID FLOW RATE. A change in the inlet fluid flow rate will require the temperature controller to move the steam flow valve to a new operating position in order to keep the outlet temperature at the desired setpoint. This can be simulated by selecting the inlet flow rate and entering a new value. The value must be between 60GPM & 120GPM.
INLET FLUID TEMPERATURE. A change in the inlet fluid temperature will require the temperature controller to move the steam flow valve to a new operating position in order to keep the outlet temperature at the desired setpoint. This can be simulated by selecting the inlet temperature and entering a new value. The value must be between 40ºF & 80ºF.
STEAM PRESSURE. A change in the steam pressure will require the temperature controller to move the steam flow valve to a new operating position in order to keep the outlet temperature at the desired setpoint. This can be simulated by pressing the “Toggle Steam Press” button.
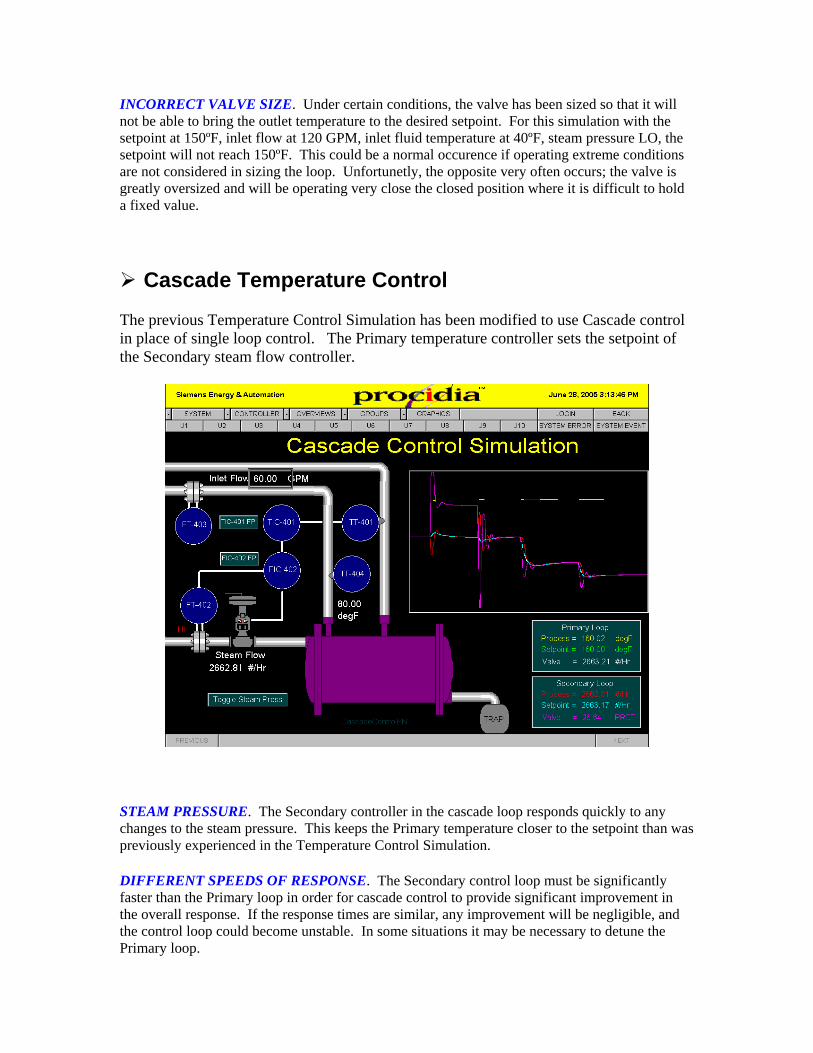
INCORRECT VALVE SIZE. Under certain conditions, the valve has been sized so that it will not be able to bring the outlet temperature to the desired setpoint. For this simulation with the setpoint at 150ºF, inlet flow at 120 GPM, inlet fluid temperature at 40ºF, steam pressure LO, the setpoint will not reach 150ºF. This could be a normal occurence if operating extreme conditions are not considered in sizing the loop. Unfortunetly, the opposite very often occurs; the valve is greatly oversized and will be operating very close the closed position where it is difficult to hold a fixed value.
Cascade Temperature Control
The previous Temperature Control Simulation has been modified to use Cascade control in place of single loop control. The Primary temperature controller sets the setpoint of the Secondary steam flow controller.
STEAM PRESSURE. The Secondary controller in the cascade loop responds quickly to any changes to the steam pressure. This keeps the Primary temperature closer to the setpoint than was previously experienced in the Temperature Control Simulation.
DIFFERENT SPEEDS OF RESPONSE. The Secondary control loop must be significantly faster than the Primary loop in order for cascade control to provide significant improvement in the overall response. If the response times are similar, any improvement will be negligible, and the control loop could become unstable. In some situations it may be necessary to detune the Primary loop.

CONTROLLER TUNING. The Secondary loop must be tuned first. Then the Primary can be tuned with the controllers in the Cascade mode.
INLET FLUID FLOW RATE. A change in the inlet fluid flow rate will require the temperature controller to move the steam flow valve to a new operating position in order to keep the outlet temperature at the desired setpoint. This can be simulated by selecting the inlet flow rate and entering a new value. The value must be between 60GPM & 120GPM. The affect of inlet flow changes are not helped by the cascade loop. Feedforward techniques could be used to quickly move the steam setpoint to a new value to cancel the effect of the change in flow will have on the outlet temperature.
INLET FLUID TEMPERATURE. A change in the inlet fluid temperature will require the temperature controller to move the steam flow valve to a new operating position in order to keep the outlet temperature at the desired setpoint. This can be simulated by selecting the inlet temperature and entering a new value. The value must be between 40ºF & 80ºF. The affect of inlet temperature changes are not helped by the cascade loop. Feedforward techniques could be used to quickly move the steam setpoint to a new value to cancel the effect of the change in inlet temperature will have on the outlet temperature.
Procidia iWare PC – Control Solutions
Introduction
The i|ware CD contains files in the ControlSolutions folder that include controller configurations & i|ware graphic screens. These files provide various process control simulations that demonstrate solutions using function blocks available in the 353 function block library. These simulations provide insight into some common process control solutions and the use of 353 function blocks for these applications.
Controller Configuration
The ControlSolutions folder includes i|Config files for each of the solutions that can be loaded into any 353 (353, 353P, i|Pac, 353R) controller. The controller configuration in conjunction with the i|ware software can be used to learn about various control solutions. Each controller configuration is designed to use either Ethernet or Modbus communications.
Setup Procedure
Download a configuration into a controller that has firmware version 3.0 or higher.
Connect the PC to the controller via Ethernet or Modbus front port and configure the OPC Server.
Copy the appropriate graphic file from the ControlSolutions folder to the Procida APPs folder
1. For Ethernet OPC Server; BatchSwitchEN, DeadTimeControlEN, or ONOFFControlEN
2. For Modbus OPC Server; BatchSwitchMB, DeadTimeControlMB, or ONOFFControlMB
Start the Procidia i|Ware application. Repeat above steps for another Control Solution
Control Solutions
Batch Switch
The Batch Startup Control Simulation demonstrates special considerations, sometimes required, when starting a batch process. This applies, primarily, to temperature loops where the time constants can be extremely large. The main requirement of a batch

startup is to get the process up to setpoint as quickly as possible without overshoot. When a batch process is shut down the controller winds up in an attempt to bring the process to setpoint. When a process has been shut down for an extended period of time, the integral section of the controller will saturate. When the process is started, the valve being fully open will put the maximum amount of energy into the process. This is good since you want the process to come up to setpoint as quickly as possible. However, with the integral section being fully saturated, the process will cross setpoint in order to move the valve to the proper position. The Batch Switch function block is inserted in the feedback line of the controller. It keeps the controller output at 100% by reducing the signal to the integral section, thus preventing integral windup. The Batch Switch has a single setting called the Batch Preload. Normally it should be set a 0%. If the batch startup is too overdamped, it can be adjusted higher. In the screen below, the startup on the left is without the Batch Switch and the one on the right with the Batch Switch.
There are other batch switch solutions that have been used. The ideal solution is one that applies full valve opening for a selected period, then the valve is positioned at a predefined setting for another selected period of time and then the controller is returned to normal operation. This type of switch requires two timer settings and one position setting. The 353 Batch Switch just requires a single setting and in most cases will provide satisfactory results.
STARTUP WITHOUT BATCH SWITCH – The ‘Toggle Feedback’ button can be used to connect the controller feedback so that it does not use the Batch Switch. Use the ‘Toggle Steam’ button to shut off the steam flow. Notice that the Feedback will equal the valve signal (i.e. 103.3%). Wait several minutes for the integral section of the controller to saturate. Use the ‘Toggle Steam’ button to start the process.

STARTUP WITH BATCH SWITCH – The ‘Toggle Feedback’ button can be used to connect the controller feedback so that it uses the Batch Switch. Use the ‘Toggle Steam’ button to shut off the steam flow. Notice that the Feedback signal will equal the Batch Preload setting (i.e. 0%). Wait several minutes for the integral section of the controller to saturate. Use the ‘Toggle Steam’ button to start the process.
Dead Time
Dead Time, sometimes referred to as transportation delay, prevents good, tight control of a process. When process dead time is present, the controller must be detuned to keep the control loop stable, in addition to the process delay time. In this simulation, the location of a temperature sensor affects the loop dead time. One solution for improving the control of a process with dead time is to delay the feedback of the controller by a time equal to the dead time. The screen below shows three scenarios that can be demonstrated. The response on the left is for a process where the temperature sensor is located far away and no dead time compensation has been used. The middle response is the same except dead time compensation has been used. When the dead time compensation is use, the controller can use a little higher gain and a faster integral time. Although the response has improved significantly, the dead time is still present. The right hand response is when the sensor has been moved closer and not dead time compensation is required. Reducing or eliminating the process dead time is the ideal scenario. However, this may not be possible in all cases.

DEAD TIME WITHOUT DEAD TIME COMPENSATION – The ‘Toggle Feedback’ button can be used to connect the controller feedback so that it does not use the Dead Time Compensation. Use the ‘Toggle Distance x’, if necessary, so that the distance is 50 feet. Use the ‘x=50 No DTC’ button to preset the tuning for this scenario. Make a small setpoint change (e.g. 150 to 160 or 160 to 150) to the controller. DEAD TIME WITH DEAD TIME COMPENSATION – The ‘Toggle Feedback’ button can be used to connect the controller feedback so that it uses the Dead Time Compensation. Use the ‘Toggle Distance x’, if necessary, so that the distance is 50 feet. Use the ‘x=50 DTC’ button to preset the tuning for this scenario. Make a small setpoint change (e.g. 150 to 160 or 160 to 150) to the controller. NO DEAD TIME AND NO DEAD TIME COMPENSATION – The ‘Toggle Feedback’ button can be used to connect the controller feedback so that it does not use the Dead Time Compensation. Use the ‘Toggle Distance x’, if necessary, so that the distance is 2 feet. Use the ‘x=2 No DTC’ button to preset the tuning for this scenario. Make a small setpoint change (e.g. 150 to 160 or 160 to 150) to the controller.
ON/OFF Control
The 353 controller includes an ON/OFF Control function block. This simulation illustrates the uses of this block.