Embed Size (px)
Citation preview

To Accompany Krajewski & Ritzman Operations Management: Strategy and Analysis, Seventh Edition © 2004 Prentice Hall, Inc. All rights reserved.
Process Performance Process Performance and Qualityand Quality
Chapter 5Chapter 5

To Accompany Krajewski & Ritzman Operations Management: Strategy and Analysis, Seventh Edition © 2004 Prentice Hall, Inc. All rights reserved.
Implementchanges
6Redesignprocess
5
Evaluating Process Evaluating Process PerformancePerformance
Documentprocess
3
Definescope
2
Evaluateperformance
4
Figure 5.1Figure 5.1
Identify opportunity
1
To Accompany Krajewski & Ritzman Operations Management: Strategy and Analysis, Seventh Edition © 2004 Prentice Hall, Inc. All rights reserved.
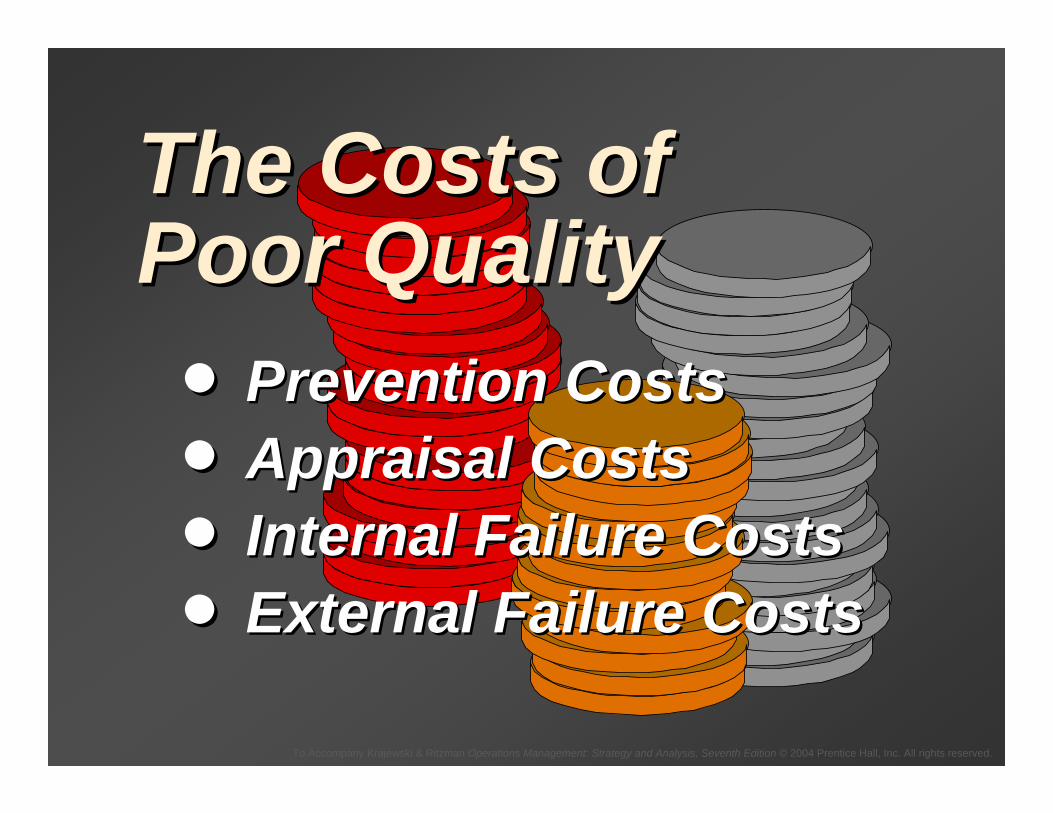
The Costs of The Costs of Poor QualityPoor Quality
•• Prevention CostsPrevention Costs•• Appraisal CostsAppraisal Costs•• Internal Failure CostsInternal Failure Costs•• External Failure CostsExternal Failure Costs
To Accompany Krajewski & Ritzman Operations Management: Strategy and Analysis, Seventh Edition © 2004 Prentice Hall, Inc. All rights reserved.
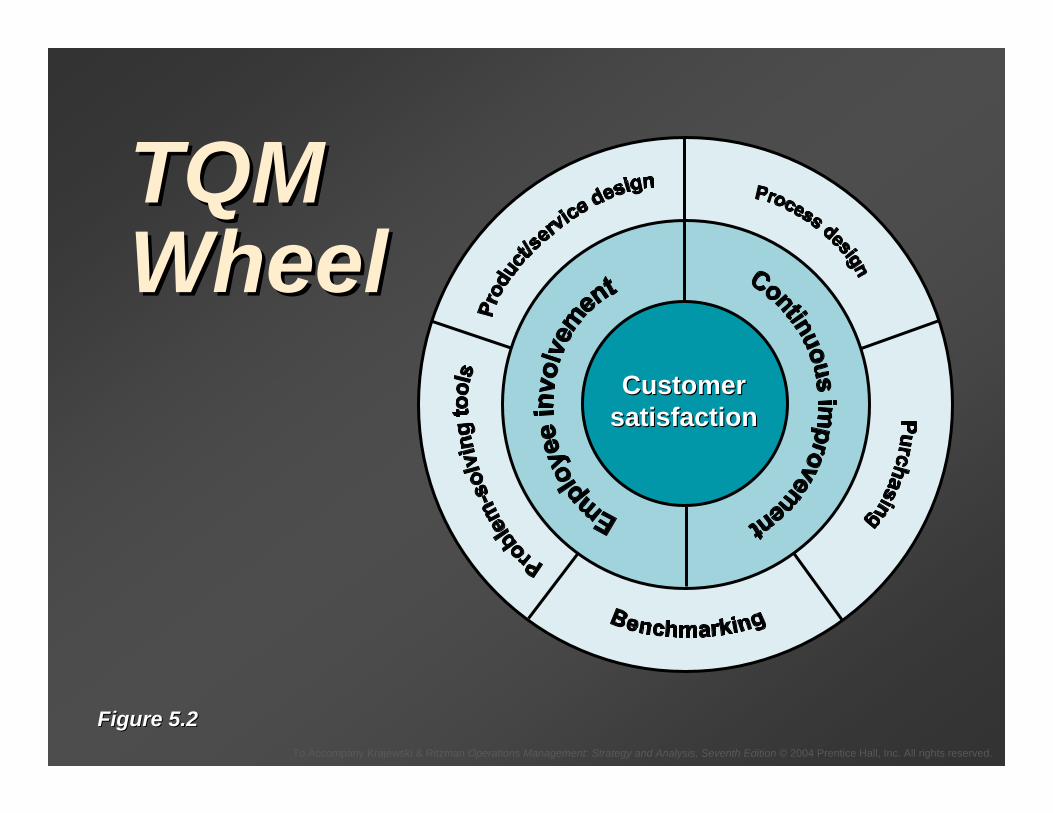
Customer Customer satisfactionsatisfaction
TQMTQMWheelWheel
Figure 5.2Figure 5.2

To Accompany Krajewski & Ritzman Operations Management: Strategy and Analysis, Seventh Edition © 2004 Prentice Hall, Inc. All rights reserved.
CustomerCustomer--DrivenDrivenDefinitions of QualityDefinitions of Quality•• Conformance to SpecificationsConformance to Specifications•• ValueValue•• Fitness for UseFitness for Use•• SupportSupport•• Psychological ImpressionsPsychological Impressions

To Accompany Krajewski & Ritzman Operations Management: Strategy and Analysis, Seventh Edition © 2004 Prentice Hall, Inc. All rights reserved.
EmployeeEmployeeInvolvementInvolvement
•• Cultural Cultural ChangeChange
•• TeamsTeams
To Accompany Krajewski & Ritzman Operations Management: Strategy and Analysis, Seventh Edition © 2004 Prentice Hall, Inc. All rights reserved.
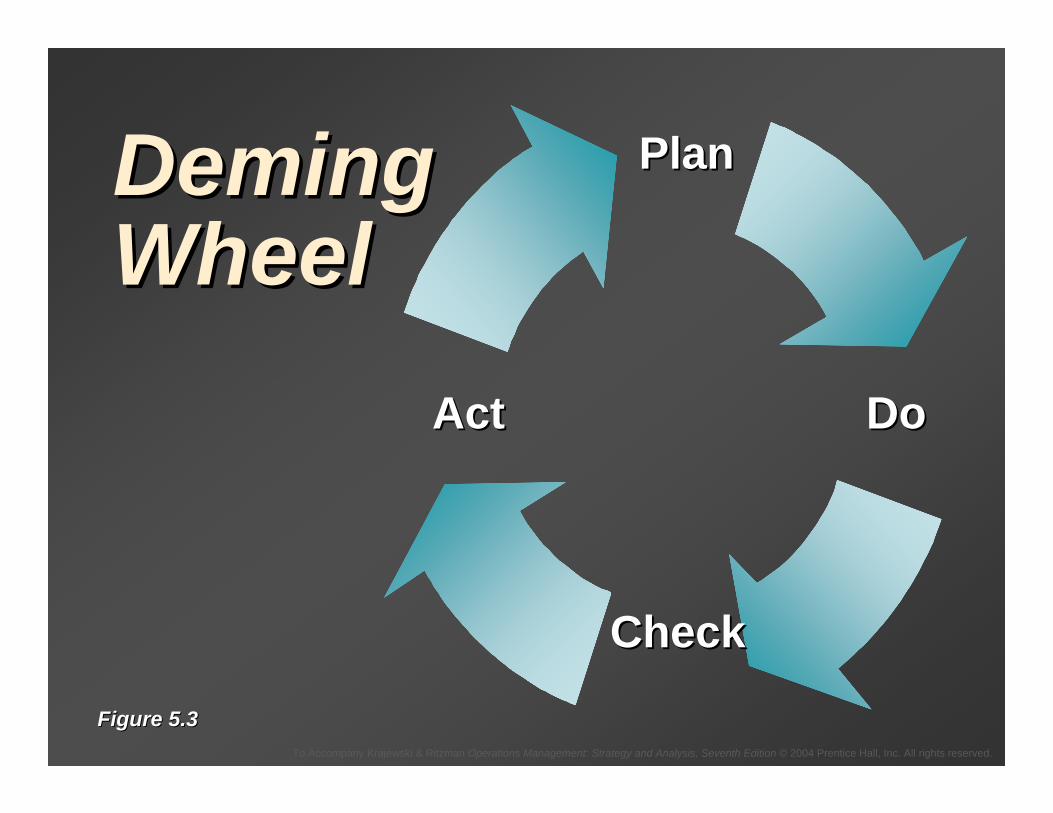
PlanPlan
DoDo
CheckCheck
ActAct
DemingDemingWheelWheel
Figure 5.3Figure 5.3
To Accompany Krajewski & Ritzman Operations Management: Strategy and Analysis, Seventh Edition © 2004 Prentice Hall, Inc. All rights reserved.
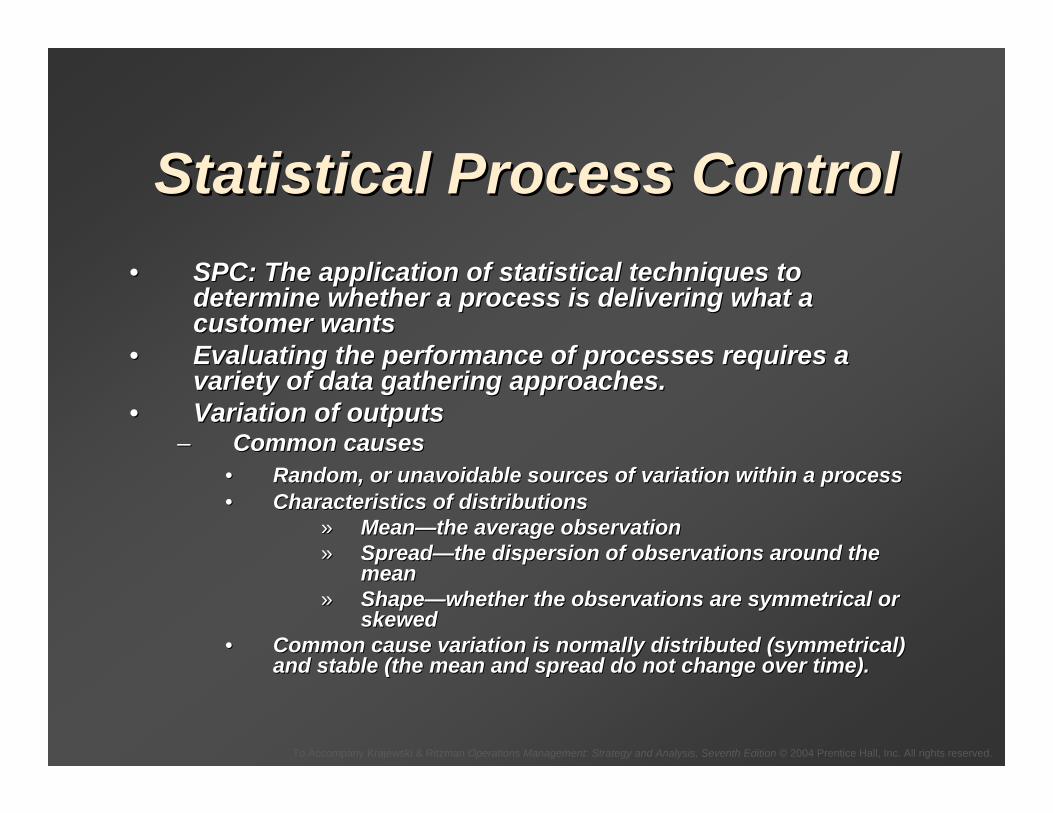
Statistical Process ControlStatistical Process Control•• SPC: The application of statistical techniques to SPC: The application of statistical techniques to
determine whether a process is delivering what a determine whether a process is delivering what a customer wantscustomer wants
•• Evaluating the performance of processes requires a Evaluating the performance of processes requires a variety of data gathering approaches.variety of data gathering approaches.
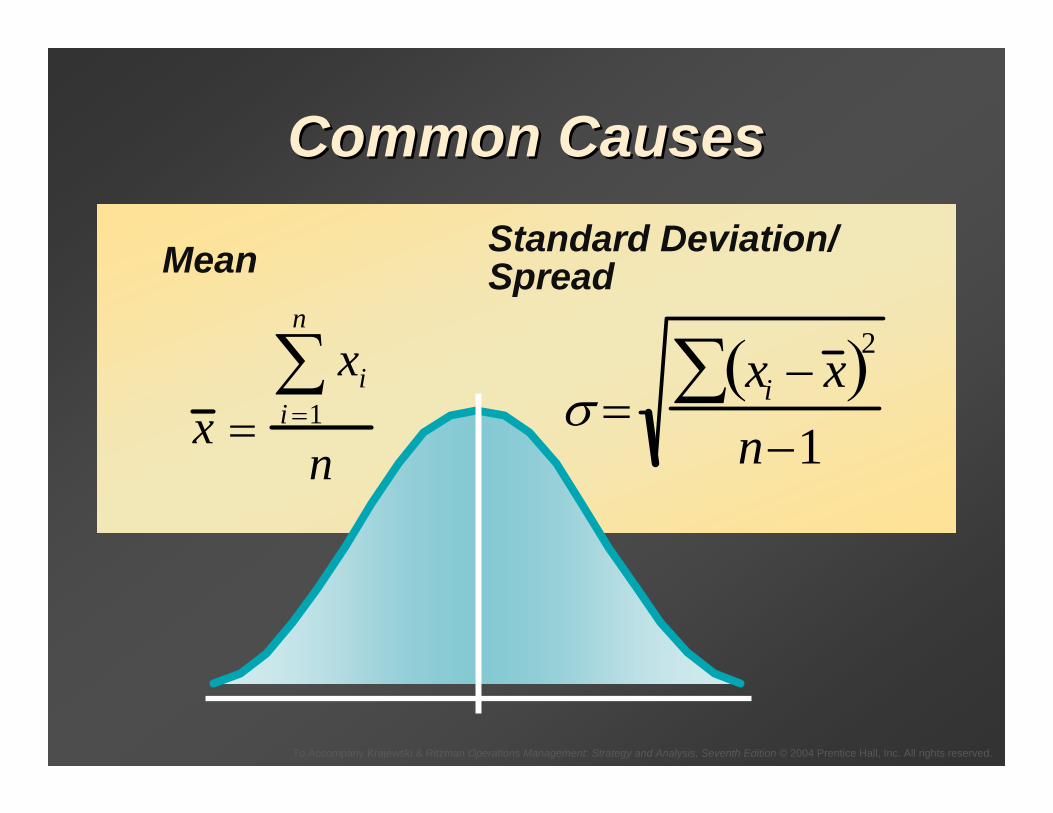
•• Variation of outputs Variation of outputs –– Common causesCommon causes
•• Random, or unavoidable sources of variation within a processRandom, or unavoidable sources of variation within a process•• Characteristics of distributionsCharacteristics of distributions
»» MeanMean——the average observationthe average observation»» SpreadSpread——the dispersion of observations around the the dispersion of observations around the
meanmean»» ShapeShape——whether the observations are symmetrical or whether the observations are symmetrical or
skewedskewed•• Common cause variation is normally distributed (symmetrical) Common cause variation is normally distributed (symmetrical)
and stable (the mean and spread do not change over time).and stable (the mean and spread do not change over time).
To Accompany Krajewski & Ritzman Operations Management: Strategy and Analysis, Seventh Edition © 2004 Prentice Hall, Inc. All rights reserved.
Common CausesCommon Causes
x =xi
i =1
n
∑n
σ =xi − x ( )∑ 2
n−1
Mean Standard Deviation/ Spread
To Accompany Krajewski & Ritzman Operations Management: Strategy and Analysis, Seventh Edition © 2004 Prentice Hall, Inc. All rights reserved.
Statistical Process ControlStatistical Process Control•• Variation of outputs Variation of outputs
–– Assignable causesAssignable causes•• Any cause of variation that can be identified and Any cause of variation that can be identified and
eliminated.eliminated.•• Change in the mean, spread, or shape of a process Change in the mean, spread, or shape of a process
distribution is a symptom that an assignable cause of distribution is a symptom that an assignable cause of variation has developed.variation has developed.
•• After a process is in statistical control, SPC is used to After a process is in statistical control, SPC is used to detect significant change, indicating the need for detect significant change, indicating the need for corrective action. spread do not change over time).corrective action. spread do not change over time).

To Accompany Krajewski & Ritzman Operations Management: Strategy and Analysis, Seventh Edition © 2004 Prentice Hall, Inc. All rights reserved.
Assignable CausesAssignable Causes
(a) Location(a) LocationGramsGrams
AverageAverage
Figure 5.4Figure 5.4
AverageAverage
To Accompany Krajewski & Ritzman Operations Management: Strategy and Analysis, Seventh Edition © 2004 Prentice Hall, Inc. All rights reserved.
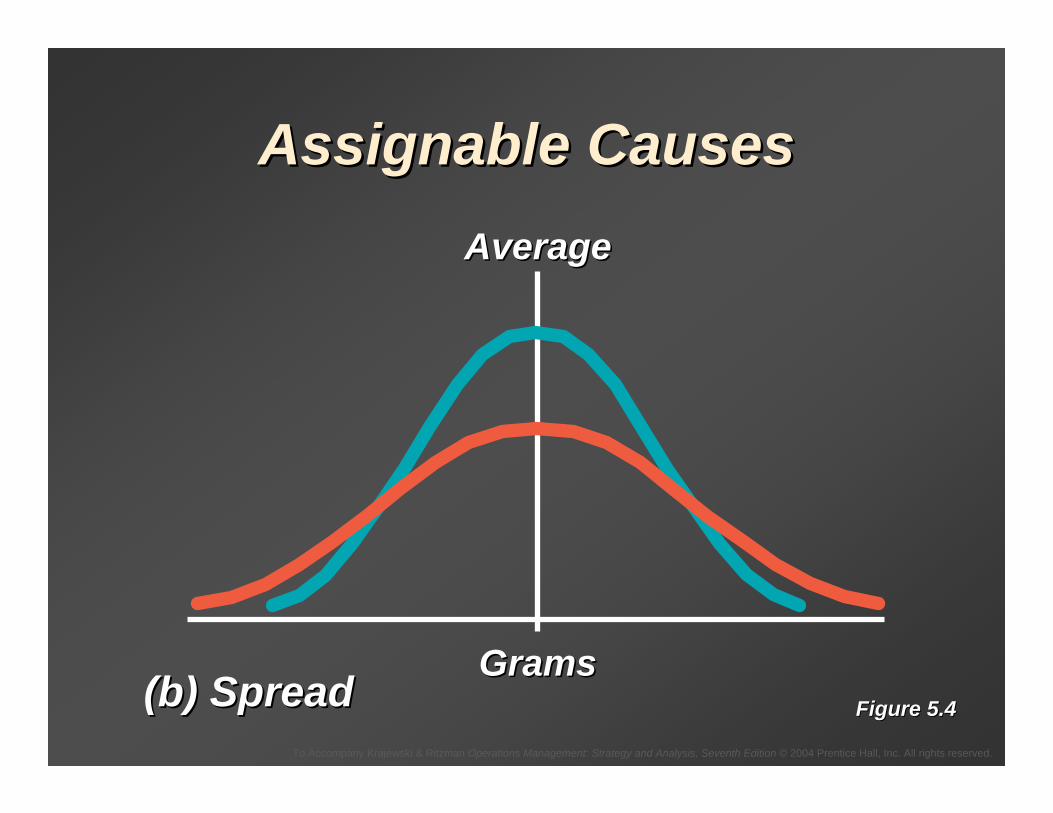
Assignable CausesAssignable Causes
(b) Spread(b) Spread GramsGrams
AverageAverage
Figure 5.4Figure 5.4
To Accompany Krajewski & Ritzman Operations Management: Strategy and Analysis, Seventh Edition © 2004 Prentice Hall, Inc. All rights reserved.
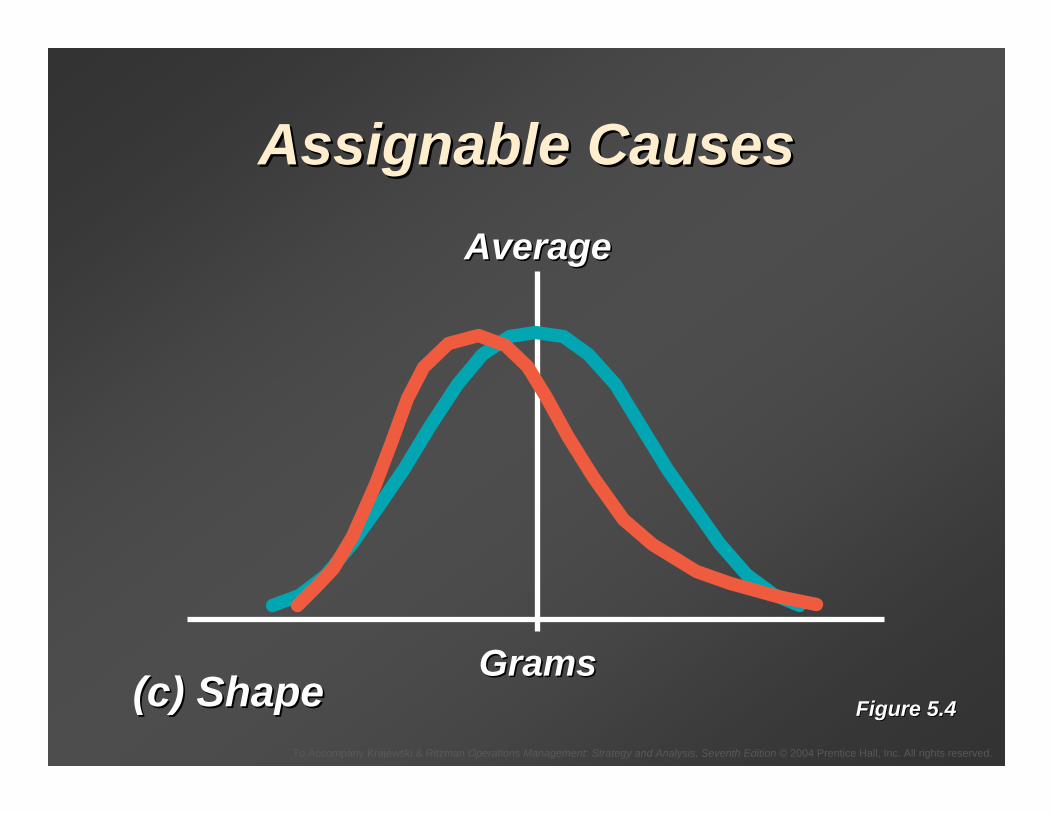
Assignable CausesAssignable Causes
(c) Shape(c) Shape GramsGrams
AverageAverage
Figure 5.4Figure 5.4
To Accompany Krajewski & Ritzman Operations Management: Strategy and Analysis, Seventh Edition © 2004 Prentice Hall, Inc. All rights reserved.
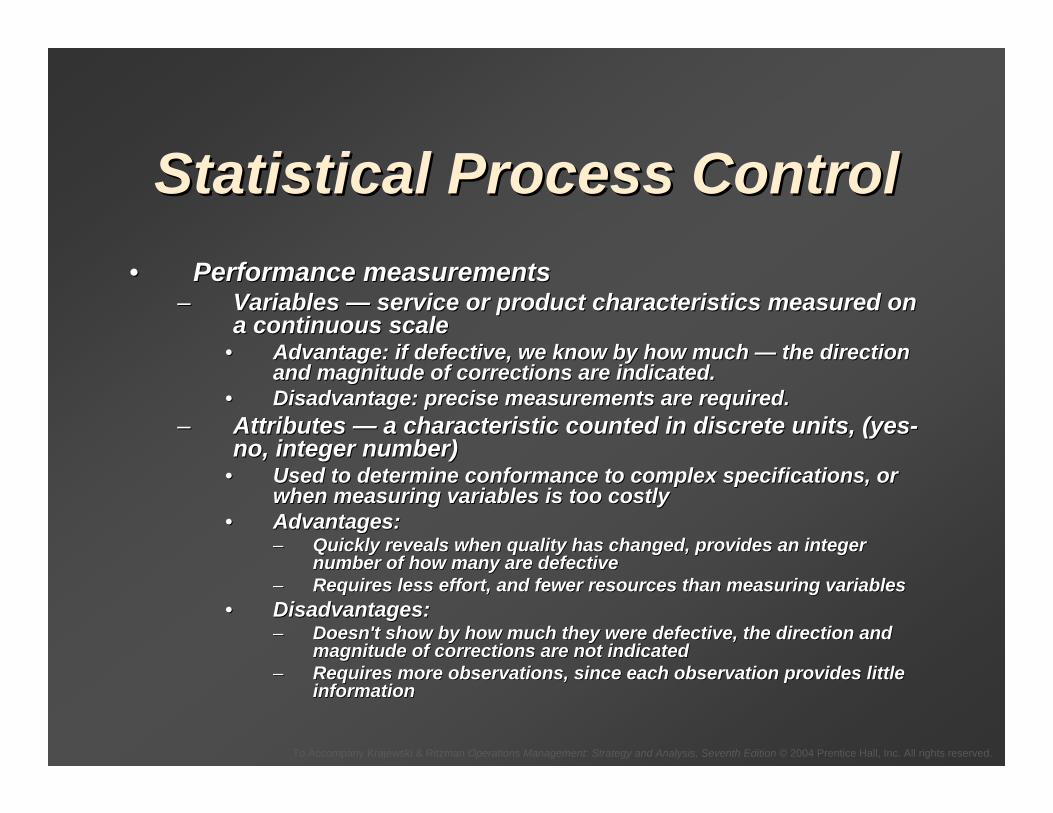
Statistical Process ControlStatistical Process Control•• Performance measurements Performance measurements
–– Variables Variables —— service or product characteristics measured on service or product characteristics measured on a continuous scalea continuous scale
•• Advantage: if defective, we know by how much Advantage: if defective, we know by how much —— the direction the direction and magnitude of corrections are indicated.and magnitude of corrections are indicated.
•• Disadvantage: precise measurements are required.Disadvantage: precise measurements are required.–– Attributes Attributes —— a characteristic counted in discrete units, (yesa characteristic counted in discrete units, (yes--
no, integer number)no, integer number)•• Used to determine conformance to complex specifications, or Used to determine conformance to complex specifications, or
when measuring variables is too costlywhen measuring variables is too costly•• Advantages: Advantages:
–– Quickly reveals when quality has changed, provides an integer Quickly reveals when quality has changed, provides an integer number of how many are defectivenumber of how many are defective
–– Requires less effort, and fewer resources than measuring variablRequires less effort, and fewer resources than measuring variableses•• Disadvantages: Disadvantages:
–– Doesn't show by how much they were defective, the direction and Doesn't show by how much they were defective, the direction and magnitude of corrections are not indicatedmagnitude of corrections are not indicated
–– Requires more observations, since each observation provides littRequires more observations, since each observation provides little le informationinformation
To Accompany Krajewski & Ritzman Operations Management: Strategy and Analysis, Seventh Edition © 2004 Prentice Hall, Inc. All rights reserved.
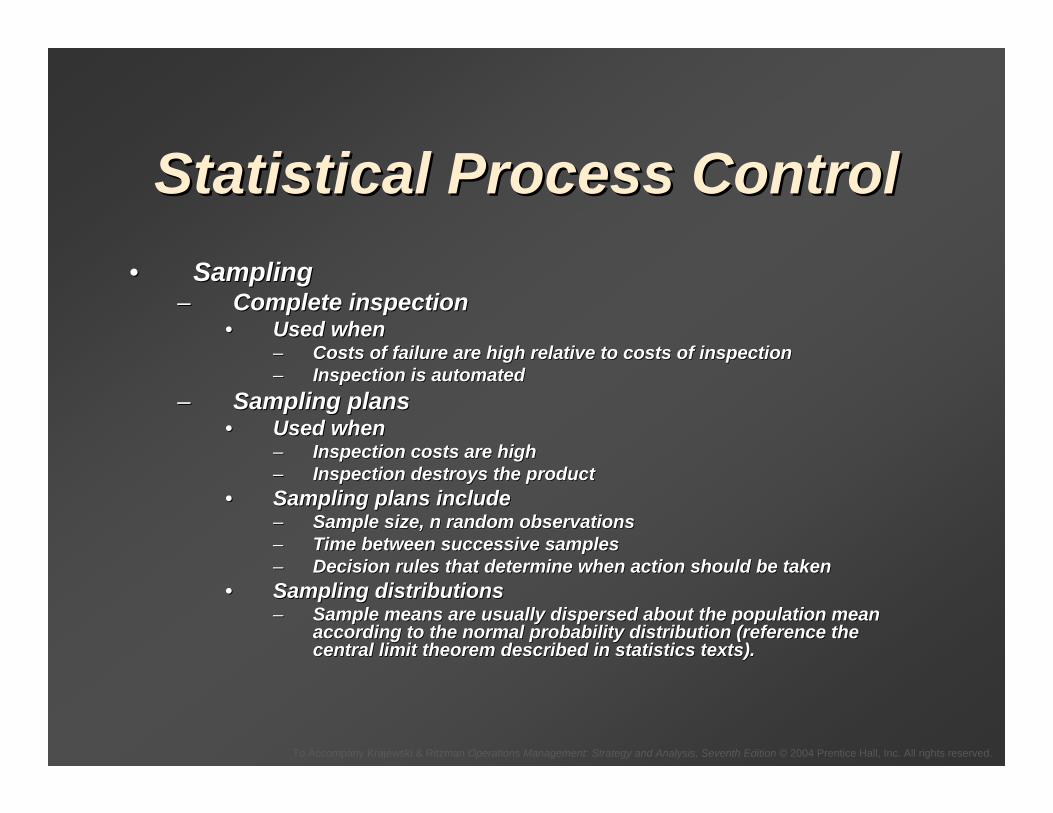
Statistical Process ControlStatistical Process Control•• SamplingSampling
–– Complete inspectionComplete inspection•• Used whenUsed when
–– Costs of failure are high relative to costs of inspectionCosts of failure are high relative to costs of inspection–– Inspection is automatedInspection is automated
–– Sampling plansSampling plans•• Used when Used when
–– Inspection costs are highInspection costs are high–– Inspection destroys the productInspection destroys the product
•• Sampling plans includeSampling plans include–– Sample size, n random observationsSample size, n random observations–– Time between successive samplesTime between successive samples–– Decision rules that determine when action should be takenDecision rules that determine when action should be taken
•• Sampling distributionsSampling distributions–– Sample means are usually dispersed about the population mean Sample means are usually dispersed about the population mean
according to the normal probability distribution (reference the according to the normal probability distribution (reference the central limit theorem described in statistics texts).central limit theorem described in statistics texts).

To Accompany Krajewski & Ritzman Operations Management: Strategy and Analysis, Seventh Edition © 2004 Prentice Hall, Inc. All rights reserved.
Sample Means and theSample Means and theProcess DistributionProcess Distribution
Figure 5.5Figure 5.5
MeanMean
ProcessProcessdistributiondistribution
TimeTime
Distribution ofDistribution ofsample meanssample means

To Accompany Krajewski & Ritzman Operations Management: Strategy and Analysis, Seventh Edition © 2004 Prentice Hall, Inc. All rights reserved.
Statistical Process ControlStatistical Process Control•• Control chartsControl charts
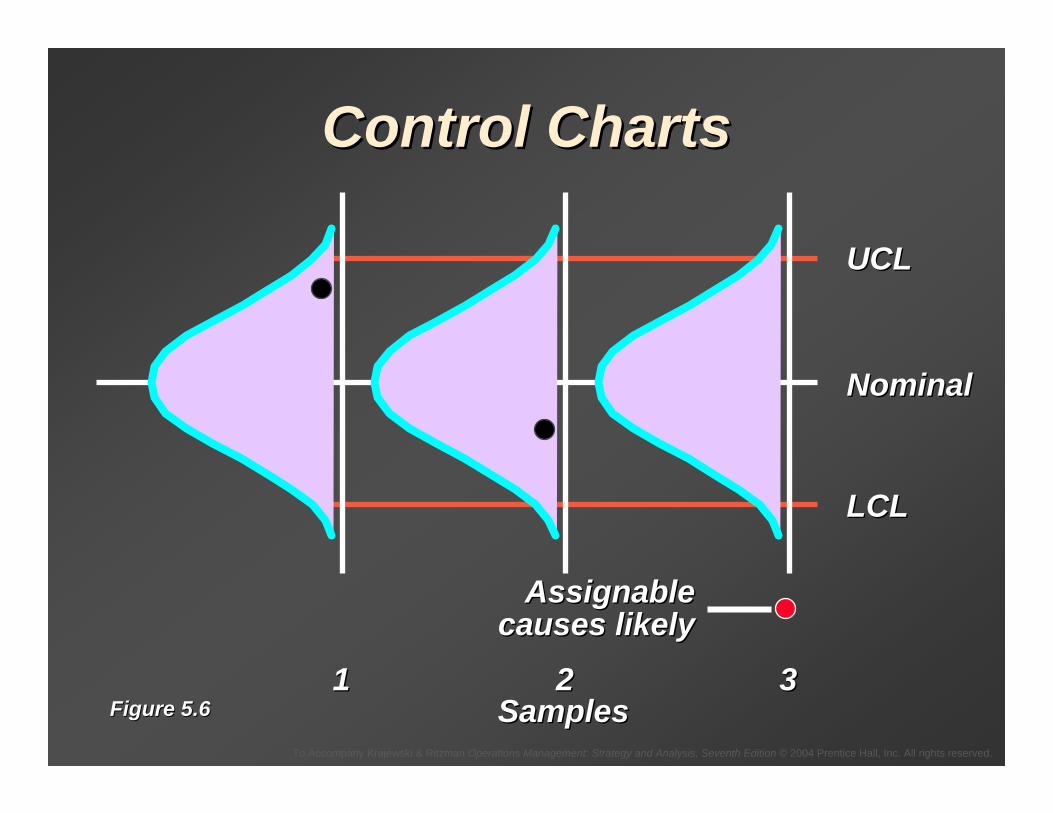
–– Used to judge whether action is requiredUsed to judge whether action is required–– A sample characteristic measured above the upper A sample characteristic measured above the upper
control limit (UCL) or below the lower control limit control limit (UCL) or below the lower control limit (LCL) indicates that an assignable cause probably (LCL) indicates that an assignable cause probably exists.exists.
–– Steps for using a control chart:Steps for using a control chart:•• Take a random sample, measure the quality Take a random sample, measure the quality
characteristic, and calculate a variable or attribute characteristic, and calculate a variable or attribute performance measure.performance measure.
•• Plot the statistic; if it falls outside the control limits, lookPlot the statistic; if it falls outside the control limits, lookfor assignable causes.for assignable causes.
•• Eliminate the cause if it degrades performance. Eliminate the cause if it degrades performance. Incorporate the cause if it improves performance. Incorporate the cause if it improves performance. Recalculate the control chart.Recalculate the control chart.
•• Periodically repeat the procedure.Periodically repeat the procedure.
To Accompany Krajewski & Ritzman Operations Management: Strategy and Analysis, Seventh Edition © 2004 Prentice Hall, Inc. All rights reserved.
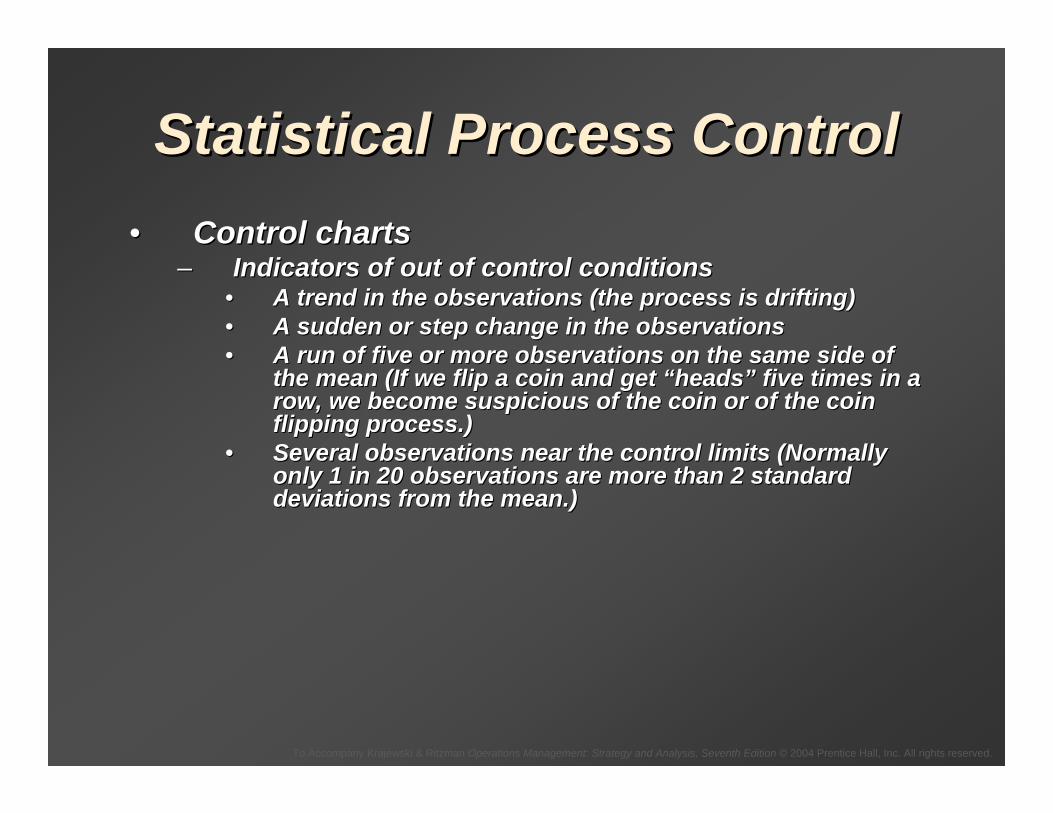
Statistical Process ControlStatistical Process Control•• Control chartsControl charts
–– Indicators of out of control conditionsIndicators of out of control conditions•• A trend in the observations (the process is drifting)A trend in the observations (the process is drifting)•• A sudden or step change in the observationsA sudden or step change in the observations•• A run of five or more observations on the same side of A run of five or more observations on the same side of
the mean (If we flip a coin and get the mean (If we flip a coin and get ““headsheads”” five times in a five times in a row, we become suspicious of the coin or of the coin row, we become suspicious of the coin or of the coin flipping process.)flipping process.)
•• Several observations near the control limits (Normally Several observations near the control limits (Normally only 1 in 20 observations are more than 2 standard only 1 in 20 observations are more than 2 standard deviations from the mean.) deviations from the mean.)
To Accompany Krajewski & Ritzman Operations Management: Strategy and Analysis, Seventh Edition © 2004 Prentice Hall, Inc. All rights reserved.
Control ChartsControl Charts
UCLUCL
NominalNominal
LCLLCL
SamplesSamplesFigure 5.6Figure 5.6
Assignable Assignable causes likelycauses likely
11 22 33
To Accompany Krajewski & Ritzman Operations Management: Strategy and Analysis, Seventh Edition © 2004 Prentice Hall, Inc. All rights reserved.
Using Control Charts for Using Control Charts for Process ImprovementProcess Improvement
•• Sample the processSample the process•• When changes are indicated, When changes are indicated,
find the assignable causefind the assignable cause•• Eliminate problems, incorporate Eliminate problems, incorporate
improvementsimprovements•• Repeat the procedureRepeat the procedure

To Accompany Krajewski & Ritzman Operations Management: Strategy and Analysis, Seventh Edition © 2004 Prentice Hall, Inc. All rights reserved.
Control Chart ExamplesControl Chart Examples
NominalNominal
UCLUCL
LCLLCL
Sample numberSample number
Varia
tions
Varia
tions
Figure 5.7 (a)Figure 5.7 (a)
To Accompany Krajewski & Ritzman Operations Management: Strategy and Analysis, Seventh Edition © 2004 Prentice Hall, Inc. All rights reserved.
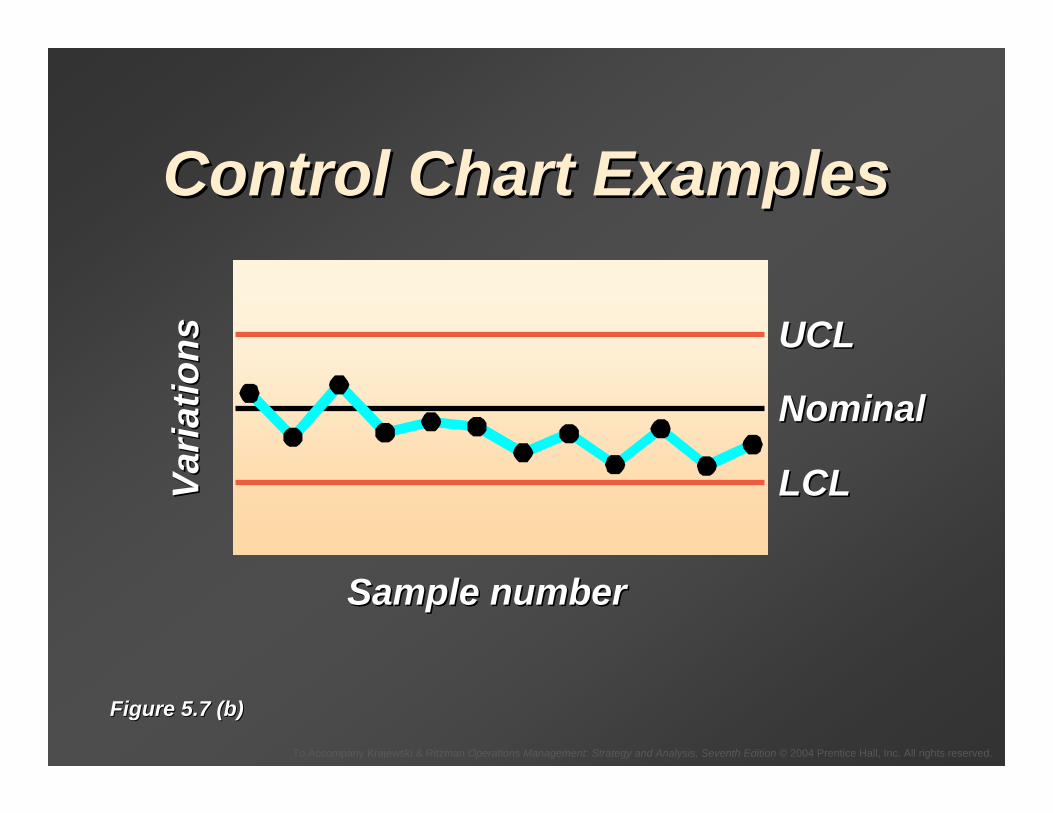
Control Chart ExamplesControl Chart Examples
NominalNominal
UCLUCL
LCLLCL
Sample numberSample number
Varia
tions
Varia
tions
Figure 5.7 (b)Figure 5.7 (b)

To Accompany Krajewski & Ritzman Operations Management: Strategy and Analysis, Seventh Edition © 2004 Prentice Hall, Inc. All rights reserved.
Control Chart ExamplesControl Chart Examples
NominalNominal
UCLUCL
LCLLCL
Sample numberSample number
Varia
tions
Varia
tions
Figure 5.7 (c)Figure 5.7 (c)
To Accompany Krajewski & Ritzman Operations Management: Strategy and Analysis, Seventh Edition © 2004 Prentice Hall, Inc. All rights reserved.
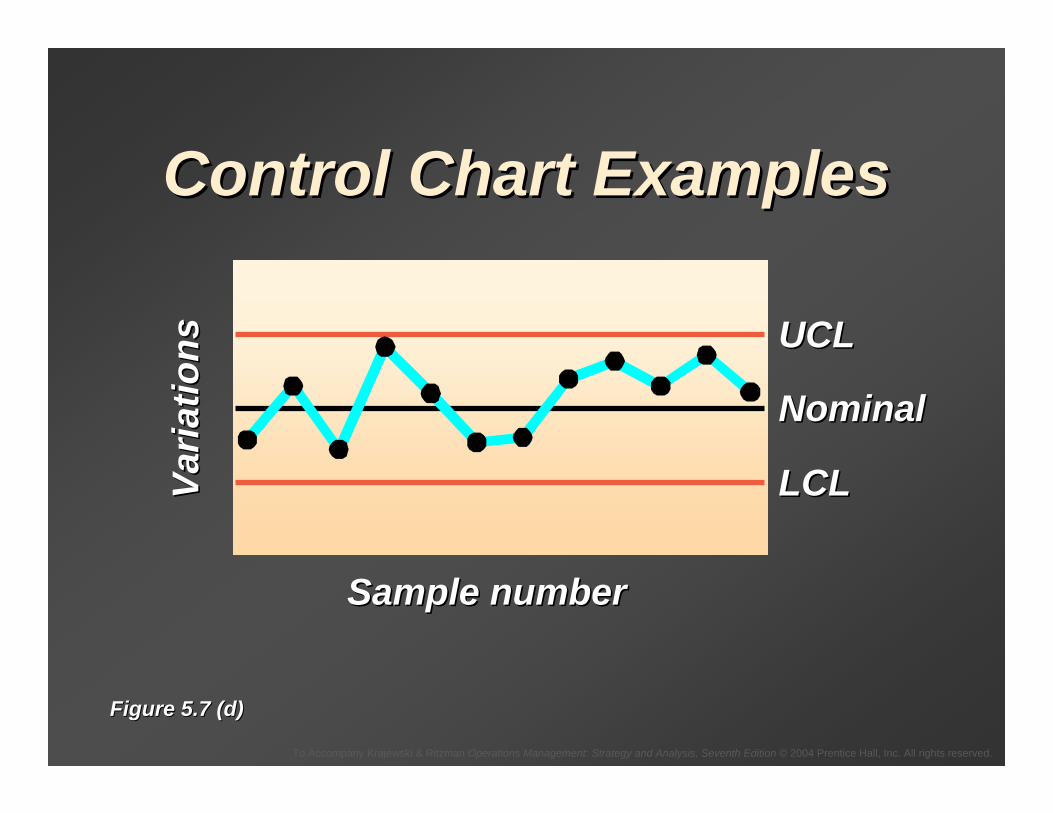
Control Chart ExamplesControl Chart Examples
NominalNominal
UCLUCL
LCLLCL
Sample numberSample number
Varia
tions
Varia
tions
Figure 5.7 (d)Figure 5.7 (d)

To Accompany Krajewski & Ritzman Operations Management: Strategy and Analysis, Seventh Edition © 2004 Prentice Hall, Inc. All rights reserved.
Control Chart ExamplesControl Chart Examples
NominalNominal
UCLUCL
LCLLCL
Sample numberSample number
Varia
tions
Varia
tions
Figure 5.7 (e)Figure 5.7 (e)

To Accompany Krajewski & Ritzman Operations Management: Strategy and Analysis, Seventh Edition © 2004 Prentice Hall, Inc. All rights reserved.
Statistical Process ControlStatistical Process Control•• Control charts for variablesControl charts for variables
–– Process performance characteristics include Process performance characteristics include variables, which are measured over a continuum.variables, which are measured over a continuum.
–– Range chartsRange charts•• Monitor process variabilityMonitor process variability
–– First remove assignable causes of variation.First remove assignable causes of variation.–– While process is in control, collect data to estimate While process is in control, collect data to estimate
the average range of output that occurs.the average range of output that occurs.–– To establish the upper and lower control limits for To establish the upper and lower control limits for
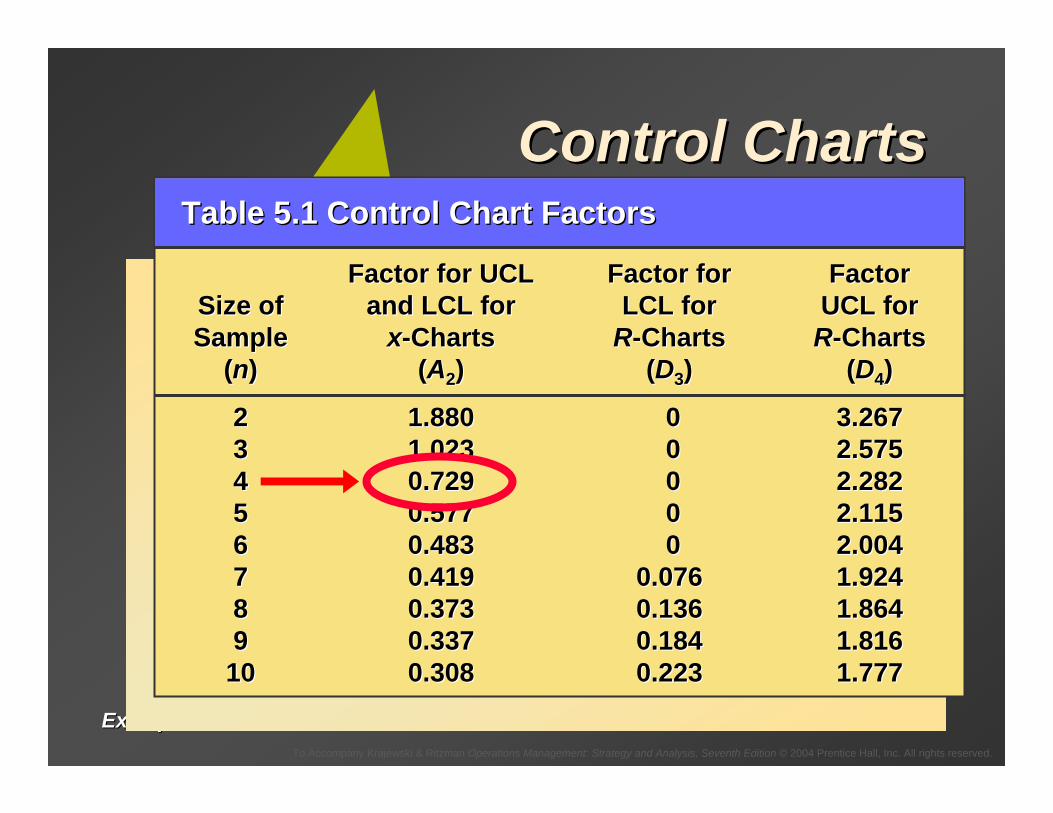
the Rthe R--chart, we use Table 5.1, which provides two chart, we use Table 5.1, which provides two factors; D3 and D4. These factors establish the factors; D3 and D4. These factors establish the UCLR and LCLR at three standard deviations above UCLR and LCLR at three standard deviations above and below . and below .
UCLR = D4 R
LCLR = D3 R
To Accompany Krajewski & Ritzman Operations Management: Strategy and Analysis, Seventh Edition © 2004 Prentice Hall, Inc. All rights reserved.
Control ChartsControl Chartsfor Variablesfor Variables
West Allis IndustriesWest Allis Industries

To Accompany Krajewski & Ritzman Operations Management: Strategy and Analysis, Seventh Edition © 2004 Prentice Hall, Inc. All rights reserved.
Control ChartsControl Chartsfor Variablesfor Variables
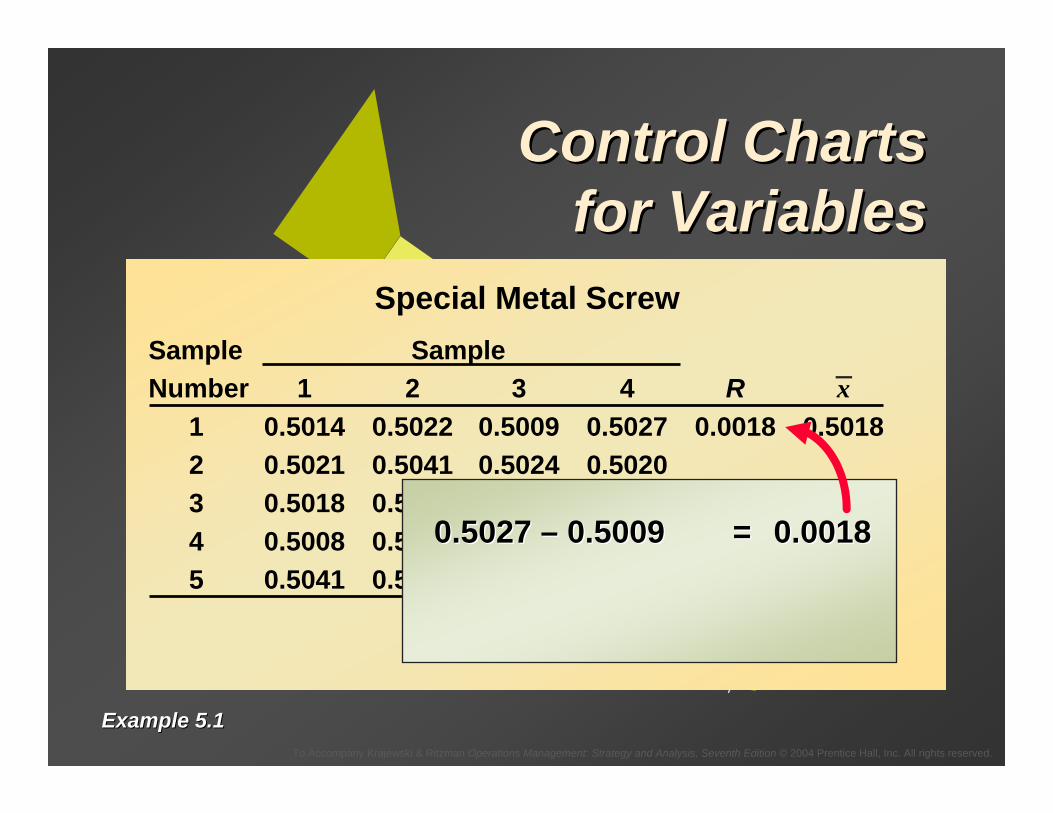
Example 5.1Example 5.1
Sample SampleNumber 1 2 3 4 R x
1 0.5014 0.5022 0.5009 0.50272 0.5021 0.5041 0.5024 0.50203 0.5018 0.5026 0.5035 0.50234 0.5008 0.5034 0.5024 0.50155 0.5041 0.5056 0.5034 0.5039
Special Metal Screw
_
To Accompany Krajewski & Ritzman Operations Management: Strategy and Analysis, Seventh Edition © 2004 Prentice Hall, Inc. All rights reserved.
Control ChartsControl Chartsfor Variablesfor Variables
Example 5.1Example 5.1
Sample SampleNumber 1 2 3 4 R x
1 0.5014 0.5022 0.5009 0.5027 0.0018 0.50182 0.5021 0.5041 0.5024 0.50203 0.5018 0.5026 0.5035 0.50234 0.5008 0.5034 0.5024 0.50155 0.5041 0.5056 0.5034 0.5039
Special Metal Screw
_
0.5027 0.5027 –– 0.50090.5009 == 0.00180.0018

To Accompany Krajewski & Ritzman Operations Management: Strategy and Analysis, Seventh Edition © 2004 Prentice Hall, Inc. All rights reserved.
Control ChartsControl Chartsfor Variablesfor Variables
Example 5.1Example 5.1
Sample SampleNumber 1 2 3 4 R x
1 0.5014 0.5022 0.5009 0.5027 0.0018 0.50182 0.5021 0.5041 0.5024 0.50203 0.5018 0.5026 0.5035 0.50234 0.5008 0.5034 0.5024 0.50155 0.5041 0.5056 0.5034 0.5039
Special Metal Screw
_
(0.5014 + 0.5022 +(0.5014 + 0.5022 +0.5009 + 0.5027)/40.5009 + 0.5027)/4 == 0.50180.5018
0.5027 0.5027 –– 0.50090.5009 == 0.00180.0018

To Accompany Krajewski & Ritzman Operations Management: Strategy and Analysis, Seventh Edition © 2004 Prentice Hall, Inc. All rights reserved.
Control ChartsControl Chartsfor Variablesfor Variables
Sample SampleNumber 1 2 3 4 R x
1 0.5014 0.5022 0.5009 0.5027 0.0018 0.50182 0.5021 0.5041 0.5024 0.5020 0.0021 0.50273 0.5018 0.5026 0.5035 0.5023 0.0017 0.50264 0.5008 0.5034 0.5024 0.5015 0.0026 0.50205 0.5041 0.5056 0.5034 0.5047 0.0022 0.5045
R = 0.0021x = 0.5027
Special Metal Screw
Example 5.1Example 5.1
=
_
To Accompany Krajewski & Ritzman Operations Management: Strategy and Analysis, Seventh Edition © 2004 Prentice Hall, Inc. All rights reserved.
Example 5.1Example 5.1
Control ChartsControl Chartsfor Variablesfor Variables
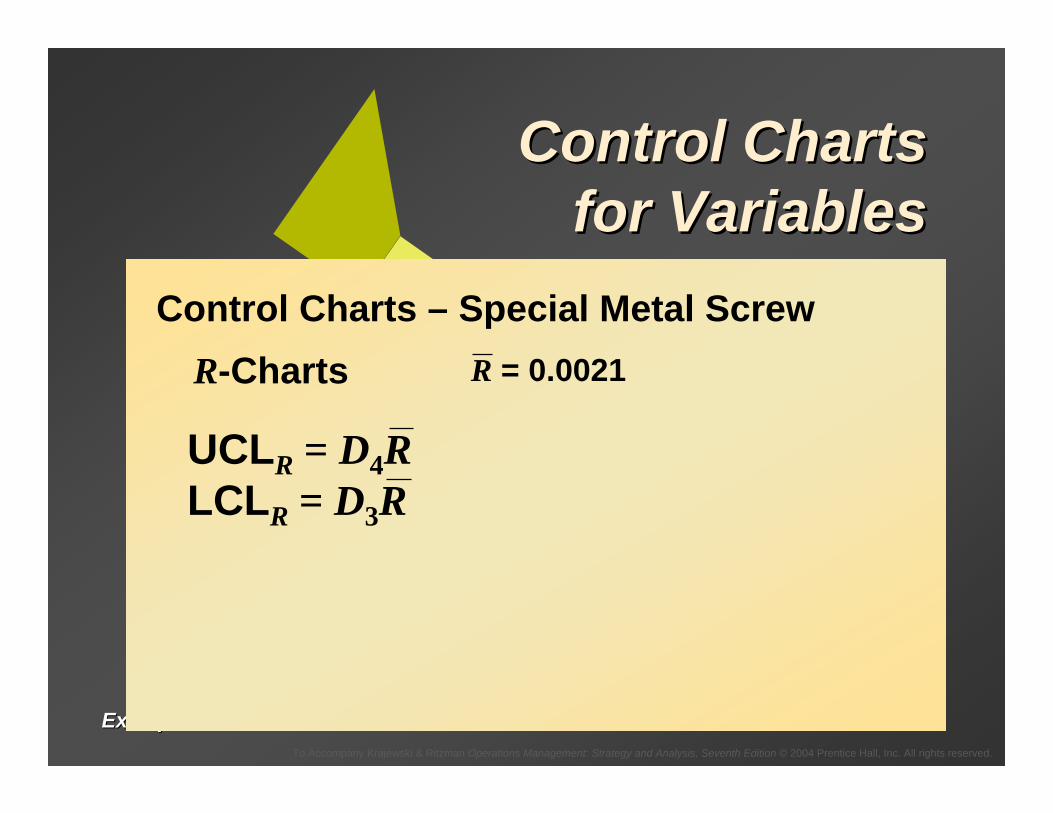
Control Charts – Special Metal ScrewR-Charts R = 0.0021
UCLR = D4RLCLR = D3R
To Accompany Krajewski & Ritzman Operations Management: Strategy and Analysis, Seventh Edition © 2004 Prentice Hall, Inc. All rights reserved.
Example 5.1Example 5.1
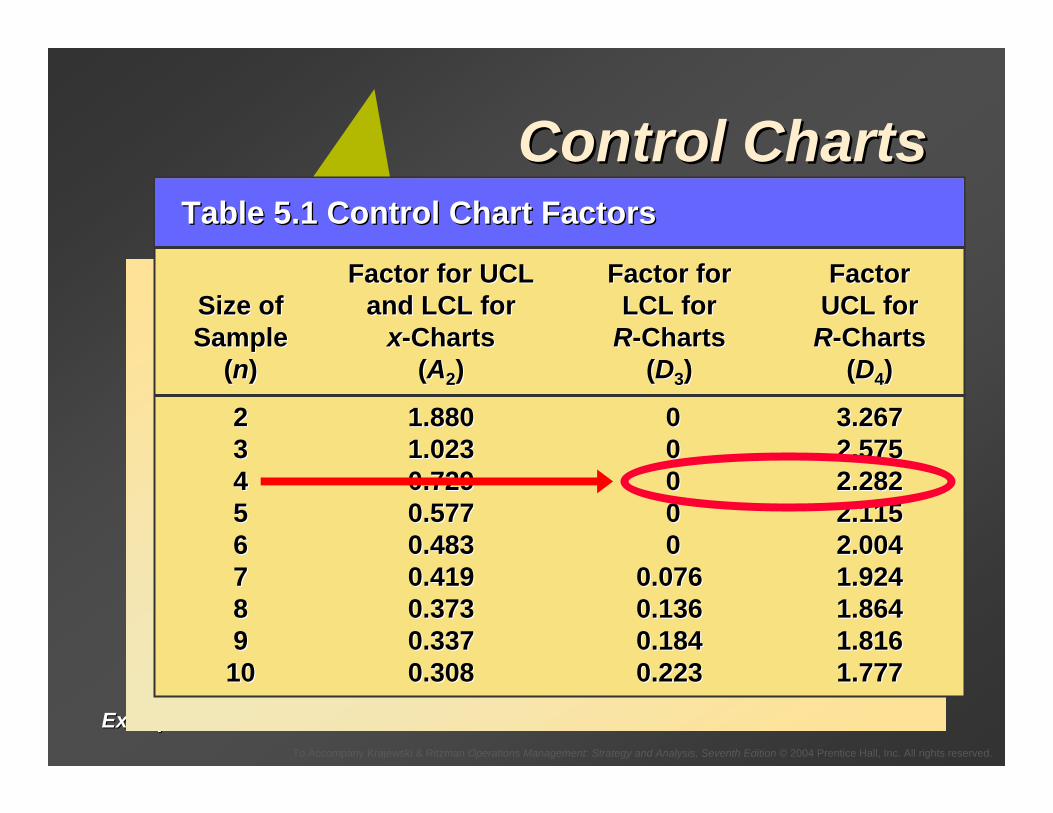
Control ChartsControl Chartsfor Variablesfor VariablesTable 5.1 Control Chart FactorsTable 5.1 Control Chart Factors
Factor for UCLFactor for UCL Factor forFactor for FactorFactorSize ofSize of and LCL forand LCL for LCL forLCL for UCL forUCL forSampleSample xx--ChartsCharts RR--ChartsCharts RR--ChartsCharts
((nn)) ((AA22)) ((DD33)) ((DD44))
22 1.8801.880 00 3.2673.26733 1.0231.023 00 2.5752.57544 0.7290.729 00 2.2822.28255 0.5770.577 00 2.1152.11566 0.4830.483 00 2.0042.00477 0.4190.419 0.0760.076 1.9241.92488 0.3730.373 0.1360.136 1.8641.86499 0.3370.337 0.1840.184 1.8161.816
1010 0.3080.308 0.2230.223 1.7771.777
To Accompany Krajewski & Ritzman Operations Management: Strategy and Analysis, Seventh Edition © 2004 Prentice Hall, Inc. All rights reserved.
Example 5.1Example 5.1
Control ChartsControl Chartsfor Variablesfor Variables
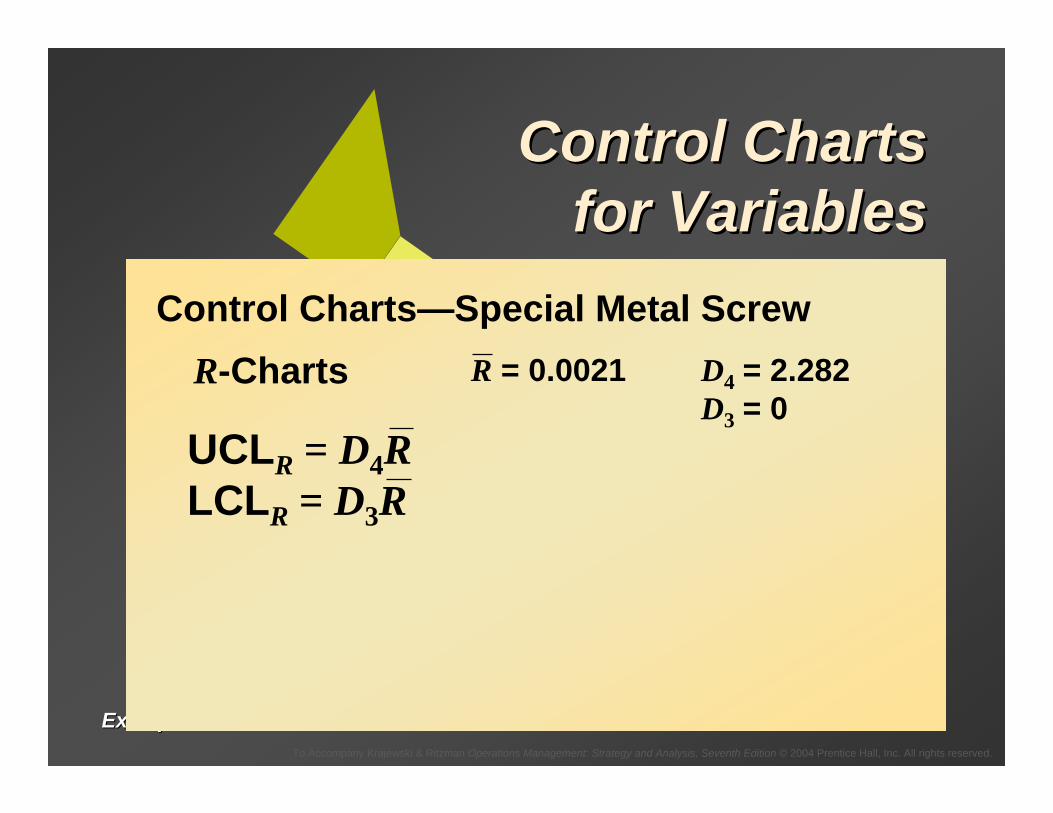
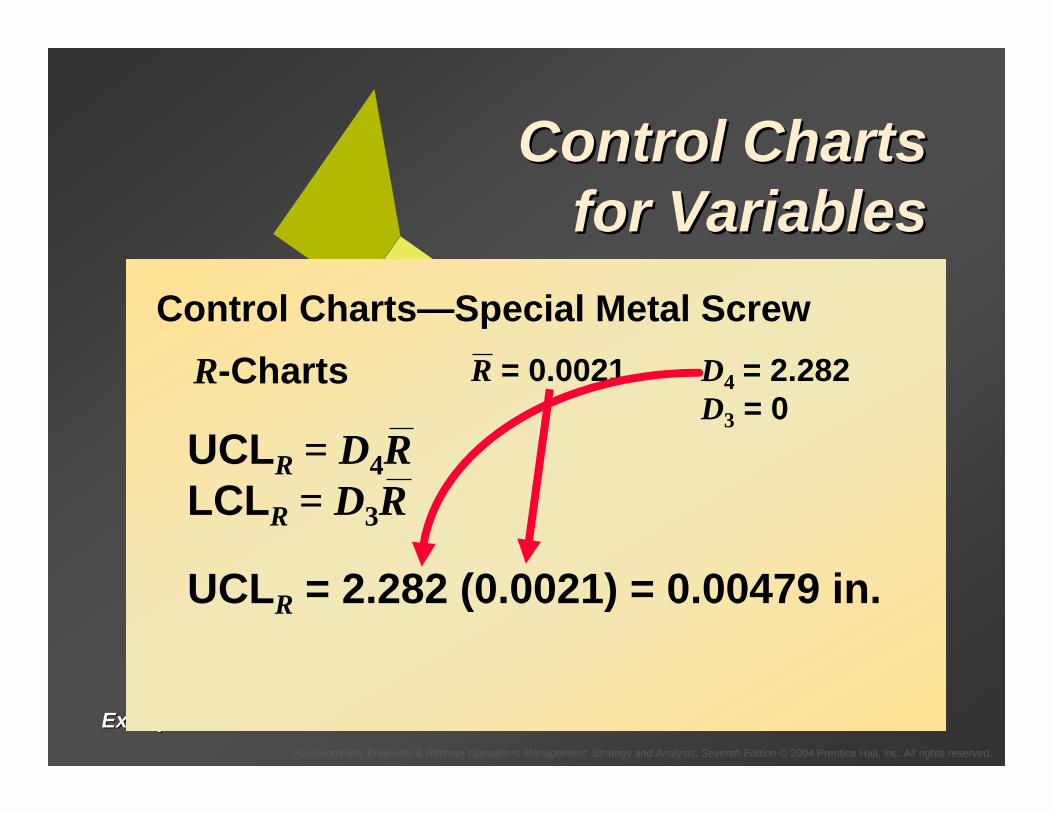
Control Charts—Special Metal ScrewR-Charts R = 0.0021 D4 = 2.282
D3 = 0UCLR = D4RLCLR = D3R
To Accompany Krajewski & Ritzman Operations Management: Strategy and Analysis, Seventh Edition © 2004 Prentice Hall, Inc. All rights reserved.
Example 5.1Example 5.1
Control ChartsControl Chartsfor Variablesfor Variables
Control Charts—Special Metal ScrewR-Charts R = 0.0021 D4 = 2.282
D3 = 0
UCLR = 2.282 (0.0021) = 0.00479 in.
UCLR = D4RLCLR = D3R

To Accompany Krajewski & Ritzman Operations Management: Strategy and Analysis, Seventh Edition © 2004 Prentice Hall, Inc. All rights reserved.
Example 5.1Example 5.1
Control ChartsControl Chartsfor Variablesfor Variables
Control Charts—Special Metal ScrewR-Charts R = 0.0021 D4 = 2.282
D3 = 0
UCLR = 2.282 (0.0021) = 0.00479 in.LCLR = 0 (0.0021) = 0 in.
UCLR = D4RLCLR = D3R
To Accompany Krajewski & Ritzman Operations Management: Strategy and Analysis, Seventh Edition © 2004 Prentice Hall, Inc. All rights reserved.
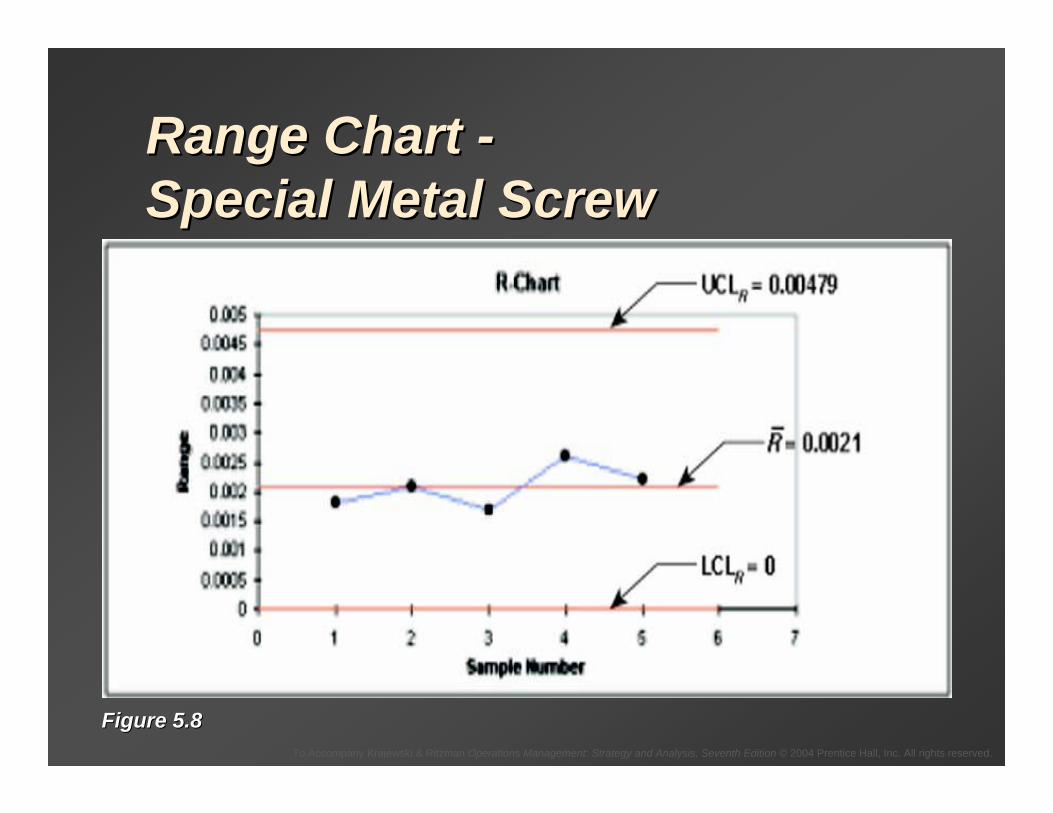
Range Chart Range Chart --Special Metal ScrewSpecial Metal Screw
Figure 5.8Figure 5.8
To Accompany Krajewski & Ritzman Operations Management: Strategy and Analysis, Seventh Edition © 2004 Prentice Hall, Inc. All rights reserved.
Example 5.1Example 5.1
Control ChartsControl Chartsfor Variablesfor Variables
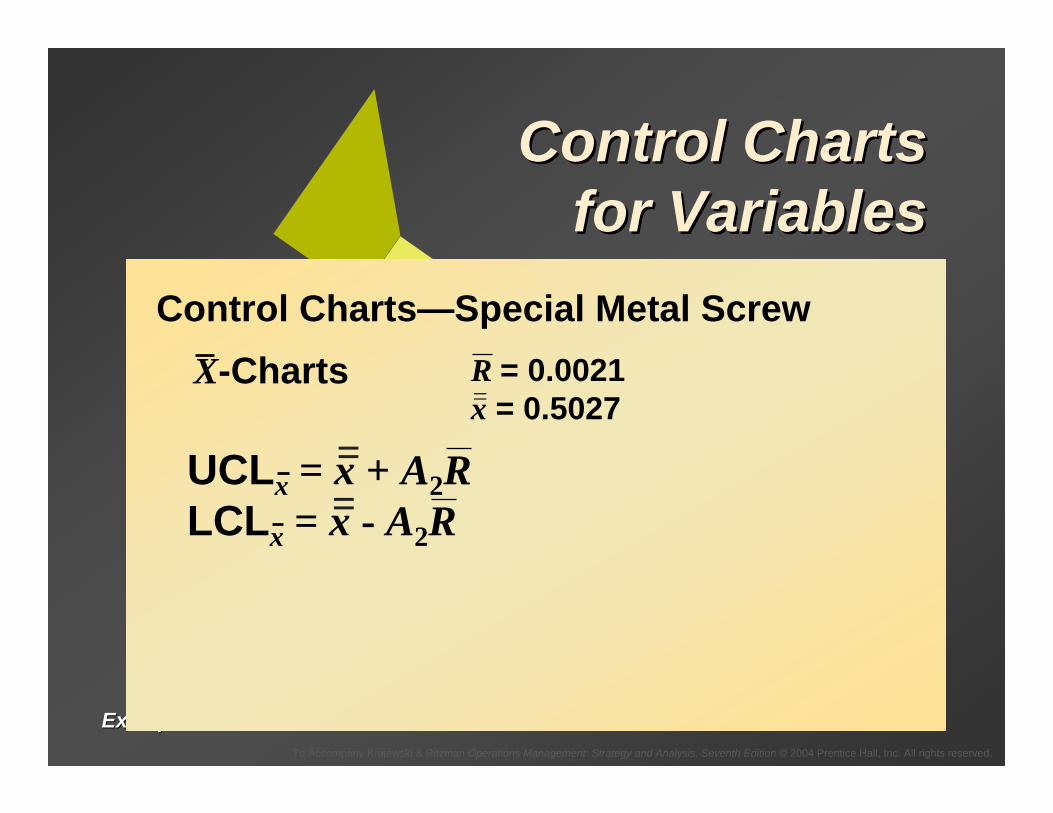
Control Charts—Special Metal ScrewX-Charts
UCLx = x + A2RLCLx = x - A2R
==
R = 0.0021x = 0.5027=
To Accompany Krajewski & Ritzman Operations Management: Strategy and Analysis, Seventh Edition © 2004 Prentice Hall, Inc. All rights reserved.
Example 5.1Example 5.1
Control ChartsControl Chartsfor Variablesfor Variables
Control Charts—Special Metal ScrewX-Charts
UCLx = x + A2RLCLx = x - A2R
==
R = 0.0021x = 0.5027=
Table 5.1 Control Chart FactorsTable 5.1 Control Chart Factors
Factor for UCLFactor for UCL Factor forFactor for FactorFactorSize ofSize of and LCL forand LCL for LCL forLCL for UCL forUCL forSampleSample xx--ChartsCharts RR--ChartsCharts RR--ChartsCharts
((nn)) ((AA22)) ((DD33)) ((DD44))
22 1.8801.880 00 3.2673.26733 1.0231.023 00 2.5752.57544 0.7290.729 00 2.2822.28255 0.5770.577 00 2.1152.11566 0.4830.483 00 2.0042.00477 0.4190.419 0.0760.076 1.9241.92488 0.3730.373 0.1360.136 1.8641.86499 0.3370.337 0.1840.184 1.8161.816
1010 0.3080.308 0.2230.223 1.7771.777
To Accompany Krajewski & Ritzman Operations Management: Strategy and Analysis, Seventh Edition © 2004 Prentice Hall, Inc. All rights reserved.
Example 5.1Example 5.1
Control ChartsControl Chartsfor Variablesfor Variables
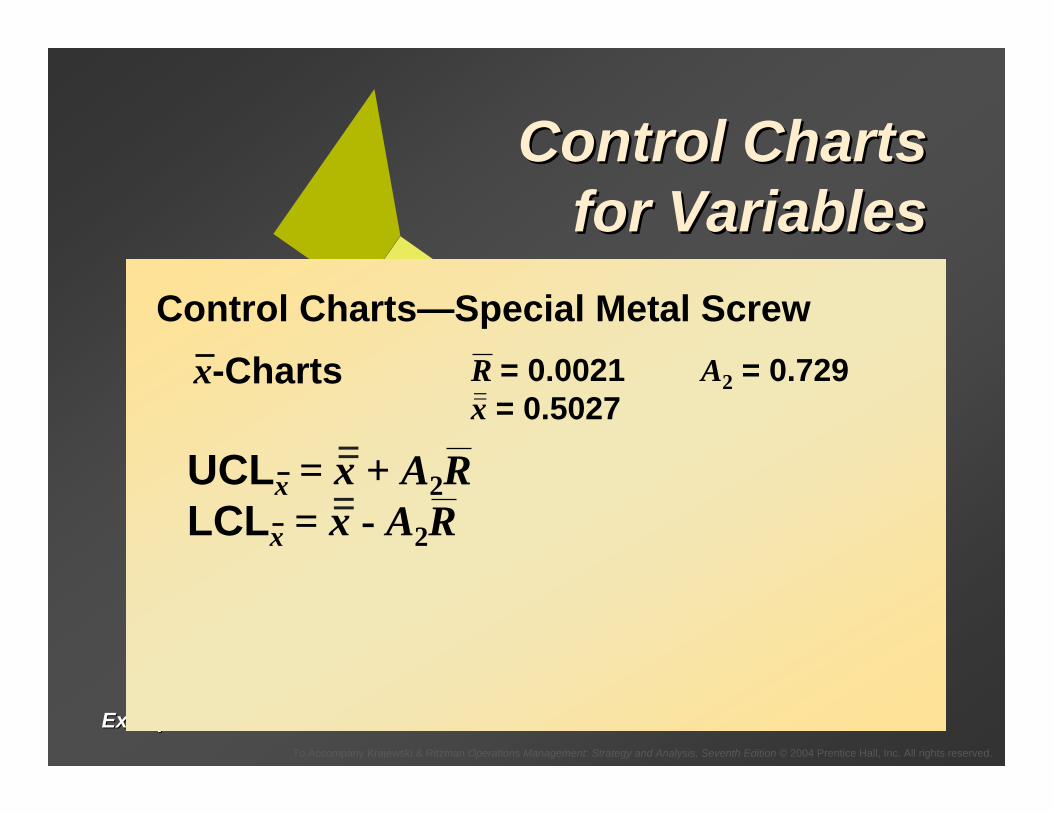
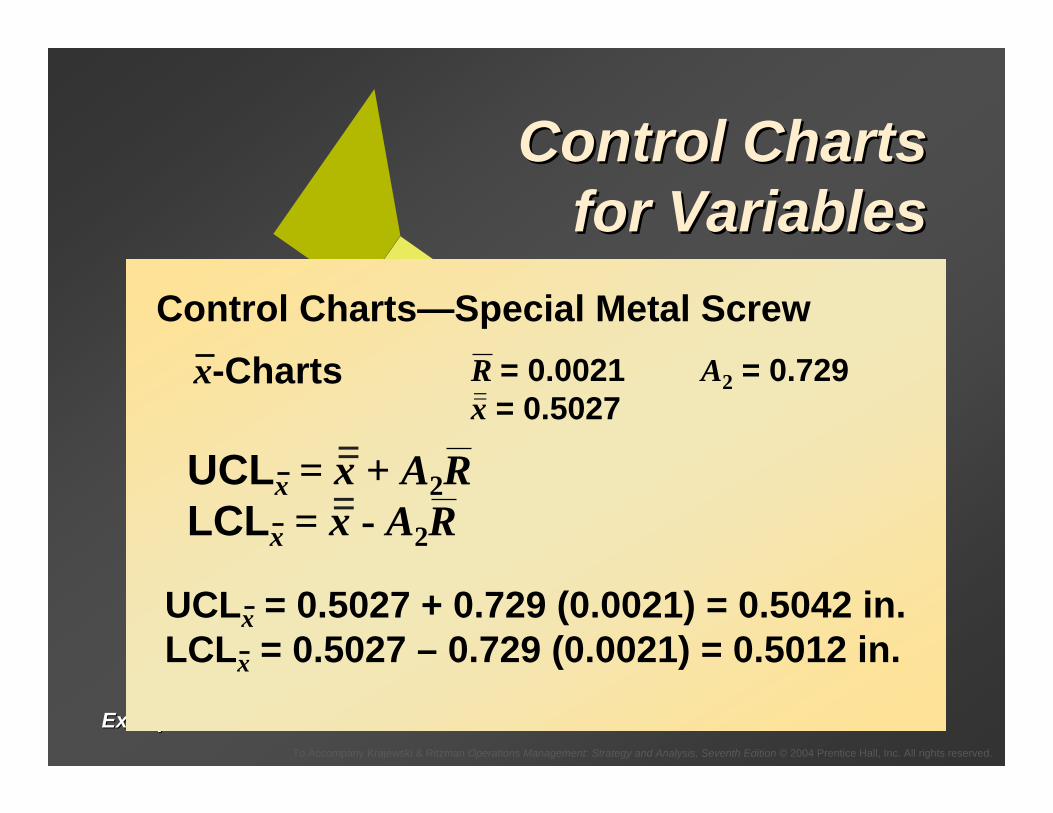
Control Charts—Special Metal Screwx-Charts
UCLx = x + A2RLCLx = x - A2R
==
R = 0.0021 A2 = 0.729x = 0.5027=

To Accompany Krajewski & Ritzman Operations Management: Strategy and Analysis, Seventh Edition © 2004 Prentice Hall, Inc. All rights reserved.
Example 5.1Example 5.1
Control ChartsControl Chartsfor Variablesfor Variables
Control Charts—Special Metal Screwx-Charts
UCLx = 0.5027 + 0.729 (0.0021) = 0.5042 in.
UCLx = x + A2RLCLx = x - A2R
==
R = 0.0021 A2 = 0.729x = 0.5027=
To Accompany Krajewski & Ritzman Operations Management: Strategy and Analysis, Seventh Edition © 2004 Prentice Hall, Inc. All rights reserved.
Example 5.1Example 5.1
Control ChartsControl Chartsfor Variablesfor Variables
Control Charts—Special Metal Screwx-Charts
UCLx = 0.5027 + 0.729 (0.0021) = 0.5042 in.LCLx = 0.5027 – 0.729 (0.0021) = 0.5012 in.
UCLx = x + A2RLCLx = x - A2R
==
R = 0.0021 A2 = 0.729x = 0.5027=
To Accompany Krajewski & Ritzman Operations Management: Strategy and Analysis, Seventh Edition © 2004 Prentice Hall, Inc. All rights reserved.
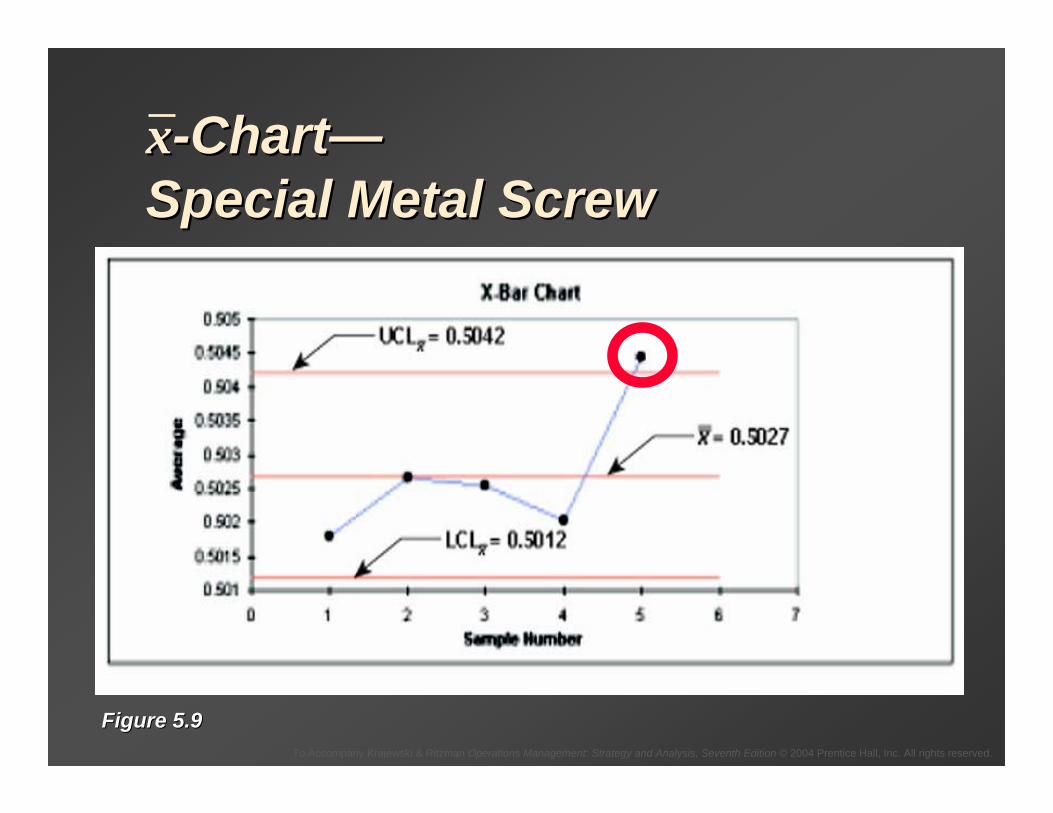
xx--ChartChart——Special Metal ScrewSpecial Metal Screw
Figure 5.9Figure 5.9
To Accompany Krajewski & Ritzman Operations Management: Strategy and Analysis, Seventh Edition © 2004 Prentice Hall, Inc. All rights reserved.
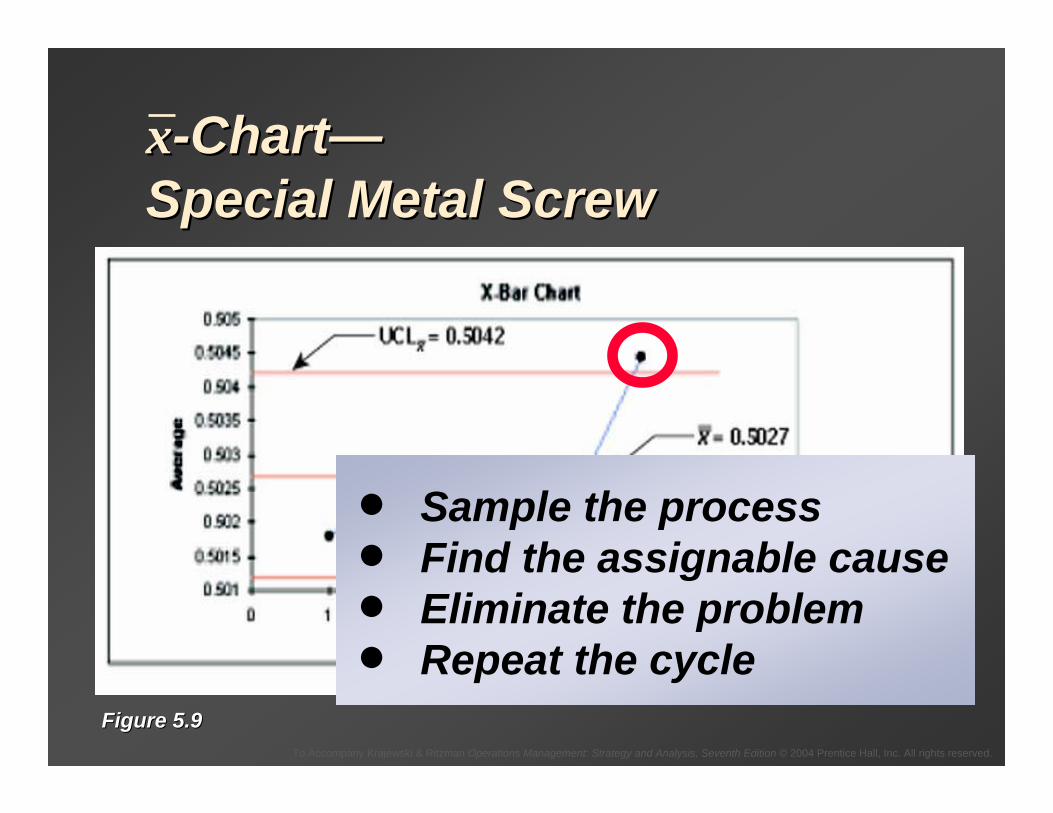
xx--ChartChart——Special Metal ScrewSpecial Metal Screw
Figure 5.9Figure 5.9
• Sample the process• Find the assignable cause• Eliminate the problem• Repeat the cycle
To Accompany Krajewski & Ritzman Operations Management: Strategy and Analysis, Seventh Edition © 2004 Prentice Hall, Inc. All rights reserved.
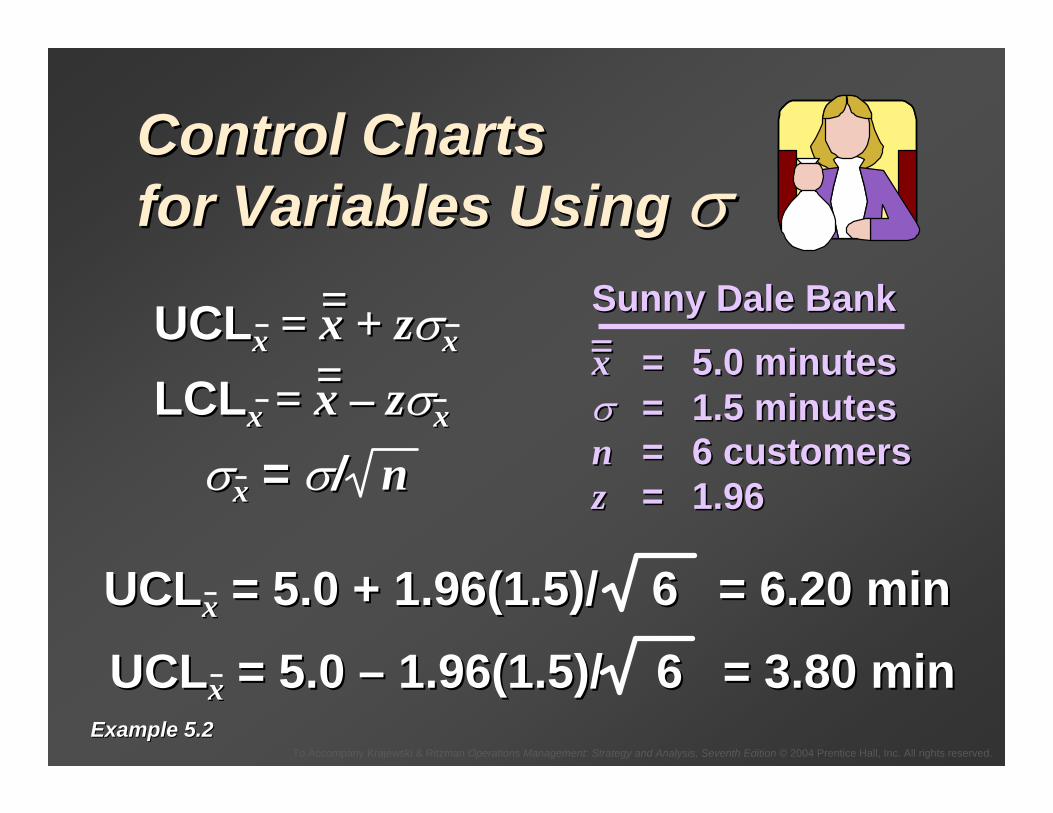
Control ChartsControl Chartsfor Variables Using for Variables Using σσ
UCLUCLxx = 5.0 + 1.96(1.5)/ 6 = 6.20 min= 5.0 + 1.96(1.5)/ 6 = 6.20 min
UCLUCLxx = 5.0 = 5.0 –– 1.96(1.5)/ 6 = 3.80 min1.96(1.5)/ 6 = 3.80 minExample 5.2Example 5.2
UCLUCLxx = = xx + + zzσσxx
LCLLCLxx = = xx –– zzσσxx
σσxx = = σσ// nn
====
Sunny Dale BankSunny Dale Bank
xx == 5.0 minutes5.0 minutesσσ == 1.5 minutes1.5 minutesnn == 6 customers6 customerszz == 1.961.96
==

To Accompany Krajewski & Ritzman Operations Management: Strategy and Analysis, Seventh Edition © 2004 Prentice Hall, Inc. All rights reserved.
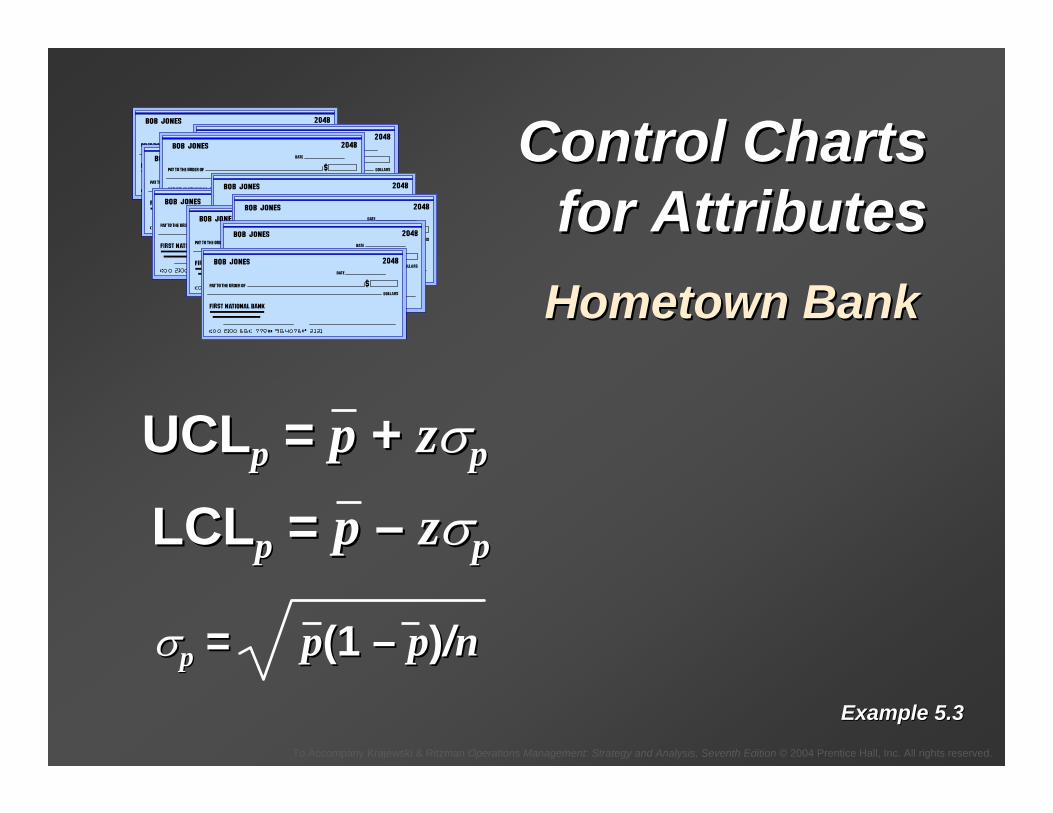
Control ChartsControl Chartsfor Attributesfor Attributes
HOMETOWN BANK
Hometown BankHometown Bank
To Accompany Krajewski & Ritzman Operations Management: Strategy and Analysis, Seventh Edition © 2004 Prentice Hall, Inc. All rights reserved.
Control ChartsControl Chartsfor Attributesfor AttributesHometown BankHometown Bank
UCLUCLpp = = pp + + zzσσpp
LCLLCLpp = = pp –– zzσσpp
σσpp = = pp(1 (1 –– pp))//nnExample 5.3Example 5.3

To Accompany Krajewski & Ritzman Operations Management: Strategy and Analysis, Seventh Edition © 2004 Prentice Hall, Inc. All rights reserved.
Example 5.3Example 5.3
Control ChartsControl Chartsfor Attributesfor AttributesHometown BankHometown Bank
UCLUCLpp = = pp + + zzσσpp
LCLLCLpp = = pp -- zzσσpp
σσpp = = pp(1 (1 -- pp))//nn
Sample WrongNumber Account Number
1 152 123 194 25 196 47 248 79 10
10 1711 1512 3
Total 147
Total defectivesTotal observationsp =
n = 2500
To Accompany Krajewski & Ritzman Operations Management: Strategy and Analysis, Seventh Edition © 2004 Prentice Hall, Inc. All rights reserved.
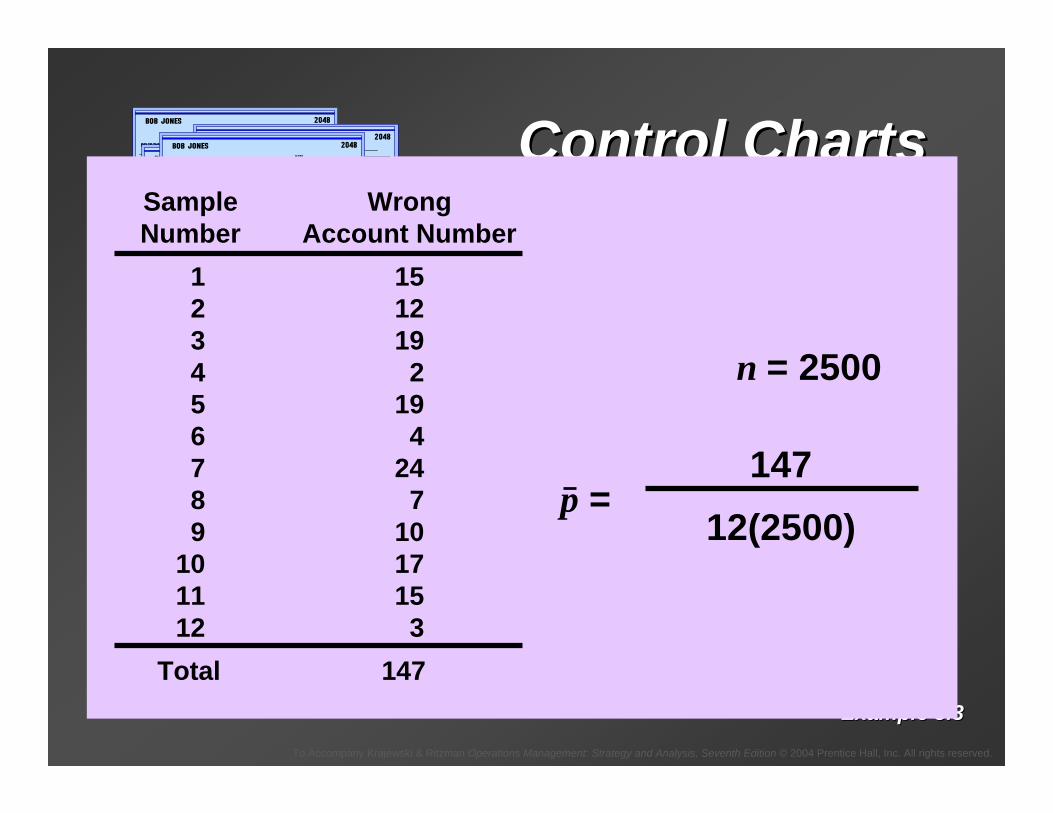
Example 5.3Example 5.3
Control ChartsControl Chartsfor Attributesfor AttributesHometown BankHometown Bank
UCLUCLpp = = pp + + zzσσpp
LCLLCLpp = = pp -- zzσσpp
σσpp = = pp(1 (1 -- pp))//nn
Sample WrongNumber Account Number
1 152 123 194 25 196 47 248 79 10
10 1711 1512 3
Total 147
14712(2500)
p =
n = 2500
To Accompany Krajewski & Ritzman Operations Management: Strategy and Analysis, Seventh Edition © 2004 Prentice Hall, Inc. All rights reserved.
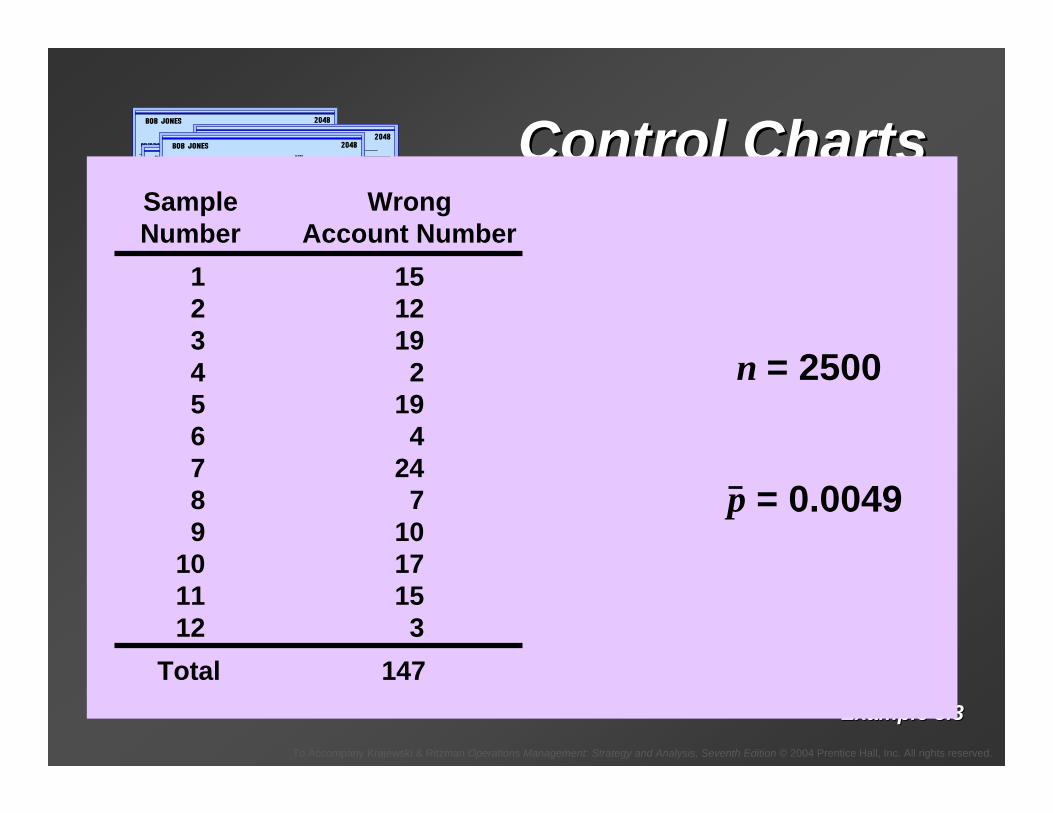
Example 5.3Example 5.3
Control ChartsControl Chartsfor Attributesfor AttributesHometown BankHometown Bank
UCLUCLpp = = pp + + zzσσpp
LCLLCLpp = = pp -- zzσσpp
σσpp = = pp(1 (1 -- pp))//nn
Sample WrongNumber Account Number
1 152 123 194 25 196 47 248 79 10
10 1711 1512 3
Total 147
p = 0.0049
n = 2500
To Accompany Krajewski & Ritzman Operations Management: Strategy and Analysis, Seventh Edition © 2004 Prentice Hall, Inc. All rights reserved.
Example 5.3Example 5.3
Control ChartsControl Chartsfor Attributesfor AttributesHometown BankHometown Bank
UCLUCLpp = = pp + + zzσσpp
LCLLCLpp = = pp -- zzσσpp
σσpp = = pp(1 (1 -- pp))//nn
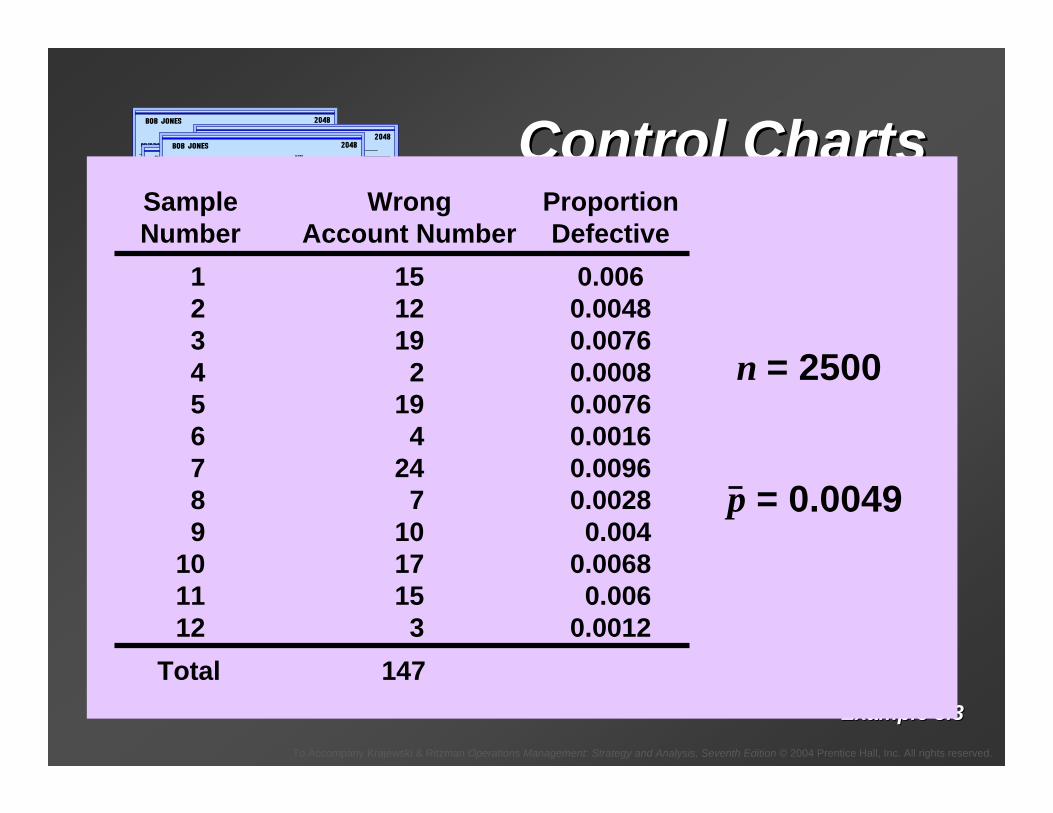
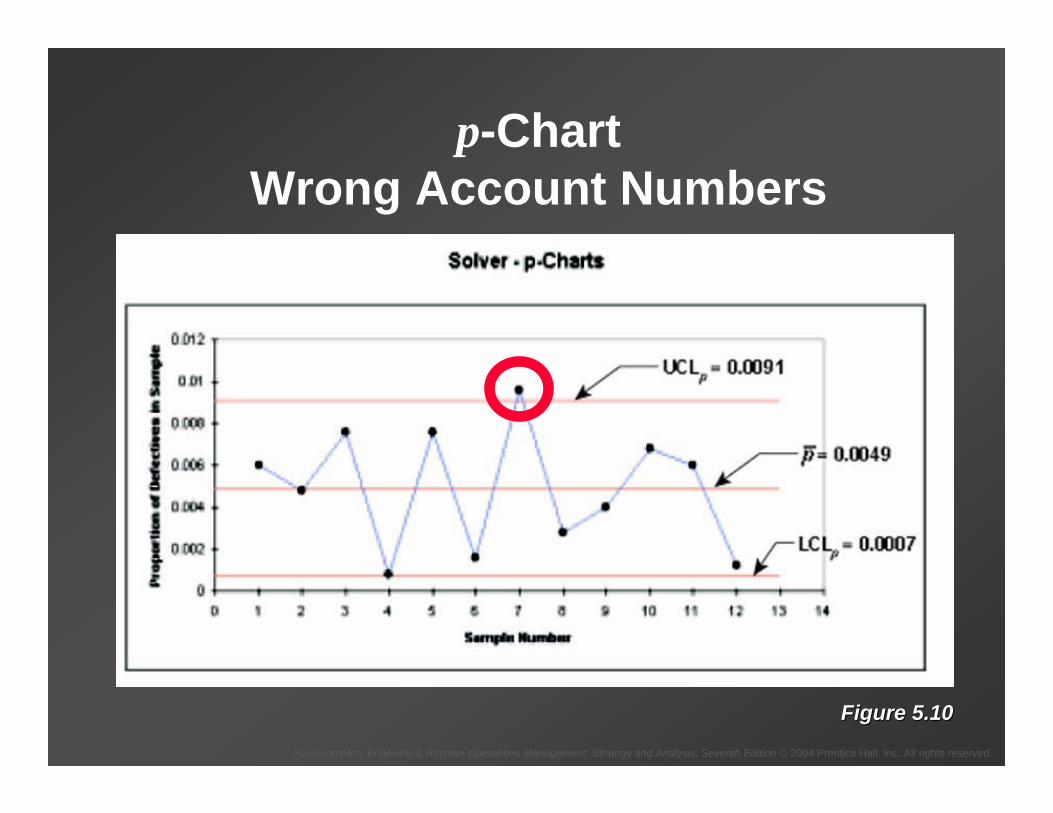
Sample Wrong ProportionNumber Account Number Defective
1 15 0.0062 12 0.00483 19 0.00764 2 0.00085 19 0.00766 4 0.00167 24 0.00968 7 0.00289 10 0.004
10 17 0.006811 15 0.00612 3 0.0012
Total 147
p = 0.0049
n = 2500
To Accompany Krajewski & Ritzman Operations Management: Strategy and Analysis, Seventh Edition © 2004 Prentice Hall, Inc. All rights reserved.
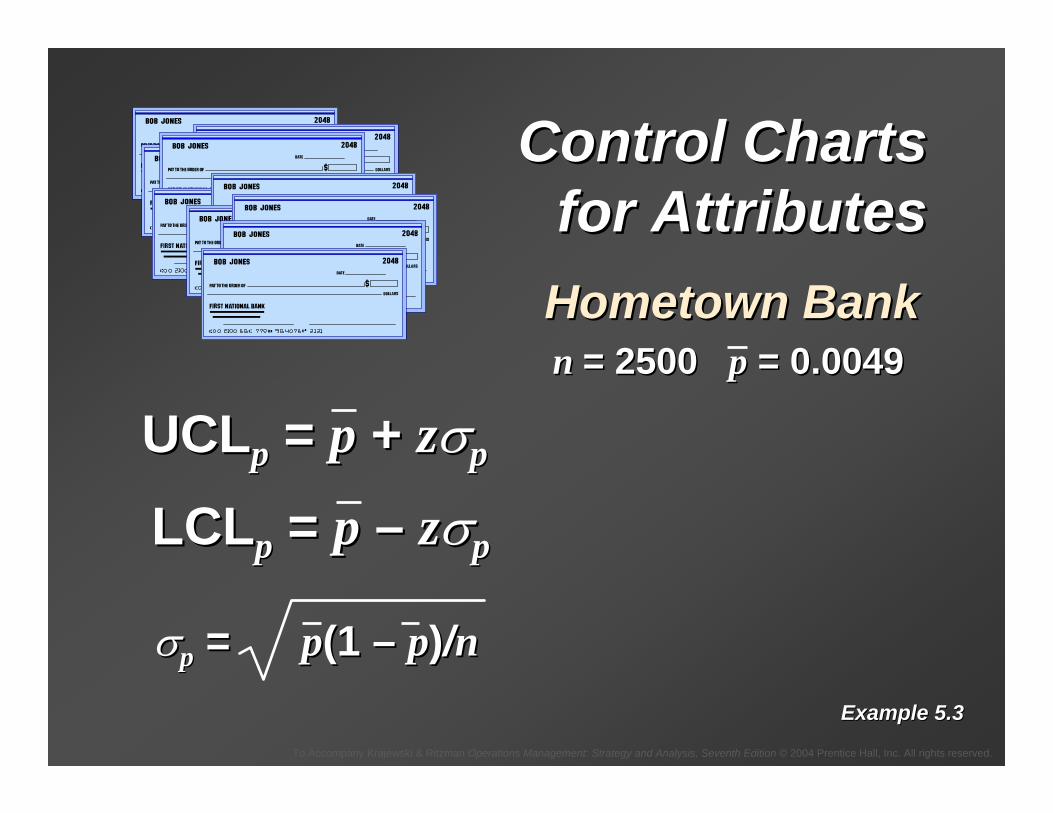
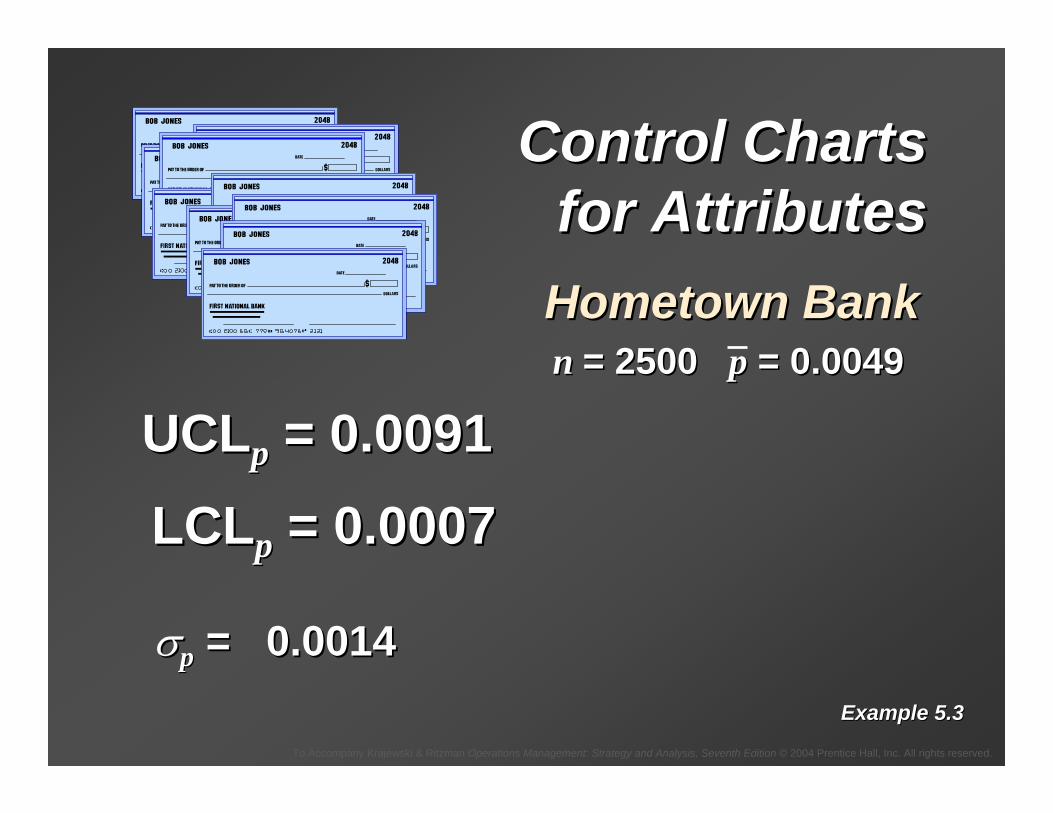
Control ChartsControl Chartsfor Attributesfor AttributesHometown BankHometown Bank
UCLUCLpp = = pp + + zzσσpp
LCLLCLpp = = pp –– zzσσpp
σσpp = = pp(1 (1 –– pp))//nn
n n = 2500 = 2500 pp = 0.0049= 0.0049
Example 5.3Example 5.3
To Accompany Krajewski & Ritzman Operations Management: Strategy and Analysis, Seventh Edition © 2004 Prentice Hall, Inc. All rights reserved.
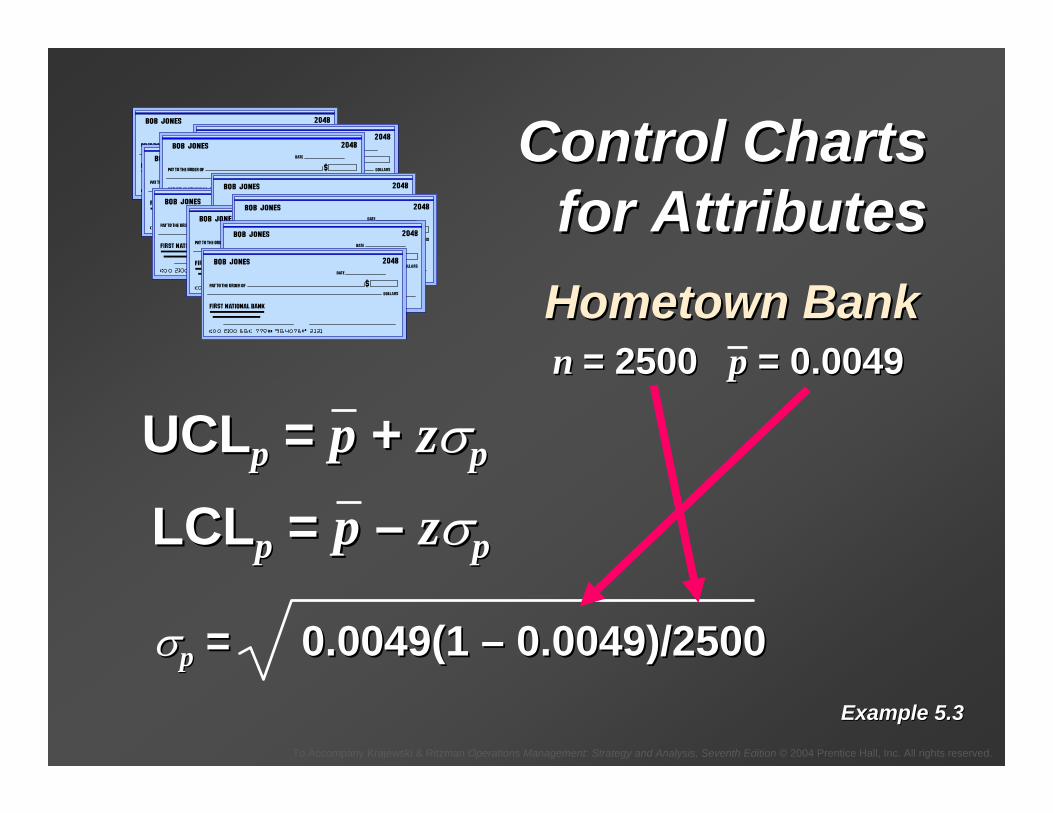
Control ChartsControl Chartsfor Attributesfor AttributesHometown BankHometown Bank
UCLUCLpp = = pp + + zzσσpp
LCLLCLpp = = pp –– zzσσpp
σσpp = 0.0049(1 = 0.0049(1 –– 0.0049)/25000.0049)/2500
n n = 2500 = 2500 pp = 0.0049= 0.0049
Example 5.3Example 5.3

To Accompany Krajewski & Ritzman Operations Management: Strategy and Analysis, Seventh Edition © 2004 Prentice Hall, Inc. All rights reserved.
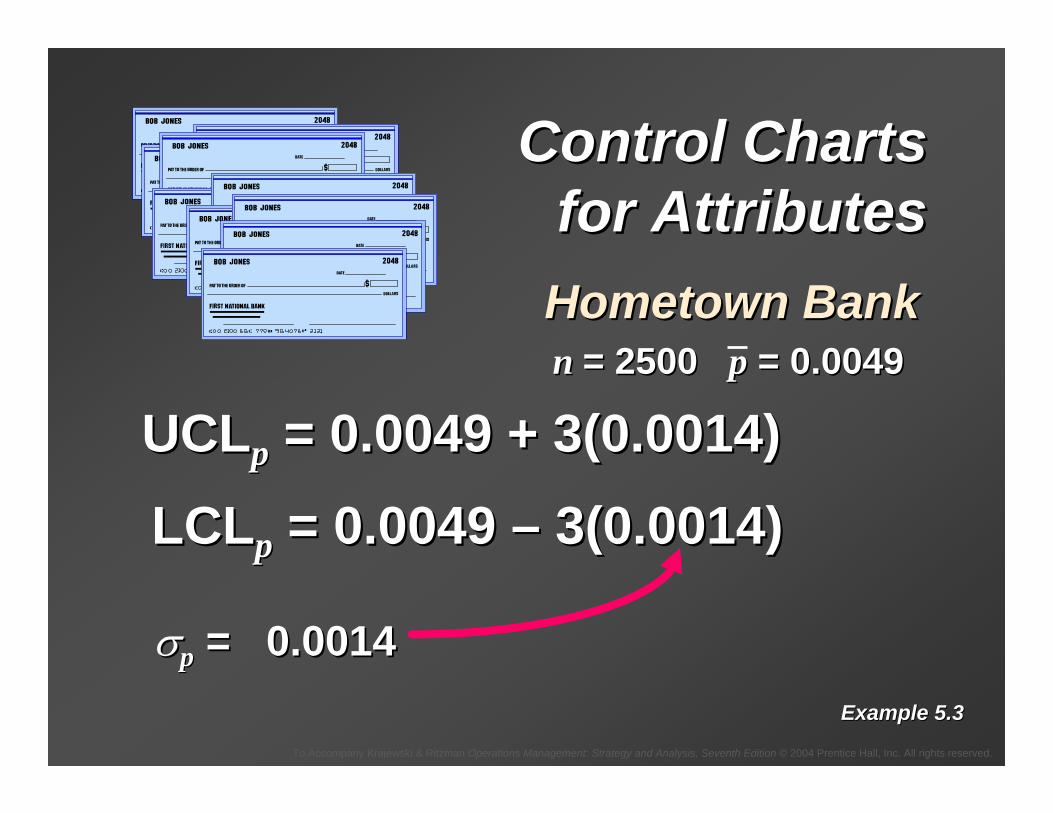
Control ChartsControl Chartsfor Attributesfor AttributesHometown BankHometown Bank
UCLUCLpp = = pp + + zzσσpp
LCLLCLpp = = pp –– zzσσpp
σσpp = 0.0014= 0.0014
n n = 2500 = 2500 pp = 0.0049= 0.0049
Example 5.3Example 5.3
To Accompany Krajewski & Ritzman Operations Management: Strategy and Analysis, Seventh Edition © 2004 Prentice Hall, Inc. All rights reserved.
Control ChartsControl Chartsfor Attributesfor AttributesHometown BankHometown Bank
σσpp = 0.0014= 0.0014
n n = 2500 = 2500 pp = 0.0049= 0.0049
Example 5.3Example 5.3
UCLUCLpp = 0.0049 + 3(0.0014)= 0.0049 + 3(0.0014)
LCLLCLpp = 0.0049 = 0.0049 –– 3(0.0014)3(0.0014)
To Accompany Krajewski & Ritzman Operations Management: Strategy and Analysis, Seventh Edition © 2004 Prentice Hall, Inc. All rights reserved.
UCLUCLpp = 0.0091= 0.0091
LCLLCLpp = 0.0007= 0.0007
Control ChartsControl Chartsfor Attributesfor AttributesHometown BankHometown Bank
σσpp = 0.0014= 0.0014
n n = 2500 = 2500 pp = 0.0049= 0.0049
Example 5.3Example 5.3
To Accompany Krajewski & Ritzman Operations Management: Strategy and Analysis, Seventh Edition © 2004 Prentice Hall, Inc. All rights reserved.
p-ChartWrong Account Numbers
Figure 5.10Figure 5.10
To Accompany Krajewski & Ritzman Operations Management: Strategy and Analysis, Seventh Edition © 2004 Prentice Hall, Inc. All rights reserved.
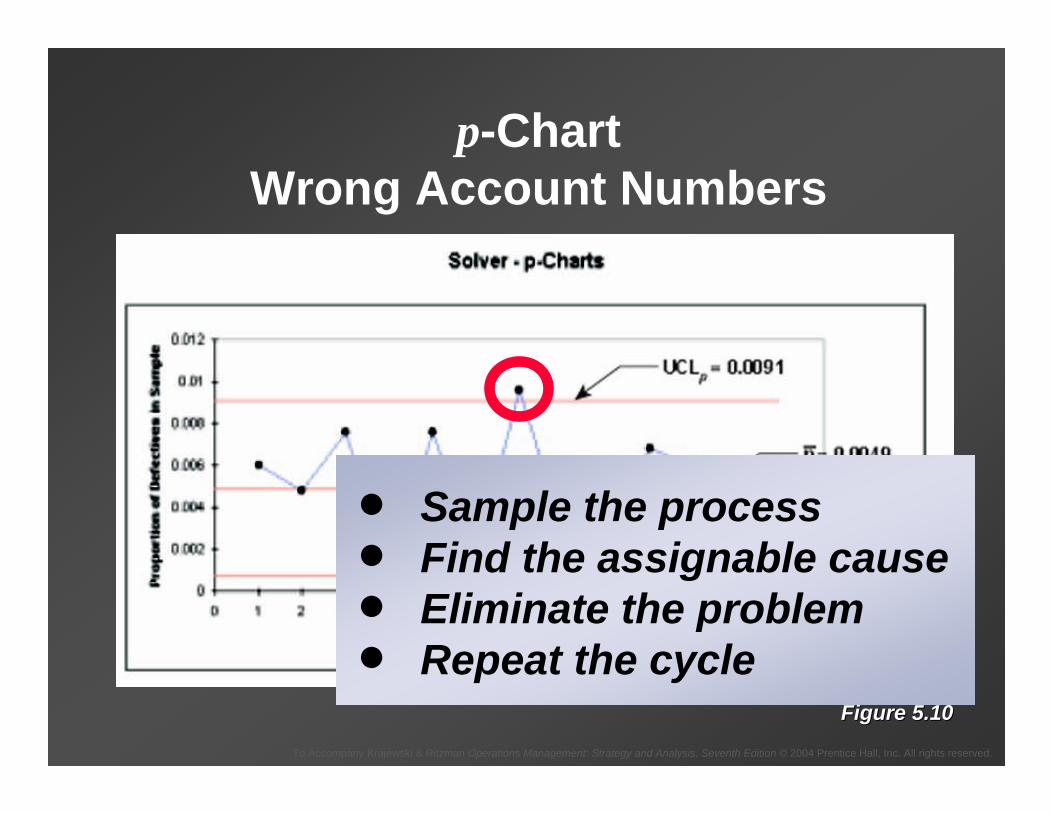
p-ChartWrong Account Numbers
Figure 5.10Figure 5.10
• Sample the process• Find the assignable cause• Eliminate the problem• Repeat the cycle

To Accompany Krajewski & Ritzman Operations Management: Strategy and Analysis, Seventh Edition © 2004 Prentice Hall, Inc. All rights reserved.
Control ChartsControl Chartsfor Attributesfor Attributes
WoodlandWoodlandPaper Paper CompanyCompany
To Accompany Krajewski & Ritzman Operations Management: Strategy and Analysis, Seventh Edition © 2004 Prentice Hall, Inc. All rights reserved.
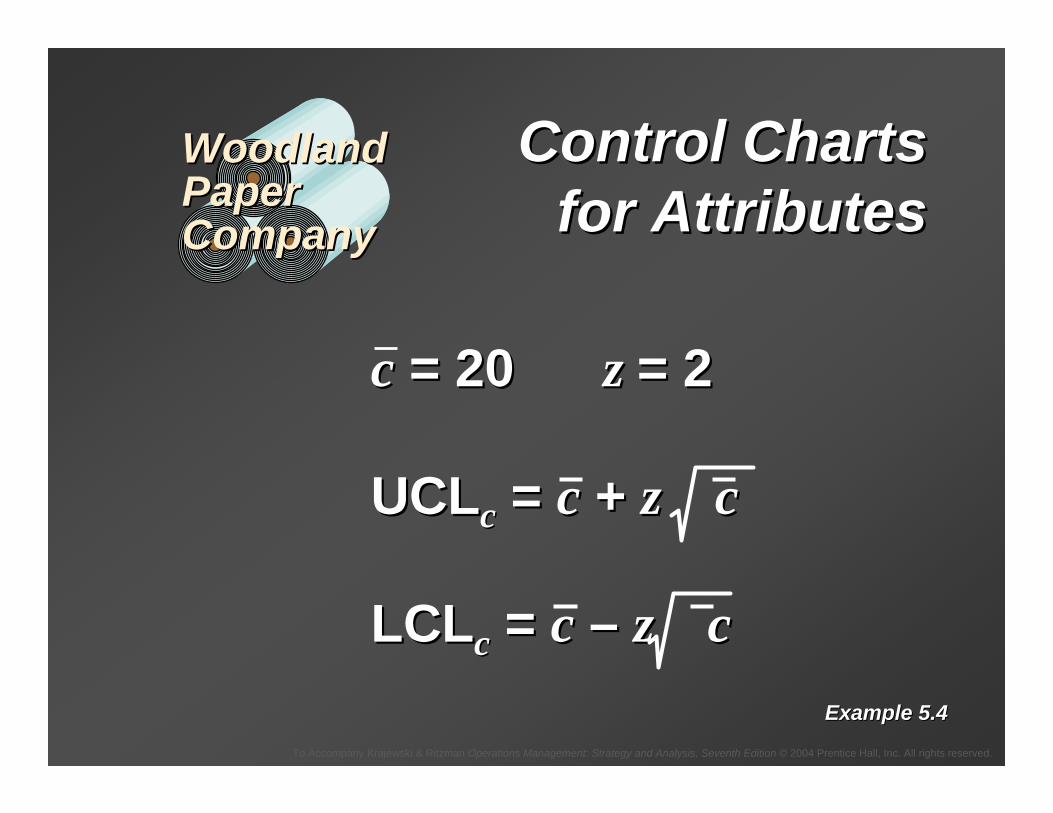
Control ChartsControl Chartsfor Attributesfor Attributes
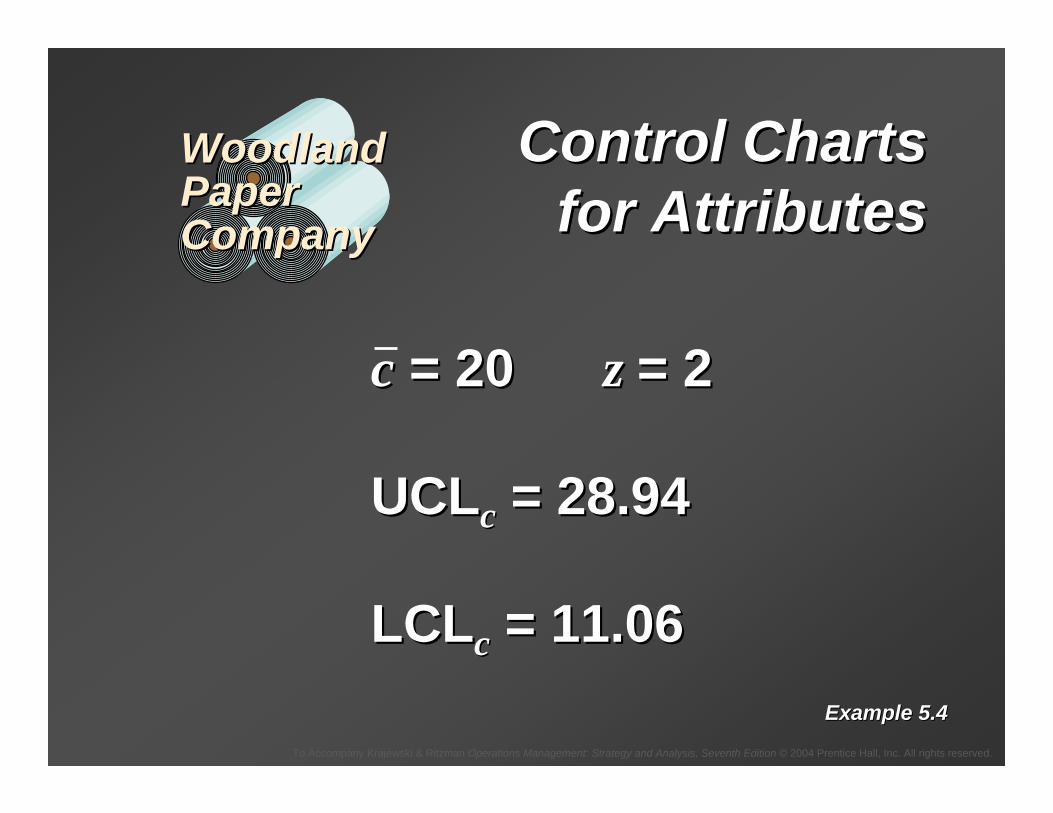
cc = 20 = 20 z z = 2= 2
UCLUCLcc = = cc + + z cz c
LCLLCLcc = = cc –– z cz cExample 5.4Example 5.4
WoodlandWoodlandPaperPaperCompanyCompany

To Accompany Krajewski & Ritzman Operations Management: Strategy and Analysis, Seventh Edition © 2004 Prentice Hall, Inc. All rights reserved.
Control ChartsControl Chartsfor Attributesfor Attributes
Example 5.4Example 5.4
cc = 20 = 20 z z = 2= 2
UCLUCLcc = 20 + 2 20= 20 + 2 20
LCLLCLcc = 20 = 20 –– 2 202 20
WoodlandWoodlandPaperPaperCompanyCompany
To Accompany Krajewski & Ritzman Operations Management: Strategy and Analysis, Seventh Edition © 2004 Prentice Hall, Inc. All rights reserved.
Control ChartsControl Chartsfor Attributesfor Attributes
Example 5.4Example 5.4
cc = 20 = 20 z z = 2= 2
UCLUCLcc = 28.94= 28.94
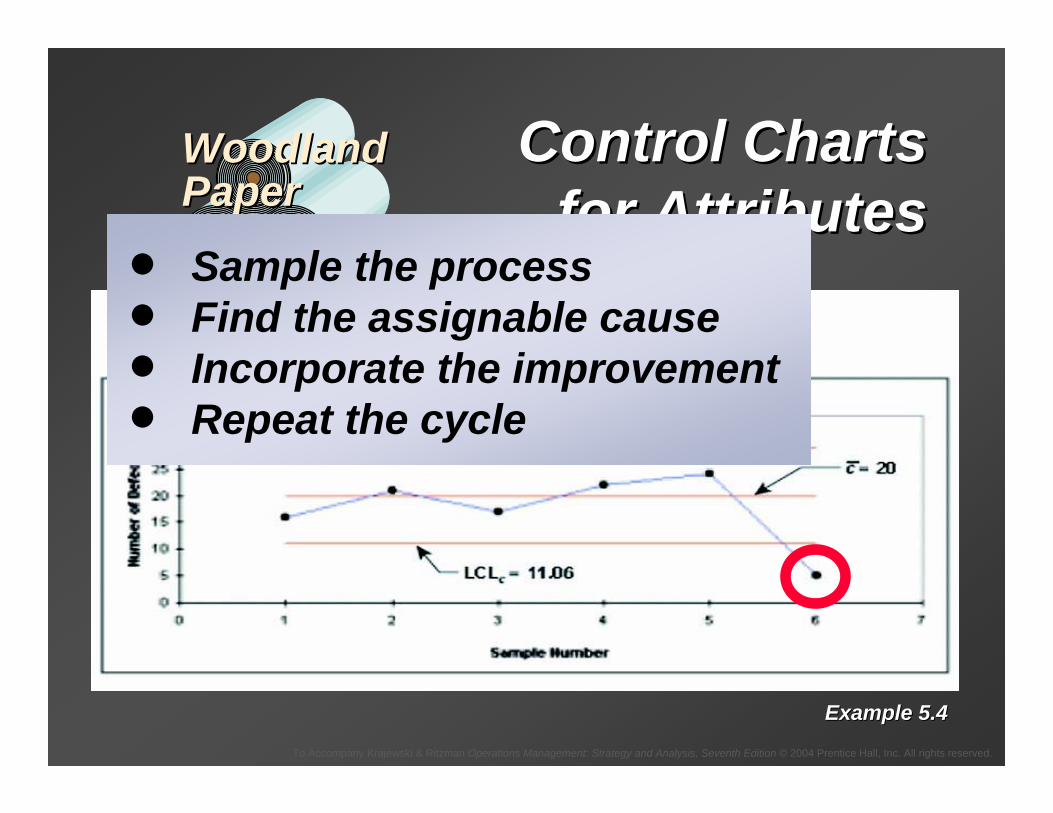
LCLLCLcc = 11.06= 11.06
WoodlandWoodlandPaperPaperCompanyCompany

To Accompany Krajewski & Ritzman Operations Management: Strategy and Analysis, Seventh Edition © 2004 Prentice Hall, Inc. All rights reserved.
Control ChartsControl Chartsfor Attributesfor Attributes
Example 5.4Example 5.4
WoodlandWoodlandPaperPaperCompanyCompany
To Accompany Krajewski & Ritzman Operations Management: Strategy and Analysis, Seventh Edition © 2004 Prentice Hall, Inc. All rights reserved.
Control ChartsControl Chartsfor Attributesfor Attributes
WoodlandWoodlandPaperPaperCompanyCompany
Example 5.4Example 5.4
• Sample the process• Find the assignable cause• Incorporate the improvement• Repeat the cycle
To Accompany Krajewski & Ritzman Operations Management: Strategy and Analysis, Seventh Edition © 2004 Prentice Hall, Inc. All rights reserved.
Six Sigma Six Sigma ImplementationImplementation
•• Top Down CommitmentTop Down Commitment•• Measurement Systems to Track Measurement Systems to Track
ProgressProgress•• Tough Goal SettingTough Goal Setting•• EducationEducation•• CommunicationCommunication•• Customer PrioritiesCustomer Priorities
ASQ 6 Sigma ForumASQ 6 Sigma Forum
To Accompany Krajewski & Ritzman Operations Management: Strategy and Analysis, Seventh Edition © 2004 Prentice Hall, Inc. All rights reserved.
ISOISO90009000
ISOISO1400014000
International Quality International Quality DocumentationDocumentation
•• Environmental Management Environmental Management SystemsSystems
•• Environmental Performance Environmental Performance EvaluationEvaluation
•• Environmental LabelingEnvironmental Labeling•• LifeLife--Cycle AssessmentCycle Assessment

To Accompany Krajewski & Ritzman Operations Management: Strategy and Analysis, Seventh Edition © 2004 Prentice Hall, Inc. All rights reserved.
•• Category 1Category 1——LeadershipLeadership 120 points120 points
•• Category 2Category 2——Strategic PlanningStrategic Planning 85 points85 points
•• Category 3Category 3——Customer and Market FocusCustomer and Market Focus 85 points85 points
•• Category 4Category 4——Information and AnalysisInformation and Analysis 90 points90 points
•• Category 5Category 5——Human Resource FocusHuman Resource Focus 85 points85 points
•• Category 6Category 6——Process ManagementProcess Management 85 points85 points
•• Category 7Category 7——Business ResultsBusiness Results 450 points450 points
Criteria for Criteria for Performance Performance ExcellenceExcellence

To Accompany Krajewski & Ritzman Operations Management: Strategy and Analysis, Seventh Edition © 2004 Prentice Hall, Inc. All rights reserved.
•• LeadershipLeadership——Leadership system, values, Leadership system, values, expectations, and public responsibilities expectations, and public responsibilities
•• Strategic PlanningStrategic Planning——The effectiveness of The effectiveness of strategic and business planning and deployment strategic and business planning and deployment of plans, focusing on performance requirements of plans, focusing on performance requirements
•• Customer and Market FocusCustomer and Market Focus——How the company How the company determines customer and market requirements and achievesdetermines customer and market requirements and achievescustomers satisfactioncustomers satisfaction
•• Information and AnalysisInformation and Analysis——The effectiveness of The effectiveness of information systems to support customer driven performance information systems to support customer driven performance excellence and marketplace success excellence and marketplace success
•• Human Resource FocusHuman Resource Focus——The success of efforts to realize The success of efforts to realize the full potential of the work force to create a highthe full potential of the work force to create a high--performance performance organization organization
•• Process ManagementProcess Management——The effectiveness of systems and The effectiveness of systems and processes for assuring the quality of products and services processes for assuring the quality of products and services
•• Business ResultsBusiness Results——Performance results and competitive Performance results and competitive benchmarking in customer satisfaction, financials, human benchmarking in customer satisfaction, financials, human resources, suppliers, and operations resources, suppliers, and operations


![[PPT]Chapter 5 - WOU Homepage - Western Oregon Universityjcm/Chpt5.ppt · Web viewUsing Software to Assist in Project Scope Management Word-processing software helps create several](https://img.dokumen.tips/doc/110x75/5aedf5d67f8b9a903190628f/pptchapter-5-wou-homepage-western-oregon-jcmchpt5pptweb-viewusing-software.jpg)