Embed Size (px)
Citation preview
Process Optimization of Dual-Laser Beam Weldingof Advanced Al-Li Alloys Through Hot CrackingSusceptibility Modeling
YINGTAO TIAN, JOSEPH D. ROBSON, STEFAN RIEKEHR, NIKOLAI KASHAEV,LI WANG, TRISTAN LOWE, and ALEXANDRA KARANIKA
Laser welding of advanced Al-Li alloys has been developed to meet the increasing demand forlight-weight and high-strength aerospace structures. However, welding of high-strength Al-Lialloys can be problematic due to the tendency for hot cracking. Finding suitable weldingparameters and filler material for this combination currently requires extensive and costly trialand error experimentation. The present work describes a novel coupled model to predict hotcrack susceptibility (HCS) in Al-Li welds. Such a model can be used to shortcut the welddevelopment process. The coupled model combines finite element process simulation with atwo-level HCS model. The finite element process model predicts thermal field data for thesubsequent HCS hot cracking prediction. The model can be used to predict the influences offiller wire composition and welding parameters on HCS. The modeling results have beenvalidated by comparing predictions with results from fully instrumented laser welds performedunder a range of process parameters and analyzed using high-resolution X-ray tomography toidentify weld defects. It is shown that the model is capable of accurately predicting the thermalfield around the weld and the trend of HCS as a function of process parameters.
DOI: 10.1007/s11661-016-3509-4� The Author(s) 2016. This article is published with open access at Springerlink.com
I. INTRODUCTION
THE newly developed lithium-bearing 2xxx seriesaluminum alloys have shown great potential for aero-space applications due to their high specific strength plushigh stiffness. It is known that every 1 pct (wt) of lithiumblended into aluminum increases the elastic modulus byabout 6 pct and reduces the density by about 3 pct atthe same time.[1] The recently developed Li-bearingAA2198 and AA2196 aluminum alloys are very promis-ing high-strength and light-weight alloys for aircraftmanufacturing, for example, the skin-stringer T-shapedjoints for fuselage panels. There is a strong motivationin the aerospace industry to use laser beam welding tomanufacture skin-stringer structures due to the weightsaving by replacing the traditional riveted structure witha welded component. However, Li-bearing aluminumalloys typically present severe weldability issues of high
hot cracking susceptibility (HCS) in the joints.[1–4] Hotcracking, also referred as hot tearing or hot shortness,occurs during the solidification of the welding pool inthe temperature range above solidus, which can cause afailure of the joint immediately after welding or initiate afatigue crack during the service. Therefore, understand-ing and minimizing hot cracking is critical to achievinggood quality joints. At present, the only way to find a setof processing parameters and weld filler chemistry thatavoids hot cracking is through trial and error experi-mentation. This is inefficient with no guarantee that anoptimum parameter set will be deduced. There is thus astrong motivation to develop a simulation tool that canpredict HCS and guide the selection of the bestparameters for welding. Furthermore, a physics-basedmodel can help in understanding the factors thatcontribute to hot cracking, and thus guide future alloyand filler wire development. The objective of the presentwork was to develop a physics-based model to predictHCS in Al-Li laser welds and validate the model againstresults from experimental welds performed under arange of conditions.Hot cracking models in the literature have typically
been developed to predict HCS in castings. Since castingand welding both involve liquid metal solidification,such models can be adapted to deal with HCS in welds.The most successful of these models for application toaluminum alloys is that developed by Rappaz, Drezet,and Gremaud (RDG).[5] This is a physics-based modelthat attempts to capture all of the key processes thatlead to hot cracking. This model has been validated in anumber of aluminum alloy systems.[6–10]
YINGTAO TIAN and LI WANG, Research Associates, andJOSEPH D. ROBSON, Professor, are with School of Materials, TheUniversity of Manchester, M13 9PL, Manchester, UK. Contact e-mail:[email protected] STEFAN RIEKEHR, MaterialsScientist, and NIKOLAI KASHAEV, Head of Department, are withthe Institute of Materials Research, Materials Mechanics, Helmholtz-Zentrum Geesthacht, Max-Planck-Str. 1, 21502 Geesthacht, Germany.TRISTAN LOWE, Experimental Officer, is with Henry Mosely X-rayImaging Facility, School of Materials, University of Manchester,Manchester, UK. ALEXANDRA KARANIKA, Project Leader, iswith Research and Product Design, Hellenic Aerospace Industry S.A.,P.O. Box 23, 32009 Schimatari, Greece.
Manuscript submitted December 14, 2015.
METALLURGICAL AND MATERIALS TRANSACTIONS A

The RDG model attributes the formation of hotcracking to two main factors: lack of liquid feeding;and tensile deformation in the coherent dendriticnetwork caused by thermal contraction of the solid.This model is based on the observation that hotcracking occurs in the vulnerable mushy zone when thematerial is at a temperature between the coherencytemperature and solidus. The coherency temperature isdefined as the point when the solid dendritic armscoalesce so that they can sustain and transmit stresses.Above the coherency temperature, the liquid phasebetween the dendritic arms is still continuous and thesolid is usually considered as slurry, so no hot crackingoccurs at this stage. Once the temperature drops belowthe coherency temperature, the thermal stress, which isinduced by the differential thermal contraction uponcooling, can pull apart the weakly coalesced dendriticarms and provide a potential site for hot cracking. Ifenough liquid is able to flow into such regions, thepotential hot crack is ‘healed’ and a crack will notform. However, if the permeability of the mushy zoneis too small to allow enough liquid feeding into thespace, then the hot cracking occurs. The RDG modelcombines the feeding of the liquid into the mushy zoneand the deformation of the coherent solid network andalso offers a strain rate-based criterion to work out therelative probability of hot tears. The RDG model thusincludes all of the important phenomena that lead tohot cracking, while retaining an analytical frameworkthat does not require knowledge of the distribution ofdendrites and liquid in space. This model was notoriginally developed for welding, but has been success-fully applied to predict hot crack susceptibility in 6xxxaluminum alloy welds.[11]
In the present work, a coupled model is developed toaddress the hot cracking issues in laser welding of thenewly developed Al-Li alloys. A finite element (FE)model is developed to simulate the dual-beam laserwelding processes and predict the thermal field datawhich feed into the RDG hot cracking susceptibility(HCS) model. The RDG hot cracking model was chosensince it has proven successful in predicting hot crackingin other aluminum alloys that are susceptible to crackingduring welding.[11]
To validate the model, dual-beam laser welding ofAA2198 skin (sheet) to AA2196 stringer (extrusion)has been studied under a range of process conditions.The predictions of the model have been comparedwith the tendency for hot cracks in the experimentalwelds measured using X-ray computed tomography(XCT). The use of XCT to study hot cracks and otherdefects in Al-Li alloy laser welds performed under arange of conditions is also a novel aspect of thepresent work.
II. EXPERIMENTAL METHOD
Welding was performed using the large-scale laserwelding facility at Helmholtz–Zentrum Geesthacht(HZG), Germany. The facility consists of a movableprocessing head and two 3.5 kW CO2 laser units. Theskin-stringer T-shaped welded joint comprises threematerials, AA2198 as the skin, AA2196 as the stringer,and AA4047 as the filler. The materials were supplied byConstellium and the nominal compositions are listed inTable I. As shown in Figures 1(a) and (b), the3.2-mm-thick skin sheet was vacuum clamped onto analuminum base while the extruded profile stringer wasplaced vertically and held in place with good contact.The presence of lithium element in the alloys increasesthe growth rate of the oxide film on the surface, which ismainly responsible for the formation of porosity duringthe welding. Therefore, extra attention needs to be paidto prepare the surface before welding. The surface of theskin material was ground with sand paper to remove theoxide layer. It has been found that the oxide layer onAA2196 contains higher hydrogen level, so that thesurface of the stringer AA2196 was ground down to atleast 0.2 mm. The final thickness of stringer after surfacepreparation was 1.6 mm. AA4047 filler wire with adiameter of 0.8 mm was used.Details of the dual-laser beam welding parameters are
listed in Table II. Two CO2 laser beams were appliedsimultaneously on both sides of the stringer at a fixedincident angle of 22 deg, respectively. The filler wire wasfed at 7.0 m/min and helium shielding gas was suppliedat a flow rate of 35 L/min in front of the laser beam onboth sides of the stringer. The focal position of the laserbeam was 0.0 mm on the stringer surface and +0.2 mmabove the skin. Three welding experiments were carriedout for comparison. Due to the restriction of theequipment and requirement of high productivity, thewelding speed, filler wire feed rate, He gas flow, andlaser focal position remained same but laser powervaried from 1400 to 2000 W. In order to reveal themicro-cracks, the welds were sectioned out (Figure 1(c))and examined in a Nikon XTH-225 high-resolutionX-ray tomographic system at the Henry Moseley X-rayImaging Facility. The excessive parent materials wereremoved to enable better accessibility of X-ray to theregion of greatest interests, i.e., the fusion zone, andabout 1-cm-long section from the middle of each weldwas examined. The sample was rotated through 360 degand an accelerating voltage of 105 kV and a 120 lAcurrent were used to produce a total of 2002 radiographswith a voxel size of 5 lm, i.e., features larger than 5 lmwill be recognized by the system. The radiographic datawere reconstructed using CT Pro 3D (version XTEK XT4.0.3.6). The defects in the welds were finally segmented
Table I. Nominal Chemical Composition (Weight Percent) of the Three Aluminum Alloys
Material Si Fe Cu Mn Mg Cr Zn Ti Ag Li Zr Al
AA2198 0.03 0.05 3.35 0.03 0.32 0.05 0.02 0.02 0.27 0.98 0.14 bal.AA2196 0.03 0.05 3.03 0.31 0.37 0.01 0.02 0.03 0.26 1.74 0.11 bal.AA4047 12.0 0.8 0.3 0.15 0.1 — 0.2 — — — — bal.
METALLURGICAL AND MATERIALS TRANSACTIONS A

and visualized using FEI Avizo 9.1 visualizationpackage.
III. WELDING PROCESS AND HOT CRACKINGSUSCEPTIBILITY MODEL DESCRIPTION
A. Finite Element Analysis Procedure
ABAQUS was used as a general modeling tool in thisstudy. However, in order to model multiple moving heatsources directly in ABAQUS, a complex FORTRANsubroutine is required. In this work, another finiteelement analysis software, namely the Finite ElementAnalysis Toolbox (FEAT), was utilized to define theheat source and apply it into the ABAQUS model.FEAT incorporates a powerful Welding ModelingToolbox (WMT), with the moving heat source functionintegrated, to perform accurate welding thermal andstress/strain modeling. By combining the advantages ofABAQUS and FEAT-WMT, a new modeling procedurewas adopted. The geometric model was firstly created inABAQUS and the material properties, boundary
conditions, meshing, welding, and cooling time weredefined. The only thing absent in this stage was thethermal load. An ‘.inp’ file containing complete infor-mation for the model was generated. As designed,FEAT-WMT can read the ABAQUS ‘.inp’ file tosimulate the heat source. The heat source is describedin Section III–B. The heat source was defined inFEAT-WMT using the built-in templates and appliedinto the 3D model read from ABAQUS. FEAT-WMTthen generated a series of SLICE files which containedthe information of the moving heat source. Next, the‘inp’ file and SLICE files generated from the previoussteps were read into ABAQUS again. The SLICE fileswere organized by a simple FORTRAN subroutine andsimulated the moving heat source in ABAQUS. Thethermal analysis was then carried out in ABAQUS usingthe standard solver.
B. Heat Source Model
An elliptic cone heat source, which was derived fromthe classic Goldak double ellipsoid model,[12] was usedto simulate the temperature field during the dual-beam
Fig. 1—Configuration of the laser welding skin-stringer process and X-ray CT sample.
Table II. Details of Dual-Beam Laser Welding Parameters
Laser PowerWeldingSpeed
Filler WireFeed Rate
He GasFlow Rate
IncidentAngle (a)
FocalPosition
BeamFocus
Diameter
1400/1700/2000 W 6.2 m/min 7.0 m/min 35 L/min 22 deg 0.0 mm 130 lm
METALLURGICAL AND MATERIALS TRANSACTIONS A

laser welding process. The Goldak double ellipsoidmodel has been successfully applied to arc weldingprocess but it is not suitable to simulate the deepkeyhole during laser penetration welding. As shown inFigure 2, the elliptic cone has the Gaussian distributionin the X–Z plane (same as the Goldak double ellipsoiddistribution), but has a linear variation in the Ydirection down into the material.[13] Similar to theGoldak double ellipsoid model, the heat source isdivided into front and rear parts. The front part of thedouble elliptic cone is defined as:
qf x; y; zð Þ ¼ 6ffQ
abcfp 1þ dcð Þ exp �3x2
a2
� �
� 1� 1� dcð Þ yj jb
� �exp �3
z2
c2f
! ½1�
and the rear part as:
qr x; y; zð Þ ¼ 6frQ
abcrp 1þ dcð Þ exp �3x2
a2
� �
� 1� 1� dcð Þ yj jb
� �exp �3
z2
c2r
� �;
½2�
where Q is the energy input, a, cf, and cr are the lat-eral, front, and rear radius of the ellipsoid on the X–Zplane, respectively, b is the depth of the blunt cone.The parameters ff and fr are the fractions between thefront and rear parts in the conical functions, respec-tively. To keep continuity between the front and rearparts of the combined heat source, the following rela-tionships must be satisfied:
ff ¼2cf
cf þ cr
ff þ fr ¼ 2
8><>: ½3�
The geometric parameters a, cr, and cf determine thearea of the top surface of the heat source and theparameter b defines how deep the laser penetrates intothe material. The additional parameter dc defines thefraction of energy intensity decrease through the lengthof b. dc is a normalized parameter and has a valuebetween 1 and 0. If the value of dc is 1, the energy
intensity is constant from the top to the bottom of thecone, while dc = 0 means the energy intensity decreasesto zero at the bottom of the weld. This model thereforeallows manipulation of the key features of the heatsource to accurately simulate the laser welding process.
C. Welding Process Model Configuration
The weld specimens were 310 mm long, correspondingto a 3-second welding time. Simulations showed thatwelding will enter steady state soon after the startingpoint, so it is sensible to reduce the length of the weld to100 mm in the model to save computing time andresources. An example weld and the 3Dmodel are shownin Figure 3. Note that the meshes are significantly refinednear the weld, where the temperature changes rapidly.The volume of theweld beadwas calculated from the fillerwire feed rate, which was predefined in the model. Thematerial properties were supplied by Constellium and arelisted in Table III. It is assumed that the materials arecontinuous and the temperature dependency of thethermal conductivity and specific heat are accounted(see Table III). The latent heat due to the solid–liquidphase transformation in three materials was also consid-ered. The heat loss through radiation, surface convection,and conduction to the backing plate and clamps were setup according to the experimental conditions. The typicalvalue of heat transfer coefficient between work piece andair is around 10 Wm�2 K�1.[14] In order to simulate thereinforced heat transfer induced by the helium shieldinggas, backing plate, and clamping, the heat transfercoefficient for surfaces near the weld, on the backside,and between the clamping were artificially increased, aslisted in Table IV.
D. Welding Process Model Optimization and Validation
To optimize and verify the accuracy of the thermalmodel, a number of thermocouples were attached to theskin and stringer (Figure 4) and the measured resultswere compared with the simulation. The area and profileof the fusion zone in the welds were also measured froma cross-sectional view and compared with the simulationresults. The geometrical characteristics of the heatsource Eqs. [1] and [2], the heat transfer coefficient andthe boundary conditions were adjusted to fit themeasured temperature and profile of fusion zones. Themodel was therefore adjusted and optimized on the basisof the comparison.
E. The Hot Cracking Susceptibility Model
As already discussed, when the coherent dendrites aresubjected to a tensile strain rate and the liquid flowinginto the gaps cannot compensate for the deformation,hot cracking will occur. The RDG model is derived byperforming a mass balance over a local region of themushy zone and it can be applied in either a simple wayto obtain a qualitative ranking of HCS, or in a morecomplex way to provide quantitative prediction of hotcrack formation. Details of the RDG model derivationcan be found in Reference 5.Fig. 2—Configuration of the elliptic cone heat source.
METALLURGICAL AND MATERIALS TRANSACTIONS A

The simplest application of this model is to rank therelative sensitivity to hot cracking for different alloy andfiller metal compositions. As shown in Figure 5, whenthe pressure in the inter-dendritic liquid (pm) dropsbelow a critical level, called cavitation pressure (pc), the
liquid is unable to refill the gaps and therefore a hotcrack may form. The pressure drop through the dendritenetwork has two components, Dpsh is caused by thesolidification shrinkage and Dps is due to the deforma-tion, as expressed below.
Fig. 3—The actual welding specimen (a) and 3D model in ABAQUS (b) (Color figure online).
Table III. Thermodynamic Properties of AA2198, AA2196, and AA4047 Aluminum Alloys
Alloys Temperature [K (�C)] 293 (20) 323 (50) 423 (150) 523 (250) 623 (350) 723 (450)
AA2198 density (k gm�3) 2690 2684 2664 2642 2619 2594thermal conductivity (Wm�2 K�1) 85 92 111 123 131 136specific heat (Jkg�1 K�1) 903 922 975 1019 1059 1101latent heat for fusion (J/kg) 407000melting temperature range (K) 776–923
AA2196 density (kg m�3) 2638 2632 2611 2590 2566 2541thermal conductivity 66 72 90 102 110 117specific heat (J kg�1 K�1) 921 941 997 1041 1081 1123latent heat for fusion (J/kg) 410000melting temperature range (K) 781–921
AA4047 density (kg m�3) 2659 2654 2637 2619 2600 2579thermal conductivity 173 179 193 197 197 197specific heat (J kg�1 K�1) 871 891 943 985 1026 1067latent heat for fusion (J/kg) 490000melting temperature range (K) 808–858
Table IV. Numerical Parameters of Heat Loss to Environment
Emissivity 0.4Surface convective heat transfer coefficient (Wm�2 K�1) 10Forced convective heat transfer near the weld induced by shielding gas (Wm�2 K�1) 80Effective forced heat transfer induced by backing plate and clamping (Wm�2 K�1) 100
METALLURGICAL AND MATERIALS TRANSACTIONS A
Dpmax ¼ pm � pc ¼ Dpc ¼ Dpsh þ Dpe
¼ 180
k22
mTblG
Aþ 180
k22
1þ bð Þl_e Tð ÞG2
B½4�
with
A ¼Z Tl
Ts
fs Tð Þ2
1� fs Tð Þð Þ2dT ½5�
B ¼Z Tl
Ts
fs Tð Þ2R Tl
Tsfs Tð ÞdT
1� fs Tð Þð Þ3dT; ½6�
where k2 is the secondary dendrite arm spacing, G isthe thermal gradient, mT is the velocity of the isotherms,b is the shrinkage factor, l is the liquid viscosity, andfs(T) is the solid fraction dependent on temperature.The first term on the right-hand side of Eq. [4] isrelated to the microporosity induced by the solidifica-tion shrinkage while the second term relates to thedeformation.The two integrals A and B can be used as an index
to evaluate the relative hot cracking susceptibility. Thelarger A and B, the larger the pressure drop in theinter-dendritic liquid and therefore the higher risk ofhot cracking. A and B are solely dependent on thefraction of solid fs(T) during solidification as a functionof temperature. It is commonly assumed that thedendrites start to bridge together when the solidfraction reaches approximately 98 pct if the eutectictemperature is not yet reached.[5,15,16] Therefore, theintegral limits for the A parameter in Eq. [5] are fromthe point where the solid fraction fs = 0.98, i.e., theso-called coherency temperature, to the liquidus tem-perature. The temperature-dependent fraction of solidcan be determined from a thermodynamic calculationalone, using the Scheil–Gulliver assumption, which isknown to well represent the solidification of aluminumalloys under standard conditions.[17] This application ofthe RDG model is therefore only dependent on fusionzone composition (which depends on base metal andfiller composition, and the proportion of each in themelt pool). In the present work, JMatPro[18] with theALDATA database was used to perform the thermo-dynamic calculations to determine A and Bparameters.A more complete application of the RDG model also
includes a consideration of the welding process. Byincluding factors such as the isotherm velocity, themodel will be able to determine the maximum strain ratethat can be sustained in the mushy zone. Equation [4]can be rearranged to give this strain rate as:
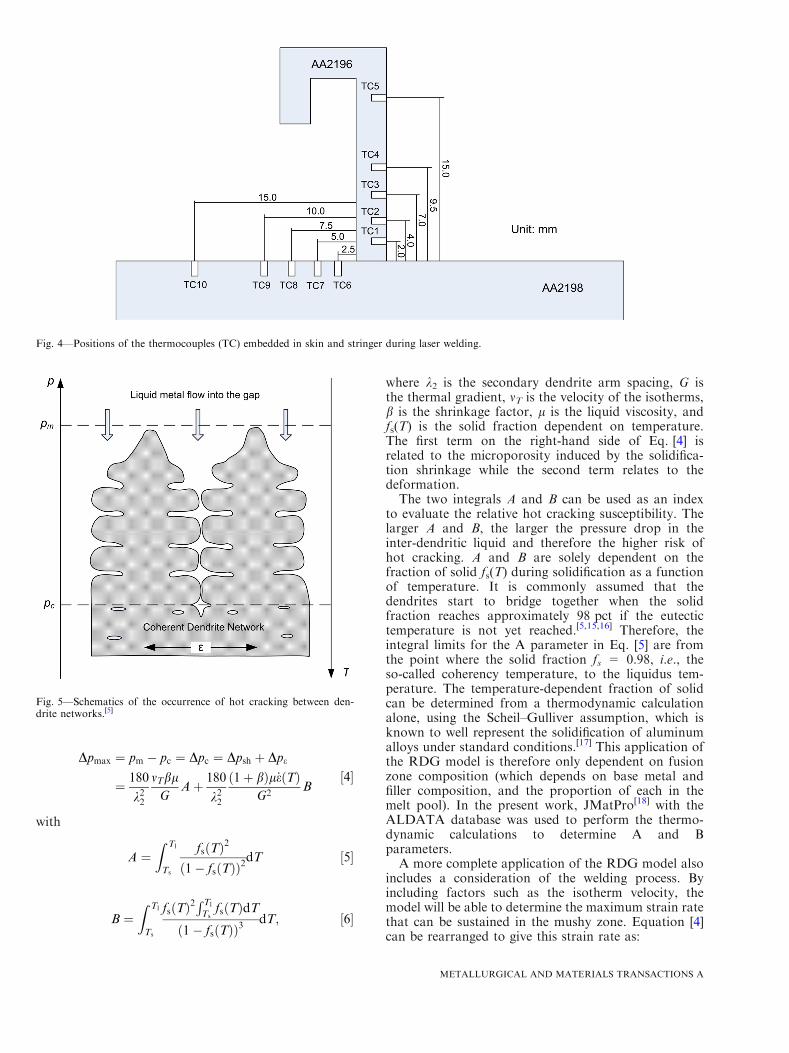
Fig. 4—Positions of the thermocouples (TC) embedded in skin and stringer during laser welding.
Fig. 5—Schematics of the occurrence of hot cracking between den-drite networks.[5]
METALLURGICAL AND MATERIALS TRANSACTIONS A
_ep;max ¼k22180
G
1þ bð ÞlDpc � mTb
1þ bA; ½7�
where Dpc is the cavitation depression. The HCS index isthen assumed to be proportional to 1/_ep;max, i.e., thehigher strain rate the mushy zone can bear, the lowerrisk of hot cracking. The second-level criterion allowsthe influences of both thermal field and the alloycomposition to be included in the calculation. Toperform the calculation using Eq. [7], the thermalgradient G was obtained through the aforementionedfinite element thermal model. The secondary dendritearm spacing k2 was calculated using JMatPro, whilevalues for other variables were taken from Reference 5.
IV. RESULTS AND DISCUSSION
A. Thermal Modeling Results and Discussion
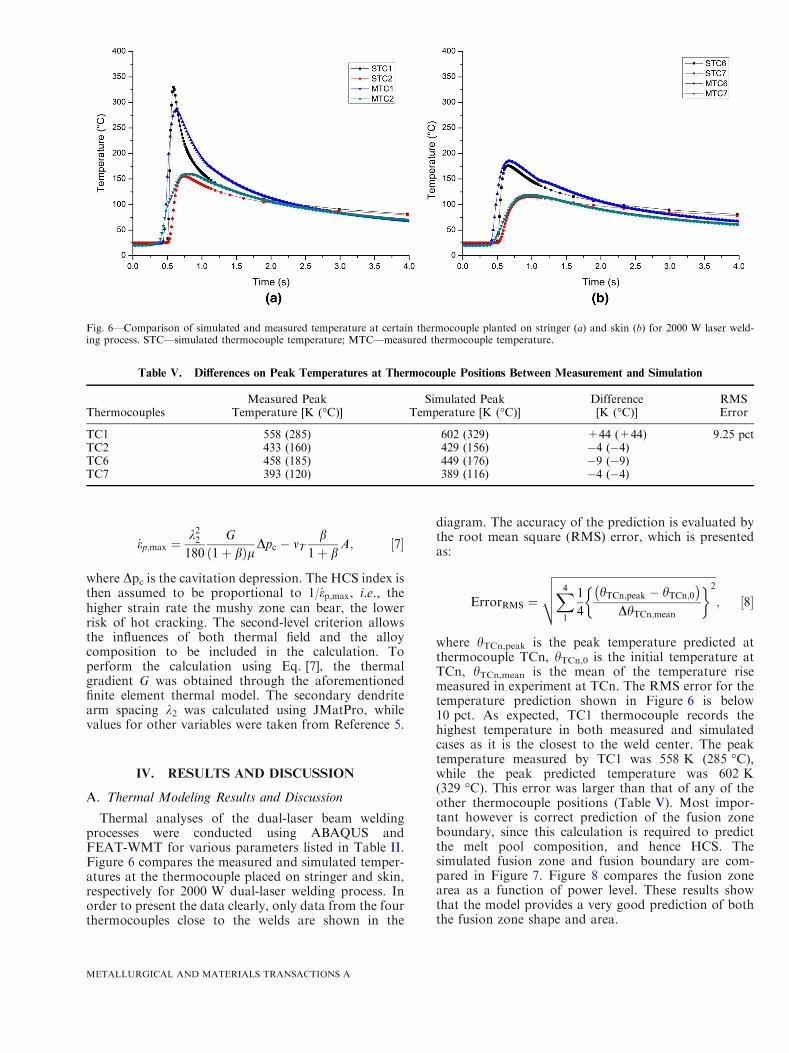
Thermal analyses of the dual-laser beam weldingprocesses were conducted using ABAQUS andFEAT-WMT for various parameters listed in Table II.Figure 6 compares the measured and simulated temper-atures at the thermocouple placed on stringer and skin,respectively for 2000 W dual-laser welding process. Inorder to present the data clearly, only data from the fourthermocouples close to the welds are shown in the
diagram. The accuracy of the prediction is evaluated bythe root mean square (RMS) error, which is presentedas:
ErrorRMS ¼
ffiffiffiffiffiffiffiffiffiffiffiffiffiffiffiffiffiffiffiffiffiffiffiffiffiffiffiffiffiffiffiffiffiffiffiffiffiffiffiffiffiffiffiffiffiffiffiffiffiffiffiffiffiffiffiffiffiffiX41
1
4
hTCn;peak � hTCn;0� �
DhTCn;mean
2vuut ; ½8�
where hTCn,peak is the peak temperature predicted atthermocouple TCn, hTCn,0 is the initial temperature atTCn, hTCn,mean is the mean of the temperature risemeasured in experiment at TCn. The RMS error for thetemperature prediction shown in Figure 6 is below10 pct. As expected, TC1 thermocouple records thehighest temperature in both measured and simulatedcases as it is the closest to the weld center. The peaktemperature measured by TC1 was 558 K (285 �C),while the peak predicted temperature was 602 K(329 �C). This error was larger than that of any of theother thermocouple positions (Table V). Most impor-tant however is correct prediction of the fusion zoneboundary, since this calculation is required to predictthe melt pool composition, and hence HCS. Thesimulated fusion zone and fusion boundary are com-pared in Figure 7. Figure 8 compares the fusion zonearea as a function of power level. These results showthat the model provides a very good prediction of boththe fusion zone shape and area.
Fig. 6—Comparison of simulated and measured temperature at certain thermocouple planted on stringer (a) and skin (b) for 2000 W laser weld-ing process. STC—simulated thermocouple temperature; MTC—measured thermocouple temperature.
Table V. Differences on Peak Temperatures at Thermocouple Positions Between Measurement and Simulation
ThermocouplesMeasured Peak
Temperature [K (�C)]Simulated Peak
Temperature [K (�C)]Difference[K (�C)]
RMSError
TC1 558 (285) 602 (329) +44 (+44) 9.25 pctTC2 433 (160) 429 (156) �4 (�4)TC6 458 (185) 449 (176) �9 (�9)TC7 393 (120) 389 (116) �4 (�4)
METALLURGICAL AND MATERIALS TRANSACTIONS A

B. HCS Modeling Results and Discussion
The hot cracking susceptibility for the three weldpowers used in this study was predicted using thetwo-level RDG criteria, as described previously. Tocalculate the average melt pool composition, it wasassumed that the skin material AA2198, stringerAA2196, and filler wire AA4047 were perfectly mixedin the fusion zone. The melt pool composition can thensimply be calculated by taking a weighted average of thethree component materials scaled according to thefraction of each in the melt. Varying welding parameterswill produce different proportions of skin, stringer, andfiller materials, therefore resulting in different composi-tion in the final mixed fusion zone. As shown inFigure 7, the cross-sectional area of the fusion zoneconsists of melted skin, stringer, and additional fillermaterial.
The calculated compositions of the mixed fusion zoneas a function of laser powers are listed in Table VI.Because the filler wire was added into the weld atconstant speed regardless of the change of laser power,more parent materials were melted into the fusion zonewith an increase in laser power, so that the concentra-tion of Cu increases while that of Si decreases. The solidfraction for each melt pool composition as a function oftemperature during solidification was calculated andused to calculate the A and B parameters in the HCSmodel. The calculated A parameter (normalized value) isshown in Figure 9 for the mixed fusion zone, and for theparent and filler materials. The integral B varies in avery similar way and so is not shown. It can be seen thatas expected, the relative hot cracking susceptibility (Aparameter) of the parent materials AA2198 and AA2196are very high suggesting a potential hot crackingproblem in lithium-bearing alloys. This is largely a
Fig. 7—Comparison of the fusion boundary of laser welding processes at different power: (a) 1400 W, (b) 1700 W, and (c) 2000 W.
Fig. 8—Comparison of the fusion zone area of laser welding pro-cesses at different powers.
Table VI. Composition of Fusion Zone at Different Laser Powers by Assuming Perfect Mixing (Weight Percent)
Power AA4047 Percentage Si Fe Cu Mn Mg Cr Zn Ti Ag Li Zr Al
1400 W 35.5 4.28 0.32 2.17 0.16 0.25 0.02 0.08 0.01 0.09 0.85 0.08 bal.1700 W 29.2 3.52 0.27 2.39 0.13 0.26 0.03 0.07 0.01 0.13 0.86 0.09 bal.2000 W 25.2 3.04 0.24 2.49 0.14 0.27 0.03 0.07 0.01 0.13 0.94 0.1 bal.
Fig. 9—The normalized HCS integral A corresponding to the parentmetal, filler wire, and the weld mixtures at various laser powers.
METALLURGICAL AND MATERIALS TRANSACTIONS A
result of the wide freezing range in these materials (acommon feature of all high-strength age hardenablealuminum alloys).[1]
In contrast, as expected, the AA4047 filler materialshows a very low hot cracking susceptibility. Thenormalized HCS index of the mixed weld compositionslies between the parent and filler materials indicating theSi-rich filler wire can effectively reduce the hot crackingsusceptibility of the parent metals. It can also be seenthat according to the first-level RDG criterion (Aparameter evaluation), the HCS of the mixture of alloysin the weld decreases slightly with increasing laser powerfrom 1400 to 2000 W. This is initially surprising, sincethe high powered weld has the lowest proportion of fillercompared to parent material. This point is explored inmore detail later.
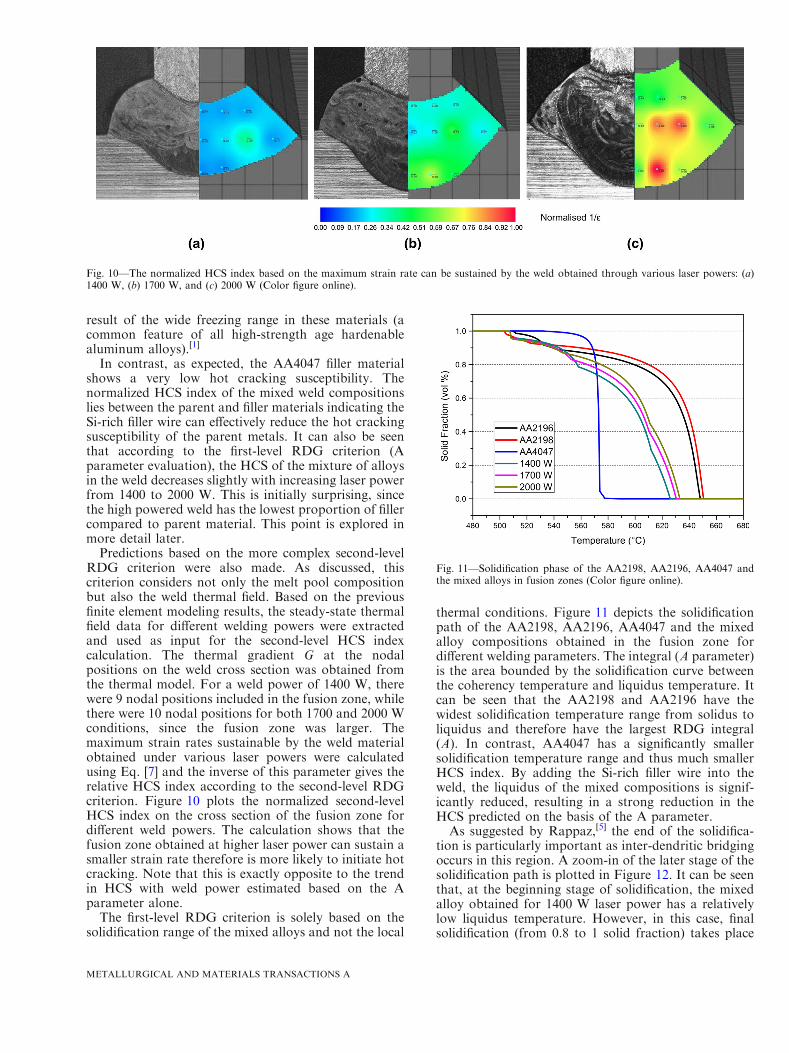
Predictions based on the more complex second-levelRDG criterion were also made. As discussed, thiscriterion considers not only the melt pool compositionbut also the weld thermal field. Based on the previousfinite element modeling results, the steady-state thermalfield data for different welding powers were extractedand used as input for the second-level HCS indexcalculation. The thermal gradient G at the nodalpositions on the weld cross section was obtained fromthe thermal model. For a weld power of 1400 W, therewere 9 nodal positions included in the fusion zone, whilethere were 10 nodal positions for both 1700 and 2000 Wconditions, since the fusion zone was larger. Themaximum strain rates sustainable by the weld materialobtained under various laser powers were calculatedusing Eq. [7] and the inverse of this parameter gives therelative HCS index according to the second-level RDGcriterion. Figure 10 plots the normalized second-levelHCS index on the cross section of the fusion zone fordifferent weld powers. The calculation shows that thefusion zone obtained at higher laser power can sustain asmaller strain rate therefore is more likely to initiate hotcracking. Note that this is exactly opposite to the trendin HCS with weld power estimated based on the Aparameter alone.
The first-level RDG criterion is solely based on thesolidification range of the mixed alloys and not the local
thermal conditions. Figure 11 depicts the solidificationpath of the AA2198, AA2196, AA4047 and the mixedalloy compositions obtained in the fusion zone fordifferent welding parameters. The integral (A parameter)is the area bounded by the solidification curve betweenthe coherency temperature and liquidus temperature. Itcan be seen that the AA2198 and AA2196 have thewidest solidification temperature range from solidus toliquidus and therefore have the largest RDG integral(A). In contrast, AA4047 has a significantly smallersolidification temperature range and thus much smallerHCS index. By adding the Si-rich filler wire into theweld, the liquidus of the mixed compositions is signif-icantly reduced, resulting in a strong reduction in theHCS predicted on the basis of the A parameter.As suggested by Rappaz,[5] the end of the solidifica-
tion is particularly important as inter-dendritic bridgingoccurs in this region. A zoom-in of the later stage of thesolidification path is plotted in Figure 12. It can be seenthat, at the beginning stage of solidification, the mixedalloy obtained for 1400 W laser power has a relativelylow liquidus temperature. However, in this case, finalsolidification (from 0.8 to 1 solid fraction) takes place
Fig. 10—The normalized HCS index based on the maximum strain rate can be sustained by the weld obtained through various laser powers: (a)1400 W, (b) 1700 W, and (c) 2000 W (Color figure online).
Fig. 11—Solidification phase of the AA2198, AA2196, AA4047 andthe mixed alloys in fusion zones (Color figure online).
METALLURGICAL AND MATERIALS TRANSACTIONS A

over a wider temperature range than in the other cases,leading to a larger A parameter and higher predictedHCS. This indicates that although in general the HCS oftwo Al-Li alloys in this study can be significantlyreduced by introducing substantial proportions of Si(Table VI), within the regime of the mixtures, the HCSindex does not decrease simply by increasing the Sicontent. Similar results have also been reported byDrezet.[19]
In order to investigate the effects of Si and Cu, whichare the main elements affecting the A parameter in theweld mixture, calculations were carried out by varying Siand Cu content respectively while keeping the otherelements fixed at the same level as the mixture obtainedby 1700 W laser power, as listed in Table VII. Thecomposition level from 1700 W laser power was chosenbecause it provided an average reference of the weldmixture. As plotted in Figure 13, it can be seen that theHCS peaks at Si = 0.4 pct or Cu = 1.2 pct, respec-tively and decreases with further increase of eitherelement. As listed in Table VI, when the laser powerincreases from 1400 to 2000 W, the content of Sidecreases from 4.3 to 3.0 pct while the concentrationof Cu increases from 2.2 to 2.5 pct.
As indicated by the ‘A’ curves in Figure 13, 2-4 pct ofSi introduced into the weld would be expected toproduce a low HCS in the Al-Cu-Li-x alloy system(Table VII) and further small changes in Si concentra-tion have very little influence on the integral A.However, an increase of Cu from 2.2 to 2.5 pct resultsin a larger reduction in A parameter, compared with thesmall increase caused by the reduction of Si from 4.3 to3.0 pct (as indicated by the red and black arrows in
Figure 13). In this case, an increase in Cu acts to reducethe A parameter more strongly than the decrease in Siincreases it. This results in the prediction that, as moreparent material is introduced into the melt pool (i.e., byuse of higher welding power), the A parameter andhence HCS (according to the first-level RDG criterion)will be reduced.The second-level RDG criterion considers both alloy
composition and the process, and should provide a moreaccurate assessment of hot cracking susceptibility thanthe first-level criterion. As illustrated in Eq. [7], the firstterm is the maximum strain rate that can be provided bythe liquid metal flowing into the bottom of the dendriticnetwork, which depends on the cavitation pressure, thesecondary arm spacing, thermal gradient, and liquidviscosity. The second term is the strain rate required toaccommodate the shrinkage during the liquid-to-solidphase transformation. Therefore, the _ep;max shows thecapacity of the mushy zone to accommodate themechanical strain rate induced by the shrinkage of thesolid underneath upon further cooling. The bigger the‘spare’ strain rate capacity _ep;max, the larger the mechan-ical strain rate can be tolerated, so the lower the risk ofhot cracking at the end of solidification. The HCS ishence proportional to the inverse of the maximum strainrate, i.e., proportional to 1/_ep;max.For second-level HCS modeling, when the laser power
increased from 1400 to 2000 W, the thermal gradient inthe fusion zone increased correspondingly. The sec-ondary dendrite arm spacing k2 is inversely affected bythe cooling rate, which directly relates to the thermalgradient. Hence, the secondary dendrite arm spacingdecreased with increasing laser power. As can be seen in
Fig. 12—Zoom at the solid fractions higher than 75 pct of the solidi-fication phase (Color figure online).
Table VII. Compositions for Calculating the Influences of Si and Cu on the A Parameter (Weight Percent)
Si Cu Fe Mn Mg Cr Zn Ti Ag Li Zr Al
1 varies between 0 and 5.1 2.39 0.27 0.13 0.26 0.03 0.07 0.01 0.13 0.86 0.09 bal.2 3.52 varies between 0 and 5.1 0.27 0.13 0.26 0.03 0.07 0.01 0.13 0.86 0.09 bal.
Fig. 13—Influences of Si and Cu on the HCS of the weld mixture onthe basis of 1700W laser welding power.
METALLURGICAL AND MATERIALS TRANSACTIONS A

the expression of the first term in Eq. [7], the effect ofincreases in the thermal gradient will be outweighed bythe reduced secondary arm spacing, on which there is asquared dependence. Therefore, with an increase of laserpower, the strain rate sustainable in the weld is predictedto become smaller, indicating a larger hot crackingsusceptibility. It was also noticed that the HCS indexwas uneven in the fusion zone and it is thereforepredicted that there will be regions of the weld moresusceptible to cracking (greater HCS) regardless of weldpower (Figure 10) due to variations in the thermal field.In practice, variations in melt pool composition causedby imperfect mixing (which is ignored in the presentmodel) may also produce a significant local variation inHCS.
In order to test the predictions of the RDG model,welds made with various powers were examined by XCTto reveal cracks and porosity. During the segmentationand visualization process, features having near-sphericalshape were treated as porosity and separated fromcracks, which had relatively larger aspect ratios.Figure 14 shows the distribution of cracks in the welds.The results clearly show that the population of cracksincreases with increasing laser power, which is in linewith the HCS modeling predictions according to thesecond-level RDG criterion. However, the ‘hot spots’ ofhot cracking shown in the modeling results cannot bedirectly linked to the experimental results. This isbecause cracking in the real weld is also influenced byother complex phenomena that are not included in themodeling framework. For example, as indicated inFigure 15, the radiograph of cross-sectional view ofthe weld made with a power of 2000 W, it was foundthat relatively big gas bubbles were gathered close to theupper fusion boundary. The gas bubbles formed duringthe welding process tend to float upwards due to thebuoyancy force in the liquid metal. These bubbles arethen stopped by the stringer and cannot escape from themelt pool. This porosity is likely to promote severe hotcracking, which is not considered by either the first- orsecond-order RDG models for HCS used here.
On the basis of the above discussion, the first-levelRDG criterion is sufficient to justify the benefits ofadding Si-rich filler wire into the Al-Li alloy welds,however, it is not capable of distinguishing the variation
brought by the small changes in welding power. Indeed,by applying the first-level RDG criterion, which dependsonly on the composition of the fusion zone, it would bepredicted that a higher weld power should producefewer defects, whereas the opposite was observed. Thesecond-level RDG criterion, which also includes theeffects of the thermal field and microstructure (sec-ondary arm spacing), predicts the opposite trend: weldsproduced at higher power will be more susceptible to hotcracking and this agrees with the observations. Thistrend of increasing hot crack susceptibility at increasingweld power is consistent with previous studies on otheraluminum alloy systems.[20] It should be noted thatneither the first nor the second level of RDG criterioncan determine whether the weld will or will not actuallycrack at the end of solidification. It only gives relativeindication of the likelihood of hot cracking. Also, it canonly be used as an indicator of the initiation, rather thanpredict the length or propagation of the hot crack. Tomake a final decision of the optimized welding param-eters, other factors such as weld surface morphology,welding efficiency, and mechanical properties still needto be considered. However, the present model still
Fig. 14—Visualization of X-ray tomography results reveal the cracks inside the welds obtained through various laser welding powers: (a) 1400W, (b) 1700 W, and (c) 2000 W (Color figure online).
Fig. 15—Ortho slice of XCT cross-sectional view of weld obtainedthrough 2000 W laser.
METALLURGICAL AND MATERIALS TRANSACTIONS A
provides a useful tool to aid selection of likely suit-able process parameters and filler material, and providesa physics-based framework to determine these param-eters rather than the usual entirely empirical approach.
V. CONCLUSIONS
In summary, a coupled model has been developed andvalidated for assessing the hot cracking susceptibility(HCS) of an Al-Li alloy structure during dual-beamlaser welding processes. The finite element processmodel was able to simulate the thermal history thewelds have experienced and provide the input parame-ters needed for the prediction of HCS. The HCS modelhas been developed through adapting an existing modeldeveloped by Rappaz, Drezet, and Gremaud (RDG) forprediction of cracking during casting. The RDG modelcan be used at two levels of complexity. At the first level,the prediction depends only on the melt pool composi-tion during welding. It was demonstrated that at thislevel, the model correctly predicts the beneficial effect ofusing a Si-rich filler material, but predicts the wrongtrend between weld power and HCS. Only using thesecond-level RDG model, which also includes thethermal history, can the correct trend between increas-ing weld power and increasing HCS be captured.
X-ray tomography reveals that in addition to hotcracks, which are predicted by the present model, thewelds can contain other defects in the form of gasporosity. The model framework presented here does notpredict such porosity, but this would be required for acomplete prediction of weld integrity. Nevertheless, themodel developed here provides a useful tool in guidingweld process and filler selection, as well as helping inunderstanding the factors that contribute to HCS.Although applied to the specific case of laser weldingof Al-Li alloys, the model methodology could readily beadapted to other welding processes and aluminum alloyclasses.
ACKNOWLEDGMENTS
The work is financially supported by a EuropeanClean Sky Programme ‘Laser Welding of NewlyDeveloped Al-Li Alloy (LAWENDEL)’, Grant Agree-ment No: 325703. The authors also thank supportfrom EPSRC LATEST-2 programme grant (EP/H020047/1). Thanks to the Manchester X-ray ImagingFacility, which was funded in part by the EPSRC
(Grants EP/F007906/1, EP/F001452/1, and EP/I02249X/1).
OPEN ACCESS
This article is distributed under the terms of theCreative Commons Attribution 4.0 InternationalLicense (http://creativecommons.org/licenses/by/4.0/),which permits unrestricted use, distribution, and re-production in any medium, provided you give appro-priate credit to the original author(s) and the source,provide a link to the Creative Commons license, andindicate if changes were made.
REFERENCES
1. A. Kostrivas and J.C. Lippold: Int. Mater. Rev., 1999, vol. 44,p. 217.
2. J.R. Pickens: J. Mater. Sci., 1990, vol. 25, p. 3035.3. P.A. Molian and T.S. Srivatsan: J. Mater. Sci., 1990, vol. 25,
p. 3347.4. J.R. Pickens: J. Mater. Sci., 1985, vol. 20, p. 4247.5. M. Rappaz, J.-M. Drezet, and M. Gremaud:Metall. Mater. Trans.
A, 1999, vol. 30A, p. 449.6. S. Kou: Acta Mater., 2015, vol. 88, p. 366.7. N. Coniglio and C.E. Cross: Metall. Mater. Trans. A, 2009,
vol. 40A, p. 2718.8. L. Sweet, M.A. Easton, J.A. Taylor, J.F. Grandfield, C.J.
Davidson, L. Lu, M.J. Couper, and D.H. StJohn: Metall. Mater.Trans. A, 2012, vol. 44A, p. 5396.
9. M.A. Easton, H. Wang, J. Grandfield, C.J. Davidson, D.H.StJohn, L.D. Sweet, and M.J. Couper: Metall. Mater. Trans. A,2012, vol. 43A, p. 3227.
10. N. Hatami, R. Babaei, M. Dadashzadeh, and P. Davami: J. Ma-ter. Process. Technol., 2008, vol. 205, p. 506.
11. J.-M. Drezet, M. S.-F. Lima, J.-D. Wagniere, M. Rappaz, and W.Kurz, in Invit. Lect. 61st Inter. Conf. Inter. Inst. Weld. (Graz, Italy,2008).
12. J. Goldak, A. Chakravarti, and M. Bibby: Metall. Trans. B, 1984,vol. 15, p. 299.
13. A. Lundback and H. Runnemalm: Sci. Technol. Weld. Join., 2005,vol. 10, p. 717.
14. A. Larsen, M. Stolpe, and J.H. Hattel: Eng. Comput., 2012,vol. 29, p. 65.
15. D.G. Eskin and L. Katgerman: Metall. Mater. Trans. A, 2007,vol. 38A, p. 1511.
16. T. Clyne and G. Davies: Br. Foundrym., 1981, vol. 74, p. 65.17. W. Kurz and D.J. Fisher: Fundamentals of Solidification, 3rd ed.,
Trans Tech, Switzerland, 1992.18. Z. Guo, N. Saunders, A.P. Miodownik, and J.P. Schille, in Proc.
7th Pacific Rim Int. Conf. Model. Cast. Solidif. Process. (Dalian,China, 2007), pp. 19–22.
19. J.-M. Drezet and D. Allehaux, in Hot Crack. Phenom. Welds II(2008), pp. 19–37.
20. G. Mathers: The Welding of Aluminium and Its Alloys, WoodheadPublishing Ltd, Cambridge, 2002.
METALLURGICAL AND MATERIALS TRANSACTIONS A