Embed Size (px)
Citation preview

1
Process knowledge in foundries By
Dr.Hathibelagal Roshan Chief Metallurgist
Maynard Steel Casting Company
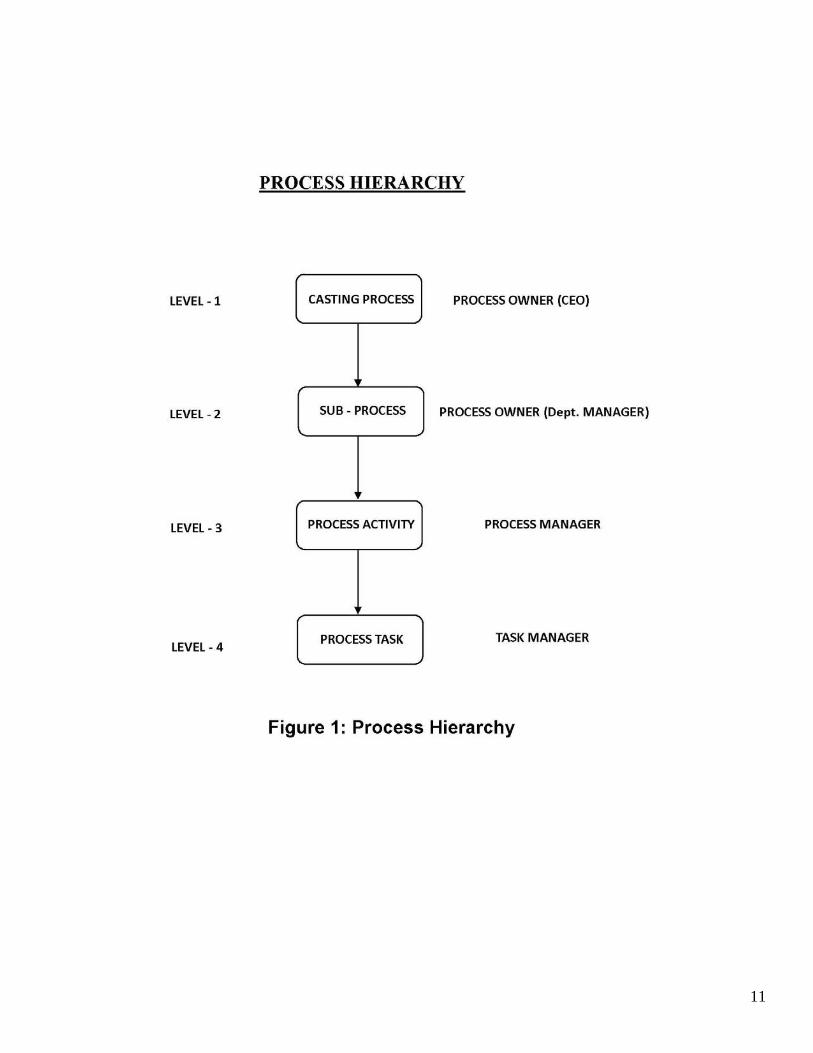
ABSTRACT: In order to be profitable, foundries need to have adequate process knowledge on the various processes used by them to manufacture the specific parts needed by their customers. In spite of a large number of publications on various aspects of metal casting processes, there appears to be a lack of gap in technology to specifically define process knowledge. Process knowledge is defined as the list of process variables, their collection system, visualization system and analysis to determine the ranges of relevant process variables that are related to the product characteristics for specific castings made in the foundries. It is not adequate to just focus on individual sub-processes in the foundry and try to control its process variables in a general way. It is essential to focus on the critical product characteristics that are related to the acceptance criteria and document the process knowledge relevant to the specific part. It is possible that the process knowledge relevant for one part need not be the same for another part in the same foundry. For example, in the melting of steel with Al content of 0.06 max may be satisfactory for one part and may not be adequate for another part that requires Al 0.03 max in order to meet the product characteristics requirement of the freedom from conchoidal fracture of the test specimens. INTRODUCTION: On average foundries lose a minimum of 5% of their revenue in internal and external failure costs. This indicates that foundries do not have the technology to produce castings without incurring these costs that could affect their profitability. We have a serious problem of Technology Gap in our foundry industry. The gap in technology lies in the lack of process knowledge in foundries and lack of adequate personnel trained in process control. PROCESS KNOWLEDGE: Process knowledge is defined as the list of process variables, their collection system, visualization system and analysis to determine the ranges of relevant process variables that are in deed related to the product characteristics for specific castings made in the foundries. BUSINESS PROCESS: Business process is a series of activities that are performed to produce a defined result. It has inputs which are transformed into outputs. The inputs can be data, material or state of things. Figure 1 shows the process hierarchy. Process in an organization can be divided into several levels such as Level 1 to Level 4 as indicated in figure 1. Level 1 contains highest level management process such as Casting Process. Level 1 process is decomposed into next lower level processes such as various sub-processes in Level 2. Figure 2 shows an example of process decomposition where Level 1 process is decomposed into level 2 processes. PROCESS CLASSIFICATION: In order to develop a computer based tool, there is a need for a hierarchal classification of the process and sub-process families. Figure 3 shows the taxonomy of the kingdom of PROCESS with part of shaping family expanded. The process kingdom has three families: shaping, joining and finishing. One of the families, namely shaping, is expanded to show classes namely: molding, deformation, casting etc. One these classes, namely casting is again expanded to show its members and sub-members.

2
METALCASTING PROCESS: Metal casting process is not a single process and has several Level 2 sub-processes. In order to define process knowledge, the various sub-processes can be identified as follows. The appropriate codes for each of the sub-processes are indicated in the parentheses against each of the sub-processes. Member Steel and sub-member Nobake are chosen for this classification.
1. Patternmaking/Methoding (GS-NB-1) 2. Molding (GS-NB-2) 3. Coremaking (GS-NB-3) 4. Melting (GS-NB-4) 5. Ladle/Pouring (GS-NB-5) 6. Shakeout (GS-NB-6) 7. Heat Treatment (GS-NB-7) 8. Welding (GS-NB-8) 9. Cleaning (GS-NB-9)
PROCESS KNOWLEDGE: Process knowledge can be represented into the following components:
1. Factor Response Table (1) 2. Process Map – Box-Arrow Diagram (2) 3. Process Flow Chart (3) 4. Swimlane Process Map (4) 5. SIPOC diagram with FPRs (5) 6. Value Stream Map (6) 7. Cause and Effect Diagram (7) 8. Cause and Effect Matrix (8) 9. FMEA (9) 10. P-Matrix Case studies (10) 11. Published Literature (11) Examples of each of the above are given below
1. FACTOR RESPONSE TABLE: Responses are the outcome of processes that are relevant to either internal or external customers. For the purpose of defining process knowledge, the various responses are identified as follows: Major categories of responses are given below: Y1: Casting Dimensions Y2: Casting Defects Y3: DPMOs Y4: Quality Costs

3
Each of the above major response categories are again expanded to sub-categories of responses as indicated below.
Code Name Y1-1 Casting Dimensions Y2-1 Runout Y2-2 Inclusions Y2-3 Shrinkage Y2-4 Misrun Y2-5 Erosion Y2-6 Penetration Y2-7 Hot Tear Y2-8 Type II Sulfides Y2-9 Incorrect impacts Y2-10 Incorrect mechanicals Y2-11 Blowholes- Pinholes Y2-12 Cracks Y2-13 Broken Molds Y2-14 Flash Y3-1 DPMO-Redlights Y3-2 DPMO-Missed Deliveries Y3-3 DPMO-Quality issues Y3-4 DPMO-Retests Y3-5 DPMO-ReHeatTreats Y4-1 Quality Cost-Internal Failure Y4-2 Quality Cost-External Failure
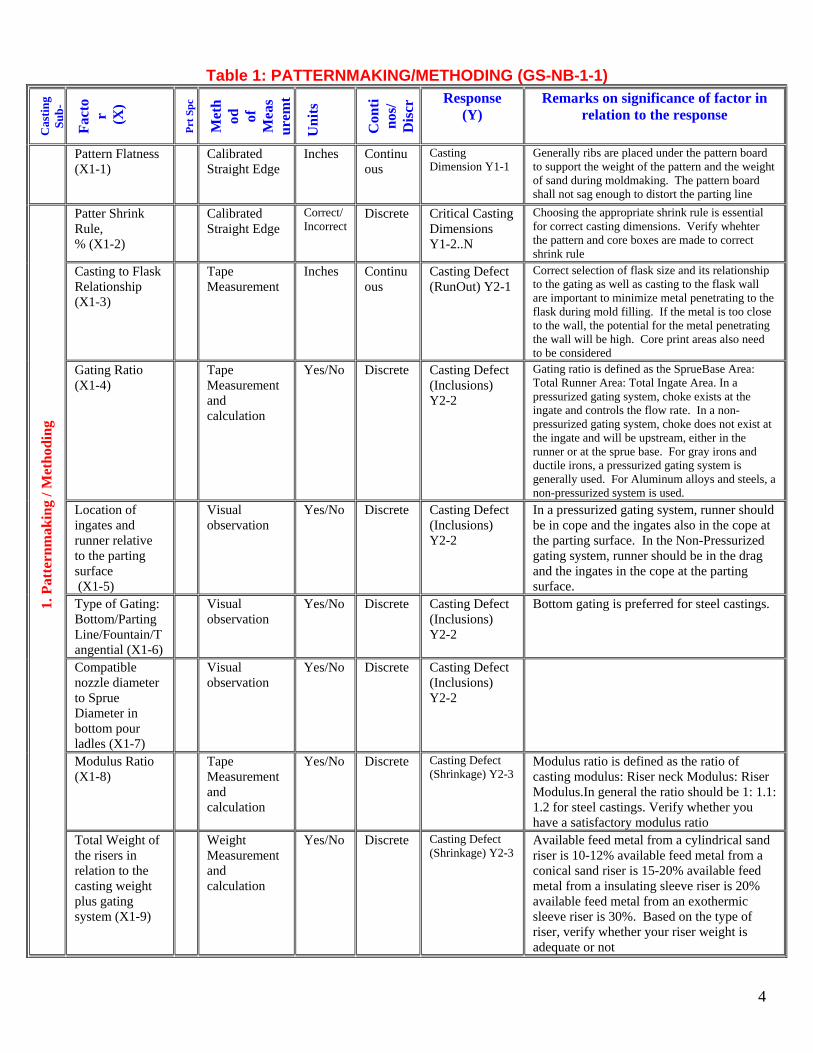
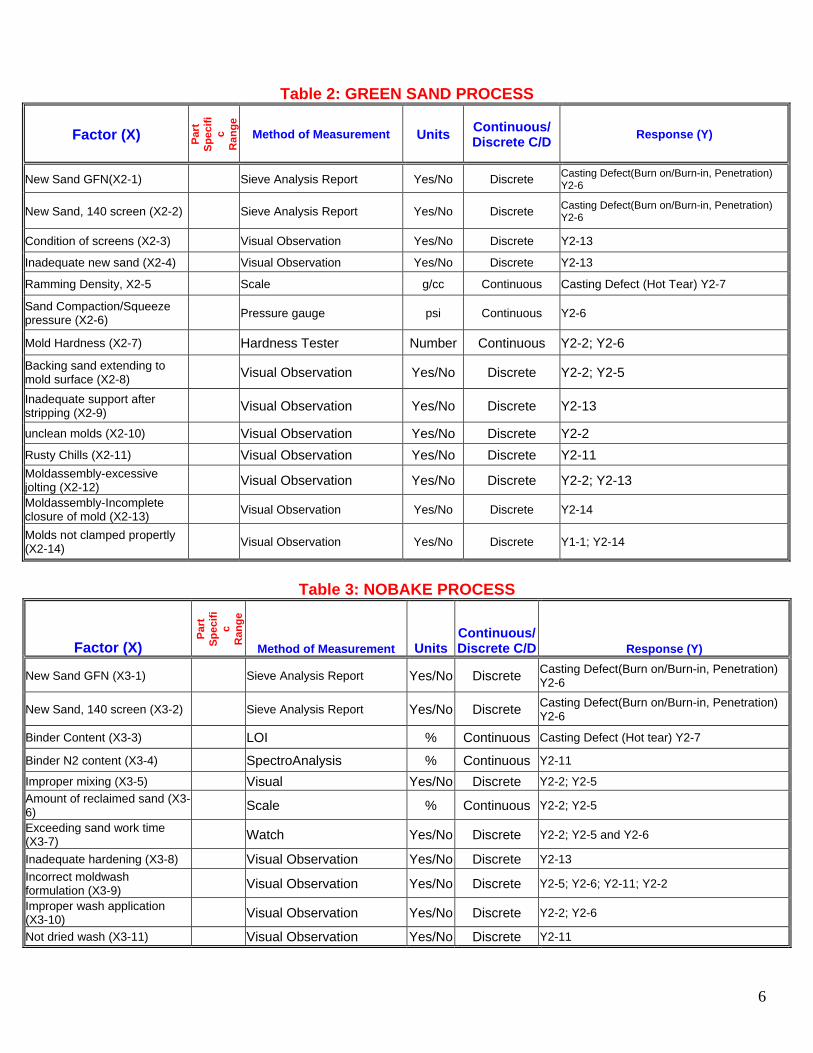
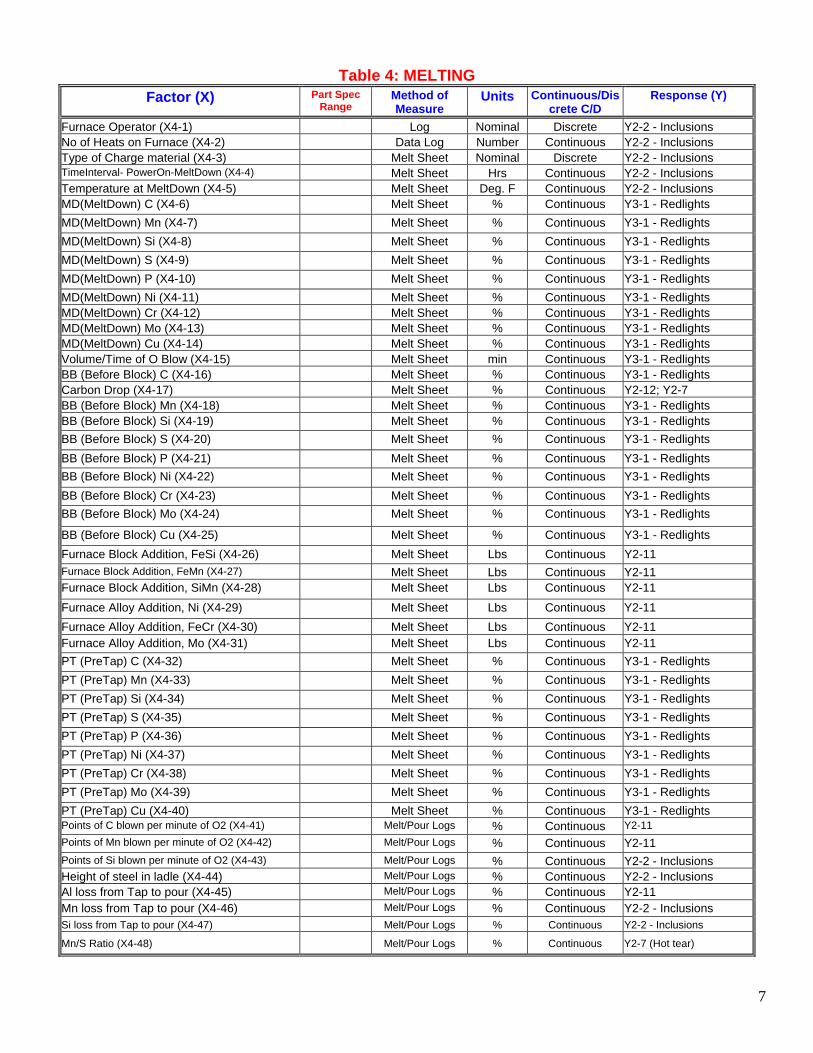
It is necessary to determine which responses are relevant to the various sub-processes in the foundry. Also, it is necessary to identify the various factors and the corresponding responses in the various sub-processes in the foundry. Examples of process knowledge in the form of Factor-Response tables relating to the various sub-processes are shown in tables 1 to 9 below.
4
Table 1: PATTERNMAKING/METHODING (GS-NB-1-1)
Cas
tin
g Su
b-
Fac
tor
(X
)
Prt
Sp
c
Met
hod
of
M
eas
ure
mt
Un
its
Con
tin
os/
Dis
cr
Response (Y)
Remarks on significance of factor in relation to the response
Pattern Flatness (X1-1)
Calibrated Straight Edge
Inches Continuous
Casting Dimension Y1-1
Generally ribs are placed under the pattern board to support the weight of the pattern and the weight of sand during moldmaking. The pattern board shall not sag enough to distort the parting line
Patter Shrink Rule, % (X1-2)
Calibrated Straight Edge
Correct/ Incorrect
Discrete Critical Casting Dimensions Y1-2..N
Choosing the appropriate shrink rule is essential for correct casting dimensions. Verify whehter the pattern and core boxes are made to correct shrink rule
1. P
atte
rnm
akin
g / M
eth
odin
g
Casting to Flask Relationship (X1-3)
Tape Measurement
Inches Continuous
Casting Defect (RunOut) Y2-1
Correct selection of flask size and its relationship to the gating as well as casting to the flask wall are important to minimize metal penetrating to the flask during mold filling. If the metal is too close to the wall, the potential for the metal penetrating the wall will be high. Core print areas also need to be considered
Gating Ratio (X1-4)
Tape Measurement and calculation
Yes/No Discrete Casting Defect (Inclusions) Y2-2
Gating ratio is defined as the SprueBase Area: Total Runner Area: Total Ingate Area. In a pressurized gating system, choke exists at the ingate and controls the flow rate. In a non-pressurized gating system, choke does not exist at the ingate and will be upstream, either in the runner or at the sprue base. For gray irons and ductile irons, a pressurized gating system is generally used. For Aluminum alloys and steels, a non-pressurized system is used.
Location of ingates and runner relative to the parting surface (X1-5)
Visual observation
Yes/No Discrete Casting Defect (Inclusions) Y2-2
In a pressurized gating system, runner should be in cope and the ingates also in the cope at the parting surface. In the Non-Pressurized gating system, runner should be in the drag and the ingates in the cope at the parting surface.
Type of Gating: Bottom/Parting Line/Fountain/Tangential (X1-6)
Visual observation
Yes/No Discrete Casting Defect (Inclusions) Y2-2
Bottom gating is preferred for steel castings.
Compatible nozzle diameter to Sprue Diameter in bottom pour ladles (X1-7)
Visual observation
Yes/No Discrete Casting Defect (Inclusions) Y2-2
Modulus Ratio (X1-8)
Tape Measurement and calculation
Yes/No Discrete Casting Defect (Shrinkage) Y2-3
Modulus ratio is defined as the ratio of casting modulus: Riser neck Modulus: Riser Modulus.In general the ratio should be 1: 1.1: 1.2 for steel castings. Verify whether you have a satisfactory modulus ratio
Total Weight of the risers in relation to the casting weight plus gating system (X1-9)
Weight Measurement and calculation
Yes/No Discrete Casting Defect (Shrinkage) Y2-3
Available feed metal from a cylindrical sand riser is 10-12% available feed metal from a conical sand riser is 15-20% available feed metal from a insulating sleeve riser is 20% available feed metal from an exothermic sleeve riser is 30%. Based on the type of riser, verify whether your riser weight is adequate or not

5
Table 1: PATTERNMAKING/METHODING (GS-NB-1-1)(Contd.)
Cas
tin
g Su
b-P
roce
ss
Fac
tor
(X
)
Prt
Sp
c R
ange
Met
hod
of
M
easu
rem
t
Un
its
Con
tin
os/
D
iscr
ete
C/D
Response (Y)
Remarks on significance of factor in relation to the response
Blind Riser Design with Williams Core (X1-10)
Visual observation
Yes/No Discrete Casting Defect (Shrinkage) Y2-3
Care should be taken while designing the blind risers. They will be effective only when the atmospheric pressure acts on the liquid metal inside the riser. Williams cores or V-notches need to be provided on the blind risers to permit the atmospheric pressure act on the blind risers.
Blind Riser Design with Flowoff (X1-11)
Visual observation
Yes/No Discrete Casting Defect (Shrinkage) Y2-3
Care should be taken while designing the blind risers. They will be effective only when the atmospheric pressure acts on the liquid metal inside the riser. You need to provide a good vent from the top of the blind riser to the top of the mold.
1. P
atte
rnm
akin
g / M
eth
odin
g
Magma Simulation - Porosity Results with 35% Feeding Effectivity (X1-12)
Filling Simulation
Yes/No Discrete Casting Defect (Shrinkage) Y2-3
Verify the results of Magma Simulation for locations of Macro porosity in the casting
Magma Simulation - Niyama Criterion (X1-13)
Filling Simulation
Yes/No Discrete Casting Defect (Shrinkage) Y2-3
Verify the results of Magma Simulation for locations of Micro porosity in the casting. Niyama indications should not be present in the machined areas.
Magma Simulation - Flow Rate (X1-14)
Filling Simulation
Yes/No Discrete Casting Defect (Misrun) Y2-4
It is necessary to design the gating system to have the highest flow rate and lowest ingate velocity possible. Do not exceed 1 m/sec ingate velocity. Verify the simulation results and ensure that at the end of the fill time, no portion of the mold cavity is below the solidus temperature and preferably above the liquidus temperature
Magma Simulation - Fill time (X1-15)
Filling Simulation
Yes/No Discrete Casting Defect (Erosion) Y2-5
It is necessary to design the gating system to have the appropriate fill time. Too long a fill time, will result in erosion defects. Too short a fill time will result in inconsistencies in pouring and thermal shocks in the molds and cores.
Location and Size of Chills (X1-16)
Yes/No Discrete Casting Defect (HotTear)Y2-7
Modulus Ratio (X1-17)
Yes/No Discrete Casting Defect (Shrinkage) Y2-3
Volumetric Efficiency (X1-18)
Yes/No Discrete Casting Defect (Shrinkage)Y 2-3
Feeder Height/diameter (X1-19)
Yes/No Discrete Casting Defect (Shrinkage) Y2-3
Worn out damaged pattern (X1-20)
Yes/No Discrete Y2-1; Y2-14
Under dried sleeves (X1-21)
Yes/No Discrete Y2-11;Y2-2
Sleeve pad not provided (X1-22)
Yes/No Discrete Y2-2
6
Table 2: GREEN SAND PROCESS
Factor (X) Par
t S
pec
ifi
c R
ang
e
Method of Measurement Units Continuous/ Discrete C/D
Response (Y)
New Sand GFN(X2-1) Sieve Analysis Report Yes/No Discrete Casting Defect(Burn on/Burn-in, Penetration) Y2-6
New Sand, 140 screen (X2-2) Sieve Analysis Report Yes/No Discrete Casting Defect(Burn on/Burn-in, Penetration) Y2-6
Condition of screens (X2-3) Visual Observation Yes/No Discrete Y2-13
Inadequate new sand (X2-4) Visual Observation Yes/No Discrete Y2-13
Ramming Density, X2-5 Scale g/cc Continuous Casting Defect (Hot Tear) Y2-7
Sand Compaction/Squeeze pressure (X2-6)
Pressure gauge psi Continuous Y2-6
Mold Hardness (X2-7) Hardness Tester Number Continuous Y2-2; Y2-6
Backing sand extending to mold surface (X2-8) Visual Observation Yes/No Discrete Y2-2; Y2-5
Inadequate support after stripping (X2-9) Visual Observation Yes/No Discrete Y2-13
unclean molds (X2-10) Visual Observation Yes/No Discrete Y2-2
Rusty Chills (X2-11) Visual Observation Yes/No Discrete Y2-11 Moldassembly-excessive jolting (X2-12) Visual Observation Yes/No Discrete Y2-2; Y2-13
Moldassembly-Incomplete closure of mold (X2-13)
Visual Observation Yes/No Discrete Y2-14
Molds not clamped propertly (X2-14)
Visual Observation Yes/No Discrete Y1-1; Y2-14
Table 3: NOBAKE PROCESS
Factor (X)
Par
t S
pec
ifi
c R
ang
e
Method of Measurement UnitsContinuous/Discrete C/D Response (Y)
New Sand GFN (X3-1) Sieve Analysis Report Yes/No Discrete Casting Defect(Burn on/Burn-in, Penetration) Y2-6
New Sand, 140 screen (X3-2) Sieve Analysis Report Yes/No Discrete Casting Defect(Burn on/Burn-in, Penetration) Y2-6
Binder Content (X3-3) LOI % Continuous Casting Defect (Hot tear) Y2-7
Binder N2 content (X3-4) SpectroAnalysis % Continuous Y2-11
Improper mixing (X3-5) Visual Yes/No Discrete Y2-2; Y2-5
Amount of reclaimed sand (X3-6) Scale % Continuous Y2-2; Y2-5
Exceeding sand work time (X3-7) Watch Yes/No Discrete Y2-2; Y2-5 and Y2-6
Inadequate hardening (X3-8) Visual Observation Yes/No Discrete Y2-13
Incorrect moldwash formulation (X3-9) Visual Observation Yes/No Discrete Y2-5; Y2-6; Y2-11; Y2-2
Improper wash application (X3-10) Visual Observation Yes/No Discrete Y2-2; Y2-6
Not dried wash (X3-11) Visual Observation Yes/No Discrete Y2-11
7
Table 4: MELTING
Factor (X) Part Spec Range
Method of Measure
Units Continuous/Discrete C/D
Response (Y)
Furnace Operator (X4-1) Log Nominal Discrete Y2-2 - Inclusions No of Heats on Furnace (X4-2) Data Log Number Continuous Y2-2 - Inclusions Type of Charge material (X4-3) Melt Sheet Nominal Discrete Y2-2 - Inclusions TimeInterval- PowerOn-MeltDown (X4-4) Melt Sheet Hrs Continuous Y2-2 - Inclusions Temperature at MeltDown (X4-5) Melt Sheet Deg. F Continuous Y2-2 - Inclusions MD(MeltDown) C (X4-6) Melt Sheet % Continuous Y3-1 - Redlights
MD(MeltDown) Mn (X4-7) Melt Sheet % Continuous Y3-1 - Redlights
MD(MeltDown) Si (X4-8) Melt Sheet % Continuous Y3-1 - Redlights
MD(MeltDown) S (X4-9) Melt Sheet % Continuous Y3-1 - Redlights
MD(MeltDown) P (X4-10) Melt Sheet % Continuous Y3-1 - Redlights
MD(MeltDown) Ni (X4-11) Melt Sheet % Continuous Y3-1 - Redlights MD(MeltDown) Cr (X4-12) Melt Sheet % Continuous Y3-1 - Redlights MD(MeltDown) Mo (X4-13) Melt Sheet % Continuous Y3-1 - Redlights MD(MeltDown) Cu (X4-14) Melt Sheet % Continuous Y3-1 - Redlights Volume/Time of O Blow (X4-15) Melt Sheet min Continuous Y3-1 - Redlights BB (Before Block) C (X4-16) Melt Sheet % Continuous Y3-1 - Redlights Carbon Drop (X4-17) Melt Sheet % Continuous Y2-12; Y2-7 BB (Before Block) Mn (X4-18) Melt Sheet % Continuous Y3-1 - Redlights BB (Before Block) Si (X4-19) Melt Sheet % Continuous Y3-1 - Redlights
BB (Before Block) S (X4-20) Melt Sheet % Continuous Y3-1 - Redlights
BB (Before Block) P (X4-21) Melt Sheet % Continuous Y3-1 - Redlights
BB (Before Block) Ni (X4-22) Melt Sheet % Continuous Y3-1 - Redlights
BB (Before Block) Cr (X4-23) Melt Sheet % Continuous Y3-1 - Redlights
BB (Before Block) Mo (X4-24) Melt Sheet % Continuous Y3-1 - Redlights
BB (Before Block) Cu (X4-25) Melt Sheet % Continuous Y3-1 - Redlights
Furnace Block Addition, FeSi (X4-26) Melt Sheet Lbs Continuous Y2-11
Furnace Block Addition, FeMn (X4-27) Melt Sheet Lbs Continuous Y2-11 Furnace Block Addition, SiMn (X4-28) Melt Sheet Lbs Continuous Y2-11
Furnace Alloy Addition, Ni (X4-29) Melt Sheet Lbs Continuous Y2-11
Furnace Alloy Addition, FeCr (X4-30) Melt Sheet Lbs Continuous Y2-11 Furnace Alloy Addition, Mo (X4-31) Melt Sheet Lbs Continuous Y2-11
PT (PreTap) C (X4-32) Melt Sheet % Continuous Y3-1 - Redlights
PT (PreTap) Mn (X4-33) Melt Sheet % Continuous Y3-1 - Redlights
PT (PreTap) Si (X4-34) Melt Sheet % Continuous Y3-1 - Redlights
PT (PreTap) S (X4-35) Melt Sheet % Continuous Y3-1 - Redlights
PT (PreTap) P (X4-36) Melt Sheet % Continuous Y3-1 - Redlights
PT (PreTap) Ni (X4-37) Melt Sheet % Continuous Y3-1 - Redlights
PT (PreTap) Cr (X4-38) Melt Sheet % Continuous Y3-1 - Redlights
PT (PreTap) Mo (X4-39) Melt Sheet % Continuous Y3-1 - Redlights
PT (PreTap) Cu (X4-40) Melt Sheet % Continuous Y3-1 - Redlights Points of C blown per minute of O2 (X4-41) Melt/Pour Logs % Continuous Y2-11
Points of Mn blown per minute of O2 (X4-42) Melt/Pour Logs % Continuous Y2-11
Points of Si blown per minute of O2 (X4-43) Melt/Pour Logs % Continuous Y2-2 - Inclusions Height of steel in ladle (X4-44) Melt/Pour Logs % Continuous Y2-2 - Inclusions Al loss from Tap to pour (X4-45) Melt/Pour Logs % Continuous Y2-11 Mn loss from Tap to pour (X4-46) Melt/Pour Logs % Continuous Y2-2 - Inclusions Si loss from Tap to pour (X4-47) Melt/Pour Logs % Continuous Y2-2 - Inclusions
Mn/S Ratio (X4-48) Melt/Pour Logs % Continuous Y2-7 (Hot tear)

8
TABLE 5: LADLE – POURING
Factor (X)
Part Spec
RangeMethod of Measure
Units
Continuous/Discrete
C/D
Response (Y)
Ladle Additions, Al (X5-1) Melt Sheet Lbs Continuous Y3-Redlights
LT (Ladle)C (X5-2) Melt Sheet % Continuous Y3-Redlights
LT (Ladle)Mn (X5-3) Melt Sheet % Continuous Y3-Redlights
LT (Ladle)Si (X5-4) Melt Sheet % Continuous Y3-Redlights
LT (Ladle)S (X5-5) Melt Sheet % Continuous Y3-Redlights
LT (Ladle)P (X5-6) Melt Sheet % Continuous Y3-Redlights
LT (Ladle)Ni (X5-7) Melt Sheet % Continuous Y3-Redlights
LT (Ladle)Cr (X5-8) Melt Sheet % Continuous Y3-Redlights
LT (Ladle)Mo (X5-9) Melt Sheet % Continuous Y3-Redlights
LT (Ladle)Cu (X5-10) Melt Sheet % Continuous Y3-Redlights
LT (Ladle)Al (X5-11) Melt Sheet % Continuous Y3-Redlights
LT (Ladle)N (X5-12) Melt Sheet % Continuous Y3-Redlights
LT (Ladle)Ti (X5-13) Melt Sheet % Continuous Y3-Redlights
LT (Ladle)Ca (X5-14) Melt Sheet % Continuous Y3-Redlights
LT (Ladle)Zr (X5-15) Melt Sheet % Continuous Y3-Redlights
LT (Ladle)V (X5-16) Melt Sheet % Continuous Y3-Redlights
LT (Ladle)B (X5-17) Melt Sheet % Continuous Y3-Redlights
Tap Temperature (X5-18) Melt Sheet degF Continuous Y2-2; Y2-11 Tap time (X5-19) Melt Sheet Hrs Continuous Y2-2; Y2-11
Ladle Number (X5-20) Melt Sheet Log Discrete Y2-2; Y2-11
No of times stopper used (X5-21) Pouring Log Log Discrete Y2-2; Y2-11
First Ladle Temperature (X5-22) Pouring Log degF Continuous Y2-2; Y2-11
First Ladle Time (X5-23) Pouring Log Hrs Continuous Y2-2; Y2-11
Last Ladle Temp (X5-24) Pouring Log degF Continuous Y2-2; Y2-11
Last Ladle Time (X5-25) Pouring Log Hrs Continuous Y2-2; Y2-11
Volme-Time of Argon Stir (X5-26) Pouring Log min Continuous Y2-2; Y2-11
Start Pour time (X5-27) Pouring Log Hrs Continuous Y2-2; Y2-11
Estimated Pour Temp (X5-28) Pouring Log degF Continuous Y2-7 (Hot tear)
Finish Pour Time (X5-29) Pouring Log Hrs Continuous Y2-2; Y2-11 Weight of Steel in ladle (X5-30) Pouring Log lbs Continuous Y2-2; Y2-11 Weight of slag in ladle (X5-31) Pouring Log Lbs Continuous Y2-2; Y2-11 Pour time in each mold (X5-32) Pouring Log sec Continous Y2-7 (Hot Tear)
Height of nozzle above pouring basin-cup (X5-33) Pouring Log in Continuous Y2-2; Y2-11
Quality of Pour (X5-34) Pouring Log ok/not Ok Discrete Y2-2; Y2-11
Quality-Furnace Slag (X5-35) Melt/Pour Logs ok/not ok Discrete Y2-2; Y2-11 Quality Ladle Slag (X5-36) Melt/Pour Logs ok/not ok Discrete Y2-2; Y2-11
Ladle preheat condition (X5-37) Melt/Pour Logs ok/notok Discrete Y2-2; Y2-11
Ladle Patch condition (X5-38) Melt/Pour Logs ok/not ok Discrete Y2-2; Y2-11 Insulating cover omitted (X5-39) Melt/Pour Logs yes/no Discrete Y2-3 Feeder heads overfilled (X5-40) Melt/Pour Logs yes/no Discrete Y2-3
Feederneads poured short (X5-41) Melt/Pour Logs yes/no Discrete Y2-3

9
TABLE 6: SHAKEOUT Factor (X) Part Spec
Range Method of Measure
Units Continuous /Discrete/ C/D
Response (Y)
Shakeout time (X6-1) Shakeout Record
Y2-7; Y2-12
Green Anneal Austenitizing Temp (X6-2) Ht record Deg. F continuous Y2-10
Green Anneal Austenitizing Time (X6-3) Ht record hrs continuous Y2-10
Stress Relief Temp after cut and scarf (X6-4) Ht record degF continuous Y2-10
Stress Relief Time after cut and scarf (X6-5) Ht record hrs continuous Y2-10
Existence of Flash/Fin (X6-6) Log Yes/No Discrete Casting Defect (Hot Tear) Y2-7
Improper reinforcements in mold (X6-7) Log Yes/No Discrete Casting Defect (Hot Tear) Y2-7
Shakeout too early (X6-8) Log Yes/No Discrete Y2-7; Y2-12
Shakeout too late (X6-9) Log Yes/No Discrete Y2-7; Y2-12
TABLE 7: HEATTREATMENT
Factor (X) Part Spec Range
Method of Measure
Units Continuous /Discrete C/D
Response (Y)
Final HT Austenitizing Temp (X7-1) Ht record degF continuous Y2-10; Y2-9
Final HT Austenitizing Time (X7-2) Ht record hrs continuous Y2-10; Y2-9
Tempering Temp (X7-3) Ht record degF continuous Y2-10; Y2-9
Tempering Time (X7-4) Ht record hrs continuous Y2-10; Y2-9
TABLE 8: WELDING
Factor (X) Part Spec Range
Method of Measure Units
Continuous /Discrete C/D
Response (Y)
PQR No (X8-1) Weld Record yes/no discrete Y3-3
WPS Number (X8-2) Log yes/no discrete Y3-3
Welder-Operator (X8-3) Log name discrete Y3-3
Welding Machine (X8-4) Log number discrete Y3-3
Welding Process (SMAW, FCAW, GTAW)(X8-5) Weld Record name discrete Y3-3 Electrode Type (X8-6) Weld Record name discrete Y3-3
Electrode Dia (X8-7) Weld Record in continuous Y3-3
Current Amps (X8-8) Weld Record amps continuous Y3-3
Voltage Votls (X8-9) Weld Record volts continuous Y3-3
Travel speed (X8-10) Weld Record in/min continuous Y3-3
Min Pre Heat Temp (X8-11) Weld Record degF continuous Y2-12
Max Interpass Temp (X8-12) Weld Record degF continuous Y2-12
Post Weld HT - Temp (X8-13) Weld Record degF continuous Y2-12
Post Weld HT - Time (X8-14) Weld Record hrs continuous Y2-12
TABLE 9: CLEANING
Factor (X) Part Specific Range
Method of Measure
Units Continuous/ Discrete C/D
Response (Y)
Blasting (X9-1) Clock/scale manhrs/ton Continuous Y4-1 (Internal Failure Cost
Cutting (X9-2) Clock/scale manhrs/ton Continuous Y4-1 (Internal Failure Cost
Scarfing (X9-3) Clock/scale manhrs/ton Continuous Y4-1 (Internal Failure Cost
Chipping (X9-4) Clock/scale manhrs/ton Continuous Y4-1 (Internal Failure Cost
Grinding (X9-5) Clock/scale manhrs/ton Continuous Y4-1 (Internal Failure Cost
Welding (X9-6) Clock/scale manhrs/ton Continuous Y4-1 (Internal Failure Cost Rewelding (X9-7) Clock/scale manhrs/ton Continuous Y4-1 (Internal Failure Cost
Rechipping (X9-8) Clock/scale manhrs/ton Continuous Y4-1 (Internal Failure Cost

10
2. Process Map: Box-Arrow Diagram 3. Example of high level process map in the form of Box-Arrow diagram is shown figure 2 4. Process Flow Chart: 5. Example of Process Flow chart with reference to the melting process is shown in figure 4 below 6. Example of swimlane process map with reference to the heat treatment process is shown in figure 5
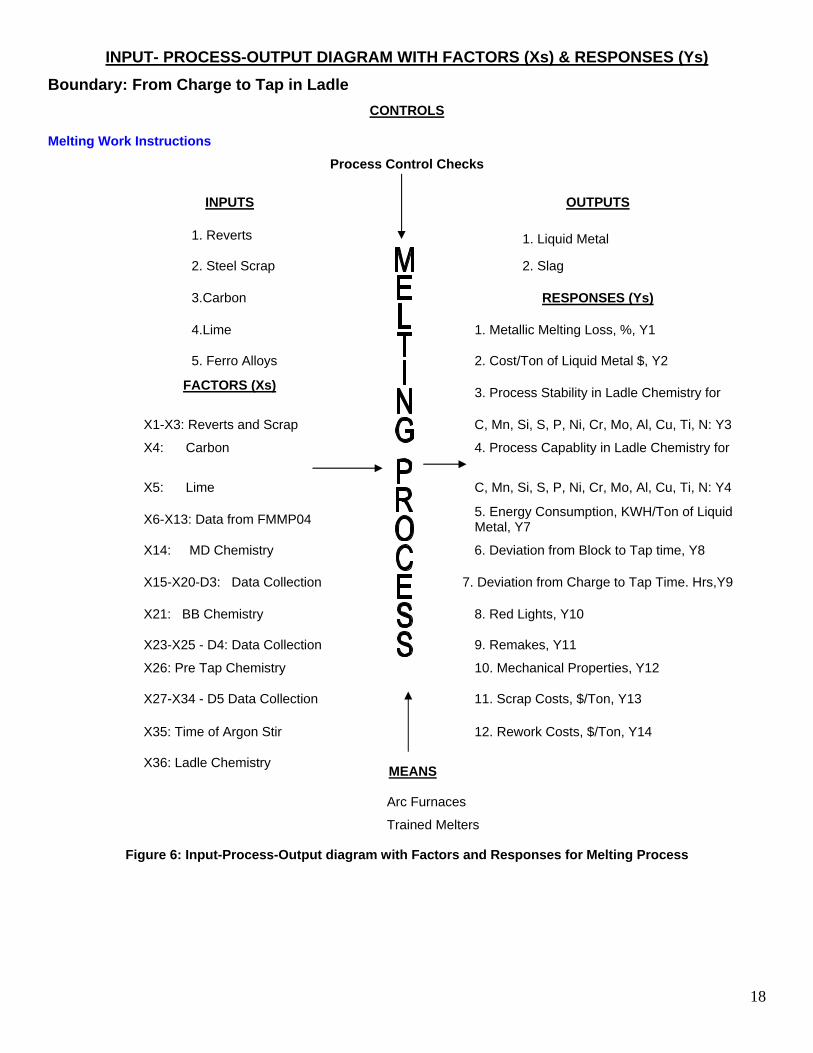
below 7. Example of IPO diagram with factors and responses is shown in figure 6 8. Example of Cause and Effect Diagram with reference to the Inclusions Defect is shown in figure 7
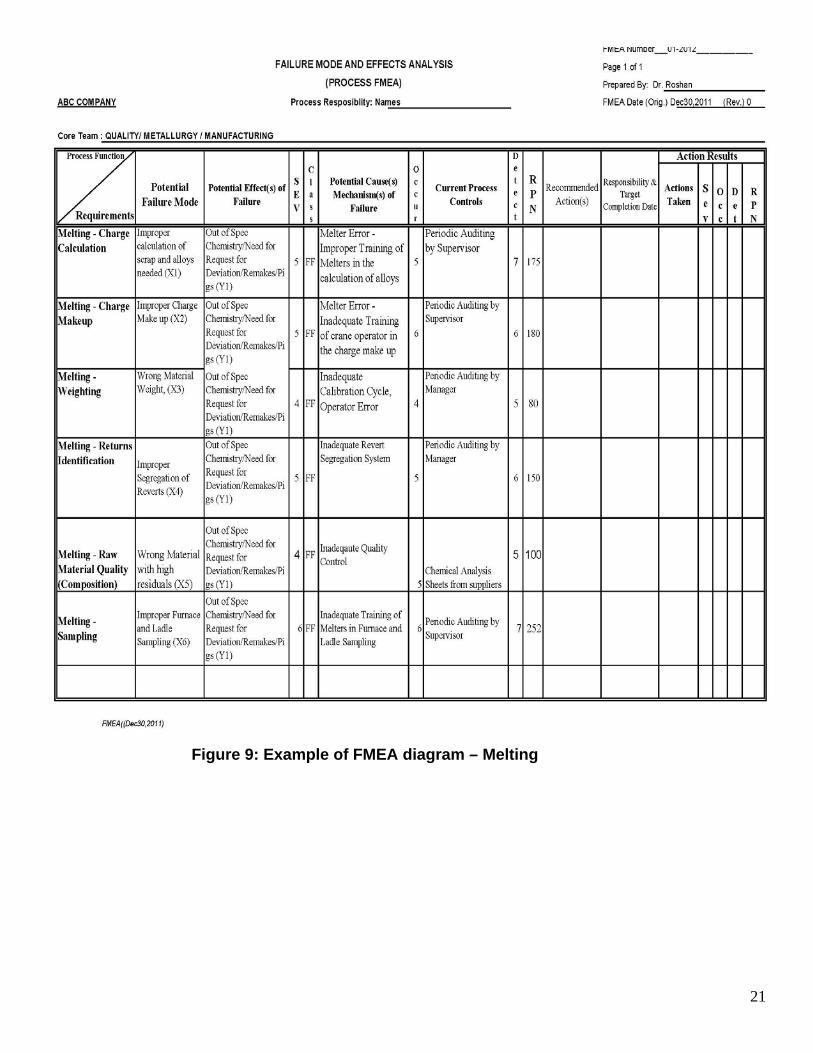
below 9. Example of Cause and Effect Matrix with reference to the Shrinkage defect is shown in figure 8 below 10. FMEA diagram with reference to the Melting process is shown in figure 9 below
SPECIFICATION LIMITS FOR FACTORS In general specification limits are specified by the customers for the product characteristics. However, the foundries need to determine the specification limits for the process parameters or the factors. The starting point for determining the specification limits is the determine the standard deviation value of the parameter. This can be determined by taking at least 30 consecutive values of the parameter. For a stable process, the upper and lower control limits for the parameter will be plus or minus 3 sigma. For a process capability of 1, the upper and lower specification limits would be same as the upper and lower control limits. Generally, it is desirable to have a process capability of 1.33. The foundry need to establish whether the response associated with this factor will be acceptable if the factors values fluctuates with plus or minus 3 standard deviations of the factor. If not, it is necessary to reduce the standard deviation of the factor in question to such a low value that the fluctuation between plus or minus 3 standard deviations will not affect the response related to the concerned variable. Summary: The taxonomy of the casting process with the various sub-processes is presented in this paper. The components of the process knowledge for each of the sub-processes are also presented with the examples. Various tables are constructed giving the details of the factors relevant to the sub-processes. The tables presented in this paper refer to Nobake process of Steel Castings only. There is a need to create such tables for all the sub-processes listed in this paper. Foundries are expected to use such tables as a guideline to create product specific tables with the column ‘Product specific specification range’ filled in appropriately. The foundries are recommended to review all the factors listed in the tables given in this paper and collect part specific data on these factors. Eventually, the foundries are expected to have a list of all the factors that are relevant to all the responses in their foundries and have a suitable system to collect data on the factors and responses. Foundries are also expected to have part specific specification limits for all the factors. The data collected on the factors during the manufacture of castings should have traceability to the responses on the castings made in the foundries. Such part specific process knowledge on the specification limits of factors will help foundries in minimizing the scrap and rework and improve the profitability.
11

12

13
Figure 3: Taxonomy of the Kingdom of Process with Casting Process expanded
Kingdom Family
Molding
Deformation
Casting
Composits
Powder
Protoypes
Class MemberProcess
KnowledgeSub ‐Member
Process Shaping
Joining
Finishing
Gray Iron (GI)
Ductile Iron
Copper (Cu)
Megnesium (Mg)
Nickel (Ni)
OTER ALLOYS (OA)
Alloy Iron (AI)
Steel (GS)
Aluminum (Al)
Zinc
Pressure Diecasting (DC)
Coldbox (CB)
Plaster Mold (PC)
Green Sand/ Horizontally Parted (GH)
NoBake (NB) (NB)
Investment Casting (IC)
Squeeze/Semi‐Solid(SC)
Permanent Mold (PM)
Green Sand / Vertically Parted (GV)
Centrifugal (CF)
Vaccum Casting (VC)
Lost Foam (EPC/Full Mold)(LF)
Continuous (CC)
V‐Process (VP)
Factor Response Table (1)
Process Map‐Box‐ Arrow Diagram (2)
Swimlane Process Map (4)
Value Stream Map(6)
FMEA
Cause & Effect Diagram (7)
Process Flow Chart (3)
SIPOC Diagram with FPRs (5)
Cause & Effect Matrix (8)
Low Pressure Die
P‐Matrix Case Studies (10)

14
PROCESS FLOW CHART – MELTING
Boundary: From Charge to Tap in Ladle
Form#: 001 Form#: 001
Form#: 001
Continued on Page 2
Dr. Roshan, Rev. 12/27/2011
1 of 3
Data Collection Xs [D1]
Charge Preparation & Charging [D1]
X1: Pink Revert, lbs X2: Plate Wt. Lbs X3: Bushlings, lbs X4: Carbon, lbs X5: Lime, lbs X6: Time at Start of Charge
Temperature Measurement
OK/Not OK
Sample to Lab for Testing
Yes
No
No
X7: KW Start/Finish X8: Heats on Lining X9: Heats on Roof X10: Ladle # X11: Nozzle Size X12: Time Power on X13: Time when change to B Tap
Arc Furnace Start-Melt Down [D2]
Yes
No
Workinst Data Collection Xs [D2]
Whether Back Charge
is needed
Yes
Daily unpoured Mold Report
WorkInstruction
Data Collection X14: MD
Chemistry
Review of Unpoured Mold List
V
Create Melt Schedule for the Furnaces – Pouring
Supervisor V
Write Recipe Instructions- Melter V
V
V
N
N
WorkInstruction
WorkInstruction

15
From Page 1
Form#: 001
Form#: 001
Form#: 001
Continued on Page 3
2 of 3
X15: Ni, lbs
X16: Moly, lbs
X17: Time at start of Blow
X18: Temp at start of Blow
X19: Time at end of Blow
X20: Temp at end of Blow Temperature Measurement
OK/Not OK
Sample to Lab for Testing
Data Collection Xs [D3]
Bring Furnace to Tap Temperature. Make Alloy additions [D4]
Temperature Measurement
OK/Not OK
Pre Tap Sample
to Lab for Testing
Yes
No
No
Yes
No
No
Arc Furnace Tapping&Deoxidation [D5]
Data Collection X21: BB Chemistry
Data Collection X26: Pre Tap
Chemistry
Data Collection Xs [D5]
X23: FeCr, lbs X24: SiMn, lbs X25: FeMn, lbs
Data Collection X22: FeSi, lbs
Data Collection Xs [D4]
X27: Tap Temp. X28: Furnace Tap Time X29: Aluminum, lbs X30: FeSi, lbs X31: Carbon, lbs X32: Calcibar, lbs X33: FeTi, lbs X34: SiMn, lbs
N
N
N
N
Arc Furnace Refining [D3] V
Block
V
V
Yes
V
WorkInstruction
WorkInstruction
WorkInstruction

16
From Page2
3of3
Figure 4: Process Flow Chart - Melting
Argon Stir
Temperature Measurement
OK/Not OK
Ladle Sample to Lab for Testing Red Light/Remake
Yes
No
Data Collection X36: Ladle Chemistry
No
Yes
N
Pour V
VData Collection X35: Time of Argon Stir
N
WorkInstruction
WorkInstruction

17
Figure 5: Example of Swimlane Process Map - Cleaning
18
INPUT- PROCESS-OUTPUT DIAGRAM WITH FACTORS (Xs) & RESPONSES (Ys)
Boundary: From Charge to Tap in Ladle
CONTROLS
Melting Work Instructions
Process Control Checks
INPUTS OUTPUTS
1. Reverts 1. Liquid Metal
2. Steel Scrap 2. Slag
3.Carbon RESPONSES (Ys)
4.Lime 1. Metallic Melting Loss, %, Y1
5. Ferro Alloys 2. Cost/Ton of Liquid Metal $, Y2
FACTORS (Xs)
3. Process Stability in Ladle Chemistry for
X1-X3: Reverts and Scrap C, Mn, Si, S, P, Ni, Cr, Mo, Al, Cu, Ti, N: Y3
X4: Carbon 4. Process Capablity in Ladle Chemistry for
X5: Lime C, Mn, Si, S, P, Ni, Cr, Mo, Al, Cu, Ti, N: Y4
X6-X13: Data from FMMP04 5. Energy Consumption, KWH/Ton of Liquid Metal, Y7
X14: MD Chemistry 6. Deviation from Block to Tap time, Y8
X15-X20-D3: Data Collection 7. Deviation from Charge to Tap Time. Hrs,Y9
X21: BB Chemistry 8. Red Lights, Y10
X23-X25 - D4: Data Collection 9. Remakes, Y11
X26: Pre Tap Chemistry 10. Mechanical Properties, Y12
X27-X34 - D5 Data Collection 11. Scrap Costs, $/Ton, Y13
X35: Time of Argon Stir 12. Rework Costs, $/Ton, Y14
X36: Ladle Chemistry
Figure 6: Input-Process-Output diagram with Factors and Responses for Melting Process
MEANS
Arc Furnaces
Trained Melters

19
CAUSE EFFECT DIAGRAM
Figure 7: Cause and Effect Diagram – Inclusions Defect

20
Figure 8: Cause and Effect Matrtix – Shrinkage Defect
21
Figure 9: Example of FMEA diagram – Melting
22
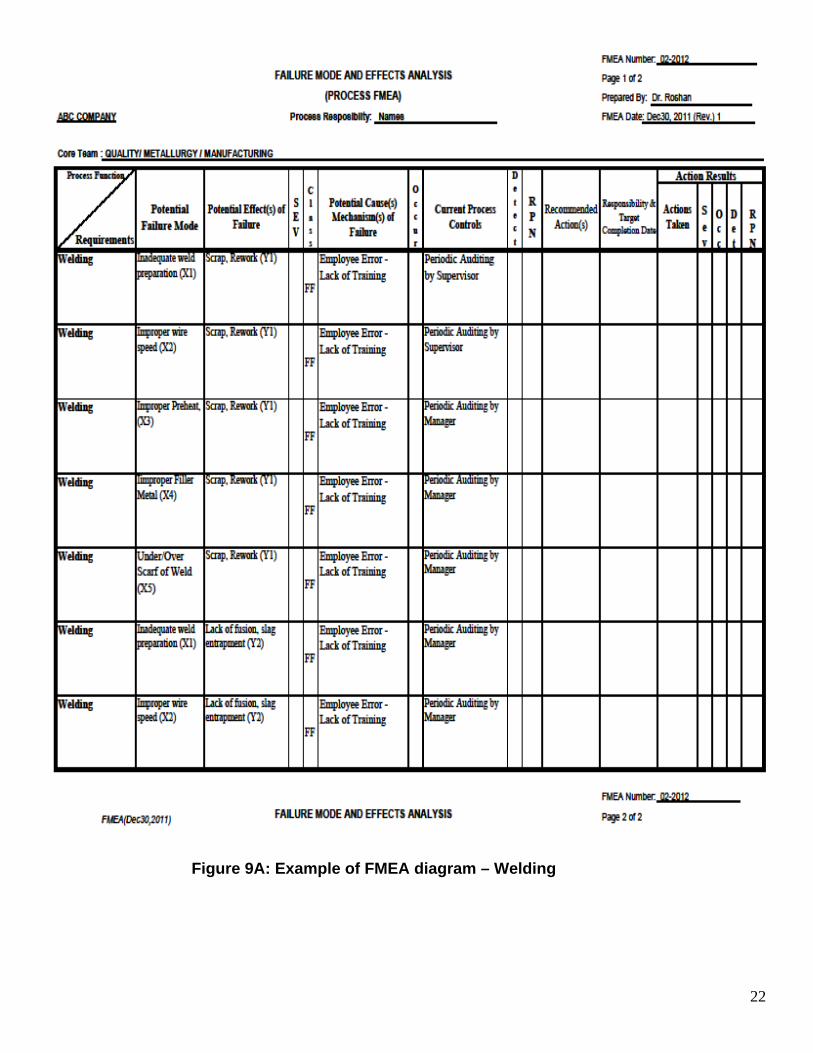
Figure 9A: Example of FMEA diagram – Welding
23
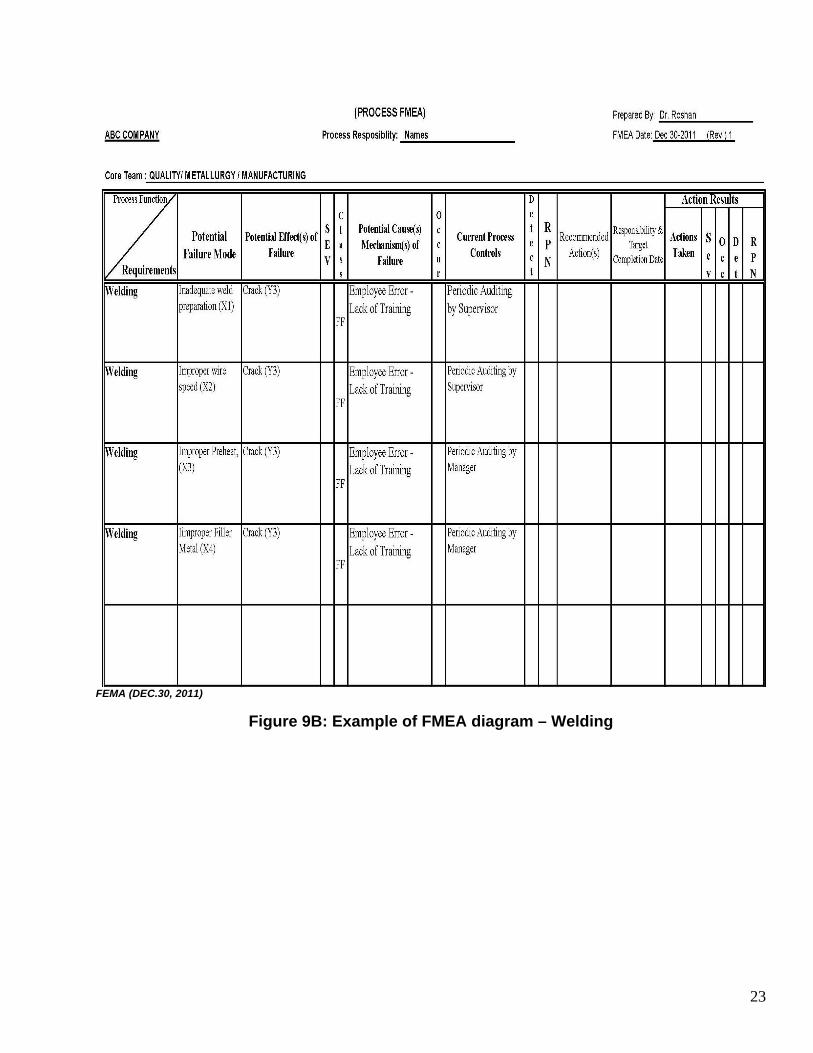
FEMA (DEC.30, 2011)
Figure 9B: Example of FMEA diagram – Welding