Embed Size (px)
Citation preview

Heriot-Watt University Research Gateway
Heriot-Watt University
Process Debottlenecking and Retrofit of Palm Oil Milling Process via Inoperability Input-Output ModellingMay Tan, May; Andiappan, Viknesh; Wan, Yoke Kin
Published in:MATEC Web of Conferences
DOI:10.1051/matecconf/201815201012
Publication date:2018
Document VersionPublisher's PDF, also known as Version of record
Link to publication in Heriot-Watt University Research Portal
Citation for published version (APA):May Tan, M., Andiappan, V., & Wan, Y. K. (2018). Process Debottlenecking and Retrofit of Palm Oil MillingProcess via Inoperability Input-Output Modelling. MATEC Web of Conferences, 152, [01012].https://doi.org/10.1051/matecconf/201815201012
General rightsCopyright and moral rights for the publications made accessible in the public portal are retained by the authors and/or other copyright ownersand it is a condition of accessing publications that users recognise and abide by the legal requirements associated with these rights.
If you believe that this document breaches copyright please contact us providing details, and we will remove access to the work immediatelyand investigate your claim.

Process Debottlenecking and Retrofit of Palm Oil Milling Process via Inoperability Input-Output Modelling
May May Tan1, Viknesh Andiappan2, and Yoke Kin Wan1*
1School of Engineering, Taylor’s University, Subang Jaya, Selangor, Malaysia. 2School of Engineering and Physical Sciences, Heriot-Watt University Malaysia, No. 1 Jalan Venna P5/2, Precinct 5, 62200 Putrajaya, Wilayah Persekutuan Putrajaya.
Abstract. In recent years, there has been an increase in crude palm oil (CPO) demand, resulting in palm oil mills (POMs) seizing the opportunity to increase CPO production to make more profits. A series of equipment are designed to operate in their optimum capacities in the current existing POMs. Some equipment may be limited by their maximum design capacities when there is a need to increase CPO production, resulting in process bottlenecks. In this research, a framework is developed to provide stepwise procedures on identifying bottlenecks and retrofitting a POM process to cater for the increase in production capacity. This framework adapts an algebraic approach known as Inoperability Input-Output Modelling (IIM). To illustrate the application of the framework, an industrial POM case study was solved using LINGO software in this work, by maximising its production capacity. Benefit-to-Cost Ratio (BCR) analysis was also performed to assess the economic feasibility. As results, the Screw Press was identified as the bottleneck. The retrofitting recommendation was to purchase an additional Screw Press to cater for the new throughput with BCR of 54.57. It was found the POM to be able to achieve the maximum targeted production capacity of 8,139.65 kg/hr of CPO without any bottlenecks.
1 Introduction
Crude palm oil (CPO) is a commodity with large potential and is the most versatile vegetable oil, with the ability to be processed into a range of products with different characteristics [1]. The global demand for palm oil has been increasing at a rapid speed due to the increase in consumption all over the world. The reason for the vast economic growth of palm oil is that it is cheap to produce and has a production rate 10 times that of soy oil, which is its direct competitor [2]. In a POM, CPO is extracted from fresh fruit bunches
1 Corresponding author: [email protected]
© The Authors, published by EDP Sciences. This is an open access article distributed under the terms of the Creative Commons Attribution License 4.0 (http://creativecommons.org/licenses/by/4.0/).
MATEC Web of Conferences 152, 01012 (2018) https://doi.org/10.1051/matecconf/201815201012Eureca 2017

(FFBs), which are harvested from oil palm trees. The process block diagram (PBD) of a typical POM is as depicted in Fig. 1.
Sterilizer POMESteam
Fresh Fruit Bunch (FFB)
Thresher
Digester
Screw Press
ClarificationTank
Depericarper
Nut Cracker
Winnowing Separator
Hydrocyclone
Kernel Dryer
Sterilised FFB
Palm Fruits
Digested Palm Fruits
EFB
Pressed CakePressed Liquor
PMF
Palm Nut
Kernel and Shell
Wet Kernels
PKS
Hot Water
POME
Kernel
CPO Wastewater
Steam
PKS
Fig. 1. Block flow diagram (BFD) of a typical POM process [3].
Each equipment in the POM has very specific functions and are designed to operate at their optimum capacities. When there is a need to increase CPO production, some of its
2
MATEC Web of Conferences 152, 01012 (2018) https://doi.org/10.1051/matecconf/201815201012Eureca 2017

(FFBs), which are harvested from oil palm trees. The process block diagram (PBD) of a typical POM is as depicted in Fig. 1.
Sterilizer POMESteam
Fresh Fruit Bunch (FFB)
Thresher
Digester
Screw Press
ClarificationTank
Depericarper
Nut Cracker
Winnowing Separator
Hydrocyclone
Kernel Dryer
Sterilised FFB
Palm Fruits
Digested Palm Fruits
EFB
Pressed CakePressed Liquor
PMF
Palm Nut
Kernel and Shell
Wet Kernels
PKS
Hot Water
POME
Kernel
CPO Wastewater
Steam
PKS
Fig. 1. Block flow diagram (BFD) of a typical POM process [3].
Each equipment in the POM has very specific functions and are designed to operate at their optimum capacities. When there is a need to increase CPO production, some of its
equipment may be limited by their fixed design capacities, creating a process bottleneck. A process bottleneck is a situation whereby the available capacity of a process unit is insufficient to meet the increased production rates. The challenge becomes increasingly complex when a POM experiences a drop in equipment efficiency. To solve the mentioned challenges, production capacity of a POM can be increased by retrofitting a plant (e.g. building new production facilities, debottlenecking an existing plant or by designing a plant that meets the production capacity requirement prior to building it) [4]. However, since POM plants are very well-established, it is usually more economical to retrofit an existing POM by debottlenecking it [5].
Retrofitting refers to a procedure to implement modifications to an existing process or system that may improve its energy efficiency, decrease its energy demand, increase its capacity and etc [6]. Several research works have been presented in the area of retrofitting, proving the importance of increasing the productivity of a process to fit increase in demand of a product [7, 8]. In literature, retrofitting and debottlenecking approaches have been proposed in areas including using computer-aided simulation tools, mathematical modelling and programming tools, and systematic frameworks [4, 8–12]. Previous works related to process retrofitting and debottlenecking were focused on the industries such as heat exchanger networks, pharmaceutical, biorefinery and bioenergy [4, 9, 11, 13]. However, there is limited work done on a retrofit and debottlenecking framework of a POM to cater for increased CPO production. At present, work has only been focused on palm oil-based biomass utilisation in a biorefinery and biomass tri-generation system from a palm oil mill (POM), but not the operations of the POM itself [4, 13].
Hence, this research presents a debottlenecking framework, which serves as a stepwise guideline and decision-making tool for engineers to identify bottlenecks and debottleneck the process when there is a desire to increase production capacity. To illustrate the application of the framework, an existing POM was solved in this work, by maximising its production capacity. The identification of bottlenecks was carried out by first developing the mathematical model of the process using an algebraic approach, known as Inoperability Input-output Modelling (IIM) adapted from the work of Kasivisvanathan et al. [4]. IIM assumes that each equipment is a ‘blackbox’, meaning that the operating conditions of the equipment are not considered. The model was then solved using a commercial optimisation tool, known as LINGO v17.0 [14]. The results of the model were analysed to determine the equipment which have become process bottlenecks. Upon identifying the bottlenecks in the process, the framework entails the procedures on retrofitting a POM process to cater for the increased production capacity. Following this, once the POM was free from bottlenecks, benefit-to-cost ratio (BCR) was performed on the debottlenecking methods to analyse the economic feasibility. Based on the economic performance, the decision to approve the debottlenecking solution is then made.
With this framework, process engineers are able to analyse, and make informed decisions on the debottlenecking a POM process in a systematic manner. The challenge of process bottlenecking can surface in any process. Hence, the purpose of this approach is not limited to a POM production process, it can also be applied to any process that may face potential bottlenecks.
3
MATEC Web of Conferences 152, 01012 (2018) https://doi.org/10.1051/matecconf/201815201012Eureca 2017

2 Research Methodology
2.1 Debottlenecking Framework
The debottlenecking framework methodology in Figure 2 essentially acts as a step-by-step guide and a decision-making tool for engineers to debottleneck a process. Section 2.2 to 2.3 explains the framework steps in detail.
Set the minimum ( ) and maximum ( )operating capacity fractions based on industrial partner input, to identify bottleneck of equipment.
* data from industrial partners.
minix
START
Develop a model based on the developed equations and solve the model using LINGO software.
Collect data from industrial partners. (e.g. mass flows, production capacity, target production capacity, equipment capacities)
New production capacity introduced.
Develop process matrix table based on data collected.
Develop mass balance equations based on matrix table and the adopted generic input-output modelling equation.
Ɐ j
I
iij xy
1jiA
maxix
Result Analysis
iiiii IxxIx maxmin
To Figure 3.1 (Cont.) From Figure 3.1 (Cont.)
Fig. 2. Debottlenecking framework methodology.
4
MATEC Web of Conferences 152, 01012 (2018) https://doi.org/10.1051/matecconf/201815201012Eureca 2017
2 Research Methodology
2.1 Debottlenecking Framework
The debottlenecking framework methodology in Figure 2 essentially acts as a step-by-step guide and a decision-making tool for engineers to debottleneck a process. Section 2.2 to 2.3 explains the framework steps in detail.
Set the minimum ( ) and maximum ( )operating capacity fractions based on industrial partner input, to identify bottleneck of equipment.
* data from industrial partners.
minix
START
Develop a model based on the developed equations and solve the model using LINGO software.
Collect data from industrial partners. (e.g. mass flows, production capacity, target production capacity, equipment capacities)
New production capacity introduced.
Develop process matrix table based on data collected.
Develop mass balance equations based on matrix table and the adopted generic input-output modelling equation.
Ɐ j
I
iij xy
1jiA
maxix
Result Analysis
iiiii IxxIx maxmin
To Figure 3.1 (Cont.) From Figure 3.1 (Cont.)
Fig. 2. Debottlenecking framework methodology.
Yes Yes
Capacity margin available to be
utilised ?
Have all equipment been
checked for bottlenecks?
Utilise existing available capacity of
the equipment
No Purchase additional unit of equipment to
cater new throughput.
Benefit to Cost Ratio (BCR) Analysis
No
No
Identification of each equipment
bottleneck:?max
ii xx
No (The equipment is not a
bottleneck.)
BCR > 1?
Yes
Propose recommendation(e.g. process intensification
to increase efficiency of equipment, etc.)
Is there possibility to implement this recommendation?
Yes
No
Reject increase in production capacity
Capital required exceeds budget?
No
Yes
Implementation of changes approved. END
Update data of matrix table (e.g. additional equipment,
new capacity and etc.)
Continue to next equipment.
Yes (The equipment is a possible
bottlenck.)
To Figure 3.1From Figure 3.1
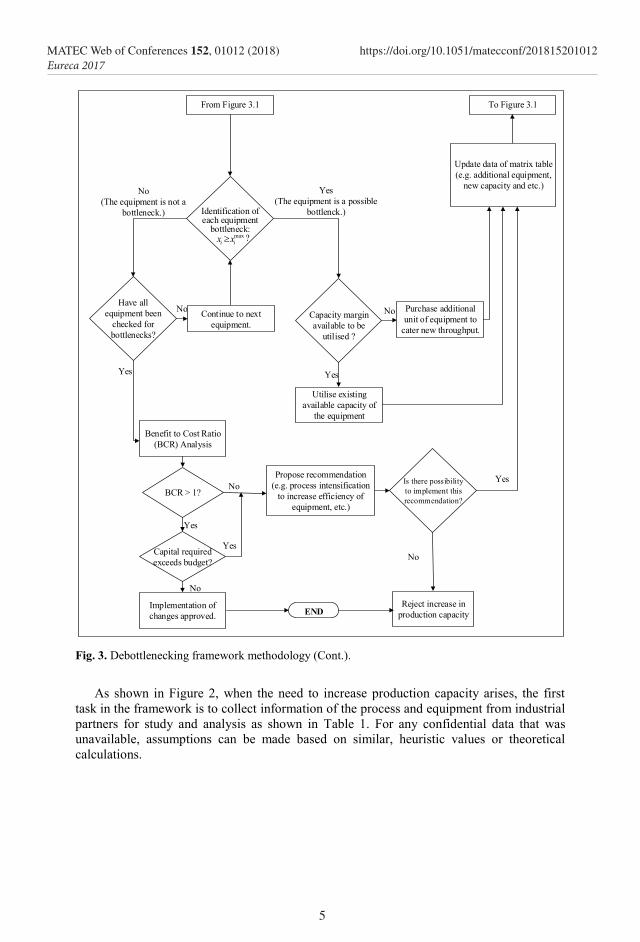
Fig. 3. Debottlenecking framework methodology (Cont.).
As shown in Figure 2, when the need to increase production capacity arises, the first
task in the framework is to collect information of the process and equipment from industrial partners for study and analysis as shown in Table 1. For any confidential data that was unavailable, assumptions can be made based on similar, heuristic values or theoretical calculations.
5
MATEC Web of Conferences 152, 01012 (2018) https://doi.org/10.1051/matecconf/201815201012Eureca 2017

Table 1. Data required for process and specification required for process unit.
Process Process Unit
Target capacity for increased production Design capacities
Number of equipment used of each process step Minimum and maximum operating capacity
Process flow, Mass flow Capital cost of equipment
Production capacity during normal operation Utility consumption
Moving down the framework to the next task, a process matrix table needs to be constructed. A general example of a matrix table is shown in Table 2. It shows the mass flows of components, j (j=1,2,3…J), through each process unit, i (i=1,2,3…I), for baseline state operation. In this work, the baseline state operation is referred to the normal existing operating capacity of the plant, before there is an increase in production capacity. Next, mathematical model needs to be formulated based on the matrix table shown in Table 2. The detailed explanation is presented in Section 2.1.
Table 1. General example of a process matrix table.
2.2 Formulation of Model
Based on the matrix table in Table 2, the process is then modelled using an algebraic approach known as input-output modelling. A general expression for input-output modelling adapted from the work of Kasivisvanathan et al.[4] is shown in Eq. (1),
I
iij xy
1jiA ∀ j (1)
where yj is the net flowrate of a given component, which can be an intermediate or a product. It is noted that yj is denoted by a negative sign for inputs, a positive sign for outputs and is equal to zero for all intermediates. i (i = 1, 2, …, I) represents a process unit
x1 x2 x3 … xi
y1 A1,1 A1,2 A1,3 … A1,j y2 A2,1 A2,2 A2,3 … A2,j y3 A3,1 A3,2 A3,3 … A3,j … … … … … … yj Ai,1 Ai,2 Ai,3 … Ai,j
Equipment, xi Component, yj
6
MATEC Web of Conferences 152, 01012 (2018) https://doi.org/10.1051/matecconf/201815201012Eureca 2017

Table 1. Data required for process and specification required for process unit.
Process Process Unit
Target capacity for increased production Design capacities
Number of equipment used of each process step Minimum and maximum operating capacity
Process flow, Mass flow Capital cost of equipment
Production capacity during normal operation Utility consumption
Moving down the framework to the next task, a process matrix table needs to be constructed. A general example of a matrix table is shown in Table 2. It shows the mass flows of components, j (j=1,2,3…J), through each process unit, i (i=1,2,3…I), for baseline state operation. In this work, the baseline state operation is referred to the normal existing operating capacity of the plant, before there is an increase in production capacity. Next, mathematical model needs to be formulated based on the matrix table shown in Table 2. The detailed explanation is presented in Section 2.1.
Table 1. General example of a process matrix table.
2.2 Formulation of Model
Based on the matrix table in Table 2, the process is then modelled using an algebraic approach known as input-output modelling. A general expression for input-output modelling adapted from the work of Kasivisvanathan et al.[4] is shown in Eq. (1),
I
iij xy
1jiA ∀ j (1)
where yj is the net flowrate of a given component, which can be an intermediate or a product. It is noted that yj is denoted by a negative sign for inputs, a positive sign for outputs and is equal to zero for all intermediates. i (i = 1, 2, …, I) represents a process unit
x1 x2 x3 … xi
y1 A1,1 A1,2 A1,3 … A1,j y2 A2,1 A2,2 A2,3 … A2,j y3 A3,1 A3,2 A3,3 … A3,j … … … … … … yj Ai,1 Ai,2 Ai,3 … Ai,j
Equipment, xi Component, yj
index, j (j= 1, 2, …, J) represents the type of component. Aji showed in the matrix table represents the input and output mass flows to and from a certain process unit i. Meanwhile, xi is an input-output variable of the equation, known as the operating capacity fraction for a process unit (where baseline state is denoted by 1).
Based on input-output modelling, the net output of the intermediate products in the process are fixed to zero as shown in Eq. (2) below.
0jy (2)
This is to ensure that all the intermediate products will be completely converted to produce the final product at the capacity that the plant is designed for [4]. Other than the formulation of the modelling equations, the constrains required to solve the model (i.e. minimum and maximum operating capacity fractions, minxi and maxx i ) are formulated as well, which has been further discussed in Section 2.3.
2.3 Set the Minimum and Maximum Operating Capacity Fractions
The next task in the framework presented in Figure 2 is to set the minimum and maximum
operating capacity fractions, minx i and maxx i , of each process unit. As seen in Eq. (1), the input-output variable, xi, is the operating capacity fraction of a particular process unit. Each process unit has a minimum and maximum limit of operating capacity fraction whereby it is safe to operate. This is required to limit the model, in order to properly identify bottlenecks.
minx i and maxx i of each process unit has to be determined using Eqs. (3) and (4) based on the information provided by industrial partners.
minx iMinimum Operating Capacity*
Baseline State Operating Capacity* (3)
maxx iMaximum Operating Capacity*
Baseline State Operating Capacity* (4)
* provided by industrial partners.
The formulation of the range of operating capacity fraction that is to be modelled in LINGO is as shown in Eq. (5).
iiiii IxI maxmin xx ∀ i (5)
where xi is the operating capacity fraction of process unit i (i = 1,2,3…, I) and Ii is a binary number (Ii = 0 or Ii = 1). For better understanding, during baseline state operation, the operating capacity fraction of an equipment, xi, is equal to 1. When a new production capacity is introduced, xi might move above or below 1. The model is able to compute the value of xi of the process unit. If it is running below the normal capacity, xi is less than 1,
7
MATEC Web of Conferences 152, 01012 (2018) https://doi.org/10.1051/matecconf/201815201012Eureca 2017

and is not a possible bottleneck; if it is running over the normal capacity, xi is larger than 1, then it may be at risk of being a bottleneck. If xi is equal or larger than maxx i , then the equipment is most definitely a bottleneck.
Moving down in the framework (Figure 2), the model could be solved using a commercial optimisation software known as LINGO and data below is extracted from the results:
1. The operating capacity fraction, xi, of all process units, 2. The production capacity of the plant (i.e. amount of product produced).
Following the solved model, Section 2.3 entails the analysis of the result obtained from the model to identify of bottlenecks in the process.
2.4 Identification of Bottlenecks
After the model is solved, the process is checked for any bottlenecks which may have occurred by analysing the results of the model. Beginning from the ‘Result Analysis’ box onwards in Figure 2, the analysis will be limited to only one process unit before moving to the next unit. The loop continues until all process units have been checked for bottlenecks. For example, if the equipment is a bottleneck, further analysis is carried out to determine if there is existing capacity margin available to be utilised; this will be discussed in Section 2.5. If the equipment is not a bottleneck, then the next equipment will be checked for bottlenecks. This is done until all equipment have been checked for bottlenecks, then the economic analysis is carried out to assess the feasibility of the debottlenecking method proposed as discussed in Section 2.6.
2.5 Debottlenecking
From Section 2.4, if the particular process unit is a possible bottleneck, the framework will lead to the next diamond box shown in Figure 2, to be checked for additional capacity available. Some process steps may have more than one process unit operating in parallel; meaning that if one unit is a bottleneck, there may be capacity available in another unit, allowing for the utilisation of available existing capacity in the other unit. This can be checked by first calculating the capacity required for the process step and the available capacity for the process step, using Eq. (6) and (7) which is obtained by rearranging Eq. (3) and (4).
Capacity Required for Process = xi × Baseline State Capacity (6)
Available Capacity = Capacity of Equipment × Number of Equipment (7)
Following this, based on Figure 2, if there is margin available for adjustments, the bottleneck can be removed by utilising the available capacity in the other equipment which is operating in parallel. If there is no margin available, the debottlenecking solution is to purchase additional unit of equipment. Once the debottlenecking method for a particular process unit is decided, the data in the matrix table needs to be updated and the formulations in the model are then updated accordingly. The entire process is then reanalysed for bottlenecks again. For example, if an additional unit of equipment is
8
MATEC Web of Conferences 152, 01012 (2018) https://doi.org/10.1051/matecconf/201815201012Eureca 2017

and is not a possible bottleneck; if it is running over the normal capacity, xi is larger than 1, then it may be at risk of being a bottleneck. If xi is equal or larger than maxx i , then the equipment is most definitely a bottleneck.
Moving down in the framework (Figure 2), the model could be solved using a commercial optimisation software known as LINGO and data below is extracted from the results:
1. The operating capacity fraction, xi, of all process units, 2. The production capacity of the plant (i.e. amount of product produced).
Following the solved model, Section 2.3 entails the analysis of the result obtained from the model to identify of bottlenecks in the process.
2.4 Identification of Bottlenecks
After the model is solved, the process is checked for any bottlenecks which may have occurred by analysing the results of the model. Beginning from the ‘Result Analysis’ box onwards in Figure 2, the analysis will be limited to only one process unit before moving to the next unit. The loop continues until all process units have been checked for bottlenecks. For example, if the equipment is a bottleneck, further analysis is carried out to determine if there is existing capacity margin available to be utilised; this will be discussed in Section 2.5. If the equipment is not a bottleneck, then the next equipment will be checked for bottlenecks. This is done until all equipment have been checked for bottlenecks, then the economic analysis is carried out to assess the feasibility of the debottlenecking method proposed as discussed in Section 2.6.
2.5 Debottlenecking
From Section 2.4, if the particular process unit is a possible bottleneck, the framework will lead to the next diamond box shown in Figure 2, to be checked for additional capacity available. Some process steps may have more than one process unit operating in parallel; meaning that if one unit is a bottleneck, there may be capacity available in another unit, allowing for the utilisation of available existing capacity in the other unit. This can be checked by first calculating the capacity required for the process step and the available capacity for the process step, using Eq. (6) and (7) which is obtained by rearranging Eq. (3) and (4).
Capacity Required for Process = xi × Baseline State Capacity (6)
Available Capacity = Capacity of Equipment × Number of Equipment (7)
Following this, based on Figure 2, if there is margin available for adjustments, the bottleneck can be removed by utilising the available capacity in the other equipment which is operating in parallel. If there is no margin available, the debottlenecking solution is to purchase additional unit of equipment. Once the debottlenecking method for a particular process unit is decided, the data in the matrix table needs to be updated and the formulations in the model are then updated accordingly. The entire process is then reanalysed for bottlenecks again. For example, if an additional unit of equipment is
purchased, the operating capacity fraction, xi, for that particular equipment is introduced into the matrix table, then the steps described from Section 2.2 onwards are carried out again. This is done until the entire network is free from any other equipment bottlenecks. Once there are no more bottlenecks and all equipment have been checked, the economic feasibility of the debottlenecking solution is assessed in Section 2.6.
2.6 Benefit-to-Cost Ratio (BCR) Analysis
Benefit-to-cost ratio (BCR) analysis of the proposed debottlenecking solutions is performed to assess the feasibility of the modifications. BCR is to determine the ratio of profits gained by implementing the recommendation to the initial capital investment of implementing the recommendation. BCR can be calculated using Eq. (8).
eq
j
Cy
BCR
jC (8)
where j is the valuable product of the process which brings in profits, Cj is the price of component j and yj is the increased flow rates of component j after debottlenecking is performed. Ceq is the annualised capital cost and annual operating costs of the equipment purchased to solve the process bottleneck, calculated using Eq. (9).
I
iieqC
1iAOC,
maxi CxC (9)
where i (i = 1,2,3 or…I) refers to the process units that have been added to the process, Ci is the annualised capital cost of the process unit at maximum operating capacity fraction,
maxx i and CAOC,i is the annual operating cost of the process unit.
Referring to the framework in Figure 2, the BCR is less than 1, this means that the cost outweighs the benefits. In this case, the process bottlenecks would have to be re-assessed and overcome using different methods (e.g. purchase smaller equipment or process intensification to increase yield of a process) if applicable. On the contrary, when BCR is more than 1, this shows that the benefits of the modification outweigh the costs. In line with BCR, a secondary evaluation is done on the allocated budget. If the investment on the debottlenecking solution falls below the budget, the decision is made to approve the solution. However, if both BCR and/or budget constraints are not satisfied (i.e. BCR < 1 and/or Capital Cost > Allocated Budget), new debottlenecking solutions will have to be proposed and the process will be reanalysed for bottlenecks. For example, a possible recommendation to reduce the initial capital investment is to reduce the maximum operating capacity of the equipment. The plant is then to be re-analysed to determine if these modifications would bring about other bottlenecks. The cycle continues until it reaches the end stage of the framework in Figure 2. In the case where all proposed recommendations have to be rejected due to not achieving the desired results for economic analysis, the entire project will have to be abandoned. This means that the plant is not suited for increase in production capacity or the budget provided is insufficient. To
9
MATEC Web of Conferences 152, 01012 (2018) https://doi.org/10.1051/matecconf/201815201012Eureca 2017

demonstrate the application of the developed framework (Figure 2), the bottleneck identification and debottlenecking of a palm oil mill (POM) case study is presented in Section 3.
3 Palm Oil Mill (POM) Case Study
Figure 3 illustrates a process block diagram (PBD) of an existing and operating palm oil mill (POM) case study that will be used to demonstrate the debottlenecking framework steps described in Section 2. The POM owner is interested in maximising the crude palm oil (CPO) production capacity of the existing POM with a budget allocation of US$ 500,000. This increase of CPO production may cause some of the equipment in Figure 3 to reach their maximum capacities and result in process bottlenecks. In this case, the proposed framework serves as a stepwise guideline and decision-making tool to analyse the plant for increased production and to debottleneck accordingly. Based on the framework (Figure 2), the data of the POM were first collected from industrial partners. Some information of the equipment specifications of the POM at baseline state are shown in Table 3. Table 4 is the process matrix table, which shows the capacities of the equipment in the POM at baseline state, also obtained from industrial partners. In Table 4, the negative values are the inputs into an equipment and the positive values are the outputs of an equipment.
Table 2. Current specifications of existing palm oil mill (POM) at baseline state. Fresh fruit bunches (FFB) Consumed (kg/hr) 30,000
CPO Production Capacity (kg/hr) 7611.42 Steam Consumption (kg/hr) 15435.85
Electricity Consumption (kWh) 419.8
Table 3. Equipment specifications in Palm Oil Mill (POM).
Equipment Unit Maximum Capacity
Minimum Capacity
Steam Consumption (kg/kg FFB)
Electricity (kWh/unit)
Steriliser kg FFB/unit 20000 8,000 0.25 30 Thresher kg SFB/unit 50,000 20,000 - 28
Steam Injection Digester
kg SFB/unit 12,500 5,000 0.13 18
Screw Press kg DF/unit 20,000 8,000 - 45 2 -Phase Decanter kg PL/unit 10,000 4,000 - 40
Depericarper kg PC/unit 5,000 2,000 - 57.3 Nut Cracker kg PF/unit 8,000 3,200 - 26.4
4-stage Winnowing
Column
kg cracked mixture/unit 15,000 3,000 - 20
Hydrocyclone kg cracked mixture/unit 5,000 2,000
Water: 1.5 kg/kg cracked
nut 30
Kernel Dryer kg WK/unit 5,000 kg wet kernet/unit 1,000 - 37.1
10
MATEC Web of Conferences 152, 01012 (2018) https://doi.org/10.1051/matecconf/201815201012Eureca 2017

demonstrate the application of the developed framework (Figure 2), the bottleneck identification and debottlenecking of a palm oil mill (POM) case study is presented in Section 3.
3 Palm Oil Mill (POM) Case Study
Figure 3 illustrates a process block diagram (PBD) of an existing and operating palm oil mill (POM) case study that will be used to demonstrate the debottlenecking framework steps described in Section 2. The POM owner is interested in maximising the crude palm oil (CPO) production capacity of the existing POM with a budget allocation of US$ 500,000. This increase of CPO production may cause some of the equipment in Figure 3 to reach their maximum capacities and result in process bottlenecks. In this case, the proposed framework serves as a stepwise guideline and decision-making tool to analyse the plant for increased production and to debottleneck accordingly. Based on the framework (Figure 2), the data of the POM were first collected from industrial partners. Some information of the equipment specifications of the POM at baseline state are shown in Table 3. Table 4 is the process matrix table, which shows the capacities of the equipment in the POM at baseline state, also obtained from industrial partners. In Table 4, the negative values are the inputs into an equipment and the positive values are the outputs of an equipment.
Table 2. Current specifications of existing palm oil mill (POM) at baseline state. Fresh fruit bunches (FFB) Consumed (kg/hr) 30,000
CPO Production Capacity (kg/hr) 7611.42 Steam Consumption (kg/hr) 15435.85
Electricity Consumption (kWh) 419.8
Table 3. Equipment specifications in Palm Oil Mill (POM).
Equipment Unit Maximum Capacity
Minimum Capacity
Steam Consumption (kg/kg FFB)
Electricity (kWh/unit)
Steriliser kg FFB/unit 20000 8,000 0.25 30 Thresher kg SFB/unit 50,000 20,000 - 28
Steam Injection Digester
kg SFB/unit 12,500 5,000 0.13 18
Screw Press kg DF/unit 20,000 8,000 - 45 2 -Phase Decanter kg PL/unit 10,000 4,000 - 40
Depericarper kg PC/unit 5,000 2,000 - 57.3 Nut Cracker kg PF/unit 8,000 3,200 - 26.4
4-stage Winnowing
Column
kg cracked mixture/unit 15,000 3,000 - 20
Hydrocyclone kg cracked mixture/unit 5,000 2,000
Water: 1.5 kg/kg cracked
nut 30
Kernel Dryer kg WK/unit 5,000 kg wet kernet/unit 1,000 - 37.1
POM
E
Stea
mFF
BTh
resh
er (x
3)Sc
rew
Pre
ss
(x6)
PL
Nut
Cra
cker
(x
11)
Win
now
ing
Sepa
rato
r (x
12)
Hyd
rocy
clon
e (x
13)
Ker
nel
Dry
er (x
14)
EFB
PMF
PKS
Hot
Wat
er
POM
E
Ker
nel
Stea
m
PKS
Ster
ilize
r 2
(x2)
Ster
ilize
r 1
(x1)
SFB
PFD
PF
Stea
m In
ject
ion
Dig
este
r 1
(x4)
Stea
m In
ject
ion
Dig
este
r 2
(x5)
Dep
eric
arpe
r 1
(x9)
Dep
eric
arpe
r 2
(x10
)
PN
2 Ph
ase
Dec
ante
r 1
(x7)
2 Ph
ase
Dec
ante
r 2
(x8)
CPO
POM
E
SFB
PFD
PF
POM
E
PMF
PN
CPO
POM
E
PC
CPO
:
Cru
de P
alm
Oil
DPF
:
Drie
d Pa
lm F
ruits
EFB
:
Em
pty
Frui
t Bun
chFF
B
: F
resh
Fru
it B
unch
PC
: P
ress
ed C
ake
PF
: P
alm
Fru
itsPK
S
: Pa
lm K
erne
l She
llPL
: Pre
ssed
Liq
uor
PMF
: P
alm
Mes
ocar
p Fi
bre
PN
: P
alm
Nut
sPO
ME
: Pal
m O
il M
ill E
fflu
ent
SFB
:
Ste
rilis
ed F
ruit
Bun
chW
K
: W
et K
erne
ls
Fig.
4. P
roce
ss b
lock
dia
gram
(PB
D) o
f the
pal
m o
il m
ill (P
OM
) Cas
e St
udy.
11
MATEC Web of Conferences 152, 01012 (2018) https://doi.org/10.1051/matecconf/201815201012Eureca 2017

Tab
le 4
. Pro
cess
mat
rix ta
ble
at b
asel
ine
stat
e.
Com
pone
nt, y
j (to
n/h)
x 1
x 2
x 3
x 4
x 5
x 6
x 7
x 8
x 9
x 1
0 x 1
1 x 1
2 x 1
3 x 1
4
FFB
-15.
0 -1
5.0
SFB
12.2
12
.2
-24.
3
PF
18.0
-9
.0
-9.0
EFB
6.
3
DPF
9.4
9.4
-18.
7
PL
10.3
-5
.1
-5.1
C
PO
3.8
3.8
PC
8.
4
-4
.2
-4.2
PM
F
2.
0 2.
0
PN
2.
4 2.
4 -4
.9
C
N
4.6
-4.6
U
N
0.2
-0.2
PK
S
1.6
1.6
PK
3.3
-3.3
WK
1.
5 -1
.5
DK
1.4
POM
E 4.
3 4.
3
1.
3 1.
3
4.
6
S -4
.1
-4.1
-1.3
-1
.3
-4
.6
Abb
revi
atio
ns
Le
gend
FF
B
Fres
h Fr
uit B
unch
C
N
Cra
cked
Nut
x 1
St
erili
ser 1
x 8
2
Phas
e D
ecan
ter 2
SF
B
Ster
ilise
d Fr
uit B
unch
U
N
Unc
rack
ed N
ut
x 2
Ster
ilise
r 2
x 9
Dep
eric
arpe
r 1
PF
Palm
Fru
it PK
S Pa
lm K
erne
l She
ll x 3
Th
resh
er
x 10
Dep
eric
arpe
r 2
EFB
Em
pty
Frui
t Bun
ch
PK
Palm
Ker
nel
x 4
Dig
este
r 1
x 11
Nut
Cra
cker
D
PF
Dig
este
d Pa
lm F
ruit
WK
W
et K
erne
l x 5
D
iges
ter 2
x 1
2 W
inno
win
g Se
para
tor
PL
Pres
sed
Liqu
or
DK
D
ry K
erne
l x 6
Sc
rew
Pre
ss
x 13
Hyd
rocy
clon
e C
PO
Cru
de P
alm
Oil
POM
E Pa
lm O
il M
ill E
fflue
nt
x 7
2 Ph
ase
Dec
ante
r 1
x 14
Ker
nel D
ryer
PC
Pr
esse
d C
ake
S St
eam
PM
F Pa
lm M
esoc
arp
Fibr
e E
Elec
trici
ty
PN
Palm
Nut
12
MATEC Web of Conferences 152, 01012 (2018) https://doi.org/10.1051/matecconf/201815201012Eureca 2017

Tab
le 4
. Pro
cess
mat
rix ta
ble
at b
asel
ine
stat
e.
Com
pone
nt, y
j (to
n/h)
x 1
x 2
x 3
x 4
x 5
x 6
x 7
x 8
x 9
x 1
0 x 1
1 x 1
2 x 1
3 x 1
4
FFB
-15.
0 -1
5.0
SFB
12.2
12
.2
-24.
3
PF
18.0
-9
.0
-9.0
EFB
6.
3
DPF
9.4
9.4
-18.
7
PL
10.3
-5
.1
-5.1
C
PO
3.8
3.8
PC
8.
4
-4
.2
-4.2
PM
F
2.
0 2.
0
PN
2.
4 2.
4 -4
.9
C
N
4.6
-4.6
U
N
0.2
-0.2
PK
S
1.6
1.6
PK
3.3
-3.3
WK
1.
5 -1
.5
DK
1.4
POM
E 4.
3 4.
3
1.
3 1.
3
4.
6
S -4
.1
-4.1
-1.3
-1
.3
-4
.6
Abb
revi
atio
ns
Le
gend
FF
B
Fres
h Fr
uit B
unch
C
N
Cra
cked
Nut
x 1
St
erili
ser 1
x 8
2
Phas
e D
ecan
ter 2
SF
B
Ster
ilise
d Fr
uit B
unch
U
N
Unc
rack
ed N
ut
x 2
Ster
ilise
r 2
x 9
Dep
eric
arpe
r 1
PF
Palm
Fru
it PK
S Pa
lm K
erne
l She
ll x 3
Th
resh
er
x 10
Dep
eric
arpe
r 2
EFB
Em
pty
Frui
t Bun
ch
PK
Palm
Ker
nel
x 4
Dig
este
r 1
x 11
Nut
Cra
cker
D
PF
Dig
este
d Pa
lm F
ruit
WK
W
et K
erne
l x 5
D
iges
ter 2
x 1
2 W
inno
win
g Se
para
tor
PL
Pres
sed
Liqu
or
DK
D
ry K
erne
l x 6
Sc
rew
Pre
ss
x 13
Hyd
rocy
clon
e C
PO
Cru
de P
alm
Oil
POM
E Pa
lm O
il M
ill E
fflue
nt
x 7
2 Ph
ase
Dec
ante
r 1
x 14
Ker
nel D
ryer
PC
Pr
esse
d C
ake
S St
eam
PM
F Pa
lm M
esoc
arp
Fibr
e E
Elec
trici
ty
PN
Palm
Nut
The next step in the framework is to formulate the input-output model of the POM based on Eq. (1), using the mass flow values in Table 4. Based on Eq. (2), the intermediates of the process are set to zero. Next, the minimum and maximum operating capacity fractions were calculated using based Eq. (3) and (4), and the information in Table 3. The constrains were formulated using Eq. (5). After the completion of these steps, the model is ready to be solved using LINGO v17.0. The results of the model are presented and discussed Section 3.1.
3.1 Results and Discussion
In this case study, the crude palm oil (CPO) production capacity was maximised and the palm oil mill (POM) was analysed for bottlenecks. The POM model is solved for the objective function to maximise the production capacity of CPO shown in Eq. (10).
max CPO (10)
Upon modelling and solving the POM case study, the results showed that the existing POM was able to achieve a maximum CPO production capacity of 8139.65 kg/hr and the results are tabulated in the fifth column of Table 6. Based on the framework, the operating capacity fractions of each equipment upon introducing the increased capacity (in the fifth column of Table 4) is to be compared with the existing maximum operating capacity fraction of the equipment (in the fourth column of Table 4).
Table 5. Identification of possible bottlenecks.
Equipment
Input-Output
Variable, xi
Minimum Operating Capacity,
minx i
Maximum Operating Capacity,
maxx i
Operating Capacity
Fraction to Maximise CPO,
xi
Possible bottleneck
?
Steriliser 1 x1 0.5333 1.3333 1.3330 YES Steriliser 2 x2 0.5333 1.3333 0.8058 NO
Thresher x3 0.8230 2.0576 1.0694 NO
Digester 1 x4 0.5561 1.3903 0.7485 NO
Digester 2 x5 0.5561 1.3903 1.3903 YES Screw Press x6 0.4278 1.0694 1.0694 YES Decanter 1 x7 0.7778 1.9444 0.7778 NO
Decanter 2 x8 0.7778 1.9444 1.3610 NO
Depericarper 1 x9 0.4753 1.1883 0.9505 NO
Depericarper 2 x10 0.4753 1.1883 1.1883 YES Nut Cracker x11 0.6556 1.6390 1.0269 NO Winnowing Separator x12 0.6146 3.0731 1.0269 NO
Hydrocyclonne x13 0.6146 1.5369 1.0269 NO
Kernel Dryer x14 0.6884 3.4422 1.0269 NO
13
MATEC Web of Conferences 152, 01012 (2018) https://doi.org/10.1051/matecconf/201815201012Eureca 2017

The comparisons suggested that the possible equipment bottlenecks were the Steriliser 1, Digester 2, Screw Press and Depericarper 2. These are the processes that may be at risk of becoming bottlenecks, should there be a further increase in capacity. This is probably because the Digester and any process relating to palm nut (PN) processing (i.e. Depericarper) had smaller operating capacities compared to other equipment (i.e. Capacity of the Digester is 12,500 kg palm fruit/hr for one unit and capacity of Depericarper is 5000 kg pressed cake/hr for one unit).
Moving down the next diamond box in the framework, the possible bottlenecks identified were then checked if there was available existing margin available to be utilised. This means that the particular process step may have more than one of the same equipment running in parallel, which has excess capacity that can be utilised (i.e. from Figure 3, the Steriliser, Digester, Depericarper and 2-phase Decanter). The calculations were made using Eq. (6) and (7). The results tabulated in Table 7 suggested that the all the possible bottlenecks had available existing capacity to be utilised, except for the Screw Press, which was approaching its maximum available capacity. The conclusion made from this step was that the Steriliser, Digester and Depericarper had available capacity margin to be utilised, because hese processes have two process units which operate in parallel. Hence, when one is at its maximum capacity, the other still had excess capacity to be utilised. However, the Screw Pressing process had only one equipment in the existing POM, leaving no capacity available to be utilised. Therefore, the bottleneck identified and validated for the case study was the Screw Press.
Table 6. Checking for available existing capacity.
Possible Bottlenecks Capacity Required (kg/hr)
Available Capacity (kg/hr)
Available Existing Capacity Margin to
be Utilised? Steriliser 1 32,081.99 40,000.00 YES Digester 2 19,229.95 25,000.00 YES
Screw Press 19,999.15 20,000.00 Approaching Max Depericarper 2 8,999.62 10,000.00 YES
Based on the framework (Figure 2), the subsequent step was to debottleneck the Screw Press. In this research, all equipment was assumed to be a ‘blackbox’, meaning that operating conditions and efficiencies are not taken into consideration and are assumed to be at optimum. However, in reality this may not be the case. Each equipment has its own range of operating conditions at which it has the best performance. For example, a Screw Press may have an optimum operating capacity fraction, x6, between 0.8 to 0.9, where it may be able to have a higher efficiency. However, since this research is conducted with the assumption of a ‘black box’, this optimum range is not taken into consideration. Hence, based on the framework (Figure 2), the debottlenecking method selected was by purchasing an additional Screw Press. to cater for the new capacity. Following the decision of the debottlenecking method, the next step is to update the process matrix table, equipment constraints and mathematical model accordingly based on the modifications made. The modifications made (i.e. purchase an additional Screw Press) will allow the POM to have a new maximum CPO capacity. However, since a comparison would like to be made between existing POM and debottlenecked POM, the constraint in Eq. (11) below, has to be defined in the model.
14
MATEC Web of Conferences 152, 01012 (2018) https://doi.org/10.1051/matecconf/201815201012Eureca 2017

The comparisons suggested that the possible equipment bottlenecks were the Steriliser 1, Digester 2, Screw Press and Depericarper 2. These are the processes that may be at risk of becoming bottlenecks, should there be a further increase in capacity. This is probably because the Digester and any process relating to palm nut (PN) processing (i.e. Depericarper) had smaller operating capacities compared to other equipment (i.e. Capacity of the Digester is 12,500 kg palm fruit/hr for one unit and capacity of Depericarper is 5000 kg pressed cake/hr for one unit).
Moving down the next diamond box in the framework, the possible bottlenecks identified were then checked if there was available existing margin available to be utilised. This means that the particular process step may have more than one of the same equipment running in parallel, which has excess capacity that can be utilised (i.e. from Figure 3, the Steriliser, Digester, Depericarper and 2-phase Decanter). The calculations were made using Eq. (6) and (7). The results tabulated in Table 7 suggested that the all the possible bottlenecks had available existing capacity to be utilised, except for the Screw Press, which was approaching its maximum available capacity. The conclusion made from this step was that the Steriliser, Digester and Depericarper had available capacity margin to be utilised, because hese processes have two process units which operate in parallel. Hence, when one is at its maximum capacity, the other still had excess capacity to be utilised. However, the Screw Pressing process had only one equipment in the existing POM, leaving no capacity available to be utilised. Therefore, the bottleneck identified and validated for the case study was the Screw Press.
Table 6. Checking for available existing capacity.
Possible Bottlenecks Capacity Required (kg/hr)
Available Capacity (kg/hr)
Available Existing Capacity Margin to
be Utilised? Steriliser 1 32,081.99 40,000.00 YES Digester 2 19,229.95 25,000.00 YES
Screw Press 19,999.15 20,000.00 Approaching Max Depericarper 2 8,999.62 10,000.00 YES
Based on the framework (Figure 2), the subsequent step was to debottleneck the Screw Press. In this research, all equipment was assumed to be a ‘blackbox’, meaning that operating conditions and efficiencies are not taken into consideration and are assumed to be at optimum. However, in reality this may not be the case. Each equipment has its own range of operating conditions at which it has the best performance. For example, a Screw Press may have an optimum operating capacity fraction, x6, between 0.8 to 0.9, where it may be able to have a higher efficiency. However, since this research is conducted with the assumption of a ‘black box’, this optimum range is not taken into consideration. Hence, based on the framework (Figure 2), the debottlenecking method selected was by purchasing an additional Screw Press. to cater for the new capacity. Following the decision of the debottlenecking method, the next step is to update the process matrix table, equipment constraints and mathematical model accordingly based on the modifications made. The modifications made (i.e. purchase an additional Screw Press) will allow the POM to have a new maximum CPO capacity. However, since a comparison would like to be made between existing POM and debottlenecked POM, the constraint in Eq. (11) below, has to be defined in the model.
65.8139CPO (11)
This was done because based on the previous LINGO results mentioned, the maximum CPO capacity of the existing plant was found to be 8139.64 kg/hr. Hence, by introducing Eq. (11) to the model, a comparison can be made to check if the bottlenecks that occurred from the said capacity have been removed. The results are tabulated in Tables 8 to 11. Table 8 shows that Screw Press 1 is at its maximum capacity and is a possible bottleneck. However, the Screw Press 2 that was just added is at zero capacity. Hence, there is existing margin available to be utilised for the Screw Press process, as shown in Table 9. With the additional Screw Press 2, the Screw Pressing process is now able to handle a larger throughput, allowing the plant to achieve the maximised CPO capacity without any bottlenecks.
Table 7. Identification of bottlenecks after debottlenecking.
Equipment
Input-Output
Variable, xi
Minimum Operating Capacity,
minix
Maximum Operating Capacity,
maxix
Operating Capacity Fraction to
Maximise CPO, xi
Possible bottleneck
?
Screw Press 1 x6 0.8556 2.1389 2.1388 YES Screw Press 2 x6a 0.8556 2.1389 0.0000 NO
Table 8. Check for capacity margin available for adjustment after debottlenecking.
Bottlenecks Capacity Required (kg/hr)
Available Capacity (kg/hr)
Available margin for adjustment?
Screw Press 19999.15 40000.00 YES
According to Table 10, upon debottlenecking the existing POM for maximised CPO production capacity, it is now able to produce 8139.65 kg CPO/hr, by consuming 32,082.00 kg FFB/hr, 16,507.08 kg steam/hr and 522.1 kWh of electricity. By comparing the CPO production capacity to the baseline state shown in Table 3 (i.e. 7611.42 kg CPO/hr), the CPO capacity of the debottlenecked plant is has increased by 7%. With the increase in production, the amount of raw material (i.e. fresh fruit bunch (FFB) and steam) consumed has also increased by 7%. A trend is observed in the interactions of the mass flows, whereby an increase in production of CPO leads to the same percentage of increase in consumptions of raw material and utilities required in the process. This is because the process units in the POM are interconnected by a linear programming model. This high interdependency among individual process units results in disruption of the entire system when there are any changes made (i.e. increase production capacity of CPO). The electricity consumption was found to be the same because the additional Screw Press added into the process was not being utilised, as shown in Table 8, where the operating capacity fraction was equal to zero.
Table 9. Production capacity and process requirements after debottlenecking. New CPO Production Capacity (kg/hr) 8139.65
New FFB Capacity (kg/hr) 32,082.00
Steam Consumption (kg/hr) 16507.08
15
MATEC Web of Conferences 152, 01012 (2018) https://doi.org/10.1051/matecconf/201815201012Eureca 2017

Based on the framework (Figure 2), after the entire process is free from bottlenecks, the next step is to perform benefit-to-cost ratio analysis (BCR). The BCR was calculated using Eq. (8) and Eq. (9). The economic parameters used, information on the capital cost and annual operating cost of the equipment, along with the calculated values for BCR can be found in Table 9. From Table 9, by purchasing an additional Screw Press, the BCR obtained for the case study was 54.57, which is a lot more than 1. This shows that the additional income gained from increased CPO production far outweighs the cost required to purchase an additional Screw Press. This also shows that one process bottleneck could lead to a big loss in potential revenue that could be earned. Other than that, the BCR could be very high because there was only one equipment bottleneck. After debottlenecking, the POM now has a production capacity 7% higher than the baseline. If for example, the POM owners would like to increase capacity by 50%, a lot more equipment would become bottlenecks and required to be debottlenecked. Different equipment have different costs, some have higher costs than others. These differences would reflect in the BCR results. Since in this case study, there is only one bottleneck involved, the BCR yields a value much larger than 1.
The following step in the framework was to verify if the cost to carry out the project exceeds the allocated budget of the project. In line with BCR, the initial capital investment of the Screw Press (i.e. US$ 100,000) is lesser than the budget allocated of US$500,000. Therefore, the debottlenecking solution can be justified economically and can be approved for construction.
Table 10. Benefit-to-cost ratio analysis for case study. Total Operating Hours (hrs/yr) 6000
Additional CPO from Increased Capacity, yCPO (kg/hr) (kg/yr)
528.23 3,169,380.00
Selling Price of CPO, CCPO (US$/kg) 0.6565 CCPO yCPO (US$/yr) 2,080,697.97
Annualising Factor (/yr) 0.1315
Capital Cost of Screw Press (US$) 100,000.00 Annualised Capital Cost of Screw Press, C6a (US$/yr) 13,150.00
Maximum Operating Capacity Fraction of Screw Press, max6ax 2.1389
C6amax6ax (US$/yr) 28,126.42
Annual Operating Cost of Screw Press (US$/yr) 10,000 Cost of Additional Equipment, Ceq (US$/yr) 38,126.42
BCR 54.57(ACCEPTABLE)
4 Conclusion This research work presents a framework on identifying bottlenecks and debottlenecking in a palm oil milling (POM) process in the case where production capacity of crude palm oil (CPO) is required to increase. To identify the bottlenecks, an algebraic approach known as input-output modelling is adapted to first formulate the modelling equations of the process. The model was then solved in an optimisation tool, known as LINGO, to identify the
Electricity Consumption (kWh) 419.8
16
MATEC Web of Conferences 152, 01012 (2018) https://doi.org/10.1051/matecconf/201815201012Eureca 2017

Based on the framework (Figure 2), after the entire process is free from bottlenecks, the next step is to perform benefit-to-cost ratio analysis (BCR). The BCR was calculated using Eq. (8) and Eq. (9). The economic parameters used, information on the capital cost and annual operating cost of the equipment, along with the calculated values for BCR can be found in Table 9. From Table 9, by purchasing an additional Screw Press, the BCR obtained for the case study was 54.57, which is a lot more than 1. This shows that the additional income gained from increased CPO production far outweighs the cost required to purchase an additional Screw Press. This also shows that one process bottleneck could lead to a big loss in potential revenue that could be earned. Other than that, the BCR could be very high because there was only one equipment bottleneck. After debottlenecking, the POM now has a production capacity 7% higher than the baseline. If for example, the POM owners would like to increase capacity by 50%, a lot more equipment would become bottlenecks and required to be debottlenecked. Different equipment have different costs, some have higher costs than others. These differences would reflect in the BCR results. Since in this case study, there is only one bottleneck involved, the BCR yields a value much larger than 1.
The following step in the framework was to verify if the cost to carry out the project exceeds the allocated budget of the project. In line with BCR, the initial capital investment of the Screw Press (i.e. US$ 100,000) is lesser than the budget allocated of US$500,000. Therefore, the debottlenecking solution can be justified economically and can be approved for construction.
Table 10. Benefit-to-cost ratio analysis for case study. Total Operating Hours (hrs/yr) 6000
Additional CPO from Increased Capacity, yCPO (kg/hr) (kg/yr)
528.23 3,169,380.00
Selling Price of CPO, CCPO (US$/kg) 0.6565 CCPO yCPO (US$/yr) 2,080,697.97
Annualising Factor (/yr) 0.1315
Capital Cost of Screw Press (US$) 100,000.00 Annualised Capital Cost of Screw Press, C6a (US$/yr) 13,150.00
Maximum Operating Capacity Fraction of Screw Press, max6ax 2.1389
C6amax6ax (US$/yr) 28,126.42
Annual Operating Cost of Screw Press (US$/yr) 10,000 Cost of Additional Equipment, Ceq (US$/yr) 38,126.42
BCR 54.57(ACCEPTABLE)
4 Conclusion This research work presents a framework on identifying bottlenecks and debottlenecking in a palm oil milling (POM) process in the case where production capacity of crude palm oil (CPO) is required to increase. To identify the bottlenecks, an algebraic approach known as input-output modelling is adapted to first formulate the modelling equations of the process. The model was then solved in an optimisation tool, known as LINGO, to identify the
Electricity Consumption (kWh) 419.8
bottlenecks. In addition to identifying the bottlenecks, the framework then proposes debottlenecking methods to free the process from bottlenecks. Benefit-to-cost ratio (BCR) analysis was performed on the debottlenecking methods to analyse its economic feasibility. To illustrate the developed framework, an existing POM was presented, given the objective to maximise CPO production capacity. It was found that the equipment at high risk of becoming possible bottlenecks when capacity increases were the Steriliser, Digester, Screw Press and Depericarper. The equipment which reached its maximum design capacity was identified as the Screw Press. The debottlenecking solution selected was to purchase an additional Screw Press to cater for the increase in capacity. After debottlenecking, the plant was able to produce an additional 528.23 kg CPO/hr, which was a 7% increase from the baseline state. The BCR was found to be 54.57. This validates that the benefits of purchasing the additional Screw Press far outweighs the cost.
References [1] Green Palm, “Why is Palm Oil Important?,” 2015. [Online]. Available:
http://greenpalm.org/about-palm-oil/why-is-palm-oil-important. [Accessed: 24-Oct-2017].
[2] J. Mark, “What’s Fueling the Demand for the Palm Oil Destroying the Rainforests of Indonesia?,” 2013. [Online]. Available: http://www.earthisland.org/journal/index.php/elist/eListRead/whats_fueling_the_demand_for_the_palm_oil_destroying_the_rainforests_of_ind/. [Accessed: 11-Jun-2017].
[3] E. Lau, Y. Man, and A. Baharum, “A Qualitative Approach of Identifying Major Cost Influencing Factors in Palm Oil Mills and the Relations towards Production Cost of Crude Palm Oil,” Am. J. Appl. Sci., 8, no. 5, pp. 441–446, (2011)
[4] H. Kasivisvanathan, R. R. Tan, D. K. S. Ng, M. K. Abdul Aziz, and D. C. Y. Foo, “Heuristic framework for the debottlenecking of a palm oil-based integrated biorefinery,” Chem. Eng. Res. Des., (2014)
[5] Malaysia Palm Oil Council, “The Oil Palm Tree.” [Online]. Available: http://www.mpoc.org.my/The_Oil_Palm_Tree.aspx. [Accessed: 17-Jun-2017].
[6] T. Pinto-Varela, A. Barbosa-Póvoa, and A. Carvalho, “Sustainable batch process retrofit design under uncertainty—An integrated methodology,” Comput. Chem. Eng., (2016)
[7] O. Alshekhli, D. C. Y. Foo, C. L. Hii, and C. L. Law, “Process simulation and debottlenecking for an industrial cocoa manufacturing process,” Food Bioprod. Process., 89, pp. 528–536, (2011)
[8] R. R. Tan et al., “An algebraic approach to identifying bottlenecks in linear process models of multifunctional energy systems,” Theor. Found. Chem. Eng., 46, no. 6, pp. 642–650, 2012.
[9] N. Tahouni, R. Khoshchehreh, and M. H. Panjeshahi, “Debottlenecking of condensate stabilization unit in a gas refinery,” Energy, 77, pp. 742–751, (2014)
[10] V. M. Enríquez-Gutiérrez, M. Jobson, L. M. Ochoa-Estopier, and R. Smith, “Retrofit of heat-integrated crude oil distillation columns,” Chem. Eng. Res. Des., 99, pp. 185–198, (2015)
[11] H. Sugiyama et al., “Multiobjective Retrofitting Methodology for Manufacturing Processes of Active Pharmaceutical Ingredients Considering Environment, Health and Safety Risks,” in Computer Aided Chemical Engineering, 38, pp. 79–84, (2016)
17
MATEC Web of Conferences 152, 01012 (2018) https://doi.org/10.1051/matecconf/201815201012Eureca 2017

[12] L. T. Biegler and P. Saderne, “A mixed integer flowsheet optimization strategy for process retrofits - the debottlenecking problem,”, 13, no. 8, pp. 947–957, (1989)
[13] V. Andiappan, D. S. Ng, and R. R. Tan, “Design operability and retrofit analysis (DORA) framework for energy systems,” Energy, (2017)
[14] Lindo Systems Inc., “LINGO,” (2017) [Online]. Available: http://www.lindo.com/index.php/products/lingo-and-optimization-modeling. [Accessed: 22-Nov-2017].
18
MATEC Web of Conferences 152, 01012 (2018) https://doi.org/10.1051/matecconf/201815201012Eureca 2017