Embed Size (px)
Citation preview

1
PROCEEDINGS
West Virginia Mine Drainage
Task Force Symposium
March 27 - 28, 2012 Morgantown, WV
CO-SPONSORED BY
WEST VIRGINIA MINE DRAINAGE TASK FORCE
AND
WEST VIRGINIA COAL ASSOCIATION

2
2012 PROGRAM
WEST VIRGINIA MINE DRAINAGE
TASK FORCE SYMPOSIUM
Ramada Inn, Morgantown, West Virginia
March 27-28, 2012
Tuesday, March 27, 2012
7:30 – 8:30 a.m. Registration
8:30 – 8:35 a.m. Welcome and Opening Remarks
Charlie Miller, Chairman of the Task Force, Industrial RES, Fairmont, WV
Moderators: Ben Faulkner, Bratton Farms, Princeton, WV
Jim Ashby, Metikki, LLC, Oakland, MD
8:35 – 9:00 a.m. “Status of West Virginia Mining and Reclamation”
Randy Huffman, Tom Clarke, and Lewis Halstead
West Virginia Department of Environmental Protection
Charleston, WV
9:00 – 9:30 a.m. “OSM Update on Mining, Reclamation and AMD”
Joe Pizarchik, Tom Shope, and Roger Calhoun
Office of Surface Mining
Washington, DC
9:30 – 10:00 a.m. “The Appalachian Research Initiative on Environmental Science

3
(ARIES): A New Paradigm”
John Craynon and Michael Karmis
Virginia Tech
Blacksburg, VA
10:00 - 10:30 a.m. BREAK
10:30 - 11:00 a.m. “Narrative Water Quality Standards”
Jason Bostic
West Virginia Coal Association
Charleston, WV
11:00 - 11:30 a.m. “TDS Evolution from Valley Fills at Coal Mac”
Terry Potter and John McDaniel
Arch - Coal Mac
Logan, WV
11:30 - 12:00 noon “Surface Mine Hydrology and Selenium Treatment”
Al Meek, Keith O’Dell, and Ben Faulkner
Arch – Birch River
Cowen, WV
12:00 - 1:30 p.m. LUNCH
1:30 - 1: 35 p.m. REGROUP
Afternoon Moderators: Mike Isabell, CONSOL, Bickmore, WV
Randy Maggard, Argus Energy, Dunlow, WV
1:35 - 2:00 p.m. “2011-12 Legislative Issues on Mining, Reclamation and Water”
Jason Bostic
West Virginia Coal Association
Charleston, WV
2:00 - 2:30 p.m. “Natural Selenium Attenuation at the Lab, Outlet, and Watershed Scale”
Paul Ziemkiewicz
West Virginia University
Morgantown, WV
2:30 - 3:00 p.m. “Passive Removal of Total Aluminum – Field Demonstration”
Ray Lovett
Shipshaper LLC
Morgantown, WV

4
3:00 - 3:30 p.m. BREAK
3:30 - 4:00 p.m. “Hydrologic Impacts of Multiple Seam Underground and Surface Mining”
Jay Hawkins
Office of Surface Mining
Pittsburgh, PA
4:00 - 4:30 p.m. “Simulating Interbasin Transfer in Abandoned Coal Mines”
Kurt McCoy and Mark Kozar
U.S. Geological Survey
Richmond, VA
4:30 - 5:00 p.m. “Site-Specific Chronic Selenium Aquatic Life Criterion for a
Coal-fired Power Plant Discharge to the Ohio River”
Rob Reash
American Electric Power
Columbus, OH
5:00 - 7:30 p.m. RECEPTION AND POSTER SESSION
Wednesday, March 28, 2012
8:00 – 8:30 a.m. Registration
8:25 - 8:30 a.m. Welcome and Remarks: Tiff Hilton, WOPEC, Lewisburg, WV
8:30 - 9:00 a.m. “Priority Pollutants in Untreated and Treated Drainage from Coal Mines in
Pennsylvania”
Chuck Cravotta
U.S. Geological Survey
New Cumberland, PA
9:00 – 9:30 a.m. “Special Reclamation Capital Costs for Passive Treatments”
Brady Gutta and Bruce Leavitt
West Virginia University
Morgantown, WV
9:30 - 10:00 a.m. “Air Lift Mixing to Improve Calcium Oxide Dissolution”
Bruce Leavitt, Tim Danehy, and Bryan Page
Consulting Hydrogeologist
Washington, PA
10:00 – 10:30 a.m. BREAK

5
10:30 - 11:00 a.m. “Pumpable pHoam™: A New Method for Mitigating ARD”
Jim Gusek
Golder Associates
Denver, CO
11:00 - 11:30 a.m. “Selenium Treatment by BioRemedial Technologies
Tyler Perry
BioRemedial Technologies
Hermitage, PA
11:30 - 12:00 a.m. “Treatment of Flowback – Marcellus Shale”
Mark Galimberti
VSep – New Logic Research
Pittsburgh, PA
12:00 Noon ADJOURN

6
WEST VIRGINIA MINE DRAINAGE
TASK FORCE SYMPOSIUM
Ramada Inn, Morgantown, West Virginia
March 27 - 28, 2012
TABLE OF CONTENTS
Program ............................................................................................................................................................. 2
Table of Contents .............................................................................................................................................. 6
PAPERS
TDS Evolution from Fills at Coal-Mac, Inc.
Terry Potter and John McDaniel................................................................................................... 7
Natural Selenium Attenuation at the Lab, Outlet, and Watershed Scales
Paul Ziemkiewicz and Ray Lovett ................................................................................................ 8
Hydrologic Impacts of Multiple Seam Underground and Surface Mining
Jay Hawkins and Jon Smoyer ..................................................................................................... 21
Simulating Interbasin Transfer in Abandoned Coal Mines
M.D. Kozar and Kurt McCoy..................................................................................................... 39
Priority Pollutants in Untreated and Treated Discharges from Coal Mines in Pennsylvania
Chuck Cravotta, M. Roland, K. Brady, G. Greenfield, W. Allen ................................................... 40
Assessment and Quanitification of Water Treatment Systems to Meet West Virginia Water
Quality Standards
M. O’Neal, Brady Gutta, B. Leavitt, B. Mack, and P. Ziemkiewicz ............................................... 41
Passive Mixing to Improve Calcium Oxide Dissolution
Bruce Leavitt, Tim Danehy, and Bryan Page ............................................................................... 42
Engineered Pumpable pHOAMTM
: An Innovative Method for Mitigating ARD
Jim Gusek, Brian Masloff, and John Fodor ................................................................................. 57
Treatment of Flow Back – Marcellus ShaleAir Jammer AMD Treatment System
Mark Galimberti ....................................................................................................................... 74
7
TDS Evolution from Fills at Coal-Mac, Inc. Terry Potter, Coal-Mac, Inc., Engineering Manager, Coal-Mac, Inc., Holden, WV
John McDaniel, Director of Engineering and Technical Services, Eastern Operations, Arch Coal Inc., Teays
Valley, WV
Abstract
Coal-Mac operates a surface operation producing approximately 3 MM clean tons annually near Logan, WV.
The mine utilizes two Komatsu 5500 series excavators and numerous Caterpillar front end loaders to move
approximately 40 MM bank cubic yards of overburden per year overlying the Five Block, Stockton, and
Coalburg coal horizons. Excess spoil from the mining operation not needed to achieve AOC is placed into
adjacent fills. The West Virginia Department of Environmental Protection issued a mining permit to Coal-
Mac on September 5, 2008, but serious delays in approval of the Section 404 permit prevented normal start-
up of the fill construction. To offset this loss of storage volume, excess yardage was hauled to a reclaimed
flat area originally permitted as pastureland, covering approximately 400 acres.
The Section 404 permit approval from the US Army Corps of Engineers (USCOE) was ultimately issued on
July 27, 2010. The approval was limited to construction of only one of the three proposed fills. The permit
also placed thresholds on the Conductivity values in the discharges immediately below the fills. To receive
approval to construct subsequent fills, conductivity values at or below 500 micro-siemens/cm must be
maintained in the discharge immediately below Fill #1 until Fill #1 has been constructed to completion as
defined in the approved USCOE Section 404 permit.
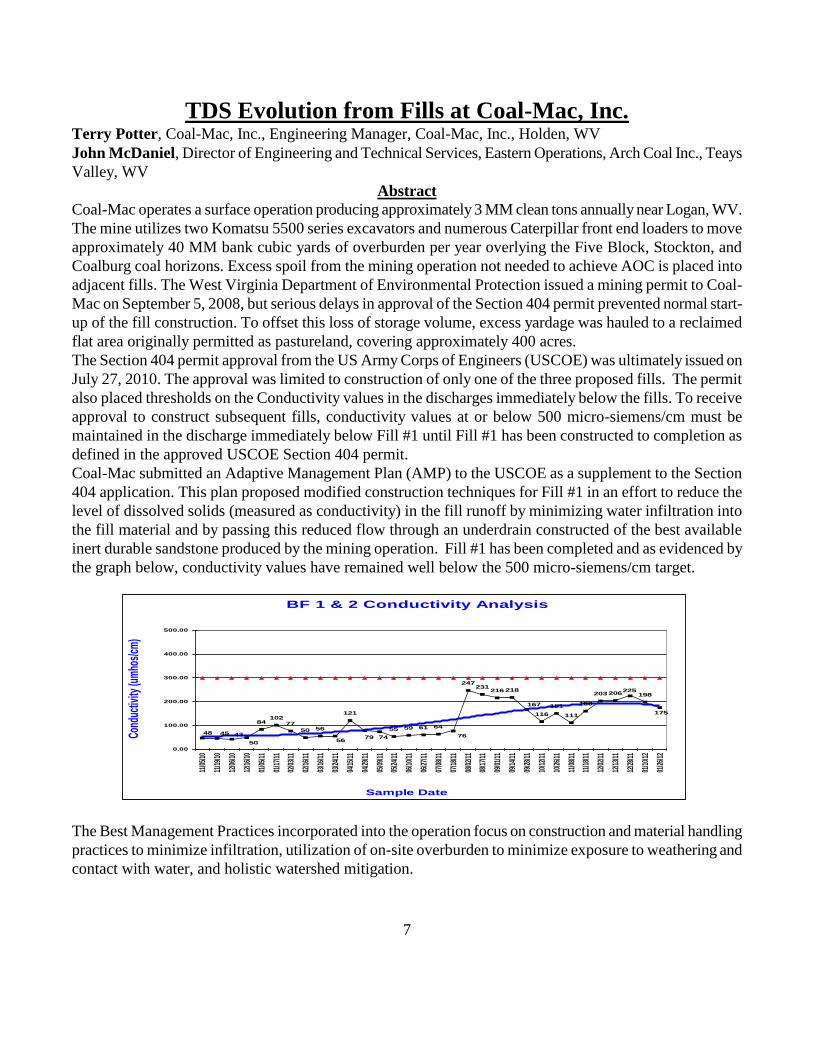
Coal-Mac submitted an Adaptive Management Plan (AMP) to the USCOE as a supplement to the Section
404 application. This plan proposed modified construction techniques for Fill #1 in an effort to reduce the
level of dissolved solids (measured as conductivity) in the fill runoff by minimizing water infiltration into
the fill material and by passing this reduced flow through an underdrain constructed of the best available
inert durable sandstone produced by the mining operation. Fill #1 has been completed and as evidenced by
the graph below, conductivity values have remained well below the 500 micro-siemens/cm target.
The Best Management Practices incorporated into the operation focus on construction and material handling
practices to minimize infiltration, utilization of on-site overburden to minimize exposure to weathering and
contact with water, and holistic watershed mitigation.
BF 1 & 2 Conductivity Analysis
84102
77
50 56
121
55 59 61 64
247231
216218
116
151
111
160
203206 198
175
225
167
7674795650
434548
0.00
100.00
200.00
300.00
400.00
500.00
11/0
5/10
11/1
9/10
12/0
6/10
12/1
6/10
01/0
5/11
01/1
7/11
02/0
3/11
02/1
6/11
03/1
6/11
03/2
4/11
04/1
5/11
04/2
9/11
05/0
9/11
05/2
4/11
06/1
0/11
06/2
7/11
07/0
8/11
07/1
8/11
08/0
2/11
08/1
7/11
09/0
1/11
09/1
4/11
09/2
8/11
10/1
2/11
10/2
6/11
11/0
8/11
11/1
8/11
12/0
2/11
12/1
3/11
12/2
8/11
01/1
0/12
01/2
6/12
Sample Date
Cond
uctiv
ity (u
mho
s/cm
)

8
Natural Selenium Attenuation at the Lab, Outlet, and Watershed Scales
Ziemkiewicz, P.F. and Lovett, R.J. West Virginia Water Research Institute, West Virginia University
Morgantown, West Virginia, USA [email protected]
Abstract
In Appalachian coal overburden, nearly all selenium occurs in a reduced state in largely unweathered, sedimentary
rock. The rate and period of selenium leaching is poorly understood. Selenium discharge is regulated in the
United States and this knowledge is critical in estimating financial and environmental liabilities. This study
estimated the dynamics of selenium leaching by analyzing its release at three scales: laboratory humidity cells,
discharges from mined spoil aged 6 to 25 years and streams affected by mining over the same interval. The two
field studies took place on a 6,000 ha coal mining complex in southern West Virginia. Both indicated that
selenium was released rapidly from mine spoil and that its rate of attenuation was rapid (about 0.05%/day after 145
weeks). Selenium was depleted from mine spoil to the extent that concentrations were generally less than the
regulated limit of 5 μg/L within 25 years. Laboratory humidity cell results indicated a similar profile for selenium
concentration over a much shorter interval. Adjustment of the laboratory results to estimate field values was
accomplished by multiplying concentration by 6.4 and by multiplying time in years by 7.0. With this adjustment,
humidity cell results were similar to those from the field at a given time.
By segregating a large number of field observations according to age class, this study identified a procedure for
conducting long-term weathering studies with data collected over relatively short (six-year) sampling intervals.
Statistical analysis indicated that experimental error was minor and that temporal trends in selenium concentration
were readily identified.
Keywords: selenium, coal mining, attenuation
Introduction
Predicting the amount of pollutant that will be released from a unit of mine spoil requires an understanding of the
total amount present in the rock, the proportion that is potentially mobile, the rate of mobilization, sequestration
within the spoil mass and finally the leaching or release rate. Vesper et al. (2008) reported selenium concentrations
in southern West Virginia coal overburden rock ranging from about 0.84 in sandstone to 4.10 mg/kg in organic
shale with higher selenium concentrations coinciding with the highest sulfide levels. Selenium-rich rock units are
highly segregated and 90% of an overburden profile’s selenium is typically found in less than 15% of the rock
mass (Mullennex, 2005). The proportion of selenium that is subject to mobilization was estimated by Roy (2005)
and Pumure et al. (2010) who used extreme methods to accelerate selenium release from rock. Roy (2005) used
modified sequential extraction to estimate that roughly one half of total selenium was non-extractable while another
quarter of the total selenium was bound in organic form. Neither of these selenium forms was shown to contribute
significantly to the mobile fraction. Sequential extraction was developed for soils and the extent to which it is able
to mobilize the organically bound fraction in coal related rock is not well understood. It is possible that much of
the non-extractable fraction in this study was, in fact, organically bound. Most of the remaining selenium that
could be potentially mobile in the environment occurred in association with sulfides and, to a lesser extent, as
exchangeable ions. Thus, only about 25 to 35% of the total selenium found in total overburden analysis was found
to be mobile.
9
Similar results were obtained using a sonication extraction method intended to estimate bioavailable or mobile
selenium (Pumure et al. 2010) in shale. Samples were sonicated in deionized water for ninety minutes in five-
minute increments with total replacement of the water for each five-minute extraction. The authors reported that
35 and 38% of total selenium in two similar organic shales from southern West Virginia was mobile. In theory,
sonication enhanced the oxidation of reduced selenium forms via cavitation and released soluble selenium.
Diehl et al. (2005) determined selenium in pyrite in southern Appalachian coals by a variety of micro-analytical
techniques. Up to 670 mg/kg of selenium was found in pyrite samples. The minimum sulfur to selenium ratios in
their pyrite samples were near 103. Whole coal values for selenium ranged from 25 to 247 mg/kg. At one to two
percent sulfur content (estimated, sulfur content was not reported), the pyrite contained roughly 2 to 20% of the
selenium in the coal. The selenium percentage found in pyrite correlates well with the fraction found in the sulfidic
extract by Roy (2005), who found 8 percent of the total selenium in the pyrite fraction of coal and 13 percent in
shale. Diehl et al. (2005) concluded that trace element enrichment was post depositional to pyrite formation.
Selenium in waste rock can exist in soluble forms, such as selenite or selenate, which will be released immediately
upon exposure to water, or in solid forms that become mobile upon exposure to oxygen and water. Very little is
known about the actual selenium forms in rock. The concentration of selenium is too low to determine for all but
the most sophisticated analytical equipment, but the most commonly presumed species is the selenium analog of
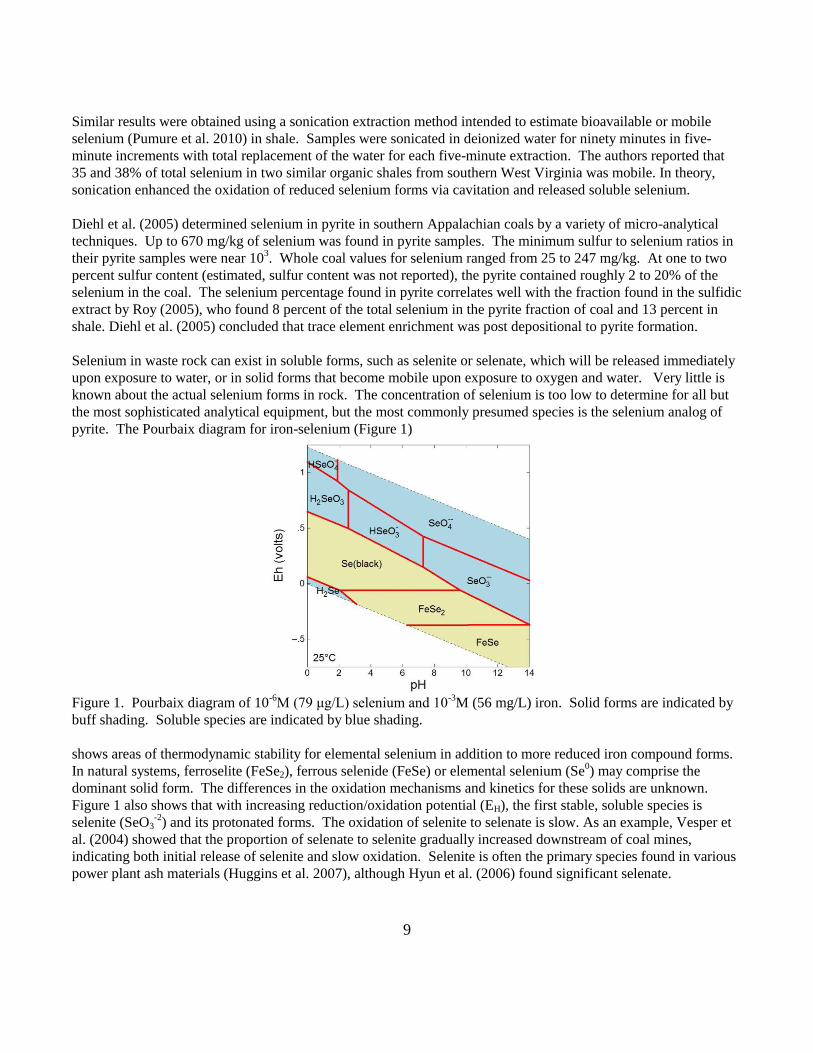
pyrite. The Pourbaix diagram for iron-selenium (Figure 1)
Figure 1. Pourbaix diagram of 10
-6M (79 μg/L) selenium and 10
-3M (56 mg/L) iron. Solid forms are indicated by
buff shading. Soluble species are indicated by blue shading.
shows areas of thermodynamic stability for elemental selenium in addition to more reduced iron compound forms.
In natural systems, ferroselite (FeSe2), ferrous selenide (FeSe) or elemental selenium (Se0) may comprise the
dominant solid form. The differences in the oxidation mechanisms and kinetics for these solids are unknown.
Figure 1 also shows that with increasing reduction/oxidation potential (EH), the first stable, soluble species is
selenite (SeO3-2
) and its protonated forms. The oxidation of selenite to selenate is slow. As an example, Vesper et
al. (2004) showed that the proportion of selenate to selenite gradually increased downstream of coal mines,
indicating both initial release of selenite and slow oxidation. Selenite is often the primary species found in various
power plant ash materials (Huggins et al. 2007), although Hyun et al. (2006) found significant selenate.

10
Iron oxyhydroxide or ferrihydrite, a byproduct of pyrite oxidation is known to preferentially sorb selenite over the
more oxidized selenate oxyanion. Iron oxyhydroxide removed 95% of selenite at pH 4, 80% at pH 9 (Merrill et al.
1985). Su and Suarez (2001) studied amorphous iron oxide and goethite, α-FeOOH, and reached similar
conclusions for each material, although the data for amorphous iron oxide were less definitive. Zhang and Sparks
(1990) had previously studied selenate and selenite sorption on goethite and, unlike Su and Suarez (2001),
concluded that whereas selenite formed an inner sphere complex, selenate formed a less stable outer sphere
complex. Ziemkiewicz et al. (2011) added ferrihydrite to weathering, selenium-containing mine spoil and found
that roughly 70% of selenium was immobilized relative to untreated controls. Presumably, most of the adsorbed
selenium was in the selenite form.
While laboratory leaching results provide insight into weathering and leaching mechanisms under ideal conditions,
the important issue to the mining and regulatory sectors is the concentration of selenium that will discharge from
operating mines over time. Selenium discharge dynamics under field conditions are poorly understood, largely due
to: the long-term nature of field weathering processes and the relatively short-time interval since selenium has
been monitored. In fact, selenium was not considered a pollutant in Appalachian coal mining until about 2003.
Thereafter, some large, surface coal mines were obliged to sample and report selenium discharged via their
regulated outlets.
Overburden is unmined rock that is moved to access the coal seam. After mining, it is known as spoil. Large scale
surface coal mining in the highly dissected Appalachian plateau involves horizontal, multiple seams and a mixture
of sedimentary rock types. Roughly half of the overburden is moved by blast casting with the remainder moved by
dragline or shovel to truck haulage. The latter generally dump on an advancing face with the rock distributed down
slopes that can be10 to 50 m long. All of these overburden handling methods result in a high degree of overburden
blending. Weathering begins immediately after mining. Spoil age refers to the length of time since a rock unit was
mined. While each rock type will behave differently with regard to selenium production, the mining process
dictates that we recognize spoil units that are of mixed composition and ages within the constraints of an individual
mine permit.
Proposed selenium weathering model
Based on the above studies, a working model for selenium weathering, sequestration and release was developed
(figure 2).
11
Overburden Mine Spoil Discharge
25-40% inorganic Se
Mobile forms:
SeO32-
oxidizes to SeO4
2-
(slow)
Mobile seleniumSeO3
2-,SeO42-
60-75% organically bound and
other immobile Se
forms
Immobile selenium
Se2-, Se0? oxidationLeaching
Not subject to oxidation/
mobilization
Internal seques-tration
e.g. SeO32-
+ FeOOH
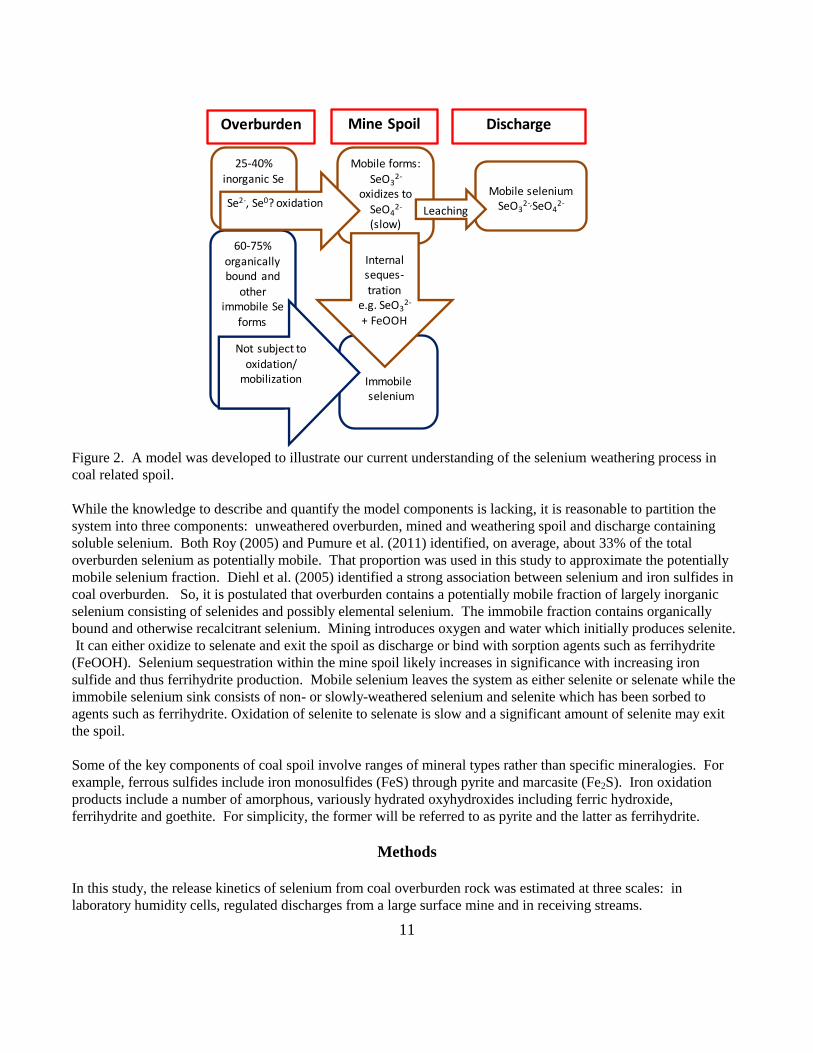
Figure 2. A model was developed to illustrate our current understanding of the selenium weathering process in
coal related spoil.
While the knowledge to describe and quantify the model components is lacking, it is reasonable to partition the
system into three components: unweathered overburden, mined and weathering spoil and discharge containing
soluble selenium. Both Roy (2005) and Pumure et al. (2011) identified, on average, about 33% of the total
overburden selenium as potentially mobile. That proportion was used in this study to approximate the potentially
mobile selenium fraction. Diehl et al. (2005) identified a strong association between selenium and iron sulfides in
coal overburden. So, it is postulated that overburden contains a potentially mobile fraction of largely inorganic
selenium consisting of selenides and possibly elemental selenium. The immobile fraction contains organically
bound and otherwise recalcitrant selenium. Mining introduces oxygen and water which initially produces selenite.
It can either oxidize to selenate and exit the spoil as discharge or bind with sorption agents such as ferrihydrite
(FeOOH). Selenium sequestration within the mine spoil likely increases in significance with increasing iron
sulfide and thus ferrihydrite production. Mobile selenium leaves the system as either selenite or selenate while the
immobile selenium sink consists of non- or slowly-weathered selenium and selenite which has been sorbed to
agents such as ferrihydrite. Oxidation of selenite to selenate is slow and a significant amount of selenite may exit
the spoil.
Some of the key components of coal spoil involve ranges of mineral types rather than specific mineralogies. For
example, ferrous sulfides include iron monosulfides (FeS) through pyrite and marcasite (Fe2S). Iron oxidation
products include a number of amorphous, variously hydrated oxyhydroxides including ferric hydroxide,
ferrihydrite and goethite. For simplicity, the former will be referred to as pyrite and the latter as ferrihydrite.
Methods
In this study, the release kinetics of selenium from coal overburden rock was estimated at three scales: in
laboratory humidity cells, regulated discharges from a large surface mine and in receiving streams.

12
Laboratory scale study
Samples of a selenium-rich (1.55 mg Se/kg) organic shale were subjected to weathering and leaching in humidity
cells for 145 weeks. Results up to week 96 (Ziemkiewicz, et al. 2011) estimated the rate of selenium mobilization
and leaching under laboratory conditions. Field selenium concentrations were estimated by multiplying the
observed selenium concentrations from the humidity cells by a factor of 6.4. This factor was developed by
comparing selenium and chloride concentrations in the humidity cells with the same parameters at a large waste
rock dump comprising similar rock. The 6.4 factor appeared to account for the dilution resulting from the high
liquid to solid ratio in the humidity cells (2:1) and yielded concentrations of both selenium and chloride that were
similar to those observed in the field (Ziemkiewicz et al. 2011).
Mine outlet study
In order to estimate the temporal trends in selenium concentration, mine outlets from a large (6,000 ha) surface
mining complex in southern West Virginia were studied. Selenium concentration had been monitored over a
period of up to seven years (2004 through 2010) for regulatory reporting. The mine extracts coal from the
Stockton/Coalburg zone within the Pennsylvanian age Kanawha Formation. Overburden consists of a horizontally
bedded mixture of sandstone, organic and non-organic shale. A single core from the property indicated an average
concentration of 0.262 mg Se/kg with selenium concentrated in organic shale units. Spoil upstream of each outlet
would contain a mixture of those rock units with unknown degrees of homogenization.
Figure 3. Typical arrangement of a mountaintop mine showing outlet locations below valley fills and on mine
benches. The coal is horizontally bedded in this region and the mine bench represents the lowest extent of mining.
Spoil is placed on the mine bench and in valley fills.
This water quality dataset included sixty seven outlets with approximately monthly samples. The outlets
represented five National Pollution Discharge Elimination System (NPDES) permits and nineteen surface mining
permits of approximately 100 to 200 ha each. The time interval between issuance of each mining permit and the
Valley
fills
Outlets Mine bench
500 m

13
discharge sampling date was used to estimate spoil age. Each sample was then assigned a value representing age to
the nearest year. While sampling occurred over a seven-year period, the mine permit areas feeding these outlets
were as old as 25 years. Within a mine permit area, the progression from mining to surface regrading and
revegetation was typically linear over a period of three to five years. Based on limited, historical, aerial imagery,
this appeared to be generally true. However, the imagery indicated that one discharge represented a site that was
partly re-excavated subsequent to regrading. Its initial mining date was adjusted accordingly.
Outlets were sampled by the company and reported to the state regulatory agency. All chemical determinations
were conducted by state-certified analytical laboratories. Outlets were added to the sampling program at various
times as mining expanded and were typically sampled at monthly intervals. The number of samples within a given
spoil age class ranged from 25 to 578 and averaged 216. The highest selenium discharges tended to be sampled
most often. Minor discharges, determined by either intermittent flow or low selenium concentrations, were
sampled less frequently. Only samples from flowing discharges were included in this study.
A total of 5,388 water quality samples were included in this study. Given the wide range of sample sizes among
age classes, precision was determined by applying Student’s t statistic according to Ostle (1963) to identify upper
and lower confidence limits for mean selenium concentrations within each age class. The precision of the
estimated mean values thus indicate the importance of uncontrolled variables such as vertical and horizontal spoil
heterogeneity within age classes.
Watershed study
Four tributaries that receive discharge from the mine complex had been sampled by a research team from West
Virginia University over the period June 2009 to November 2010. Mining had moved across these watersheds
from 1985 to the present. Between fourteen and seventeen monthly samples were taken in each tributary. The date
of initial mining was determined by the average of the upstream surface mine permits and subtracted from 2009 to
estimate the age of mining in each tributary’s watershed. The mean values and confidence intervals were
determined. In addition, two historical sources of selenium data were obtained for two of the tributaries. They
included the Mountaintop Mining EIS (USEPA, 2004) and the Guyandotte River TMDL (USEPA, 2002). These
agency data were reported as means of multiple samples but the individual sample results were not available and,
thus, confidence intervals could not be determined.
Results and Discussion
Laboratory scale study
The selenium leaching rate was characterized as the percent mobile selenium that was removed from the humidity
cells per day. The mobile fraction was estimated to be 33% of total selenium as reported by Roy (2005) and
Pumure et al. (2010). The leaching rate initially declined rapidly, then after about 50 weeks entered a prolonged,
gradual decline from 0.07%/day to 0.05%/day by week 145. A power function (equation 1) was found to
approximate the observations with an R2 value of 0.96.
y=0.0045x-0.452
Equation 1.
Where: Y=the selenium leaching rate in % of remaining selenium per day
X=weathering interval in weeks

14
The observed values and the predicted values are shown in Figure 4. The prediction curve is extrapolated to 550
weeks at which time the leaching rate is predicted to be 0.026%/day.
Figure 4. The observed and predicted selenium leaching rates in carbonaceous shale placed in humidity cells and
observed for 145 weeks. Experimental values are the mean of six replications. A prediction curve (equation 1)
was developed and extrapolated to 550 weeks.
The selenium concentration of humidity cell leachate increased rapidly to a maximum of 4 μg/L by week 56 then
decreased nearly as rapidly to 0.5 μg/L by week 145 (Figure 5). If, in fact, only 33% of the total selenium is
potentially mobile, then 50% of that fraction was removed by week 145. The decline in selenium concentration
suggests possibly two mechanisms: depletion of the mobile selenium fraction and/or immobilization of selenite
with ferrihydrite produced by pyrite oxidation per figure 2. Extrapolation of the leaching prediction curve suggests
that nearly all of the potentially mobile selenium will be removed from the humidity cells by week 550 (10.5
years).
Figure 5. Observed and predicted, cumulative selenium removal amounts from the laboratory study are shown on
the left Y axis while estimated field selenium concentrations are indicated on the right Y axis.
The laboratory humidity cells used a liquid to solid ratio of 2:1. Temperatures within the cells reflected ambient
laboratory conditions of about 22o C. The humidity cells represent a more aggressive weathering environment and
a higher leaching efficiency than a multi-million ton spoil mass. In addition, laboratory temperatures were higher
than the ground water temperatures of 10-12o C that are typically found in spoil discharges in West Virginia.

15
The average concentration ratio of sulfur to selenium released from the humidity cells was 1,764 (Figure 6). Much
higher values were noted in leach cycles 1, 2 and 3 (cycle 0 was the initial rinse of the test samples). Other than
those initial weathering cycles, the sulfur to selenium ratio remained nearly constant over the subsequent leaching
cycles. While not definitive, this suggests a mineralogical, possibly pyritic, co-incidence of the two elements.
Over the 145 weeks of leaching, the average leachate pH was 6.82 and the minimum pH value was 6.13. At this
pH range and under oxidizing conditions, ferrihydrite will precipitate. Every mole of sulfur released in pyrite
oxidation will release a mole of iron and thus ferrihydrite. So, it is reasonable to expect that approximately 1,764
moles of ferrihydrite would be available for every mole of liberated selenium.
Figure 6. The ratio of sulfur to selenium averaged 1,764 over 145 weeks of leaching. Circled values are the first
three leach cycles.
Mine outlet study
Selenium concentrations increased over the first seven years then declined to less than 5 μg/L by year 25 (Figure
7). Initially about 60% of the samples exceeded 5 μg Se/L. By year five a maximum of 87% exceeded 5 μg/L.
However, by year 25 only 3% of samples exceeded 5 μg Se/L. The average selenium concentration within age
class peaked at year six then declined to less than 2 μg/L by year 24 where the 95% confidence level was also less
than 5 μg/L (Figure 8). Both the average selenium concentration and the proportion of samples that were out of
compliance with the regulatory limit of 5 μg Se/L reached their maximum values about 6-7 years after issuance of
the mining permit. A period of about 20 years followed during which both selenium concentration and the rate of
non-compliance decreased.
Figure 7. The relationship between the percentage of samples in excess of 5 μg Se/L and age class. The equation
for a quadratic model is given, with an R2 of 0.76.

16
Figure 8. Mean selenium concentrations ( x), with upper and lower confidence levels (p=0.95) for mine discharges
sorted according to time after initial mining.
The narrow confidence intervals in Figure 8 indicate a strong relationship between time and selenium
concentration. This indicates that uncontrolled factors such as geologic and hydraulic heterogeneity were of minor
significance.
Watershed study
Four tributaries to the Mud River drain the southwestern end of the mine. Mining proceeded downstream along
the River from south to north. Thus it was possible to identify the interval between initial mining in the tributaries
and the date of sampling. In 2009, mining on the tributaries Ballard Fork, Stanley Fork, Sugartree Branch and
Berry Branch was, on average, 24, 21, 19 and 8 years old, respectively. These sites were sampled monthly with
about fourteen samples each. An unmined tributary of the Mud River (Upton Branch) was also sampled. In
addition, stream samples from older studies were available for Stanley Fork and Sugartree Branch (USEPA, 2002)
and (USEPA, 2004). Estimates of sample precision were developed using student’s t test at p=0.95. Data reported
from 2000 (USEPA, 2002) and 2003 (USEPA, 2004) sampling included averages and ranges only so precision
could not be estimated. Figure 9 illustrates the temporal trend toward selenium concentrations less than 5 μg/L by
year 24.
Figure 9. Each of the stream samples was arrayed along a time axis that approximates spoil age in the watershed.
Where possible, confidence intervals were included. Be=Berry Branch, Su=Sugartree Branch, St=Stanley Fork,

17
Ba=Ballard Fork, Up=Upton Branch. Superscript ‘a’ indicates 2000 sampling while superscript ‘b’ indicates 2003
USEPA sampling.
Integration of laboratory, outlet and watershed studies
The results of the outlet and watershed studies represent the weathering and leaching of selenium bearing rock
under field conditions. Results are dimensioned as selenium concentration at a given year after initial mining. The
laboratory data represent weathering and leaching under artificial conditions. Comparison of laboratory and field
weathering studies required adjustment of laboratory concentrations and time scales to account for different solid to
liquid ratios in the leaching process, higher leaching efficiency in the laboratory versus the field, and the different
kinetics associated with higher laboratory temperatures. Large spoil masses are colder; they include preferential
flow paths and seasonally variable moisture conditions. Nonetheless, comparison of the trends in the laboratory
and field studies (outlet and to a lesser extent the watershed study) provides an opportunity to calibrate findings
from the laboratory study.
The comparison required adjustment of two key parameters: selenium concentration and removal rate. The former
was adjusted by multiplying the laboratory leachate concentrations by 6.4. The rate parameter was then calibrated
by observing that the shapes of the selenium release curves in both field and laboratory studies were similar except
that in the laboratory the curve peaked at week 56 (1.08 years) while in the field it peaked at year seven. This
suggests that, for the test materials, one year of laboratory leaching was approximately equivalent to seven years of
leaching in the field. Laboratory results were thus adjusted to approximate field values by multiplying
concentration by 6.4 and time by 7.0. The results are shown in Figure 10A. Figures 10B and 10C show the
change in selenium concentration over time in the outlet and watershed studies.
With the exception of several outliers, data from each of the three studies follow a similar temporal trend. The
results indicate a rapid increase in selenium concentration over the first seven years followed by a decline over the
following sixteen years to less than 5 μg Se/L. A secondary peak occurred at year thirteen in the laboratory and
outlet results. Whether this is coincidental or indicative of a significant geochemical process is not clear. In the
future, it will be worthwhile examining whether, for example the sharp decline after year seven reflects the
maximum production of ferrihydrite and its role as a selenite sink. Ferrihydrite is a product of pyrite oxidation and
Meek (1994), reporting on surface coal mine discharges in West Virginia, indicated that the maximum acidity
generation and pyrite oxidation occurred between year six and seven after initial mining. The secondary selenium
peak at year thirteen may represent exhaustion or saturation of the ferrihydrite sink. Further declines in selenium
concentration can be attributed to exhaustion of the spoil selenium pool.
Figure 10. Adjusted results from the laboratory study (A) are compared with the mine outlet (B) and watershed (C)
studies. The purple, horizontal line is the chronic aquatic life standard (5 μg Se/L).
18
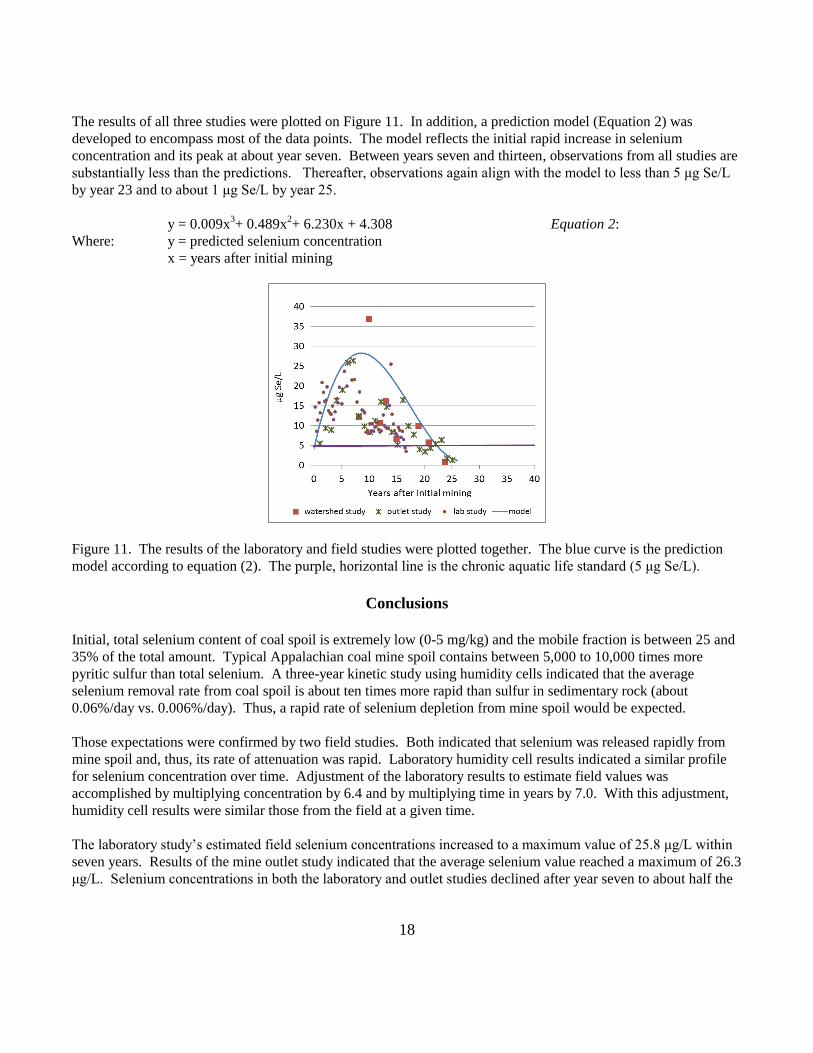
The results of all three studies were plotted on Figure 11. In addition, a prediction model (Equation 2) was
developed to encompass most of the data points. The model reflects the initial rapid increase in selenium
concentration and its peak at about year seven. Between years seven and thirteen, observations from all studies are
substantially less than the predictions. Thereafter, observations again align with the model to less than 5 μg Se/L
by year 23 and to about 1 μg Se/L by year 25.
y = 0.009x3+ 0.489x
2+ 6.230x + 4.308 Equation 2:
Where: y = predicted selenium concentration
x = years after initial mining
Figure 11. The results of the laboratory and field studies were plotted together. The blue curve is the prediction
model according to equation (2). The purple, horizontal line is the chronic aquatic life standard (5 μg Se/L).
Conclusions
Initial, total selenium content of coal spoil is extremely low (0-5 mg/kg) and the mobile fraction is between 25 and
35% of the total amount. Typical Appalachian coal mine spoil contains between 5,000 to 10,000 times more
pyritic sulfur than total selenium. A three-year kinetic study using humidity cells indicated that the average
selenium removal rate from coal spoil is about ten times more rapid than sulfur in sedimentary rock (about
0.06%/day vs. 0.006%/day). Thus, a rapid rate of selenium depletion from mine spoil would be expected.
Those expectations were confirmed by two field studies. Both indicated that selenium was released rapidly from
mine spoil and, thus, its rate of attenuation was rapid. Laboratory humidity cell results indicated a similar profile
for selenium concentration over time. Adjustment of the laboratory results to estimate field values was
accomplished by multiplying concentration by 6.4 and by multiplying time in years by 7.0. With this adjustment,
humidity cell results were similar those from the field at a given time.
The laboratory study’s estimated field selenium concentrations increased to a maximum value of 25.8 μg/L within
seven years. Results of the mine outlet study indicated that the average selenium value reached a maximum of 26.3
μg/L. Selenium concentrations in both the laboratory and outlet studies declined after year seven to about half the
19
maximum values by year seventeen. By year 23, nearly all samples had declined to the regulatory limit of 5 μg/L
and to near zero by year 25.
The watershed study lacked data from the early stages of mining and the first sample occurred about seven years
after initial mining. Nonetheless, from that point forward, selenium concentrations decreased to the compliance
level by year 23 and to extinction by year 25.
Twenty three years after initial mining, 97% of samples were below the regulatory compliance level of 5 μg Se/L.
After three initial leach cycles, the ratio sulfur:selenium obtained in the laboratory study stabilized at about 1,700:1
for the duration of the study. This suggests a common mineralogy, most likely replacement of sulfur with selenium
in FexS/Se.
This study was conducted on one of the largest surface mines in the eastern United States. It covers 6,000 ha and
has been mined since 1977. Sixty seven outlets were sampled over an eight-year period yielding 5,388 mine water
samples. While these results are likely robust, analysis of additional coal mines and geologies is encouraged.
Study of mine spoil weathering under field conditions has traditionally suffered from the lack of reliable records
over the needed time intervals. By segregating a large number of samples according to age class, this study
identified a procedure for conducting long-term weathering studies with data collected over relatively short (eight-
year) sampling intervals.
Literature Cited
Diehl, S.F., Goldhaber, M.B., Koenig, A.E., Tuttle, M.L.W., Ruppert, L.F. (2005) Concentration of
arsenic, selenium, and other trace elements in pyrite in Appalachian coals of Alabama and Kentucky. Proceedings
National Meeting of the American Society of Mining and Reclamation, p.283-301
Huggins, F.E., Senior, C.L.,Chu, P., Ladwig, K., Huffman, G.P. (2007) Selenium and arsenic speciation
in fly ash from full-scale coal-burning utility plants. Environ. Sci. Technol. 41:3284-3289
Hyun, S., Burns, P.E., Murarka, I., Lee, L.S. (2006) Selenium (IV) and (VI) sorption by solid surrounding
fly ash management facilities. Vadose Zone J. 5:1110-1118
Meek, A.F. (1994) Evaluation of acid prevention techniques used in surface mining. Proc. 3rd
International Conference on the Abatement of Acidic Drainage. USDI/Bureau Of Mines Special Public SP 06B-94.
Vol 2: 41-48.
Merrill, D.T., P.M. Maroney, Parker, D.S. (1985) Trace element removal by coprecipitation with
amorphous iron oxyhydroxide: engineering evaluation. Electric Power Research Institute Coal Combustion Systems
Division, Report EPRI, CS 4087, Palo Alto, CA.
Mullennex, R.H. (2005) Stratigraphic distribution of selenium in upper Kanawha-lower Allegheny
formation strata at a location in southern West Virginia. The 23rd
Annual International Pittsburgh Coal Conference,
Pittsburgh, PA, Poster.
Ostle, B. (1963) Statistics in research. The Iowa State University Press. Second Edition, Ch. 6.
Pumure, I, Renton, J.J., Smart, R.B. (2010) Ultrasonic extraction of arsenic and selenium from rocks
associated with mountaintop removal/valley fills coal mining: estimation of bioaccessible concentrations.
Chemosphere 78:1295-1300
Roy, M. (2005) A detailed sequential extraction study of selenium in coal and coal-associated strata from
a coal mine in West Virginia. M.S. Thesis, Department of Geology and Geography, West Virginia University,
Morgantown, WV, USA. 103 pp
Su, C., Suarez, D.L. (2001) Selenate and selenite sorption on iron oxides: an infrared and electrophoretic
study. Soil Sci Soc Am J 64:101-111
USEPA. (2002) A Survey of the Water Quality of Streams in the Primary Region of Mountaintop
Valley Fill Coal Mining. United States Environmental Protection Agency, Region 3,
Wheeling, WV

20
USEPA (2004) Metals, pH, and Fecal Coliform TMDLs for the Guyandotte River Watershed, West
Virginia FINAL REPORT, U.S. Environmental Protection Agency Region 3. 118 p.
Vesper, D.J., Bryant G., Ziemkiewicz, P.F. (2004) A preliminary study on the speciation of selenium in a
West Virginia watershed. 21st Annual Meeting of the American Society of Mining and Reclamation. Morgantown,
WV, April
Vesper, D.J., Roy, M., Rhoads, C.J. (2008) Selenium distribution and mode of occurrence in the Kanawha
formation, southern West Virginia, U.S.A., Int J Coal Geol 73:237-249
Zhang, P., Sparks, D.L. (1990) Kinetics of selenate and selenite adsorption/desorption at the
goethite/water interface. Environ. Sci. Technol., 24:1848-1856
Ziemkiewicz, P.F., O’Neal, M. and Lovett, R.J. (2011) Selenium leaching kinetics and in-situ control.
Mine Water Environ (2011) 30: 141–150.

21
Hydrologic Impacts of Multiple Seam Underground and Surface Mining
Jay W. Hawkins and Jon J. Smoyer
A hydrologic assessment of an underground mine complex overlain by extensive surface mining in north central
Pennsylvania has been conducted. The mine complex is drained mainly by one discharge point which the flow rate
(median of 2,167 L/min.) increased significantly (67%) above background (median of 1,317 L/min.) during the period
it took to construct a treatment plant. The source of this discharge rate increase and other unusual hydrologic
characteristics were investigated. Subsequent to background monitoring, about 440 hectares of surface mining and
reclamation (85% of the recharge area) occurred on numerous seams overlying the underground mines which induced
greatly increased infiltration rates. A direct correlation between the surface mined area and increased recharge to the
underlying deep mines was observed.
Atypically, in-mine storage does not exist to any substantial degree in the basal Lower Kittanning underground (Elbon)
mine from which the main discharge emanates. The overlying Middle Kittanning (Shawmut) mine is the main storage
unit for mine water. The Shawmut mine behaves like a perched aquifer system because of the moderate vertical
hydraulic conductivity (median rate of 1.0 x 10⁻⁷
m/s) of the thin (mean of 11.7 m) clay-rich shale and siltstone
interburden and local structural features. During periods of average to low recharge, the majority of the water flowing
downward from the Middle Kittanning mine to the underlying Lower Kittanning mine is widespread, diffuse, and
Darcian in nature. The discharge rate is consistent within a narrow range of 1,745 to 2,381 L/min, with a median of
2,040 L/min. When surface infiltration rates are high causing the mine pool levels to rise, a portion of the recharge from
the Middle Kittanning mine to the lower seam mine is apparently more channelized flowing through the backfill over
the buried highwalls and into the underlying Lower Kittanning mine. During these periods, the flow varies greatly from
5,725 to over 11,356 L/min, with a median of 8,328 L/min.
A test injection of 2.8 million liters of iron sludge into the Shawmut mine was successful. The openness of the mine
workings and the water quality of the mine pool make it viable to inject iron sludge. Testing of the mine workings
indicates that sufficient space exists to accommodate iron sludge disposal for more than 100 years with little
recirculation of the iron back through the discharge point.
Introduction
The work conducted during this study was performed at the request of and in cooperation with the Pennsylvania
Department of Environmental Protection, Bureau of Abandoned Mine Reclamation Cambria Office in Ebensburg,
Pennsylvania. From this point forward, this mine discharge will be referred to as the Brandy Camp discharge.
Shortly after the Brandy Camp treatment plant was completed and operational, it was found to be significantly
undersized. During high-flow conditions, the plant treats less than 50% of the mine discharge and the remainder is
bypassed to the receiving stream without treatment. Therefore, the first problem to be addressed was why were the
baseline (background) discharge measurements much lower than those recorded since the plant came online. A second
goal of this project was to conduct a hydrologic characterization of related underground mines to determine potential
locations for injection of iron sludge produced at the treatment plant. Presently, this sludge is disposed of and buried in
nearby surface mines. Once the last of these surface mines is closed, a new disposal site and/or method will be needed.
The sludge injection areas within the underground mines require sufficient storage capacity to allow periodic injection
over an extended time period, while at the same time precluding remobilization of the iron back into the mine water.
The sections of the mines that receive the iron sludge will need to be adequately open to allow for free flow of the
sludge away from the injection point. The in-mine water quality needs to be such that the iron hydroxide in the sludge
does not redissolve and thus recycled back to the Brandy Camp discharge.
22
Background
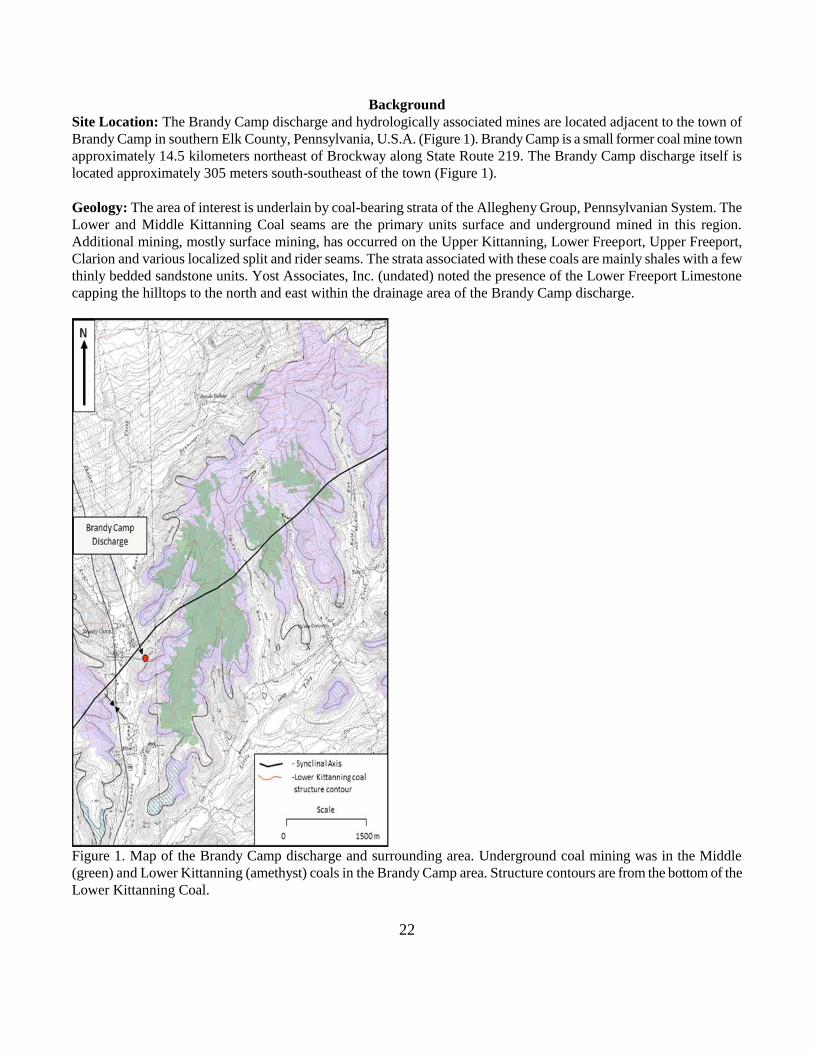
Site Location: The Brandy Camp discharge and hydrologically associated mines are located adjacent to the town of
Brandy Camp in southern Elk County, Pennsylvania, U.S.A. (Figure 1). Brandy Camp is a small former coal mine town
approximately 14.5 kilometers northeast of Brockway along State Route 219. The Brandy Camp discharge itself is
located approximately 305 meters south-southeast of the town (Figure 1).
Geology: The area of interest is underlain by coal-bearing strata of the Allegheny Group, Pennsylvanian System. The
Lower and Middle Kittanning Coal seams are the primary units surface and underground mined in this region.
Additional mining, mostly surface mining, has occurred on the Upper Kittanning, Lower Freeport, Upper Freeport,
Clarion and various localized split and rider seams. The strata associated with these coals are mainly shales with a few
thinly bedded sandstone units. Yost Associates, Inc. (undated) noted the presence of the Lower Freeport Limestone
capping the hilltops to the north and east within the drainage area of the Brandy Camp discharge.
Figure 1. Map of the Brandy Camp discharge and surrounding area. Underground coal mining was in the Middle
(green) and Lower Kittanning (amethyst) coals in the Brandy Camp area. Structure contours are from the bottom of the
Lower Kittanning Coal.

23
The strata within the Brandy Camp discharge drainage area are generally low dipping (≈ 2 degrees or less). The
southwest to northeast trending Shawmut Syncline bisects the drainage area. The syncline plunges southwest. The
synclinal axis lies just north of the Brandy Camp discharge. This structural setting in concert with the deeply-incised
topography cause the Brandy Camp discharge to be the principal mine water relief point for the underground mines.
Underground mining in this region began as early as 1864. The underground mines draining to the Brandy Camp
discharge began in earnest in the 1870s and continued until the 1930s. Around the time of closure on the Lower
Kittanning Elbon mine, mining on the overlying Middle Kittanning coal began in the Shawmut mine. The Shawmut
underground operations continued until about 1959 (Yost Associates, Inc., undated). After the Second World War,
surface mining began on the coal outcrop barriers areas. Surface mining on the Lower and Middle Kittanning coals and
overlying seams continued until the past few years.
Analysis of the Brandy Camp Discharge: The initial task of this study was to determine if the pre- and post-plant
construction discharge rate differences are definite (not random variation). Pre-construction data include flows recorded
during plant construction as well. Figure 2 indicates that the median flow rate after plant construction (3,617 L/min.) is
significantly higher (p ≤ 0.05) than the pre-construction median flow rate (2,167 L/min.). The lack of an overlap of the
two notches about the median on the notched box-and-whisker plot indicates the post-construction flows are
significantly higher. Similar results were obtained analyzing these data using the Student’s T-test and Wilcoxon Mann-
Whitney U (a nonparametric version of the Student’s T-test). The data sets were transformed to approximate a normal
distribution in order to conduct the Student’s T-test.
Several potential reasons for the pre- verses post-plant construction flow differences were postulated: 1) the pre- and/or
post-plant measurements were conducted improperly or the flow measuring device was faulty, 2) the measurement
point location changed substantially from background, 3) the surface mining within the basin during the treatment plant
construction period impacted the recharge rates, 4) the precipitation/climatic conditions changed substantially during
this period, or 5) other anthropogenic activities in the watershed have impacted the mine discharge. Each of these
possible reasons was explored. The impacts of precipitation and/or surface mining were considered the most probable
causes a priori. Anthropogenic activities were quickly eliminated as there were no other major human-related activities
occurring within the watershed.
Figure 2. Notched box-and-whisker plot illustrating the flow rate differences observed before and after construction of
the treatment plant.

24
1. Flow Measurements: A sharp-crested rectangular weir near the discharge point was initially installed to determine
flow rates prior to plant construction. A replacement broad-crested rectangular weir was installed a “few feet
downstream” from the original location during the plant construction (P.J. Shah, personal communication). This short-
distance move had no impact on the flow measurements, given that no gain or loss of flow occurred between the two
points. A review of the weirs indicates that they were constructed and functioning properly. Discussions with plant
personnel indicate that they were reading and recording the discharge rates accurately.
2. Influence of Surface Mining on the Discharge Rate: The large amount of surface mining and reclamation within
the recharge area for the Brandy Camp discharge from 1989 to 2005 appears to have had a substantial impact on the
discharge flow rate. The bulk of the surface mining was on coal seams overlying the Middle Kittanning Coal. Surface
mining activities occurred in this region for several decades prior to 1989, but the activities within the watershed for the
period slightly before, during and after background data collection affected large areas and were of specific interest. A
positive correlation was observed between increasing area affected by surface mining and flow rate at the Brandy Camp
Discharge (Figure 3). Despite the difficulties in determining flow rate and inherent uncertainties common to natural
data the correlation here (R-squared = 68.6%) is comparatively strong.
Figure 3. Regression analysis illustrating the relationship of mean annual discharge rate to amount of drainage area
affected by surface mining.
When background monitoring for the discharge started in July of 1993, recent surface mining had affected about 40
hectares with 29 hectares already reclaimed. Approximately 174 hectares had been affected with 121 hectares reclaimed
by the time background sampling ended in June of 1996. Toward the end of the background sampling period the
discharge rates were beginning to noticeably rise (Figure 4). An additional 266 hectares were surface mined and 318
hectares were reclaimed subsequent to the background sampling, 2004 and 2005, respectively. The discharge rates
continued to rise during this period more than can be attributed to precipitation variation alone. While much higher than

25
normal precipitation in 2004 is reflected in the discharge average for that year, there was a noticeable trend of
increasing flow rates at the Brandy Camp discharge beginning as early as 1996.
In total, 440 hectares were surface mined during this period of interest. The total recharge area for the mines that drain
to the Brandy Camp discharge is approximately 520 hectares, so the surface mining during this period affected
approximately 85% of the recharge area. This caused an increase of 67% in the annual median flow rate at the Brandy
Camp discharge.
During surface mining activities, surface and ground waters are controlled to a large extent. Surface water is collected
and diverted to impoundments via ditches. The impoundments and ditches are engineered to prevent infiltration of the
water. They are designed to collect runoff and hold it until effluent standards are reached, then discharge the water into
the nearest natural drainage way. Ground water encountered in the pit and elsewhere is pumped to treatment ponds and
discharged once effluent standards are achieved. This efficient handling of encountered water precludes recharge to
underlying deep mines as much as possible. Therefore, much of the precipitation falling on the areas where active
surface mining activities are occurring will be intercepted and diverted until mining is completed and the erosion and
sedimentation controls are removed.
Figure 4. Relationship of surface mine affected acres and mean annual flow rate of the Brandy Camp discharge.
Once the site is backfilled and revegetated, the ditches and ponds are removed and surface water is no longer collected
and routed from the site. A significant portion of precipitation or water flowing on to the site from adjacent areas will
infiltrate into the spoil and eventually recharge the Middle Kittanning Shawmut mine. Water entering the Shawmut
26
mine does not discharge directly (Yost Associates, Inc., undated), but instead this water forms a perched mine pool and
then flows downward into the underlying Lower Kittanning Elbon Mine and is subsequently expressed at the Brandy
Camp discharge. This post surface mining change in water handling is a major factor in the increased amount of
recharge occurring in the drainage area for the Brandy Camp discharge.
Some earlier studies of the impacts of surface mining and reclamation indicate that infiltration rates are frequently
reduced from pre-mining conditions due to loss of soil structure, soil compaction and lack of vegetative cover
(Jorgensen and Gardner, 1987). However, within about four years after reclamation, infiltration rates tend to recover to
near background levels. Infiltration rate recovery is due to re-establishment of the soil structure, increases to the
vegetative cover and increasing surface roughness. Guebert and Gardner (2001) noted that infiltration rates on newly
reclaimed minesoils tend to exhibit low steady state infiltration rates of 1 to 2 centimeters per hour (cm/h), but within
four years after reclamation the infiltration rates of “some minesoils” approach the premining rates of 8 cm/h. The
increased infiltration rates were facilitated by the development of macropores in the minesoil causing the effective
reduction of peak runoff rates and dramatically increasing the recession limb of storm events. Analysis of a “heavily
mined” watershed in Indiana showed that the storm runoff averaged 62% of an adjacent “lightly mined” watershed
(Corbett, 1968).
Infiltration rates also depend on the degree the material has been regraded or degree of surface roughness. Deane (1966)
recorded infiltration rates for ungraded spoils of 10.2 and 23.6 cm/hr and 1.5 and 2.3 cm/hr for the same spoils regraded
in Ohio and Illinois, respectively.
Other studies indicate that surface mining greatly increases the infiltration and ground-water storage. Streams fed by
baseflow in heavily mined areas tend to continue flowing through protracted drought; whereas streams in adjacent
unmined areas exhibit substantially lower baseflow or tend to go dry during these periods (Corbett, 1965). This is
indicative of not only higher recharge of the mine spoil, but also spoil aquifers tend to have significantly higher storage
capacity of this additional water than undisturbed strata.
The deforestation that precedes the mining may be a major factor in the increased infiltration. Deforestation greatly
reduces the evapotranspiration and increases the amount of ground water going into storage (Lieberman and Hoover,
1951; Douglass and Swank, 1975; Dickens and others, 1989). The increase in stream flow, previously noted, was due
mainly to the higher baseflow during summer low-flow periods, which is promoted by the decrease in
evapotranspiration. The conversion of the original hardwood forest cover to grasses greatly contributes to the
infiltration rate increase. The commensurate increases in stream baseflow are directly proportional to the area of
deforestation (Douglass and Swank, 1975).
Wiley and others (2001) observed that the 90-percent duration flow (percent of the time the flow is equaled or
exceeded) of streams that originate at the toe-of-valley fills is six to seven times greater than nearby streams draining
unmined watersheds. Truax (1965) observed that at a time when mined watersheds in southwestern Indiana were
yielding about 177 liters per minute per square kilometer (September and October 1964), other nearby watersheds were
dry.
Messinger and Paybins (2003) noted that during low-flow periods the normalized discharge rate (i.e. discharge rate per
unit area drained) of a heavily surface mined watershed in West Virginia was more than twice the rate of an adjacent
unmined watershed. For a complete two year period, total unit flow of the heavily-mined watershed was about 1.75
times greater than the unmined watershed. They attributed much of this change to decreased evapotranspiration due to
deforestation, changes in the plant species, and soil characteristics (thin soils retaining less water). The heavily-mined
watershed continued to discharge during a protracted dry spell when the unmined watershed stopped flowing. They did,
however, attribute some continued baseflow through the summer to increased storage capacity of mine spoil. The

27
substantially increased ground-water storage (i.e. effective porosity) common to mine spoil (Hawkins, 1998), coupled
with the increased infiltration facilitated by decreased evapotranspiration would support stream flow from reclaimed
mine sites when nearby streams in unmined watersheds go dry. Curtis (1979) stated that spoil can store large quantities
of water that eventually discharge as baseflow to the streams. He further states that they “function as reservoirs” of
ground-water storage. Peak storm discharge rates show reductions commensurate with the area of the watershed
disturbed.
Spoil itself is capable of storing much larger quantities of ground water than the pre-existing strata, so if more water
infiltrates into the spoil more of it can be stored and released gradually over longer time periods. Agnew (1966) likened
mine spoil to a “sponge” when it comes to recharge. Effective porosity of mine spoils has been measured in the field
nearing 20%; and likely at times approaches 25% effective porosity (equal to the spoil swell factor) (Hawkins, 1998).
Laboratory spoil porosity values have been recorded as high as 36% (Wells and others, 1982). Whereas, pre-mining
porosity values in fractured strata are generally much less than 0.1% (Mackay and Cherry, 1989).
An aerial photo taken in October 1968 of the contributing area for the Brandy Camp discharge indicates that the
majority of the land (mottled areas) was heavily forested, whereas a similar aerial photo from 2008 illustrate that much
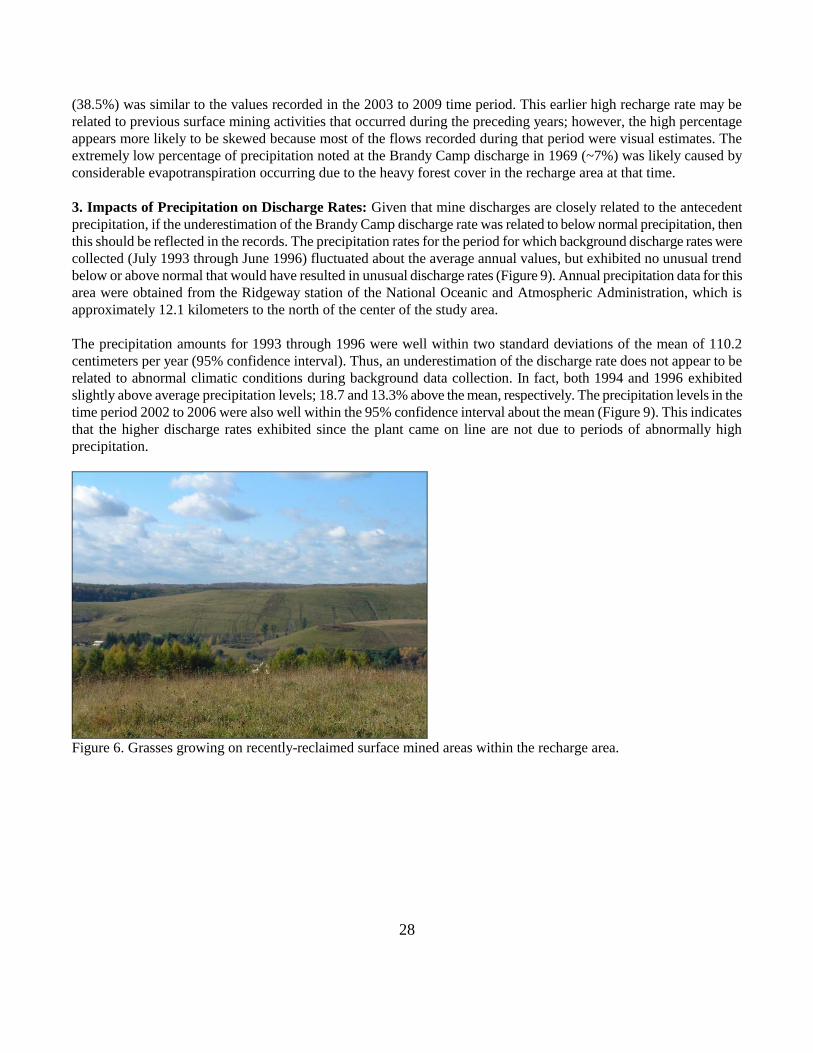
of the area has been mined (Figure 5). Preparation for surface mining removes the trees. Initially, grasses were planted
as a vegetative cover once the mines were reclaimed (Figure 6). This drastic change in vegetation alone may account for
higher infiltration rates for the areas hydrologically connected to the Brandy Camp discharge. Slowly through plantings
and volunteer growth, trees are returning on the reclaimed mines (Figure 7). Eventually, recharge rates may return to
pre-mining levels, but this may take many decades. Douglass and Swank (1975) noted that areas replanted in conifers,
specifically white pine, eventually exhibit recharge rates at or somewhat below that of the pre-existing hardwoods. This
is due to the higher water interception rate and transpiration losses associated with white pine compared to most
hardwoods.
Figure 5. Aerial photograph from October 1968 (left) showing that much of the recharge area for the mines contributing
to the Brandy Camp discharge was forested. Aerial photograph from May 2008 (right) showing mined areas.
The increased infiltration, hence recharge to the Elbon mine, caused by surface mining and reclamation is illustrated by
the mean percentage of the precipitation that is discharging at the Brandy Camp discharge (Figure 8). The mean percent
of precipitation expressed at the Brandy Camp Discharge from 2003 through 2009 was slightly more than 36%.
However, the mean percent of precipitation yielded by the Brandy Camp discharge from 1993 through 1996 (the
background sampling period) was 20%. The percent of precipitation of the Brandy Camp discharge in 1988 and 1989
28
(38.5%) was similar to the values recorded in the 2003 to 2009 time period. This earlier high recharge rate may be
related to previous surface mining activities that occurred during the preceding years; however, the high percentage
appears more likely to be skewed because most of the flows recorded during that period were visual estimates. The
extremely low percentage of precipitation noted at the Brandy Camp discharge in 1969 (~7%) was likely caused by
considerable evapotranspiration occurring due to the heavy forest cover in the recharge area at that time.
3. Impacts of Precipitation on Discharge Rates: Given that mine discharges are closely related to the antecedent
precipitation, if the underestimation of the Brandy Camp discharge rate was related to below normal precipitation, then
this should be reflected in the records. The precipitation rates for the period for which background discharge rates were
collected (July 1993 through June 1996) fluctuated about the average annual values, but exhibited no unusual trend
below or above normal that would have resulted in unusual discharge rates (Figure 9). Annual precipitation data for this
area were obtained from the Ridgeway station of the National Oceanic and Atmospheric Administration, which is
approximately 12.1 kilometers to the north of the center of the study area.
The precipitation amounts for 1993 through 1996 were well within two standard deviations of the mean of 110.2
centimeters per year (95% confidence interval). Thus, an underestimation of the discharge rate does not appear to be
related to abnormal climatic conditions during background data collection. In fact, both 1994 and 1996 exhibited
slightly above average precipitation levels; 18.7 and 13.3% above the mean, respectively. The precipitation levels in the
time period 2002 to 2006 were also well within the 95% confidence interval about the mean (Figure 9). This indicates
that the higher discharge rates exhibited since the plant came on line are not due to periods of abnormally high
precipitation.
Figure 6. Grasses growing on recently-reclaimed surface mined areas within the recharge area.
29
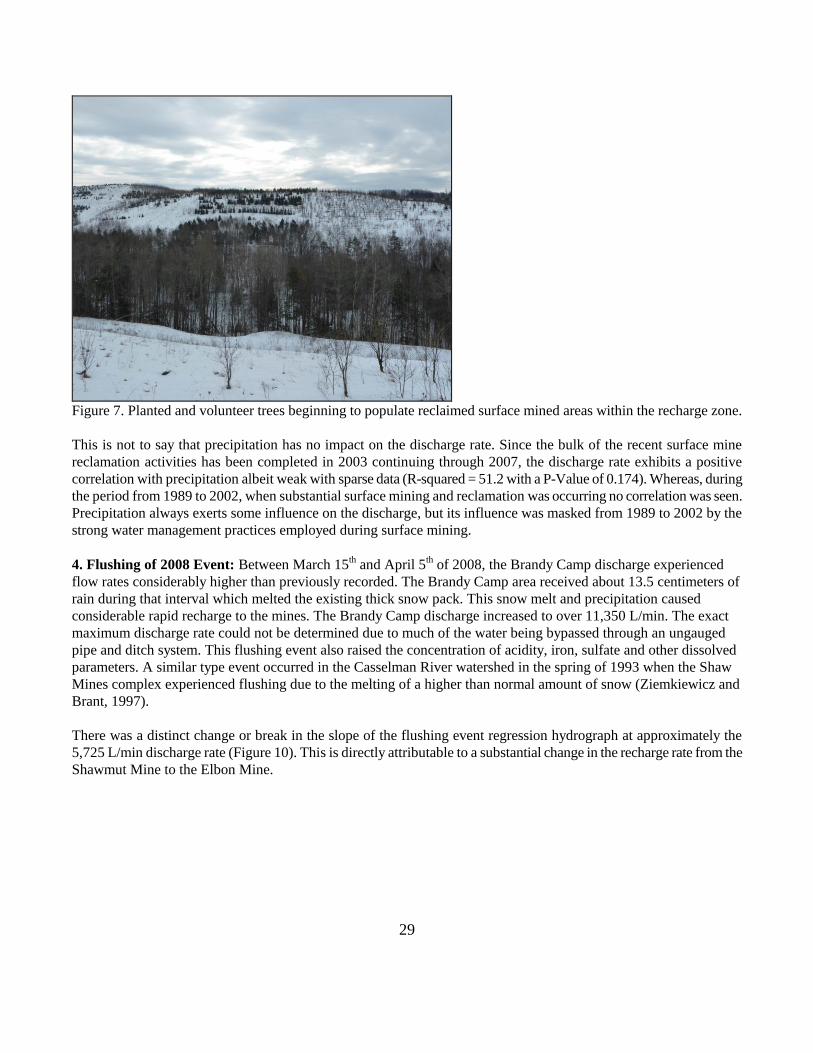
Figure 7. Planted and volunteer trees beginning to populate reclaimed surface mined areas within the recharge zone.
This is not to say that precipitation has no impact on the discharge rate. Since the bulk of the recent surface mine
reclamation activities has been completed in 2003 continuing through 2007, the discharge rate exhibits a positive
correlation with precipitation albeit weak with sparse data (R-squared = 51.2 with a P-Value of 0.174). Whereas, during
the period from 1989 to 2002, when substantial surface mining and reclamation was occurring no correlation was seen.
Precipitation always exerts some influence on the discharge, but its influence was masked from 1989 to 2002 by the
strong water management practices employed during surface mining.
4. Flushing of 2008 Event: Between March 15th and April 5
th of 2008, the Brandy Camp discharge experienced
flow rates considerably higher than previously recorded. The Brandy Camp area received about 13.5 centimeters of
rain during that interval which melted the existing thick snow pack. This snow melt and precipitation caused
considerable rapid recharge to the mines. The Brandy Camp discharge increased to over 11,350 L/min. The exact
maximum discharge rate could not be determined due to much of the water being bypassed through an ungauged
pipe and ditch system. This flushing event also raised the concentration of acidity, iron, sulfate and other dissolved
parameters. A similar type event occurred in the Casselman River watershed in the spring of 1993 when the Shaw
Mines complex experienced flushing due to the melting of a higher than normal amount of snow (Ziemkiewicz and
Brant, 1997).
There was a distinct change or break in the slope of the flushing event regression hydrograph at approximately the
5,725 L/min discharge rate (Figure 10). This is directly attributable to a substantial change in the recharge rate from the
Shawmut Mine to the Elbon Mine.

30
Figure 8. Percentage of recharge from precipitation before and after construction of the treatment plant.
The break in the line curve and the more gradual slope below the 5,725 L/min. discharge rate indicates that the recharge
from the Shawmut mine is declining at a rate more consistent with diffuse flow vertically through fractures in the
interburden and regulated by the head within the mine. Whereas, when the discharge rate is above the 5,725 L/min rate
the regression slope is considerably steeper indicative that a substantial portion of the recharge is more direct and less
restricted. The median flow rate quadrupled from 2,040 L/min below the hydrograph line break to 8,328 L/min above
the break (Figure 10). The higher discharge rates appear to be caused when the mine water rises to a level where it will
spill over the buried surface mine highwalls down through the more transmissive spoil (Hawkins, 1998; Hawkins and
Smoyer, 2011) to the Lower Kittanning pit floor, and flow along the pit floor down gradient recharging the Elbon mine
through entries buried by previous surface mining. The water level at which the spillover occurs was not known; no
monitoring wells existed into the Shawmut Mine at the time of the flushing event and the total extent of the surface
mining in the Middle Kittanning coal is unclear. However, on February 9, 2010 the flow rate exceeded 5,725 L/min and
the water elevation in the Shawmut mine was 505.6 meters above mean sea level, which indicates this may be the point
above which the recharge characteristics become less restricted spillover and the recharge rates greatly increase.
Hydrologic Characterization of the Underground Mine Workings: The second major task in this study was to
determine the potential for disposal of iron hydroxide-rich sludge generated at the treatment facilities into the Middle
Kittanning coal Shawmut mine and/or the Lower Kittanning coal Elbon mine. Critical to this undertaking is
determining if there is ample storage capacity and if the connection between open entries is unrestricted allowing free
flow of the sludge away from the injection borehole. In order for the injection to be efficient, the sludge needs to flow
considerable distances from the injection point before the solids settle out. Another concern is if the quality of the water
in the mine(s) is such that the iron will not be redissolved and mobilized. It is undesirable to treat iron that is
reintroduced by sludge injection.

31
Figure 9. Annual precipitation amounts from 1988 through 2006.
In the Appalachian Plateau, vertically stacked mines situated above the local drainage system tend to drain freely down
to the lowest coal seam mined discharging laterally from a structural low point from that stratum. This scenario is not
the case for the study area. The hydrologic regime within the study area is distinct because a mine pool is located in the
Middle Kittanning Shawmut mine overlying the Lower Kittanning Elbon mine, from which the Brandy Camp discharge
drains. Essentially, the Shawmut mine pool is a perched aquifer system above the lower coal seam. The pooled mine
water from the Shawmut Mine subsequently flows through the interburden in a diffuse fashion into the Elbon mine.
There is no significant pooling within the Elbon mine. Instead, the mine water flows laterally through the open entries
and discharges from a structural low point within the mine at the Brandy Camp discharge.
Several monitoring wells installed into the two mines confirm the existence of a perched mine pool in the Shawmut
mine. Long term monitoring with pressure transducers/data loggers indicates that the Shawmut mine pool varies in
water level and aerial extent seasonally. Whereas, monitoring wells into the Elbon mine shows that it has no pooled
water. Water flows along the floor in the Elbon mine and discharges at the intersection of a structural low point and a
topographic low.
The interburden between the two coals ranges from 10.0 to nearly 13.6 meters with a mean of 11.7 meters. The
interburden strata are comprised primarily of light to dark gray clay-rich shales, claystones, and siltstones. Main
headings and sections with minimal second or retreat mining in the Elbon mine tend to be open and show few collapse
features; whereas, heavily second mined areas exhibit partial to complete collapse. The strata above the collapsed
sections have high-angle fracturing up to at least nine meters above the mine roof. The drilling indicates that the
subsidence-induced fractures extend close or completely up to the Middle Kittanning horizon. The fractures are iron
stained indicating that some weathering and/or mineral precipitation has occurred due to ground-water flow through
them.

32
Figure 10. Brandy Camp discharge rate from the spring of 2008.
The high clay content of the interburden attenuates fracture formation from the Lower toward the Middle Kittanning
level. The clay-rich strata are somewhat pliable and may deform in addition to fracturing when subjected to stress.
Additionally, the clay tends to behave somewhat plastically allowing some self-healing of subsidence-induced and
naturally-created fractures; thus reducing permeability and in turn restricting ground-water movement.
The relatively low permeability of the strata is illustrated by the perched mine pool in the Middle Kittanning supported
by relatively thin interburden. Vertical hydraulic conductivity (Kv) values corroborate that the interburden as a whole
regulates mine water flow from the Shawmut mine pool to the underlying Elbon mine. The Kv values estimated under
varying hydrologic conditions (mine pool levels) were estimated using measured mine pool levels, total flooded area,
mean interburden thickness and the total discharge rate from the Elbon mine. Vertical hydraulic conductivity of the
strata between the two coals ranged from 3.6 x 10⁻⁸
to 2.3 x 10⁻⁷
meters per second (m/s) with a median of 1.0 x 10⁻⁷
m/s. These values are similar to Kv values for unfractured siltstones (Fetter, 1980). While much lower values have been
estimated for true aquitard units (e.g., 10-12
to 10-15
m/s) (Kleeschulte and Seeger, 2005; Eaton and Bradbury, 2003), the
interburden here has sufficiently low permeability to support the perched mine pool system.
Drilling into the Shawmut mine indicates that most the workings encountered are open. The drilling targeted primarily
main entries which tended to be mined to much greater heights than the coal itself and better supported for continued
use. The coal ranges from 0.58 to 0.94 meters with an average of 0.67 meters thick. A few of the drill holes indicate
that some collapse and nearly complete convergence has occurred, but the bulk of the entries intersected were close to
the original full mining height. The voids averaged 1.88 meters with a range of 0.80 to 2.70 meters for main entries.

33
This illustrates that at least the main entries are accessible and able to accept large quantities of sludge.
Factors that influence the chemical stability of iron hydroxide sludge in general include the type neutralizing agent
used, age of the sludge, whether the sludge was aged submerged in water verses aged when subaerially exposed, and
the pH of the environment (water) in which the sludge is placed for disposal. Watzlaf and Casson (1990) noted that iron
hydroxide sludge produced from sodium hydroxide (NaOH), calcium hydroxide (Ca(OH)2), and calcium oxide (CaO)
were more stable than that produced from sodium carbonate (Na2CO3). They further observed that sludge that was
exposed to the atmosphere for a period of time became more stable and insoluble than sludge that was held in a
subaqueous state. Prolonged aging produces more stable iron hydroxide sludge especially if the material is subaerially
exposed during the aging period (Watzlaf and Casson, 1990). Watzlaf (1988) noted that iron hydroxide was relatively
stable down to pH values approaching 3.5 standard units. However, Watzlaf and Casson (1990) noted in their bench
studies that regardless of the treatment chemical, aging time and conditions under which the sludge was held
(submerged or subaerially exposed), the iron remained insoluble down to a pH of 5.5.
The quality of the mine pool water in the Shawmut mine is considerably better than what discharges at the Brandy
Camp discharge. The Shawmut mine water becomes more degraded once it infiltrates into the underlying Elbon mine.
The Shawmut Mine pool water is a geochemically suitable environment for the introduction of iron hydroxide sludge.
Samples were collected by pumping from monitoring wells and from a portal that was opened up to laterally drain off
some of the mine pool water. The geometric average pH is 5.9 with alkalinity concentrations ranging from 77 to 134
mg/L. Acidity concentrations range from 0 to 29 mg/L. Dissolved iron is low, ranging from 0.03 to 0.24 mg/L.
The mine water at the Brandy Camp discharge for 2009 averaged 165 mg/L net acidity (acidity-alkalinity) with a
geometric average pH of 5.1. The pH of the Brandy Camp discharge has been slowly rising from approximately 3.0 in
July 1988 to 4.6 to 5.4 presently. The mean total iron was 69 mg/L. The water is treated with hydrated lime (calcium
hydroxide) to increase the alkalinity and thus raise the pH. Prior to the lime addition, minor aeration of the mine water
allows for some of the excess dissolved carbon dioxide to exsolve reducing the carbonic acid content and thus
decreasing the amount of lime needed to raise the pH. The mine water is suboxic at the discharge point (≈ 1.2 mg/L
dissolved iron) and virtually all of the dissolved iron is in the ferrous state. So, subsequent to the lime addition, the
water is aerated a second time by bubbling air through it to speed the introduction of oxygen which facilitates ferrous
iron oxidation to ferric. The water is then pumped through a series of tanks where a polymer is added to cause the iron
to coagulate. A filter belt press is used to remove the coagulated iron. Excess is sent to settling ponds after the second
aeration step bypassing the rest of the plant.
Sludge Injection Evaluation: A test injection of iron sludge derived from a nearby mine water treatment plant which
uses only settling ponds was conducted on July 12 through 14, 2010. Over three days, more than 2.8 million liters of
sludge was injected into one of the main entries in the Shawmut mine. Tanker trucks holding 19,600 liters were used to
haul the sludge to the site. The sludge averaged 2.43% solids with a range of 1.59 to 3.91%. Water level monitoring
noted no change in the mine pool level due to the injection. Only the expected diurnal fluctuations were observed
(Figure 11).
Water quality at the Brandy Camp discharge was collected twice daily during the injection and the following two days.
Sampling was conducted daily the following week. The sampling was reduced to every other day for the next two
weeks and decreased further to twice per week for the next three weeks. The following three weeks the discharge was
sampled once each week. Discharge rates were also recorded at the time of sampling. No definite change in the
concentration of iron, calcium, sulfate, alkalinity or acidity was observed in the raw samples collected at the Brandy
Camp discharge. Median total iron concentration before sludge injection (63.5 mg/L) was unchanged afterward
(median of 65.0 mg/L) at a significance level of 95%. No change in the total iron overtime was observed. Iron load
showed a definite downward trend after the injection with the median iron load (226 Kg/day) being significantly (p ≤
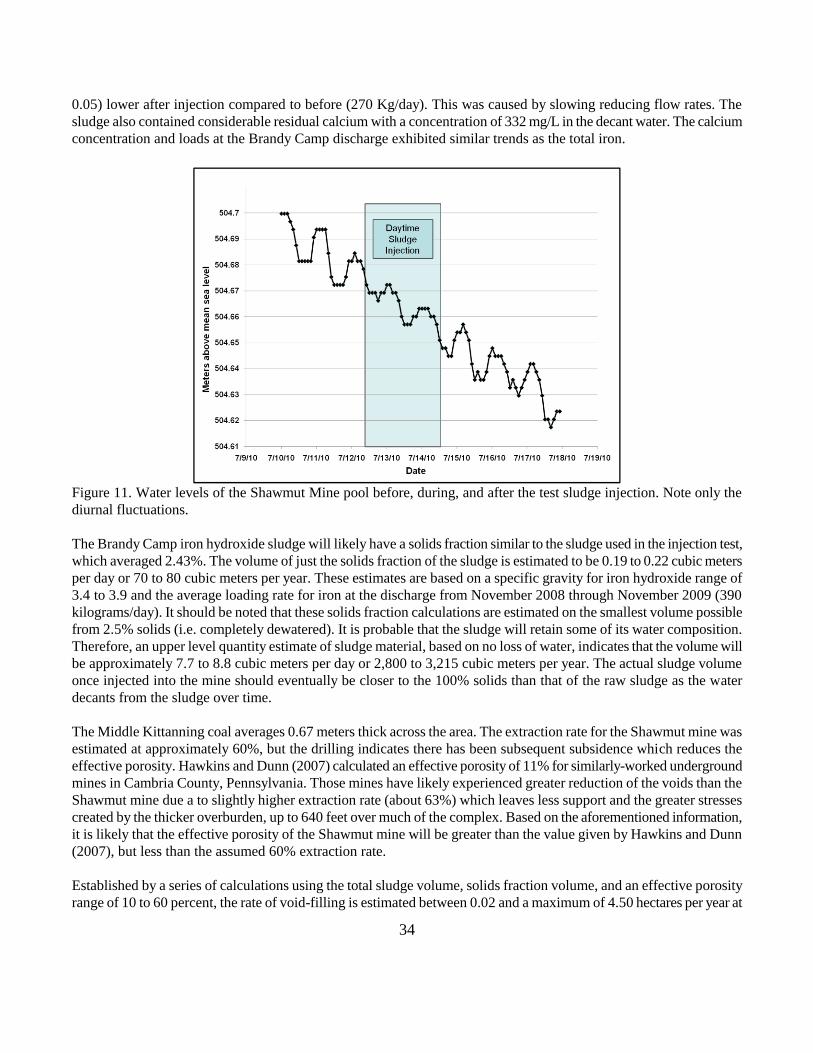
34
0.05) lower after injection compared to before (270 Kg/day). This was caused by slowing reducing flow rates. The
sludge also contained considerable residual calcium with a concentration of 332 mg/L in the decant water. The calcium
concentration and loads at the Brandy Camp discharge exhibited similar trends as the total iron.
Figure 11. Water levels of the Shawmut Mine pool before, during, and after the test sludge injection. Note only the
diurnal fluctuations.
The Brandy Camp iron hydroxide sludge will likely have a solids fraction similar to the sludge used in the injection test,
which averaged 2.43%. The volume of just the solids fraction of the sludge is estimated to be 0.19 to 0.22 cubic meters
per day or 70 to 80 cubic meters per year. These estimates are based on a specific gravity for iron hydroxide range of
3.4 to 3.9 and the average loading rate for iron at the discharge from November 2008 through November 2009 (390
kilograms/day). It should be noted that these solids fraction calculations are estimated on the smallest volume possible
from 2.5% solids (i.e. completely dewatered). It is probable that the sludge will retain some of its water composition.
Therefore, an upper level quantity estimate of sludge material, based on no loss of water, indicates that the volume will
be approximately 7.7 to 8.8 cubic meters per day or 2,800 to 3,215 cubic meters per year. The actual sludge volume
once injected into the mine should eventually be closer to the 100% solids than that of the raw sludge as the water
decants from the sludge over time.
The Middle Kittanning coal averages 0.67 meters thick across the area. The extraction rate for the Shawmut mine was
estimated at approximately 60%, but the drilling indicates there has been subsequent subsidence which reduces the
effective porosity. Hawkins and Dunn (2007) calculated an effective porosity of 11% for similarly-worked underground
mines in Cambria County, Pennsylvania. Those mines have likely experienced greater reduction of the voids than the
Shawmut mine due a to slightly higher extraction rate (about 63%) which leaves less support and the greater stresses
created by the thicker overburden, up to 640 feet over much of the complex. Based on the aforementioned information,
it is likely that the effective porosity of the Shawmut mine will be greater than the value given by Hawkins and Dunn
(2007), but less than the assumed 60% extraction rate.
Established by a series of calculations using the total sludge volume, solids fraction volume, and an effective porosity
range of 10 to 60 percent, the rate of void-filling is estimated between 0.02 and a maximum of 4.50 hectares per year at

35
the current sludge production rate. The central value of 35% effective porosity is probably a reasonable conservative
starting point to estimate the area needed to inject sludge. An effective porosity of 35% should have a sludge filling rate
of 0.03 and 1.28 hectares per year. Given the propensity of iron hydroxide to settle out of solution at extremely slow
flow rates of mine water within underground mines, the sludge in-filling rate will be closer to the 0.03 hectares per year
and in any event should be well below a hectare per year.
Based on the void-filling calculations and experience with sludge injection at other mines in the region, the injection
holes should last several years. The need for future injection holes will be predicated to some extent by the ability for
the sludge to flow within the mine. Testing of the sludge with various mixtures of water will help determine the degree
of flow from the injection point that can be anticipated.
Discussion and Conclusions
Substantial increases in infiltration rates in overlying reclaimed surface mined areas have caused a significant increase
in the flow rate at the Brandy Camp discharge. Reclaimed mine spoil not only allows a greater percentage of
precipitation to infiltrate, it is capable of storing larger quantities of ground water and releasing it to the underlying
mines slowly so flow rates during dry spells are higher than they were previously. Replacement of hardwood forest
cover with grasses contributes to the increased infiltration rates. As tree cover, mainly white pine, increases over time,
the infiltration rates will likely decrease and may eventually return to near pre-surface mining levels.
Analysis of the area affected by surface mining with respect to the average annual discharge rate indicates that the flow
rate increases approximately 1.2 liters per minute for each hectare disturbed. While this does not appear to be a
significant amount compared to the total discharge rate, once several hundred hectares were disturbed, the overall flow
rate exhibited a substantial increase.
Use of multiple regression analyses to predict the mean annual discharge rate (dependent variable)(liters per minute)
based on the independent variables of percent of the recharge area affected (hectares) and annual precipitation
(centimeters), illustrates that the impact of those two variables is much stronger than either single parameter on
precipitation. An R-squared value of 88.5% with a P-value of 0.0002 was obtained for an equation for the fitted line
(Equation 1).
Mean annual discharge rate = -164.363 + (30.2203* A) + (18.611 x P) (1)
Where: A = recharge area affected (in hectares)
P = precipitation (in centimeters)
Future situations where a substantial portion of the recharge area for surface and/or underground mine discharges will
be impacted by additional surface mining, both the area to be disturbed and the annual precipitation need to be factored
into expected and observed changes in the mean annual discharge rate. Of the two parameters, the deforestation and
physical disturbance associated with surface mining exert the biggest impact. Equation 1 or something similar
developed on a region-specific basis could be employed to predict future discharge rates.
The relatively low vertical hydraulic conductivity (1.0 x 10⁻⁷
m/s) of the thin (11.7 m) interburden between the Middle
and Lower Kittanning coals supports a perched mine pool within the upper mine. The low vertical hydraulic
conductivity is directly related to the clay-rich strata of the interburden which inhibits ground-water flow through
subsidence-induced fractures from extending up from the Elbon mine.

36
The open conditions of the Shawmut mine workings and the chemical quality of the water in the mine make it a feasible
option for iron sludge disposal by injection through boreholes drilled constructed specifically for that purpose. The iron
sludge injection test was on all accounts successful. The water quality of the Shawmut mine is such that redissolution of
the iron hydroxide is unlikely to occur. The rate of mine void filling from the iron sludge is calculated to be well less
than one hectare per year. With the amount of available abandoned underground works associated with the Shawmut
mine and at the present sludge production rate, there should be sufficient space for injection disposal for well over 100
years. Sludge production will likely diminish with time as the effluent iron and acidity concentrations likewise decrease
from natural amelioration. Lower acidity concentrations allow the use of less lime.
Recommendations
In order to reduce the amount of mine water that ultimately must be treated, the recharge rate needs to be reduced for
the areas overlying the underground mines. Reforestation of the overlying areas which are hydrologically connected to
the Elbon mine and the Brandy Camp discharge is highly recommended. White Pine, based on its propensity to
intercept and utilize infiltrating water, may be the optimal tree species choice. Planting of various high water-use
hardwoods is also a good recommendation.
A drilling program has been conducted in the potential sludge injection areas to determine the conditions of the mine
workings in the Middle Kittanning Shawmut mine. Additional drilling and evaluation of the mine workings is
recommended to more adequately assess the degree of openness and free interconnection of the mine workings to refine
the estimate of available storage. Injection of iron sludge from the Brandy Camp treatment plant into the Shawmut
underground mine is recommended.
References
Agnew, A.F. 1966. A Quarter to Zero- Surface Mining and Water Supplies, Mining Congress Journal, pp. 29-40.
Corbett, D.M., 1965, Runoff Contributions to Streams from Cast Overburden of Surface Mining Operations for Coal,
Pike County, Indiana, Water Resources Research Center, Indiana University, Report of Investigations No. 1, 67 p.
Corbett, D.M., 1968, Ground-Water Hydrology Pertaining to Surface Mining for Coal—Southwestern Indiana, Second
Symposium Coal Mine Drainage Research, Coal Ind. Adv. Comm. Ohio River Valley Water Sanit. Comm. Pittsburgh,
PA, pp. 164-189.
Curtis, W.R., 1979. Surface Mining and the Hydrologic Balance, Mining Congress Journal, July 1979, pp. 35-40.
Deane, J.A. 1966. How Strip Mining Improves Mid-West Water Supplies, Coal Age, May 1966, pp. 66-68.
Dickens, P.S., R.A. Minear, B.A. Tschantz, 1989, Hydrologic Alteration of Mountain Watersheds form Surface
Mining, Journal of the Water Pollution Control Federation, Vol. 61, No. 7, pp. 1249-1260.
Douglass, J. E. and W. T. Swank, 1975, Effects of Management Practices on Water Quality and Quantity: Coweeta
Hydrologic Laboratory, North Carolina, Symposium Proceedings: Municipal Watershed Management, pp. 1-13.
Eaton, T.T. and K.R. Bradbury, 2003, Hydraulic Transience and the Role of Bedding Fractures in a Bedrock Aquitard,
Southeastern Wisconsin, USA, Geophysical Research Letters, Vol. 30, No. 18, pp. 4-1 to 4-5.

37
Fetter, C.W., 1980, Applied Hydrogeology, Charles E. Merrill Publishing Co., Columbus, OH, 488 p.
Guebert, M.D. and T.W. Gardner, 2001, Macropore flow on a reclaimed surface mine: infiltration and hillslope
hydrology, Geomorphology, Vol. 39, pp. 151-169.
Hawkins, J. W., 1998, Hydrogeologic Characteristics of Surface-Mine Spoil, Chapter 3, Prediction and Prevention of
Mine Drainage Pollution in Pennsylvania, Pennsylvania Department of Environmental Protection, Harrisburg, PA, pp.
3-1 to 3-11.
Hawkins, J. W. and M. L. Dunn, 2007, Hydrologic Characteristics of a 35-Year-Old Underground Mine Pool, Mine
Water and the Environment, Vol. 26, No. 3, pp. 150-159.
Hydrologic Impacts of Multiple Seam Underground and Surface Mining: A Northern Appalachian Example, J. W.
Hawkins and J. J. Smoyer, Mine Water and the Environment, Vol. 30, No. 2, 2011, 11 p.
Jorgensen, D.W. and T.W. Gardner, 1987, Infiltration Capacity of Disturbed Soils: Temporal Change and Lithologic
Control, Water Resources Bulletin, Vol. 23, No. 6. pp. 1161-1172.
Kleeschulte, M.J. and C.M. Seeger, 2005, Stratigraphy and Vertical Hydraulic Conductivity of the St. Francois
Confining Unit in the Viburnum Trend and the Evaluation of the Unit in the Viburnum Trend and Exploration Areas,
Southeastern Missouri, U.S. Geological Survey, Water-Resources Investigations Report 03-4329, p. 63.
Lieberman, J. A. and M. D. Hoover, 1951, Stream-Flow Frequency Changes on Coweeta Experimental Watersheds,
Transactions of the American Geophysical Union, Vol. 32, No. 1, pp. 73-76.
Mackay, D. M. and J. A. Cherry, 1989. Groundwater Contamination: Pump-and Treat Remediation, Environmental
Science Technology, Vol. 23, No. 6, pp. 630-636.
Messinger, T. and K. S. Paybins, 2003, Relations Between Precipitation and Daily and Monthly Mean Flows in
Gauged, Unmined and Valley-Filled Watersheds, Ballard Fork, West Virginia, 1999-2001, Water-Resources
Investigations Report 03-4113, U. S. Geological Survey, 51 p.
Truax, C.N.,1965, Water Storage Potential of Surface Mined Coal Lands, Mining Congress Journal, November 1965,
pp.40-46.
Watzlaf, G. R., 1988, Chemical Stability of Manganese and Other Metals in Acid Mine Drainage Sludge, Proceedings
of the American Society of Surface Mining and Reclamation, Pittsburgh, PA, pp. 83-90.
Watzlaf, G. R. and L. W. Casson, 1990, Chemical Stability of Manganese and Iron in Mine Drainage Treatment
Sludge: Effects of Neutralization Chemical, Iron Concentration, and Sludge Age, Proceedings of the Mining and
Reclamation Conference and Exhibition, Charleston, WV, pp. 3-9.
Wells, L.G., A.D. Ward, and R.E. Phillips. 1982. Infiltration Characteristics of Kentucky Surface Mine Spoil and Soils,
In Proceedings of the 1982 Symposium on Mining, Hydrology, Sedimentology, and Reclamation, Lexington KY, pp.
445-456.
38
Wiley, J. B., R. D. Evaldi, J. H. Eychaner, and D. B. Chambers, 2001, Reconnaissance of Stream Geomorphology, Low
Streamflow, and Stream Temperature in the Mountaintop Coal-Mining Region, Southern, West Virginia, 1999-2000,
Water-Resources Investigations Report 01-4092, 34 p.
Yost Associates, Inc., undated, Toby Creek Mine Drainage Pollution Abatement Project Part of Operation Scarlift,
Commonwealth of Pennsylvania, Harrisburg
Ziemkiewicz, P. F. and D.L. Brant, 1997, The Casselman River Restoration Project, Presented at West Virginia
Surface Mine Drainage Task Force Symposium. Morgantown, WV

39
Simulating Interbasin Transfer in Abandoned Coal Mines
M.D. Kozar, USGS Washington Water Science Center, Tacoma WA
K.J. McCoy, USGS Virginia Water Science Center, Richmond VA
Abstract: Simulation of groundwater flow in abandoned mines can be difficult, especially where flux to and
from mines is unknown or poorly quantified, and interbasin transfer of groundwater occurs. A 3-year study
was conducted in McDowell County, West Virginia to define the mined area contributing to groundwater
outflow from above-grade abandoned coal mines. The study area was specifically selected, as all the mines
are located above the elevation of tributary streams, which allowed accurate measurements of discharge from
mine portals and tributaries to provide data for groundwater model calibration.
Abandoned mine workings were initially simulated as a layer of high hydraulic conductivity bounded by
lower permeability bedrock in adjacent strata. A second approach used rows of higher hydraulic
conductivity mine tunnels embedded within a lower hydraulic conductivity unmined coal matrix. Regardless
of the hydraulic conductivity assigned to mine workings, neither indirect approach to simulate mine
workings could accurately simulate interbasin transfer of groundwater from adjacent watersheds.
To resolve the problem, a third approach was developed. The MODFLOW DRAIN package was used to
simulate seepage to mine workings and tunnels discharging water to Elkhorn Creek, North Fork, and
tributaries of the Bluestone River. Drain nodes were embedded in a matrix of uniform hydraulic
conductivity cells that represented unmined coal aquifer. Drain heads were empirically defined from well
observations and elevations were based on structure contours for the Pocahontas No. 3 mine workings. Use
of the DRAIN package to simulate workings as an internal boundary condition resolved the interbasin
transfer problem. Model simulations prior to use of the DRAIN package for simulating mine workings
produced estimated flows of 0.31 m3/s in each of the similar sized Elkhorn Creek and North Fork
Watersheds, but failed to estimate interbasin transfer of groundwater from the adjacent Bluestone River
Watershed. The simulation of mine entries and discharge using the DRAIN package produced estimated
flows of 0.46 and 0.27 m3/s for the Elkhorn Creek and North Fork watersheds, which matched well with
measured flows for the respective watersheds of 0.47 and 0.26 m3/s.

40
PRIORITY POLLUTANTS IN UNTREATED AND TREATED DISCHARGES FROM COAL MINES IN PENNSYLVANIA
C.A. Cravotta III1, M.A. Roland
1, K.B.C. Brady
2, G.S. Greenfield
2, W.S. Allen Jr.
2
1U.S. Geological Survey, 215 Limekiln Rd., New Cumberland PA 17070 [email protected]; [email protected]
2Pennsylvania Department of Environmental Protection, Bureau of Mining and Reclamation, 400 Market Street, Harrisburg
PA 17101 [email protected]; [email protected]; [email protected]
Abstract: Clean sampling and analysis procedures were used to quantify more than 70 inorganic chemical constituents
(dissolved and total), organic carbon and phenols, and other characteristics of untreated (influent) and treated (effluent)
discharges at 38 permitted coal-mining or coal-processing facilities in the bituminous coalfield and 4 facilities in the
anthracite coalfield of Pennsylvania. Of the 42 sites sampled, 26 were surface mines, 11 were deep mines, and 5 were
coal refuse disposal facilities. No chemical additives were used at 28 percent of the sites; caustic soda (NaOH), lime
(CaO; Ca(OH)2), flocculent, or limestone was used at 21%, 40%, 6%, and 4% of the sites, respectively. All the
treatment facilities incorporated structures to promote aeration and settling of solids.
The influents had wide ranges of pH (2.8 to 7.6), specific conductance (253 to 13,000 S/cm), dissolved solids (168
to 18,100 mg/L), hot acidity (-600 to 8,000 mg/L as CaCO3), SO4 (15 to 10,700 mg/L), Fe (0.01 to 4,100 mg/L), Mn
(0.02 to 136 mg/L), Al (0.002 to 128 mg/L), Zn (0.002 to 18.8 mg/L), and associated constituents. The pH values of
the effluents ranged from 5.5 to 11.9 and were greater than or equal to the pH of the corresponding influents. All but
one of the effluents had pH > 6; three had pH > 9. The measured hot acidity and computed net acidity were similar and
were consistently lower for the effluent compared to the influent. Although most of the effluents were net alkaline (hot
acidity and net acidity < 0), three were net acidic. None of the untreated influent met criteria maximum concentration
(CMC) levels for the protection of freshwater aquatic organisms from toxic effects of priority pollutants. However, the
treated effluents met CMC levels for most pollutants, including Sb, As, Ba, Cd, Cl, Cr, Pb, Hg, Ni, Se, Ag, Tl, and V.
Of the 46 treated effluents, CMC levels were exceeded only for Al (2 samples > 750 g/L), Fe (4 > 1,000 g/L), Co (5
> 95 g/L), Cu (1 > 32 g/L), and Zn (1 > 255 g/L).
The Wilcoxon matched-pair signed-ranks test was used to test the hypothesis that the difference between the effluent
and influent pairs was equal to zero. Constituents that were the same for effluent and influent (p > 0.05) included flow
rate, specific conductance (SC), osmotic pressure, hardness, alkalinity, total organic carbon (TOC), K, Cl, NO3, PO4,
Sb, Sr, Br, Se, Mo, and V. However, most constituents decreased significantly as a result of treatment, including total
dissolved solids (TDS), acidity, SO4, Al, Fe, Mn, Mg, As, Ba, Be, Cd, Cr, Co, Cu, F, Pb, Ni, NH3, Tl, Ti, U, Zn, Zr,
total phenols, total inorganic carbon (TIC), biological oxygen demand (BOD), and chemical oxygen demand (COD).
Constituents that increased included temperature, dissolved oxygen (DO), pH, Ca, and Na.
Spearman’s rank correlation and principal components analysis were used to evaluate the relations of priority
pollutants to other chemical constituents in the influent and effluent. Most priority pollutants (Al, Fe, Mn, Co, Ni, Zn,
Cd, Tl, U, As, Se) were negatively correlated with pH and positively correlated with acidity. Specific conductance was
strongly correlated with TDS, hardness, SO4, and major cations (Ca, Mg, Na, K) and was independent of pH. Ionic
contributions to SC were mainly from SO42-
, Ca2+
, Mg2+
, Na+, Cl
-, HCO3
-, and, to a lesser extent, H
+, Fe
2+, Mn
2+, and
Al3+
. The contributions to SC by H+, Fe
2+, Mn
2+, and Al
3+ in influent were replaced by additional contributions by Na
+,
Ca2+
, and OH- in treated effluent. Brine constituents were more strongly correlated with one another (Na, Cl, Br) than
with other constituents and were not strongly associated with acidity or pH. In essence, increasing pH and decreasing
Al, Fe, and Mn resulted in lower concentrations of priority pollutants but generally did not affect SC or osmotic
pressure. These findings suggest that typical chemical or aerobic treatment of acidic effluents to pH > 6 with removal
of Fe to < 7 mg/L may provide a reasonable measure of protection for aquatic life from priority pollutant metals but
may not be useful for decreasing SC or osmotic pressure.

41
Assessment and Quantification of
Water Treatment Systems to Meet
West Virginia Water Quality Standards
M. Oneal, B. Gutta, B. Leavitt, B. Mack, P. Ziemkiewicz
West Virginia Water Research Institute
West Virginia University
Abstract
In August of 2011, a ruling in the United States District Courts held that the West Virginia Department of
Environmental Protection (WVDEP) was required to obtain Clean Water Act section 402 NPDES permits
and meet prevailing water quality standards for one hundred sixty-eight (168) Bond Forfeiture sites scattered
throughout West Virginia. As part of the judgment, the DEP was required to provide a site inventory,
sampling data, a priority ranking of sites, a summary of the costs to achieve compliance, and a schedule
detailing the corrective actions. In response to this judgment, the WVDEP requested the assistance of the
West Virginia Water Research Institute (WVWRI) in developing the priority ranking for the bond forfeiture
sites based on acid load, its impact to the receiving tributaries, and cost estimates to retrofit those sites with
the goal of compliance.
The District Court order had identified a total of eighty-nine (89) sites located in the Northern District and
eighty-two (82) sites located in the Southern District. Thirty-three (33) sites were determined by WVDEP
as: 1) having no discharge; 2) NPDES permitted; 3) construction completed; 4) under construction; or 5) not
applicable.
The West Virginia Water Research Institute (WVWRI) ranked the sites, developed cost estimates for both
capital and annual costs. The results of the study performed by the WVWRI found that the capital costs
required to get the sites to compliance totaled $33,122,958.35 and operation and maintenance costs are going
to be approximately $5,547,227.85 a year.
42
Passive Mixing to Improve Calcium Oxide Dissolution
B. R. Leavitt, PE, PG
1, Tim Danehy
2, and Bryan Page
2
Abstract: Water-powered dosers have been used for many years to feed pebble quicklime (CaO) or, more
recently, hydrated lime (Ca(OH)2) into mine drainage treatment facilities where electric power is not
available. Lime utilization at these facilities has historically been poor when pebble lime is used due to the
low solubility, high density, and large particle size of the pebble lime. This has resulted in the use of mixing
channels downstream of the dosers to provide for contact time with the treated water. Two passive
technologies one old and one new have been combined to improve pebble lime utilization. The Manor
treatment facility, near Clearfield, Pennsylvania, has been modified to include a MixWell, inspired by
diversion wells and a TROMPE driven air lift mixer “A-Mixer” to enhance lime dissolution. The result of
this modification is an estimated 40 to 57 percent reduction in lime usage, leading to a project cost savings
of $12,000 to $17,000 per year in lime cost.
Introduction
Pebble Quicklime
Pebble Quicklime is derived from the heating of limestone to convert the calcium or magnesium carbonate
into the respective oxide. Depending on the limestone source, there are varying ratios of Calcium and
Magnesium oxide. In addition to the Calcium / Magnesium oxide, there is also an inert component which
does not contribute to acid neutralization. Pure pebble quicklime has a neutralization equivalent of 0.56 tons
per ton of acidity (CaCO3 equivalent) compared to hydrated lime which has a neutralization equivalent of
0.74 tons per ton of acidity. In addition, its higher density 55 to 60 pounds per cubic foot vs. 30 to 40
pounds per cubic foot allows for more alkalinity to be delivered on a per truck basis and it also allows for a
smaller product silo.
When site, budgetary or other conditions limit the use of passive technology, water-powered dosers have
been deployed to deliver pebble quicklime to neutralize acid mine drainage. These water-powered systems
are sometimes referred to as semi-active. The solubility of pebble quicklime is somewhat limited, 1.33 g/L,
while hydrated lime is somewhat more soluble at 1.76 g/L. Before it can dissolve in water, pebble quicklime
has to be converted from Calcium oxide to calcium hydroxide, a process called slaking.
The slaking equation is:
CaO + H2O → Ca(OH) 2 (1)
This is an exothermic reaction commonly confined to a slaker where the elevated temperatures promote
the slaking process. Limited quantities of water are used to keep the temperature elevated. If excessive
amounts of water are used, then the lime is said to be “drowned” and the slaking reaction is inhibited by
a coating of calcium hydroxide on the particle surface that restricts water penetration thereby restricting
the reaction. This is the typical state of the reaction at most semi-active treatment sites. To overcome
1 Consulting Hydrogeologist 2776 S-Bridge Rd Washington, Pa. 15301 2 BioMost Inc. 434 Spring Street Ext. Mars, PA 16046
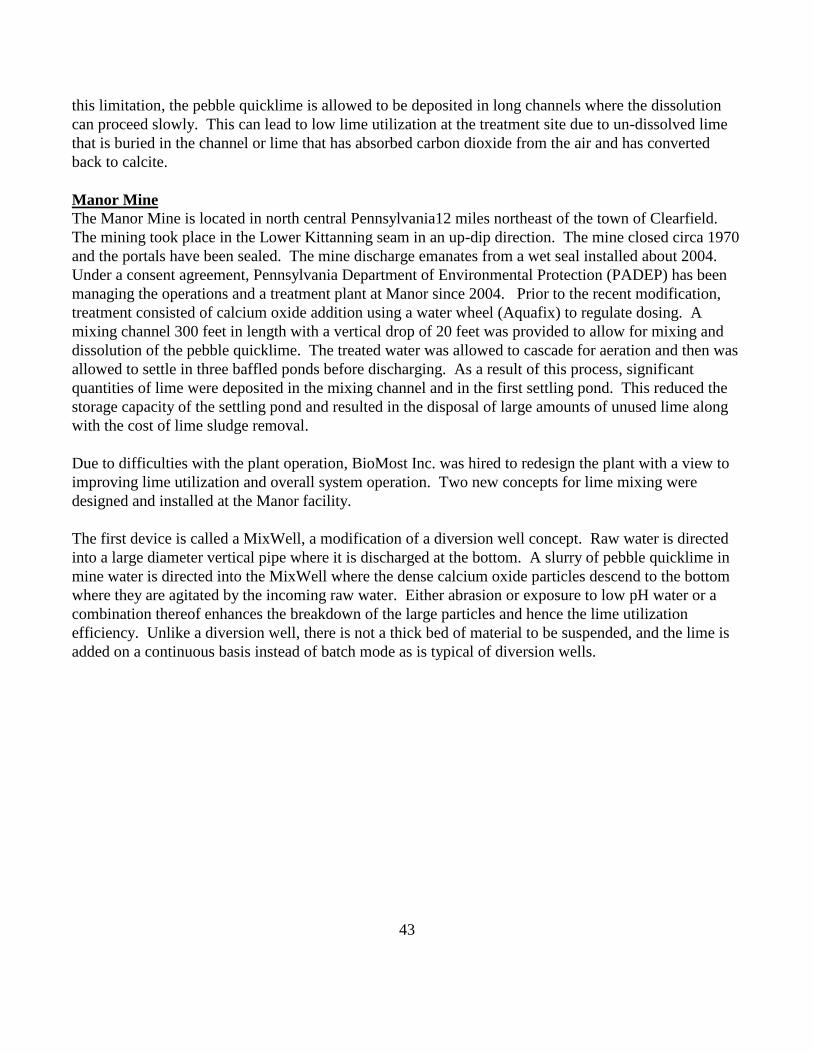
43
this limitation, the pebble quicklime is allowed to be deposited in long channels where the dissolution
can proceed slowly. This can lead to low lime utilization at the treatment site due to un-dissolved lime
that is buried in the channel or lime that has absorbed carbon dioxide from the air and has converted
back to calcite.
Manor Mine
The Manor Mine is located in north central Pennsylvania12 miles northeast of the town of Clearfield.
The mining took place in the Lower Kittanning seam in an up-dip direction. The mine closed circa 1970
and the portals have been sealed. The mine discharge emanates from a wet seal installed about 2004.
Under a consent agreement, Pennsylvania Department of Environmental Protection (PADEP) has been
managing the operations and a treatment plant at Manor since 2004. Prior to the recent modification,
treatment consisted of calcium oxide addition using a water wheel (Aquafix) to regulate dosing. A
mixing channel 300 feet in length with a vertical drop of 20 feet was provided to allow for mixing and
dissolution of the pebble quicklime. The treated water was allowed to cascade for aeration and then was
allowed to settle in three baffled ponds before discharging. As a result of this process, significant
quantities of lime were deposited in the mixing channel and in the first settling pond. This reduced the
storage capacity of the settling pond and resulted in the disposal of large amounts of unused lime along
with the cost of lime sludge removal.
Due to difficulties with the plant operation, BioMost Inc. was hired to redesign the plant with a view to
improving lime utilization and overall system operation. Two new concepts for lime mixing were
designed and installed at the Manor facility.
The first device is called a MixWell, a modification of a diversion well concept. Raw water is directed
into a large diameter vertical pipe where it is discharged at the bottom. A slurry of pebble quicklime in
mine water is directed into the MixWell where the dense calcium oxide particles descend to the bottom
where they are agitated by the incoming raw water. Either abrasion or exposure to low pH water or a
combination thereof enhances the breakdown of the large particles and hence the lime utilization
efficiency. Unlike a diversion well, there is not a thick bed of material to be suspended, and the lime is
added on a continuous basis instead of batch mode as is typical of diversion wells.

44
Figure 1. MixWell diagram.
Figure 2. MixWell in operation.
The second device is called an “A-Mixer” derived from an airlift mixer. This device consists of a large

45
tank to provide residence time. In the center of the tank is a vertical pipe suspended off the bottom of
the tank and rising to just below the normal water level in the tank. An air pipe, with an air distributor
(diffuser), is suspended in the middle the vertical pipe and is connected to a source of compressed air. In
this case, a Trompe, which is located below the treatment plant discharge, was installed to provide the
compressed air. Air is bubbled up through the vertical pipe inducing water flow through the pipe. This
causes a convective-like circulation in the tank that keeps small lime particles suspended and available
for dissolution.
This paper evaluates the effectiveness of these two devices in terms of individual unit operation and the
combined effect on lime utilization.
Figure 3. A-Mixer diagram.
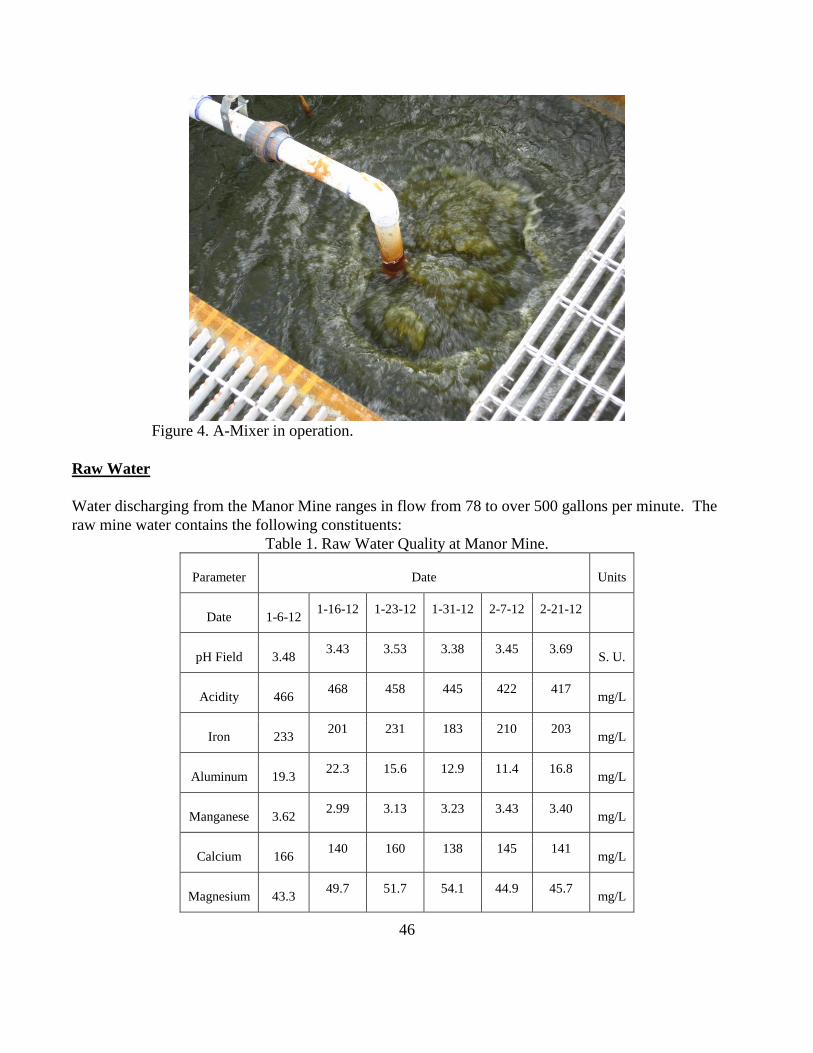
46
Figure 4. A-Mixer in operation.
Raw Water
Water discharging from the Manor Mine ranges in flow from 78 to over 500 gallons per minute. The
raw mine water contains the following constituents:
Table 1. Raw Water Quality at Manor Mine.
Parameter Date Units
Date 1-6-12 1-16-12 1-23-12 1-31-12 2-7-12 2-21-12
pH Field 3.48 3.43 3.53 3.38 3.45 3.69
S. U.
Acidity 466 468 458 445 422 417
mg/L
Iron 233 201 231 183 210 203
mg/L
Aluminum 19.3 22.3 15.6 12.9 11.4 16.8
mg/L
Manganese 3.62 2.99 3.13 3.23 3.43 3.40
mg/L
Calcium 166 140 160 138 145 141
mg/L
Magnesium 43.3 49.7 51.7 54.1 44.9 45.7
mg/L

47
Field Investigation
Water from the modified treatment plant was sampled at four locations: Raw water; MixWell outflow,
A-Mixer inflow; and A-Mixer outflow. Note, due to site conditions, the A-Mixer is located down-
gradient of the MixWell. The influent of the A-Mixer travels approximately 150 feet along the existing
mixing channel prior to entering the A-Mixer. With the exception of the raw water, these samples were
quite complex in that they contained calcium oxide/hydroxide particles in suspension along with a
suspension of ferrous hydroxide floc, which is actively trying to oxidize to ferric hydroxide. Special
procedures had to be taken to get a representative sample from these three locations. Field filtered
samples were desired so that the dissolved lime could be separated from the lime that was still in
particulate form. A 0.45-micron filter was used for this purpose. The presence of the ferrous hydroxide
floc greatly inhibited this filtration. To help avoid this problem, these samples were allowed to sit for 10
minutes before filtering so that the suspended particles could settle.
Particle Size Analysis
Pebble quicklime samples were taken from the AquaFix feeder at the Manor site. These samples were
sieved through a 10, 60, 80, 200, and 325 mesh screens. Effluent from the MixWell and the A-Mixer
were also wet sieved through the 10, 60, and 80 screens; finer screens were blinded by the ferrous
hydroxide floc. Figure 5 shows the particle size distribution of the raw lime product. Figure 6 shows the
particle size contained in the effluent water from the MixWell. Figure 7 shows the particle size
contained in the effluent from the A-Mixer. It was not possible to sieve the entire flow from the
MixWell, consequently, a mass balance based on particle weight was not possible.
The graphs show continued degradation of the particle size as it moved through the system. Over 60
percent of the raw lime was retained on the number 10 sieve. Effluent from the MixWell had no
material on the number 10 sieve and 80 percent of the material retained on the number 60 sieve.
Effluent from the A-Mixer had between 40 to 55 percent retained on the number 60 sieve with a similar
range being retained on the number 80 sieve.
Figure 5. Pebble Quicklime particle size.
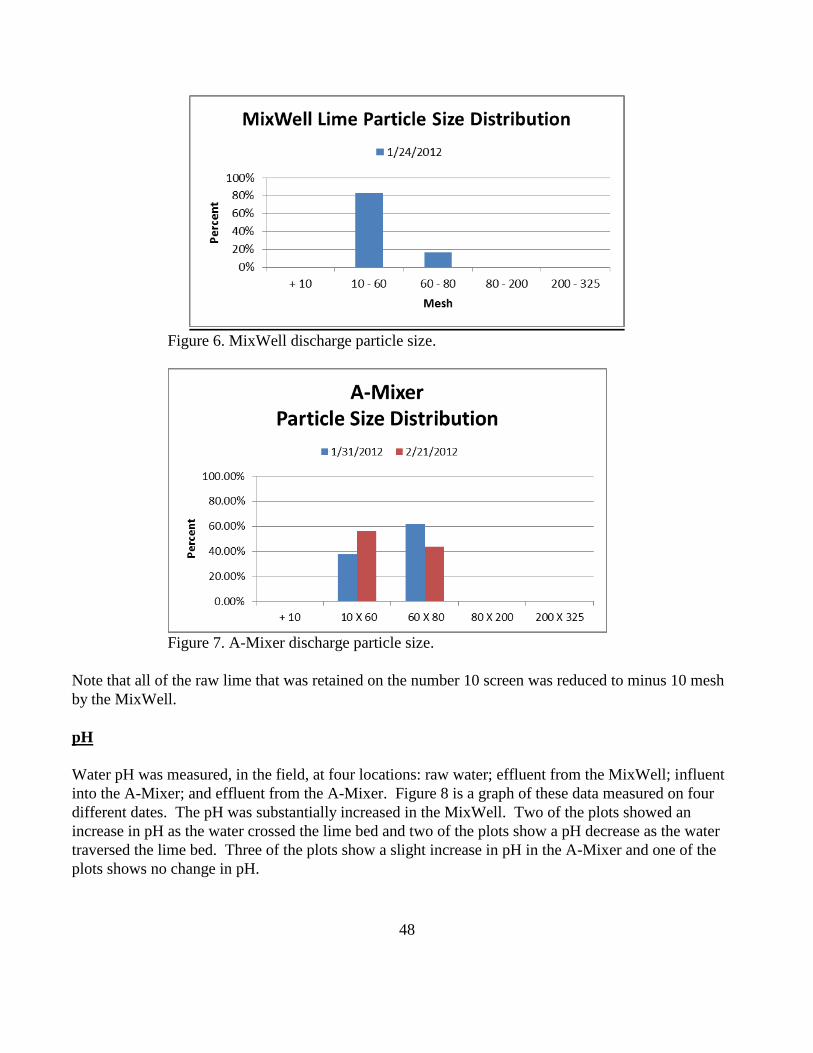
48
Figure 6. MixWell discharge particle size.
Figure 7. A-Mixer discharge particle size.
Note that all of the raw lime that was retained on the number 10 screen was reduced to minus 10 mesh
by the MixWell.
pH
Water pH was measured, in the field, at four locations: raw water; effluent from the MixWell; influent
into the A-Mixer; and effluent from the A-Mixer. Figure 8 is a graph of these data measured on four
different dates. The pH was substantially increased in the MixWell. Two of the plots showed an
increase in pH as the water crossed the lime bed and two of the plots show a pH decrease as the water
traversed the lime bed. Three of the plots show a slight increase in pH in the A-Mixer and one of the
plots shows no change in pH.

49
Figure 8. Manor water pH.
The chemistry driving the pH rise in the MixWell is straight forward. The pebble quicklime dissolved
raising the pH and some of the dissolved ferrous iron precipitated as ferrous hydroxide floc. Between the
MixWell discharge and the A-Mixer inlet was about 150 feet of the existing mixing channel. In the mixing
channel; minor amounts of additional raw/other water was added, lime was dissolved, and some ferrous iron
was oxidized. As a consequence the pH was variable depending on lime dosing. The pH in the A-Mixer was
also complicated, a steady to slightly rising pH was observed but this must be viewed in relationship to the
dissolved iron data.
Dissolved Oxygen
A plot of the DO data is shown in Figure 9. As soon as the pebble quicklime was added to the raw water
nearly all available oxygen was consumed. As the water flowed over the lime channel, oxygen was
reintroduced, but it was again consumed in the A-Mixer even though air was also being added.
Figure 9. Dissolved oxygen

50
These drops in DO concentration were attributed to ferrous iron oxidation to ferric iron (equation 1) or
alternatively, ferrous hydroxide oxidation to ferric hydroxide (equation 4). The ferrous oxidation
reaction consumed oxygen and generated acidity by the following two equations:
Fe+2
+ ¼ O2 + H+ → Fe
+3 + ½ H2O (2)
When the ferric iron precipitated, three moles of acidity were generated for each mole of iron. This
equation will be useful when we consider iron precipitation in the A-Mixer.
Fe+3
+ 3H2O → Fe(OH)3 + 3H+
(3)
The net reaction is that two moles of acidity were created for each mole of iron oxidized and precipitated.
This oxidation reaction was pH limited and was only expected to be significant above a pH of 7.
A second reaction may also be occurring. Ferrous hydroxide also known as green rust has been observed in
all parts of the semi-active treatment system. This ferrous hydroxide can be converted to Ferric hydroxide
without the generation of acidity.
Fe(OH)2 + ½ H2O + ¼ O2 → Fe(OH)3 (4)
In this case the addition of oxygen was the only requirement as all of the other reactants were present.
At pH lower than 7, this was expected to be the dominant reaction in the A-Mixer.
Alkalinity
Figure 10 shows the alkalinity measured in the field for the treatment system. As expected, alkalinity
rose as the pebble quicklime was added in the MixWell. The alkalinity then decreased in the lime
channel as oxygen reacted to convert ferrous iron into ferric hydroxide. Alkalinity was again given a
slight boost in the A-Mixer despite the introduction of air in the system.
Figure 10. Manor field alkalinity.

51
Dissolved Iron
Samples for dissolved iron were taken at each of the four sampling locations. These samples were
allowed to sit for 10 minutes while the floc settled, then the supernatant was field filtered using a 0.45-
micron filter. Figure11 shows a significant decrease in dissolved iron as the water traversed the
treatment system.
Figure11. Dissolved Iron in the Manor treatment system.
Dissolved iron concentrations within the A-Mixer dropped on two dates, 1/16/12 and 1/24/12, but were
stable on the other two dates when there was no change in dissolved iron concentration. This variation
was correlated with the pH of the A-Mixer inlet. The pH was between 6.8 and 7.0 on the days that
showed a decrease in dissolved iron. The pH was below 6.8 on the days that dissolved iron remained
unchanged.
Figure 12. Calcium and Sulfate concentrations.

52
Sulfate & Calcium
Sulfate concentrations in the raw water ranged from 1095 to 1192 mg/L and the dissolved calcium
values ranged from 134 to 159 mg/L. Figure 12 is a plot of the Sulfate and Calcium data across the
treatment system. Note that the calcium increase resulting from the MixWell corresponded to a Sulfate
decrease at the same time. This suggested gypsum precipitation in the MixWell. There was little
consistent change in these dissolved constituents throughout the rest of the treatment system.
Discussion
It is clear from Figures 8, 10, and 12 that the MixWell was doing the bulk of the pebble quicklime
dissolution, and that gypsum precipitation was occurring in the MixWell. On January 6, the MixWell
contributed 75 percent of the calcium added during the treatment process.
Efforts to use calcium to measure system performance of the A-Mixer were frustrated by spatial,
temporal, and possibly gypsum and calcite variations across the site. As a consequence, on one sampling
trip the calcium increased in the A-Mixer and on three occasions the calcium level decreased. This
decrease occurred even though alkalinity increased.
Figure 13 shows a picture of the raw lime and Figure 14 shows the material taken from the bottom of the
MixWell (MixWell Sludge). Note the percentage of “dark matter” or grit concentration relative to the
white calcium oxide. These heaver grit particles can help with the mechanical degradation of the pebble
quicklime, but at some point the grit must be drained from the system when it becomes excessive. Note
also the rounded surface of the pebble quicklime (lower left). This rounding can be from abrasion or
chemical dissolution of the particle surface. The pebbles on the lower right also show the effects of
abrasion and include gypsum pebbles.
Note the black particles that are present in the two effluent samples in Figures 15 & 16. These particles
are the inert components of the pebble quicklime product. Manufacturer-provided data indicate that the
pebble quicklime product has a calcium oxide content of 94.4 percent and a lime index of 92.3 percent.
This indicates that about six percent of the product is grit. As the lime dissolves, the percentage of grit
in the remaining particles increases.

53
Figure 13. Raw Quicklime. Figure 14. MixWell Sludge.
Figure 15. MixWell Discharge. Figure 16. A-Mixer discharge.
The MixWell and A-Mixer discharges were wet sieved. This limited the particle size that could be
captured to screens that were not blinded by the ferrous floc (+ number 80 screen). In addition, the 12-
inch sieves were not large enough to capture the entire flow; consequently, a mass flow rate was not
possible. Because of this, we did not compare the size of the piles in Figures 15 and 16. Figure 7
showed a particle size reduction between the MixWell discharge and the A-Mixer discharge. It is
suspected that more lime was dissolved in the A-Mixer when the inlet pH was greater than 7 as the
acidity from the dissolved ferrous iron was released. This suspicion was based on the drop in dissolved
iron that occurred when the pH was greater than 7, combined with an increase in pH at the same time.
Figure 17 shows this relationship on the January 16 sampling date: the dissolved iron dropped from 88
to 22 mg/L while the pH rose from 7.1 to 7.38. Water with lower pH did not benefit from the dissolved
iron reduction. At the higher pH, oxygen reacted more quickly with the ferrous iron converting it to
ferric iron. This process released acidity that was neutralized by the remaining undissolved quicklime
particles being held in suspension by the A-Mixer. The net result was that when the inlet pH was
maintained at or above 7, iron oxidation in the A-Mixer occurred rapidly thereby releasing acidity into
the water. This acidity was immediately neutralized by the suspended calcium oxide particles, which led
to a higher outflow pH and a higher alkalinity.

54
Figure 17. pH compared to dissolved iron.
The proof of the technology is based on the lime utilization rate. Three approaches were taken to
establish this rate. First, the acidity of the mine water was used to calculate the amount of pebble
quicklime required to neutralize that acidity. This calculated value was then compared with the actual
amount of pebble quicklime added. On three occasions, pebble quicklime was captured from the lime
auger over a one-minute period and these samples were weighed and used to compute the lime
efficiency. On 2-21-12, the lime feed was not captured. Instead, the lime delivered per revolution on the
prior sampling was used to calculate the lime added for this date. Consequently it is not known if the
lime dosage on this date was an accurate reflection of the actual lime dosage. The lime dose on this date
was further complicated by the system being down for several days prior to the sampling event. It is
believed that the operator was overdosing in an effort to raise the pH in the settling ponds. The lime
efficiency in excess of 100 percent may be due to higher quality pebble quicklime being delivered than
was reported on the lime analysis, or it could represent some amount of under treatment in the system.
These data are shown in Figure 18. Also in Figure 18 is a plot of the lime utilization rate based on the
stoichiometric amount of calcium needed to treat the mine water. This approach is confounded by
gypsum and possibly calcite formation within the system. The formation of gypsum or calcium, if taken
into account, would increase the reported lime utilization rate.

55
Figure 18. Lime Utilization based on initial acidity and stoichiometric calcium.
Figure 19. Lime Utilization at Manor before and after MixWell and A-Mixer
construction.
The ultimate test of lime utilization is a comparison of the lime usage before and after the MixWell and
A-Mixer retrofit. Plant personnel have adjusted the lime delivery of the plant so that their discharge
criteria were maintained both before and after the plant retrofit. Using the plant log book, the flow rate
and the Aquafix revolutions per minute (RPM) were recorded. The RPM data were divided by the flow
data to yield a metric of RPM/gal. This metric was then plotted against time and graphed in Figure 19.
The before and after data show a definitive improvement in the lime required. The average RPM/gal
before the retrofit was 0.1255, while after the retrofit the RPM/gal was 0.0719. This indicates that the
new plant was operating on 43 percent of the lime that was required prior to the rebuild. Before the
retrofit, annual lime cost was $30,000. The indicated savings in lime cost is $17,100 per year. This did
not include the cost of dredging and disposal of unused lime in the first settlement pond.

56
Conclusions
Passive mixing technology can have a very significant improvement in lime utilization where pebble
lime is the source of the alkalinity.
The MixWell technology can be very effective at dissolving pebble quicklime and can reduce the
particle size of its effluent.
The A-Mixer, if operated at pH 7 or above, can advance the oxidation of ferrous iron while maintaining
pH across the system.
Acknowledgement
The authors gratefully acknowledge the Pennsylvania DEP, especially Mike Smith, Mario Carrrello and
Eric Rosengrant for supporting our new technology. In particular we offer our thanks to Bill Gongaware
and his crew, Kreug and Jeremy, who let us play with their water and supported our efforts at every turn.
Thanks guys!
References
Aube, B. 2005, The Science of Treating Acid Mine Drainage and Smelter Effluents. Retrieved March 7,
2012, http://www.robertsongeoconsultants.com/rgc_enviromine/publicat/treatment%20science.pdf
Leavitt, B.R., 2011. Aeration of Mine Water Using a TROMPE: 2011 West Virginia Mine Drainage Task
Force Symposium. Morgantown, West Virginia.
Leavitt, B.R., 2010. Air Lifting Mechanisms for Oxidation in Underground Mines: 2010 West Virginia Mine
Drainage Task Force Symposium. Morgantown, West Virginia.
Skousen, J.G, & Ziemkiewicz P.F. “Acid Mine Drainage Control & Treatment” 1995, West Virginia
University and the National Mine Land Reclamation Center.
57
ENGINEERED PUMPABLE pHOAMTM
: A NEW INNOVATIVE METHOD FOR
MITIGATING ARD1
James Gusek
2, Brian Masloff, and John Fodor
Abstract. If one can embrace the medical analogue, much of the mining industry
currently suffers from a massive bacterial infection. When pyrite-bearing or sulfide-
bearing rock formations, tailings, or mine wastes are infected by Acidithiobacillus ferro-
oxidans, the likelihood of forming acid rock drainage (ARD) is almost guaranteed. The
“pharmacy” of antibiotics available is extensive, ranging from solid alkaline amendments
like limestone to liquid “medicines” such as sodium lauryl sulfate, sodium thiocyanate,
waste milk, and bipolar lipids. Unfortunately, the “geo-medical” teams of geochemists,
microbiologists, engineers, and mine managers lack the tools to surgically apply these
active ingredients where they are needed most with a minimum of waste. Distribution of
fine grained limestone on the surface of an acidic mine waste dump is analogous to
applying a bandage soaked in antacid to treat an upset stomach. The implementation of
up-to-date best management practices has not healed the patient; an equivalent
combination of hypodermic needle, cyber knife, and arthroscopic probe is clearly needed.
Using an engineered, flow-able or pumpable foam or pHoamTM
as the medicinally
analogous “dextrose delivery solution” for solid and/or liquid “geo-antibiotics”, the
authors have combined off-the-shelf technologies that have been previously applied in
solving geotechnical problems in the mining industry. A patent for the innovative
process is pending. This paper discusses method concepts and the advantages it could
provide over conventional BMPs.
Preliminary laboratory test results suggest that the delivery of solid and liquid materials
into porous, unsaturated rock can provide a variety of ARD-suppressing coatings.
The timing of ARD-suppressing materials’ application to ARD-prone wastes in the
mining and processing cycle may govern whether these materials behave as a post-
infection medicine or as a vaccine that prevents infection altogether. Field demonstration
sites are being sought.
Additional Key Words: acid rock drainage suppression, heavy metals, mining influenced water
__________________ 1 For presentation at the 2012 Annual Meeting of the West Virginia Surface Mine Drainage Task Force,
Morgantown, WV. 2James Gusek is a senior consultant with Golder Associates Inc., Lakewood, CO 80228, [email protected]
(corresponding author). Brian Masloff and John Fodor are engineers with Cellular Concrete Solutions,
LLC, Golden, CO 80401

58
Introduction
Water pollution associated with mining activity has been a problem for societies probably since pre-
historic times although it may have not been recognized at the time. The pioneering hard rock miners in
the Colorado Rockies recognized the impacts from poor water quality; the water entering some of their
underground workings was so metal-laden and acidic that they could not use it to feed their boilers. In
some mines, acid water dissolved iron rails, plating out dissolved copper in the process. In the 16th
century, the author G. Agricola in his book De Re Metallica noted that water contaminated by mining
activities "poisons the brooks and streams, and either destroys the fish or drives them away”.
Modern mining activities, both coal and hard rock can generate much the same problem, but with the
large volumes of ore and waste rock being excavated and moved, the impacts to the environment are
magnified a billion-fold. It is commonly referred to as acid rock drainage or ARD. The sources of
water pollution/ARD include draining adits and tunnels, leachate from waste rock and tailings/coal
refuse facilities, and water accumulating in or discharging from abandoned pits. Even the construction
of highways in geological terrain containing pollution generating rocks has been identified as a problem.
The Tennessee Department of Transportation commissioned a guideline document which focused on
pollution prevention and ARD mitigation best management practices (Gusek et al., 2008).
ARD Formation
The formation of ARD is a natural process. In the presence of air, water, and bacteria, sulfide minerals
such as pyrite oxidize and produce sulfuric acid; concurrently, iron and other metals are released into the
water. The problem can be associated with both coal and hard rock operations where previously-buried
sulfide minerals are exposed to oxygen and water. The descriptions of the bio-geochemical reactions
responsible for ARD are found in many ASMR papers and will not be repeated here. However, it is
prudent to revisit the general conditions required for ARD to form.
ARD Tetrahedron Relationship
Considered simply, the elementary ingredients required for the formation of ARD are analogous to the
components needed for the burning of combustible materials. To have a fire, one must have air, heat and
a fuel source. To have ARD, one needs air, water, and a pyrite source and the bacteria to speed reactions
that would otherwise occur slowly: consider an "ARD Tetrahedron" concept (see Figure 1), with each
requirement positioned at a vertex. If any of the primary ingredients are missing, isolated, or chemically
neutralized, fire/ARD will not form. The oxidation of pyrite is an exothermic reaction very similar to
conventional combustion. In some extreme cases pyritic mine wastes have actually spontaneously
ignited (Li and Parr, 1926), resulting in localized sulfidic air pollution.
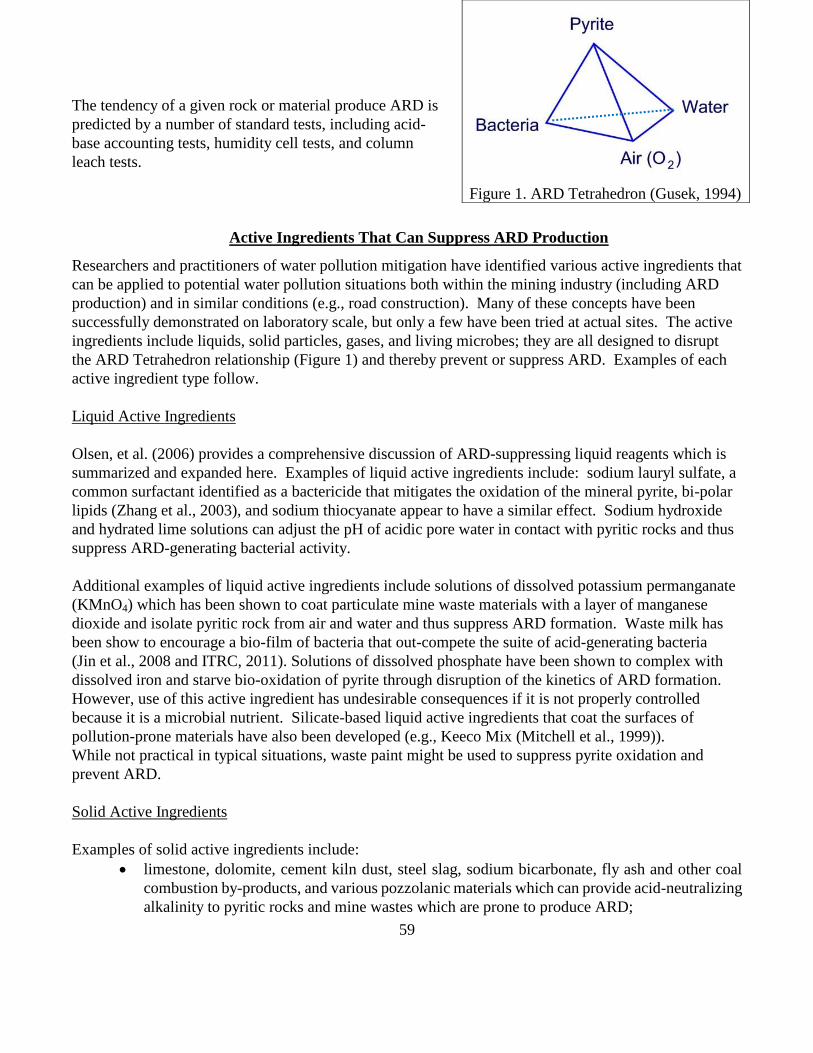
59
The tendency of a given rock or material produce ARD is
predicted by a number of standard tests, including acid-
base accounting tests, humidity cell tests, and column
leach tests.
Active Ingredients That Can Suppress ARD Production
Researchers and practitioners of water pollution mitigation have identified various active ingredients that
can be applied to potential water pollution situations both within the mining industry (including ARD
production) and in similar conditions (e.g., road construction). Many of these concepts have been
successfully demonstrated on laboratory scale, but only a few have been tried at actual sites. The active
ingredients include liquids, solid particles, gases, and living microbes; they are all designed to disrupt
the ARD Tetrahedron relationship (Figure 1) and thereby prevent or suppress ARD. Examples of each
active ingredient type follow.
Liquid Active Ingredients
Olsen, et al. (2006) provides a comprehensive discussion of ARD-suppressing liquid reagents which is
summarized and expanded here. Examples of liquid active ingredients include: sodium lauryl sulfate, a
common surfactant identified as a bactericide that mitigates the oxidation of the mineral pyrite, bi-polar
lipids (Zhang et al., 2003), and sodium thiocyanate appear to have a similar effect. Sodium hydroxide
and hydrated lime solutions can adjust the pH of acidic pore water in contact with pyritic rocks and thus
suppress ARD-generating bacterial activity.
Additional examples of liquid active ingredients include solutions of dissolved potassium permanganate
(KMnO4) which has been shown to coat particulate mine waste materials with a layer of manganese
dioxide and isolate pyritic rock from air and water and thus suppress ARD formation. Waste milk has
been show to encourage a bio-film of bacteria that out-compete the suite of acid-generating bacteria
(Jin et al., 2008 and ITRC, 2011). Solutions of dissolved phosphate have been shown to complex with
dissolved iron and starve bio-oxidation of pyrite through disruption of the kinetics of ARD formation.
However, use of this active ingredient has undesirable consequences if it is not properly controlled
because it is a microbial nutrient. Silicate-based liquid active ingredients that coat the surfaces of
pollution-prone materials have also been developed (e.g., Keeco Mix (Mitchell et al., 1999)).
While not practical in typical situations, waste paint might be used to suppress pyrite oxidation and
prevent ARD.
Solid Active Ingredients
Examples of solid active ingredients include:
limestone, dolomite, cement kiln dust, steel slag, sodium bicarbonate, fly ash and other coal
combustion by-products, and various pozzolanic materials which can provide acid-neutralizing
alkalinity to pyritic rocks and mine wastes which are prone to produce ARD;
Figure 1. ARD Tetrahedron (Gusek, 1994)

60
slow-release bactericides (Rastogi et al., 1986) such as the commercial product ProMacTM
which
can suppress pyrite oxidizing bacteria;
organic materials such as cellulose, wood, paper, bio-solids, animal and vegetable protein whose
decay can create conditions that suppress pyrite oxidation and ARD; and
processed peat, natural peat, zeolite minerals, manganese oxides, and similar man-made products
such as resins known to adsorb heavy metals.
Additional examples of solid active ingredients include: zero valent iron, nano-scale iron, powdered
iron oxy-hydroxides, and powdered copper. These materials have the ability to chemically alter
dissolved pollutants and as a result, detoxify them.
Gaseous Active Ingredients
Examples of gaseous active ingredients include: carbon dioxide or nitrogen which can displace oxygen
in the pore spaces in unsaturated, particulate mine wastes and thereby suppress ARD production; and
hydrogen sulfide which also may have a similar effect as well as immobilizing heavy metals that may be
in solutions in contact with particulate mine wastes. While using gaseous ARD suppressing materials is
theoretically possible, their use to date has been minimal. Oxygen depletion through encapsulation or
total, permanent immersion in weakly oxygenated water is a passive approach to ARD management.
Microbial Active Ingredients
Examples of microbial active ingredients include common materials that typically include bacterial
suites including the bacteria Desulfovibrio, which under certain conditions and in the presence of other
cellulose-degrading bacteria can out-compete Acidithiobacillus ferro-oxidans and thus suppress ARD
(Zhang et al., 2003). Common microbial source active ingredients may include municipal sewage bio-
solids, composted animal manure, and organic soils harvested from natural wetlands.
Table 1 below summarizes some common ARD-suppressing materials available and what vertex of the
ARD Tetrahedron they are known to suppress, but delivering these to large volumes of materials or areas
has been problematic, especially if the materials are deposited or encountered in an unsaturated
condition.

61
Table 1 – Summary of Materials Known to Suppress ARD
Basic ARD
Ingredient The “Geo-Medicines” Anticipated ARD-Suppressing Reaction
Air
Fresh or composted wood chips,
sawdust, or cellulose
Consumes oxygen by organic decay Mushroom compost
Animal & vegetable protein
Municipal sewage bio-solids
Paper products
Nitrogen Displaces air/oxygen
Carbon dioxide
Water
Potassium permanganate solutions
Coats reactive surfaces to render them
impermeable
Keeco Mix (micro-silicate)
Bentonite clay
Paint (latex or oil-based) or other
water-resistant coating material
Sulfides
Sulfides
(Cont).
ChitoremTM
Add organic matter and alkalinity
Limestone
Neutralize acidity/add alkalinity
Dolomite
Kiln dust
Sodium bicarbonate
Fly ash
Flue gas desulfurization
Pozzolanic materials (cement)
Steel slag
Lime solution
Sodium hydroxide solution
Ammonia solution
Bacteria
Bactericide
Sodium lauryl sulfate (aka shampoo)
(Kleinmann, 1982)
Alkyl-benzene sulfonate (aka laundry
detergent)
Milk
Bi-polar lipids
Potassium Humate (Leonardite)
Sodium thiocyanate solution
Phosphate solution
Composted animal manure Inoculate ARD-prone rock with
beneficial bacteria (Jin et al., 2008) Municipal sewage bio-solids
Natural soils from wetlands

62
Limitations of Conventional Active Ingredient Application
Many of these pollution mitigation strategies and methods were patented but have not been widely
applied despite their potential to solve a specific ARD problem. The primary reason for this aspect
relates to the inability of practitioners to feasibly deliver and apply active ingredients to large volumes of
potentially-ARD-generating materials. When active ingredients are carried in a conventional suspension
or slurry (for solids) or a conventional solution (for liquids), there is much waste and little if any
hydrologic control. This is especially true when the liquids are injected into permeable materials such as
a pile of mine waste rock or coarse coal refuse.
For example, the injected fluids are drawn by gravity toward the bottom of the pile with little horizontal
dispersion; multiple injection boreholes with close spacing may be required to effectively deliver the
active ingredients to the waste horizon target. Excess fluids drain out the bottom of the pile and may be
difficult or impossible to capture and recycle. However, the process has been demonstrated (see Fisher
Coal Mine below).
Case Studies of Conventional Active Ingredient Application
1996 – Fisher Coal Mine, PA
A pumped injection technique for suppressing ARD is well-documented in Plocus and Rastogi (1997)
which required four deep injection wells [16 m (53 ft) deep] and 25 shallow injection wells 3 m (10 feet)
deep to treat only about 1,200 m2 (0.3 acres) of a coal mine waste pile in Pennsylvania. In order to
implement their injection plan, pumping equipment with a pressure capacity of 20.7 megapascals (3,000
psi) was required. The active ingredients they used were a 20% solution of sodium hydroxide followed
by a 2% solution of sodium lauryl sulfate, injected sequentially. While the process worked and the
treatment appears to still be working 16 years later (Plocus, 2011), the technology was not considered
practical.
1996 – Fran Coal Mine, PA
Schueck et al. (1996) reported on treating pods of pyritic material in a backfilled surface coal
mine pit with FBC ash grout in three ways:
1) injection grouting only,
2) capping only, and
3) both capping and grout injection.
Based on the water chemistry results from monitoring wells, Option 3 worked the best followed
by Option 1. Schueck et al. (1996) reported:
The inability to control final grout placement is a major drawback of the injection
process… Because the grout is a viscous fluid, it will tend to flow into high
permeability zones when pumped into spoil under pressure. If the permeability within
the [pyritic rock] pod is low, the injected grout may flow away from the pod instead
of filling the voids within the pod as intended or else the well will accept very little
grout. When this happens, AMD abatement will be limited or will not occur at all.

63
2003 - Neves Corvo Copper-Tin Mine, Portugal
Verburg et al. (2003) reported the results of a 30-week monitoring humidity test cells filled with pyritic
mill tailing paste to evaluate various ARD-prevention strategies. They found that “the bactericide-
amended samples demonstrate consistently higher values for paste pH and lower values for SC [specific
conductance] than the other samples, both in the short term and long term”. The results further
demonstrated that the application of the bactericide had a beneficial effect (i.e., preventing growth and
bacterial activity) during all stages of acid generation at this site. The effects of the bactericide
application persisted throughout the 30-week monitoring period. Contrary to the findings of Plocus
described above, the authors believed that “under operational or post-closure conditions, periodic or
continuous application of a surfactant-type bactericide is generally required to maintain effectiveness”.
This belief may be related to the perceived difficulty in evenly applying a bactericide to tailings in an
operational environment.
2006 – Sequatchie Valley Coal Mine, TN
An injection/treatment process similar to the one described by Plocus and Rastogi was implemented at
the Sequatchie Valley coal mine in Tennessee. In this case, the Western Research Institute (Jin et al.,
2008 and ITRC, 2011) injected a mixture of undiluted waste/returned milk and a bacterial inoculum
(biosolids) into mine waste that had been reclaimed and revegetated. The goal of the process was to
establish a bio-film of bacteria (>70 species) on the pyritic waste that would out-compete acido-
thiobacillus ferro-oxidans and thereby prevent ARD. A brief description of the multiple event injection
process follows (Jin et al., 2008).
A total of 3,000 gal of ES [biosolids] and 9,000 gallons of returned milk were injected from
day 35 to 116 of the study and an additional 9,000 gal of returned milk was injected
approximately 1 year later from day 430 to 511. Returned milk was injected as soon as it was
collected from stores by the dairy so milk was not stockpiled and injected at one time but
over a few months.
The technology was implemented in a 4 ha (10 acre) area exhibiting a seepage of about 0.12 m3/min. (30
gpm). Ground water upstream of the test plot exhibits typical ARD characteristics, depressed pH (5.5 to
6.0 s.u.); the seepage downstream of the test plot exhibits a pH of 6.8 to 8 about four years after the
initial injection event (ITRC, 2011). This promising process was recently patented (Jin et al., 2012).
A Revised Theory of Bactericide Field Effectiveness
It has been long held that highly-soluble bactericides offer only a temporary ARD mitigating benefit and
lose their effectiveness because they are washed away by percolating rain and snowmelt (Verburg et al.,
2003). How then, does one explain the 16-year endurance of the bactericide application at the Fisher
coal mine by Plocus and Rastogi? A revised theory of field effectiveness of bactericides is proposed:
early bactericide applications were successful but only temporary because the acidophilic community
may have been decimated and pockets of acido-thiobacillus ferro-oxidans survived in rock particle
crevices to provide the inoculum for re-infection.

64
To counter this phenomenon, slow-release commercial bactericides like ProMacTM
were developed. As
the bactericide component, sodium lauryl sulfate, was eluted from the ProMacTM
by rainfall events and
the spring freshet, it was thought that the "I-V" drip delivery would keep the acidophilic community in
check until the positive biogeochemical benefits of surface revegetation efforts kicked in. This may
have worked in many cases which might be a future investigation topic for others. However, long-term
documented effectiveness of bactericide application to suppress ARD was never proven; the mining
community and researchers addressing the ARD problem found answers in abiotic acid-base accounting
ratios and numerical thresholds. Indeed, there appear to be only two case studies providing evidence that
long term application of bactericides or similar anti-bacterial measures work: the aforementioned Fisher
and Sequatchie coal mines. What could have possibly made them successful?
Despite the completely different ARD-suppressing reagents involved (i.e., bactericides and waste dairy
products), the two factors for success appear to be:
1) temporary but complete saturation of the geophysically-targeted acidic mine waste with the
bactericide solutions, and/or
2) Multiple injections of ARD-suppressing reagents.
Bactericides and Dairy Products are Colloidal Suspensions
It is interesting to note that both anti-bacterial surfactants (e.g., sodium lauryl sulfate) and milk are
classified as suspensions of colloids, not true solutions. Thus, the active ingredients within the liquid
phase form “micelles” or nano-scale clusters of molecules (Zsigmondy, 1917 and Shaw, 1980). This
phenomenon can be visually observed as the “cloudiness” of colloidal fluids compared to the clarity of
true solutions. Unfortunately, this clustering phenomenon could theoretically affect the biological
toxicity of the treatment if the injected fluids were diluted (as in the case of the Fisher Mine). The
micelles of reagents would be distributed like raisins in a pie rather than uniformly dispersed. An ARD-
suppressing reagent delivery method that avoids this restriction could be quite beneficial.
Foam: An Innovative Active Ingredient Delivery Method
Foam is a two-phase fluid consisting of a gas component surrounded by a thin fluid phase that is
developed with a soluble surfactant or soap. In senescence, the interiors of the colloidal micelles
previously described are filled with gas and the specific surface of active ingredient (e.g., bactericide) is
greatly increased while the amount of water required to saturate a target treatment zone are
proportionally decreased. Research efforts are underway to use this engineered material to deliver ARD-
suppressing liquid-phase active ingredients (e.g., bactericides, etc.) which can be entrained in or are a
part of the foam structure. In addition, solid phase ARD-suppressing ingredients such as limestone,
lime, steel slag, biosolids, or cement kiln dust can be entrained and suspended in the foam structure.
Such mixtures comprised of ARD-suppressing components are hereafter referred to as pHoamTM
to
distinguish it from common foams used in other industrial applications, including fire-fighting.
The proposed pHoamTM
method solves the active ingredient delivery problem by increasing the mobility
and surface area of solutions or mixtures of active ingredients without sacrificing hydrologic control.
Active ingredients suspended or contained in a pHoamTM
of pre-determined "stability”, can flow omni-

65
directionally or bi-directionally from a single injection point as an advancing front. The density of the
pHoamTM
composites will typically be less than 320 kg/m3, which should lower injection pressures and
increase the injection duration and coverage from each injection point.
pHoamTM
Stability
The term “stability” used here refers to the general characteristics of the mixture with regard to longevity
of the foam structure, its density, water content, and fluidity. For example, a pHoamTM
could be
designed to be thick enough to resist being drawn by gravity to the bottom of a given zone being treated
and would advance in three dimensions, as a bulb. It could also completely fill an underground mine
adit or coal mine entry. It would be expected to penetrate any roof falls as long as the collapsed material
was permeable.
Alternatively, the pHoamTM
mixture could be designed with a high “slump” (using a term familiar to
those dealing with concrete designs) that would fan out generally in two dimensions, following a
horizontal plane as in the case of covering a relatively flat tailings surface or following the floor of an
open pit or pit bench or mine adit/entry.
pHoamTM
longevity can be manipulated to a desired time required for maximum treatment or travel
through the material treated. For example, if a pHoamTM
were to be applied to acidic mine waste on a
truck load by truck load basis, the pHoamTM
structure might only need to persist for an hour or less, as
long as the pHoamTM
permeates the entire load. Conversely, pHoamTM
injected into a waste rock dump
might be designed to persist for several days to allow maximum penetration.
The water content of pHoamTM
can be adjusted to produce a relatively dry pHoamTM
which barely
changes the moisture content of the rock mass being treated. When the bubble structure collapses, the
entrained moisture will coat the nearby rock particles. If the rock mass has a relatively high field
capacity, a soil characteristic, compared to the moisture content of the pHoamTM
, little if any leakage
from the treated mass should result. The active ingredients, both liquid and solid, should remain within
the waste mass and not flow or rinse out.
Conversely, a high water content pHoamTM
might be used to rinse out undesirable target contaminants
from the mine waste. For example, a high water content pHoamTM
could rinse out retained nitrate
contamination derived from blasting agent residue in a waste rock dump that would otherwise require an
extended period to be flushed out by pulses of infiltration of rain or snow melt.
The Physics of pHoamTM
As discussed by Blauer and Kohlhass (1974):
Generally, foams are dispersions of a relatively large volume of gas in a relatively small
volume of liquid. When the volume of liquid is considerably greater than that of gas, the gas
bubbles are, as a rule, spherical and their mutual interaction is weak. These systems are
known as "gas emulsions." In a true foam, the bubbles are so crowded that their shape is

66
deformed, usually polyhedral.
Since the pHoamTM
is mostly comprised of a gas phase with very little liquid (e.g. foam might be
formulated to be 10% water and 90% gas), the liquid is more likely to be retained as a coating on the
rock particles when the foam structure de-stabilizes. If a solid phase is present in the pHoamTM
, it is
more likely to be deposited on the surfaces of the mine waste instead of being carried away by gravity
drainage in a conventional slurry suspension. Polymer additives can also be used in conjunction with
pHoamTM
composites. The polymer can bond the active ingredients to the mine waste.
Also, as the solid phase is a relatively small volumetric component of the pHoamTM
mass, it is difficult
to completely fill the pore spaces between the permeable mine waste particles. This is a desirable
condition, as it allows multiple events of active ingredient injection; i.e., a “booster shot” of antibiotics
is required if the active ingredients are consumed and require replenishment.
The particle size distribution of the mine waste will certainly influence pHoamTM
designs. Consider the
heterotrophic nature of a typical mine waste dump (Figure 2). Due to the natural particle size
segregation associated with end-dumping from trucks over the edge, a zone of larger waste particles will
be typically found at the toe of each lift. These high-permeability zones can act as preferred pathways
for air and water which will promote ARD formation.
Injected pHoamTM
would also follow these preferred
pathways, depositing ARD-suppressing reagents where
they could provide the highest benefit. Fine-grained
zones adjacent to coarser zones would tend to “wick”
the liquid phase of active ingredients into the matrix
and retain it with capillary force. The wicking could be
facilitated by the decreases in surface tension provided
by the surfactant component of the pHoamTM
. It is
likely that solid phase ARD-suppressing reagents would
be deposited adjacent to the finer-grained zones as a
“rind” of beneficial treatment.
The “Cyber-Knife” Effect
It is well known that pyrite oxidation is exothermic. This reaction can result in elevated temperatures in
mine waste and in the worst situation, actual combustion. Common sense suggests that when foam or
pHoamTM
approaches materials with elevated temperatures, the foam/ pHoamTM
bubble structure will
collapse as the liquid component evaporates. This feature could potentially give pHoamTM
a “heat-
seeking missile” capability that could automatically deliver more ARD-suppressing active ingredients to
a mine waste site in the zones where it is needed the most. Hot zones in the mine waste would become
“sinks” for pHoamTM
bubble disintegration and resultant preferential deposition of more active
ingredients compared to cooler zones nearby. Adopting the medical analogy, this is similar to a cyber-
knife application to a specific diseased target organ without the need for an equivalent MRI image.
Figure 2. Injection of pHoam
TM into a Mine
Waste Dump (after G. W. Wilson 2008)
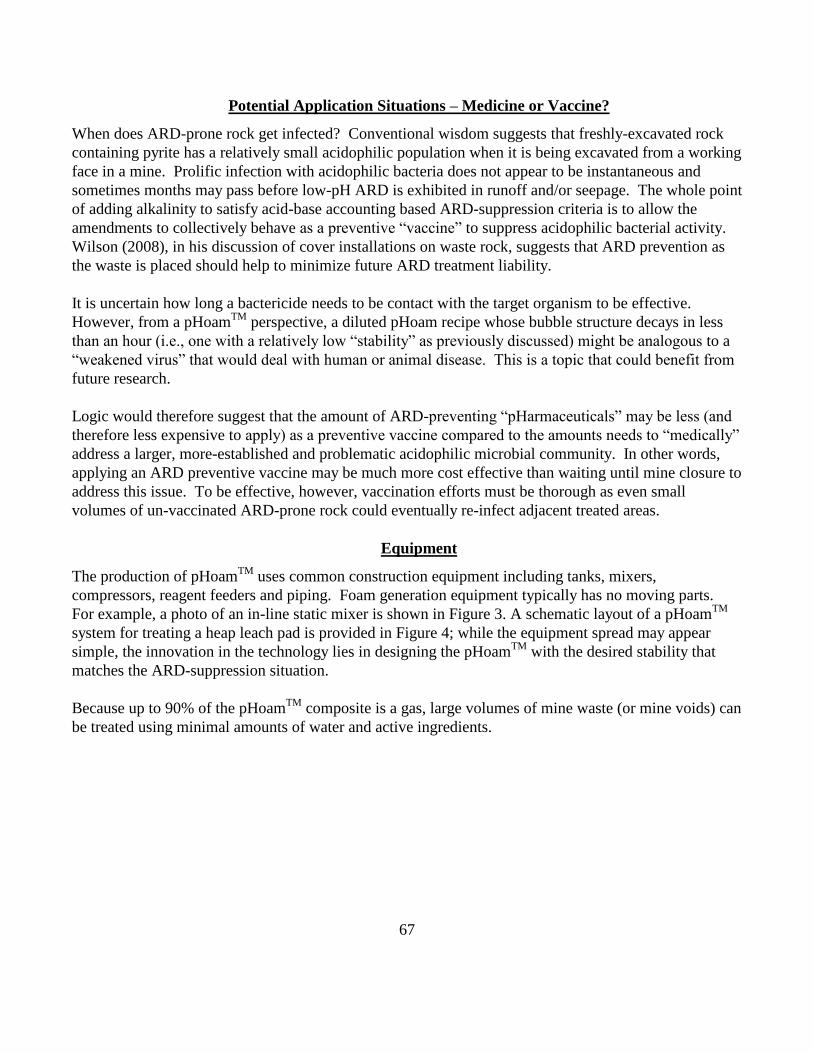
67
Potential Application Situations – Medicine or Vaccine?
When does ARD-prone rock get infected? Conventional wisdom suggests that freshly-excavated rock
containing pyrite has a relatively small acidophilic population when it is being excavated from a working
face in a mine. Prolific infection with acidophilic bacteria does not appear to be instantaneous and
sometimes months may pass before low-pH ARD is exhibited in runoff and/or seepage. The whole point
of adding alkalinity to satisfy acid-base accounting based ARD-suppression criteria is to allow the
amendments to collectively behave as a preventive “vaccine” to suppress acidophilic bacterial activity.
Wilson (2008), in his discussion of cover installations on waste rock, suggests that ARD prevention as
the waste is placed should help to minimize future ARD treatment liability.
It is uncertain how long a bactericide needs to be contact with the target organism to be effective.
However, from a pHoamTM
perspective, a diluted pHoam recipe whose bubble structure decays in less
than an hour (i.e., one with a relatively low “stability” as previously discussed) might be analogous to a
“weakened virus” that would deal with human or animal disease. This is a topic that could benefit from
future research.
Logic would therefore suggest that the amount of ARD-preventing “pHarmaceuticals” may be less (and
therefore less expensive to apply) as a preventive vaccine compared to the amounts needs to “medically”
address a larger, more-established and problematic acidophilic microbial community. In other words,
applying an ARD preventive vaccine may be much more cost effective than waiting until mine closure to
address this issue. To be effective, however, vaccination efforts must be thorough as even small
volumes of un-vaccinated ARD-prone rock could eventually re-infect adjacent treated areas.
Equipment
The production of pHoamTM
uses common construction equipment including tanks, mixers,
compressors, reagent feeders and piping. Foam generation equipment typically has no moving parts.
For example, a photo of an in-line static mixer is shown in Figure 3. A schematic layout of a pHoamTM
system for treating a heap leach pad is provided in Figure 4; while the equipment spread may appear
simple, the innovation in the technology lies in designing the pHoamTM
with the desired stability that
matches the ARD-suppression situation.
Because up to 90% of the pHoamTM
composite is a gas, large volumes of mine waste (or mine voids) can
be treated using minimal amounts of water and active ingredients.
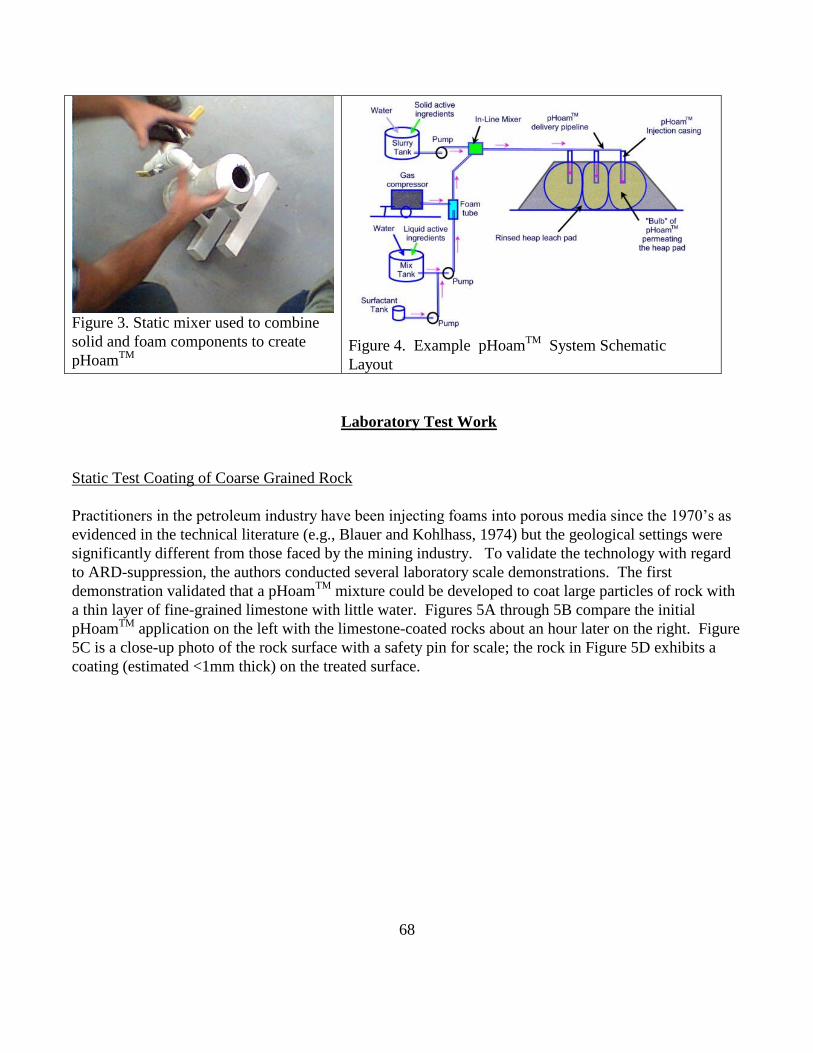
68
Laboratory Test Work
Static Test Coating of Coarse Grained Rock
Practitioners in the petroleum industry have been injecting foams into porous media since the 1970’s as
evidenced in the technical literature (e.g., Blauer and Kohlhass, 1974) but the geological settings were
significantly different from those faced by the mining industry. To validate the technology with regard
to ARD-suppression, the authors conducted several laboratory scale demonstrations. The first
demonstration validated that a pHoamTM
mixture could be developed to coat large particles of rock with
a thin layer of fine-grained limestone with little water. Figures 5A through 5B compare the initial
pHoamTM
application on the left with the limestone-coated rocks about an hour later on the right. Figure
5C is a close-up photo of the rock surface with a safety pin for scale; the rock in Figure 5D exhibits a
coating (estimated <1mm thick) on the treated surface.
Figure 3. Static mixer used to combine
solid and foam components to create
pHoamTM
Figure 4. Example pHoam
TM System Schematic
Layout
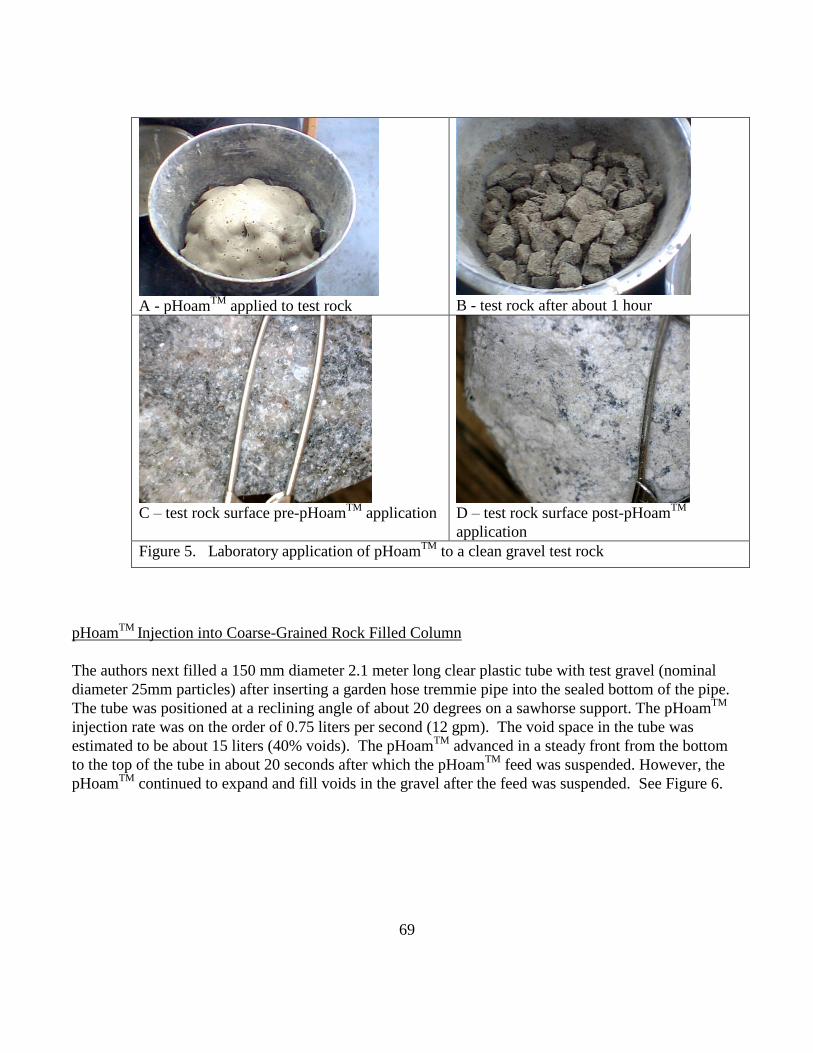
69
pHoamTM
Injection into Coarse-Grained Rock Filled Column
The authors next filled a 150 mm diameter 2.1 meter long clear plastic tube with test gravel (nominal
diameter 25mm particles) after inserting a garden hose tremmie pipe into the sealed bottom of the pipe.
The tube was positioned at a reclining angle of about 20 degrees on a sawhorse support. The pHoamTM
injection rate was on the order of 0.75 liters per second (12 gpm). The void space in the tube was
estimated to be about 15 liters (40% voids). The pHoamTM
advanced in a steady front from the bottom
to the top of the tube in about 20 seconds after which the pHoamTM
feed was suspended. However, the
pHoamTM
continued to expand and fill voids in the gravel after the feed was suspended. See Figure 6.
A - pHoam
TM applied to test rock
B - test rock after about 1 hour
C – test rock surface pre-pHoam
TM application
D – test rock surface post-pHoam
TM
application
Figure 5. Laboratory application of pHoamTM
to a clean gravel test rock
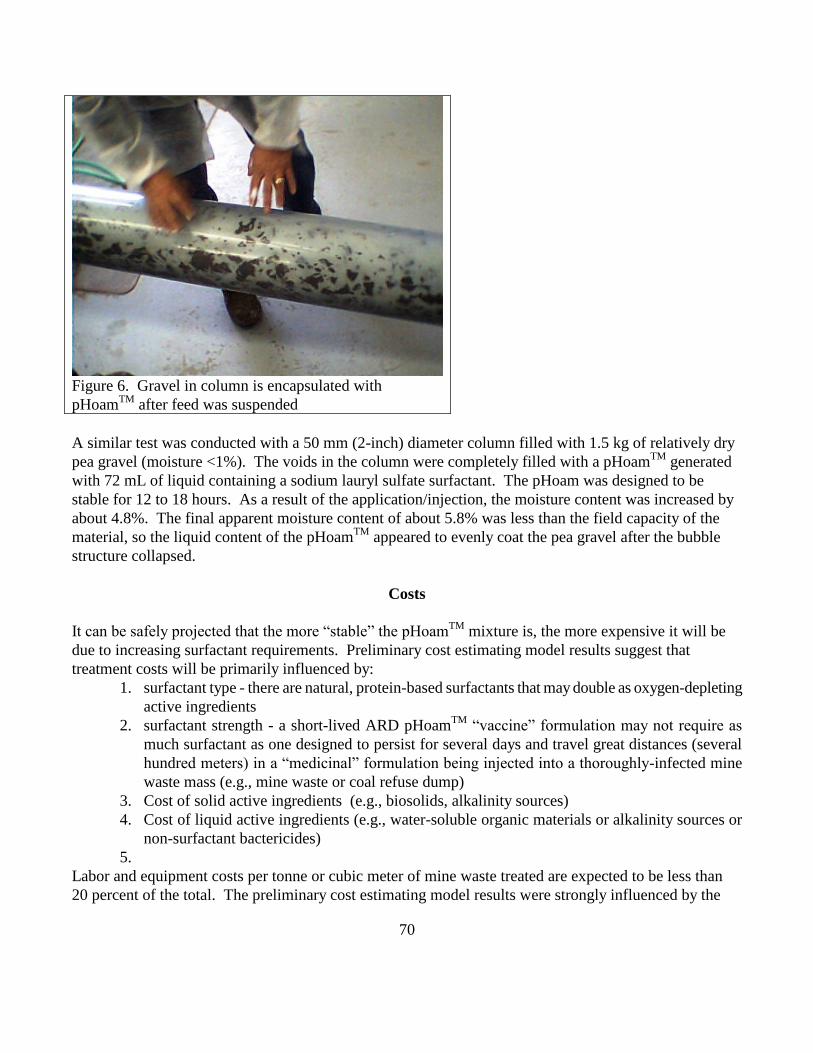
70
Figure 6. Gravel in column is encapsulated with
pHoamTM
after feed was suspended
A similar test was conducted with a 50 mm (2-inch) diameter column filled with 1.5 kg of relatively dry
pea gravel (moisture <1%). The voids in the column were completely filled with a pHoamTM
generated
with 72 mL of liquid containing a sodium lauryl sulfate surfactant. The pHoam was designed to be
stable for 12 to 18 hours. As a result of the application/injection, the moisture content was increased by
about 4.8%. The final apparent moisture content of about 5.8% was less than the field capacity of the
material, so the liquid content of the pHoamTM
appeared to evenly coat the pea gravel after the bubble
structure collapsed.
Costs
It can be safely projected that the more “stable” the pHoamTM
mixture is, the more expensive it will be
due to increasing surfactant requirements. Preliminary cost estimating model results suggest that
treatment costs will be primarily influenced by:
1. surfactant type - there are natural, protein-based surfactants that may double as oxygen-depleting
active ingredients
2. surfactant strength - a short-lived ARD pHoamTM
“vaccine” formulation may not require as
much surfactant as one designed to persist for several days and travel great distances (several
hundred meters) in a “medicinal” formulation being injected into a thoroughly-infected mine
waste mass (e.g., mine waste or coal refuse dump)
3. Cost of solid active ingredients (e.g., biosolids, alkalinity sources)
4. Cost of liquid active ingredients (e.g., water-soluble organic materials or alkalinity sources or
non-surfactant bactericides)
5.
Labor and equipment costs per tonne or cubic meter of mine waste treated are expected to be less than
20 percent of the total. The preliminary cost estimating model results were strongly influenced by the

71
values assumed for the active ingredients.
For example, some municipalities currently pay over US$316 per dry tonne to dispose of biosolids
[20% solids by weight] produced from waste water treatment plants (Carollo Engineers 2008). If
biosolids, which are predominantly comprised of organic carbon, are found to be a suitable solid-phase
ARD suppressing material, and a municipality was willing to pay a mining company a fraction of its
current disposal cost, the “credit” from this income stream could significantly offset surfactant, labor and
equipment costs and final cost of ARD prevention using the pHoamTM
technology may be very low and
sustainable. In an ideal situation, the mining company (or any other public, private, and non-profit
entity) utilizing the pHoamTM
process to deliver ARD-suppressing materials that others consider a waste
might actually turn a small profit. Of course, as soon as the municipality discovers that there is a market
for their biosolids/waste material, the price may escalate. Procuring multiple sources of a given active
ARD-suppressing ingredient well in advance would be advised.
If biosolids’ application as an ARD-suppressing material is practical, why has it not already been used?
The answer, as with any other material in the “ARD pHarmacy”, is likely that a practical way of
delivering it to coat large volumes of mine waste has not been available. Perhaps this situation is no
longer true.
Summary
The pHoamTM
ARD-suppression technique is an emerging technology and the potential advantages of
treating large volumes of mine waste with little water have yet to be fully developed. The technology
could find application at both active and abandoned mines, either underground or surface, and could
address mine wastes such as tailings, waste rock and even backfill in pits that have been fully
revegetated without re-disturbance. The design of pHoamTM
applications will be site specific, and will
depend on the grain size, geochemistry, and in-place permeability of the mine waste, among other
factors. It does not appear to be appropriate for application in fully-saturated or flooded conditions
although pHoamTM
with a density heavier than water is possible.
Future Study and Technology Development
Much study remains to advance the pHoamTM
ARD-suppression technique from an emerging technology
to a best management practice. As such, the authors are seeking demonstration sites that ideally exhibit
the following conditions:
Has research funding available
Contains mine waste that is fully characterized, mapped, and is acid generating
Is an active mine site/plant with a steady, consistent stream of acid-prone waste (e.g., coarse coal
refuse or coarse tailings) that could be evaluated in test piles or lined test containers
Is relatively small in scale (0.5 to 1 hectare) (1 to 2 acres)
Is relatively accessible by conventional construction equipment
Is amenable to “dissection” after pHoamTM
application
Has documented ARD impact
Is on publicly-owned land (USFS, USBLM, USEPA Superfund)

72
Is not a part of or contingent upon ongoing litigation
To quote a Latin proverb: Nihil simul inventum est et perfectum. [Nothing is invented and perfected at
the same time.]
Literature Cited
Blauer, Roland E., and C. A. Kohlhass, 1974. "Formation Fracturing with Foam," Presented before the 49th
annual fall meeting of the Society of Petroleum Engineers of AIME held in Houston, Tex., Oct. 6-9, 1974.
Carollo Engineers, 2008. City of Riverside [CA] Wastewater Collection and Treatment Facilities Integrated
Master Plan; Volume 8: Solids Treatment and Handling; Chapter 7: Solids Disposal, Final Report, February,
2008.
Gusek, J.J., "Avoiding and Remediating Acid Rock Drainage" presented at Latin American Mining Opportunities,
Randol at Vancouver '94, Oct. 30-Nov. 2, 1994.
Gusek, James J., Harry Moore, Vanessa Bateman, James Ozment, Leonard Oliver, Deedee Kathman, Jacob
Waples, Thomas Rutkowski, Wilson Bowden, and Andrea Reither, 2008. “A New Guidance Document for
Mitigating Impacts from Acid-Producing Rock Formations in Tennessee Road Construction Projects”.
Presented at the 59th Annual Highway Geology Symposium, Santa Fe, New Mexico. May 6-9, 2008.
Interstate Technology Regulatory Council (ITRC) website, Sequatchie Valley Coal Mine project accessed 28-Oct-
11 (http://www.itrcweb.org/miningwasteguidance/cs31_sequatchie.htm)
Jin, Song, P. H. Fallgren, J. M. Morris, & J. S. Cooper, 2008. Source Treatment of Acid Mine Drainage at a
Backfilled Coal Mine Using Remote Sensing and Biogeochemistry. Water Air Soil Pollution 188:205–212.
Jin, Song, P. H. Fallgren, J. M. Morris, 2012. Treatment and prevention systems for acid mine drainage and
halogenated contaminants. United States Patent No. 8,105,489. January 31, 2012.
Li, S. H. and S. W. Parr, 1926. The Oxidation of Pyrites as a Factor in the Spontaneous Combustion of Coal. Ind.
Eng. Chem., 1926, 18 (12), pp 1299–1304.
Mitchell, Paul, James Rybock & Amy Wheaton, 1999. Treatment and Prevention of ARD Using Silica Micro-
Encapsulation. Paper presented at the 1999 National Meeting of the American Society for Surface Mining and
Reclamation, Scottsdale, AZ, August 13-19, 1999. Vol. II, pp 657-651.
Olson, Gregory J., Thomas R. Clark, Terry I. Mudder, Mark Logsdon, 2006. “Toward Source Control of Acid
Rock Drainage”. Paper presented at the 7th International Conference on Acid Rock Drainage (ICARD),
March 26-30, 2006, St. Louis MO. R.I. Barnhisel (ed.) Published by the American Society for Mining and
Reclamation. . pp 2170–2187.

73
Plocus, Van G. and Vijay Rastogi, 1997. Geophysical Mapping and Subsurface Injection for Treatment of Post-
Reclamation Acid Drainage. Paper presented at the 1997 National Meeting of the American Society for
Surface Mining and Reclamation, Austin, Texas, May 10-15, 1997. pp 34-42.
Plocus, Van. 2011, pers. comm.
Rastogi, Vijay, R. Krecic, A. Sobek and M. Shellhorn, 1986. ProMacTM
Systems for Reclamation and Control of
Acid Production in Toxic Mine Waste, Poster Paper in Proceedings of the 7th Annual West Virginia Acid
Mine Drainage Task Force Symposium. April 1-2, 1986.
http://wvmdtaskforce.com/proceedings/86/ras/86ras.htm
Schueck, Joseph, M. DiMatteo, B. Scheetz, and M. Silsbee, 1996. Water Quality Improvements Resulting From
Fbc Ash Grouting of Buried Piles of Pyritic Materials on a Surface Coal Mine. Paper presented at the 1996
Annual Meeting of the West Virginia Acid Mine Drainage Task Force, Morgantown, W.Va., April 2, 3, 1996.
Shaw, Duncan J. 1980. Introduction to Colloid and Surface Chemistry. Colchester and London: Butterworth &
Co Ltd. 273 pp.
Verburg, Rens, B. Johnson, M. Fordham, and M. Logsdon, 2003. A Rapid and Cost-Effective Method for Bench
Screening of Geochemical Performance and Disposal Options for High-Sulfide Tailings. Presented at the 6th
International Conference of Acid Rock Drainage (ICARD), Cairns, QLD, Australia, July 12-18, 2003. pp 739-
749.
Wilson, G.W. 2008. Why are we still struggling [with] acid rock drainage? Geotechnical News. 26(2):51-56.
Zhang, Xiang, Michael J Borda, Martin AA Schoonen, and Daniel R. Strongin, 2003. Pyrite Oxidation Inhibition
by a Cross-Linked Lipid Coating. Geochemical Transactions 2003, 4:8.
Zsigmondy, Richard, 1917. The Chemistry of Colloids. New York: John Wiley & Sons, Inc. 288 pp.
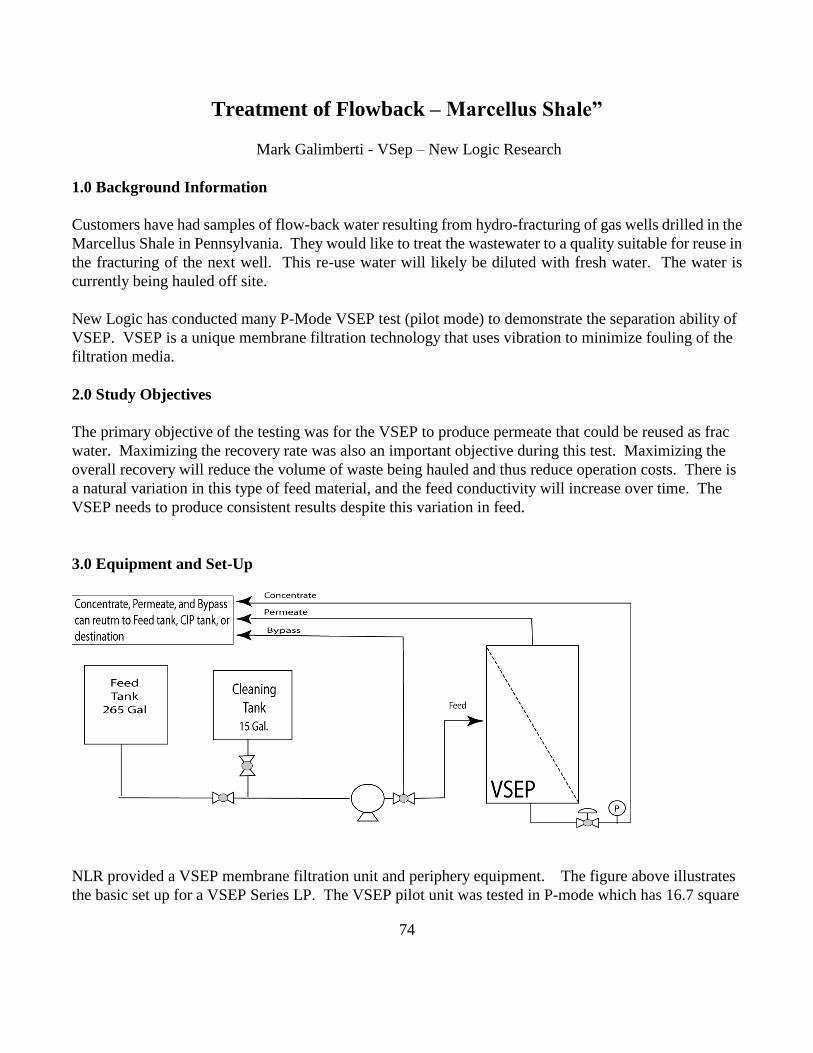
74
Treatment of Flowback – Marcellus Shale”
Mark Galimberti - VSep – New Logic Research
1.0 Background Information
Customers have had samples of flow-back water resulting from hydro-fracturing of gas wells drilled in the
Marcellus Shale in Pennsylvania. They would like to treat the wastewater to a quality suitable for reuse in
the fracturing of the next well. This re-use water will likely be diluted with fresh water. The water is
currently being hauled off site.
New Logic has conducted many P-Mode VSEP test (pilot mode) to demonstrate the separation ability of
VSEP. VSEP is a unique membrane filtration technology that uses vibration to minimize fouling of the
filtration media.
2.0 Study Objectives
The primary objective of the testing was for the VSEP to produce permeate that could be reused as frac
water. Maximizing the recovery rate was also an important objective during this test. Maximizing the
overall recovery will reduce the volume of waste being hauled and thus reduce operation costs. There is
a natural variation in this type of feed material, and the feed conductivity will increase over time. The
VSEP needs to produce consistent results despite this variation in feed.
3.0 Equipment and Set-Up
NLR provided a VSEP membrane filtration unit and periphery equipment. The figure above illustrates
the basic set up for a VSEP Series LP. The VSEP pilot unit was tested in P-mode which has 16.7 square

75
feet of membrane area. The P-unit was installed with a nanofiltration (NF) membrane called NF-270.
This membrane was chosen based on previous in house lab testing.
The standard system was run in batch mode in which the feed tank is filled with a limited volume of feed
material and the concentrate line is returned to the feed tank. The permeate is allowed to leave the
system thus concentrating the feed tank. Batch mode was chosen as the mode of operation for pilot
testing in order to handle the high TDS of feed and maintain economical flow rates. The VSEP set up is
shown in Figure 1.
Figure 1: Examples of VSEP Set up
4.0 Results
As part of pilot testing, various operating variables were optimized for the best performance and economic
balance. The operating pressure was optimized by collecting permeate flux readings at various pressures.
The relationship between pressure and flux was found to be linear. There was no increased rate of fouling or
flow threshold at higher operating pressures up to 500psi. The operating pressure chosen was 480psi. The
results are shown in Figure 2.

76
0
10
20
30
40
0 50 100 150 200 250 300 350 400 450 500 550 600
Pressure (psi)
Inst
an
tan
eo
us
Flu
x (
GFD
) -
Tem
p.
Co
rre
cte
d
Figure 2: Pressure Study
One case showed a total of 8 batch runs of varying feed quality. The first batch was a single pass
through the membrane with no concentration and will not be included in the calculations. The end point
of each batch was determined by a low permeate flux rate or a low feed level (not enough feed to pump
through the system). A chemical pre-treatment of Ferric Chloride and Soda Ash was tested but was not
successful in reaching higher recovery or flux rates and actually performed worse than raw feed. The
results of the instantaneous flux rates for the batch concentrations are shown in Figure 3 and Tables 1, 2,
and 3.
The average performance of the system: 17.2 GFD and 92% recovery at 20ºC and 480psi. The average
flux is based on the six batches on raw feed and these values will be used for system sizing calculations.
The average flux was calculated by fitting an exponential trend line to the average flux rates for each
batch. The equation used for calculating the average flux based on percent recovery is: Ave Flux =
31.465e-0.6574*%Rec
. The average recovery is based on the arithmetic mean of the six batches. These
values will be used for system sizing calculations. The results can be seen in Figure 4 and 5.

77
0.0
10.0
20.0
30.0
40.0
50.0
60.0
70.0
0% 20% 40% 60% 80% 100%
% Recovery
Ins
tan
tan
eo
us
Flu
x -
Te
mp
Co
rrBatch #2 - 136.0mS
Batch #3 - 73mS
Batch #4 - 45mS
Batch #5 - 86mS
Batch #6 - Ferric/Soda Ash
Batch #7 - 67.5mS
Batch #8 - 34.5mS
Figure 3: Batch Concentration

78
y = 31.465e-0.6574x
R2 = 0.146
0.0
10.0
20.0
30.0
40.0
50.0
60.0
70.0
0% 10% 20% 30% 40% 50% 60% 70% 80% 90% 100%
% Recovery
Avera
ge F
lux -
Tem
p C
orr
Figure 4: Average Flux
Figure 5: VSEP Permeate and Concentrate

79
Table 1: Quantitative Results
*All Flux values are corrected to 20ºC
Table 2: Analytical Results
Batch Pressure Average Flux %Recovery
2 480psi 13.3 GFD 91%
3 480psi 35.9 GFD 94%
4 480psi 31.4 GFD 80%
5 480psi 27.8 GFD 93%
6 480psi 22.7 GFD 43%
7 480psi 27.5 GFD 96%
8 480psi 11.0 GFD 98%
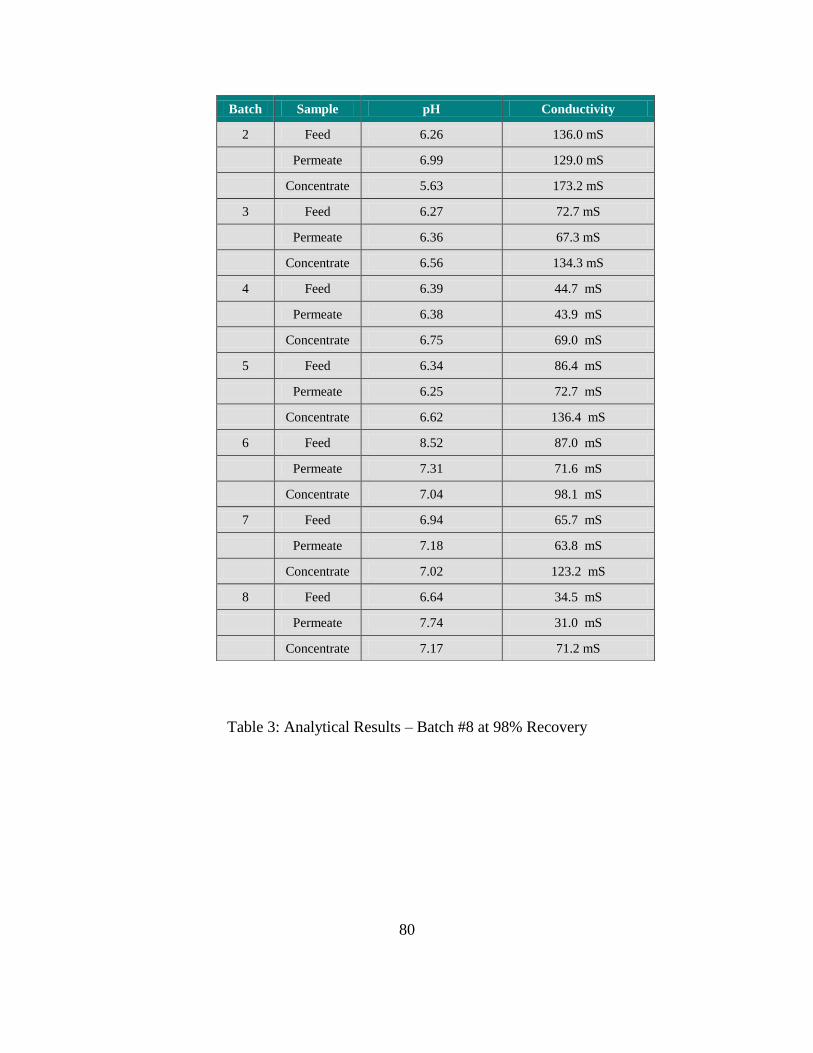
80
Table 3: Analytical Results – Batch #8 at 98% Recovery
Batch Sample pH Conductivity
2 Feed 6.26 136.0 mS
Permeate 6.99 129.0 mS
Concentrate 5.63 173.2 mS
3 Feed 6.27 72.7 mS
Permeate 6.36 67.3 mS
Concentrate 6.56 134.3 mS
4 Feed 6.39 44.7 mS
Permeate 6.38 43.9 mS
Concentrate 6.75 69.0 mS
5 Feed 6.34 86.4 mS
Permeate 6.25 72.7 mS
Concentrate 6.62 136.4 mS
6 Feed 8.52 87.0 mS
Permeate 7.31 71.6 mS
Concentrate 7.04 98.1 mS
7 Feed 6.94 65.7 mS
Permeate 7.18 63.8 mS
Concentrate 7.02 123.2 mS
8 Feed 6.64 34.5 mS
Permeate 7.74 31.0 mS
Concentrate 7.17 71.2 mS
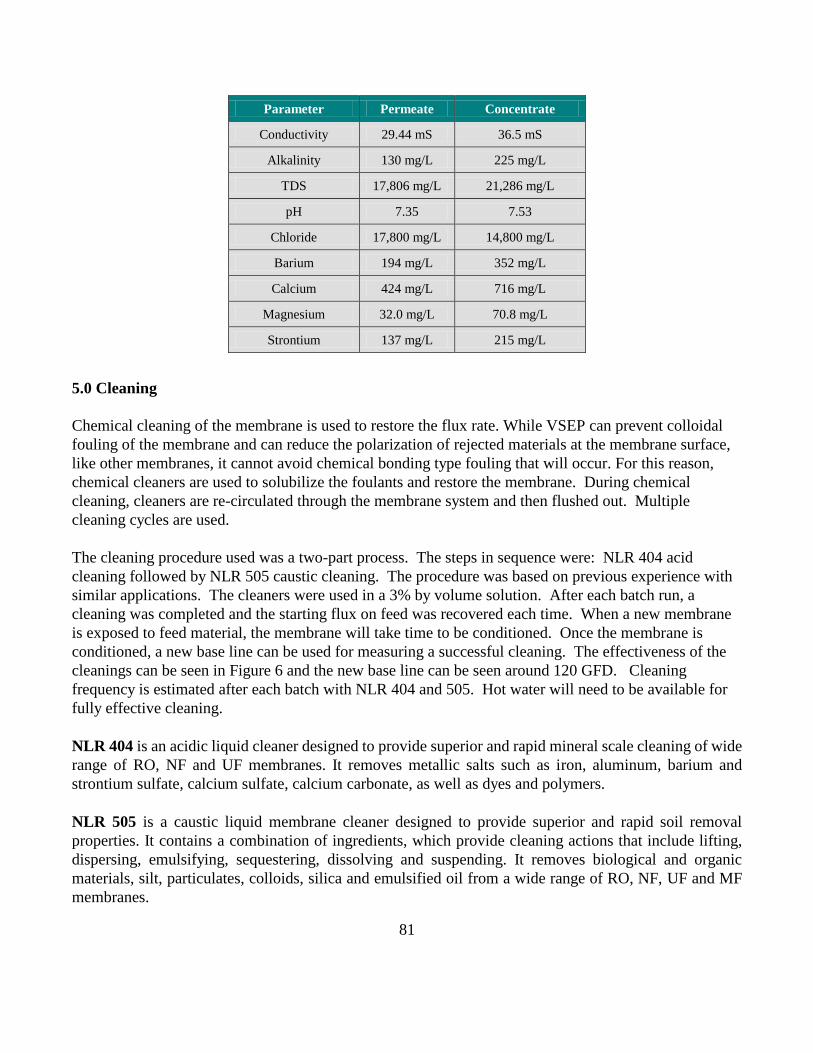
81
5.0 Cleaning
Chemical cleaning of the membrane is used to restore the flux rate. While VSEP can prevent colloidal
fouling of the membrane and can reduce the polarization of rejected materials at the membrane surface,
like other membranes, it cannot avoid chemical bonding type fouling that will occur. For this reason,
chemical cleaners are used to solubilize the foulants and restore the membrane. During chemical
cleaning, cleaners are re-circulated through the membrane system and then flushed out. Multiple
cleaning cycles are used.
The cleaning procedure used was a two-part process. The steps in sequence were: NLR 404 acid
cleaning followed by NLR 505 caustic cleaning. The procedure was based on previous experience with
similar applications. The cleaners were used in a 3% by volume solution. After each batch run, a
cleaning was completed and the starting flux on feed was recovered each time. When a new membrane
is exposed to feed material, the membrane will take time to be conditioned. Once the membrane is
conditioned, a new base line can be used for measuring a successful cleaning. The effectiveness of the
cleanings can be seen in Figure 6 and the new base line can be seen around 120 GFD. Cleaning
frequency is estimated after each batch with NLR 404 and 505. Hot water will need to be available for
fully effective cleaning.
NLR 404 is an acidic liquid cleaner designed to provide superior and rapid mineral scale cleaning of wide
range of RO, NF and UF membranes. It removes metallic salts such as iron, aluminum, barium and
strontium sulfate, calcium sulfate, calcium carbonate, as well as dyes and polymers.
NLR 505 is a caustic liquid membrane cleaner designed to provide superior and rapid soil removal
properties. It contains a combination of ingredients, which provide cleaning actions that include lifting,
dispersing, emulsifying, sequestering, dissolving and suspending. It removes biological and organic
materials, silt, particulates, colloids, silica and emulsified oil from a wide range of RO, NF, UF and MF
membranes.
Parameter Permeate Concentrate
Conductivity 29.44 mS 36.5 mS
Alkalinity 130 mg/L 225 mg/L
TDS 17,806 mg/L 21,286 mg/L
pH 7.35 7.53
Chloride 17,800 mg/L 14,800 mg/L
Barium 194 mg/L 352 mg/L
Calcium 424 mg/L 716 mg/L
Magnesium 32.0 mg/L 70.8 mg/L
Strontium 137 mg/L 215 mg/L

82
0.0
20.0
40.0
60.0
80.0
100.0
120.0
140.0
New
Mem
bran
e
Hot
Wat
er F
lush
NLR
404
NLR
505
Hot
Wat
er F
lush
NLR
404
NLR
505
Hot
Wat
er F
lush
NLR
404
NLR
505
Hot
Wat
er F
lush
NLR
404
NLR
505
Hot
Wat
er F
lush
NLR
404
NLR
505
NLR
404
NLR
505
GFD
@ 2
5ºC
Figure 6: Cleaning Data
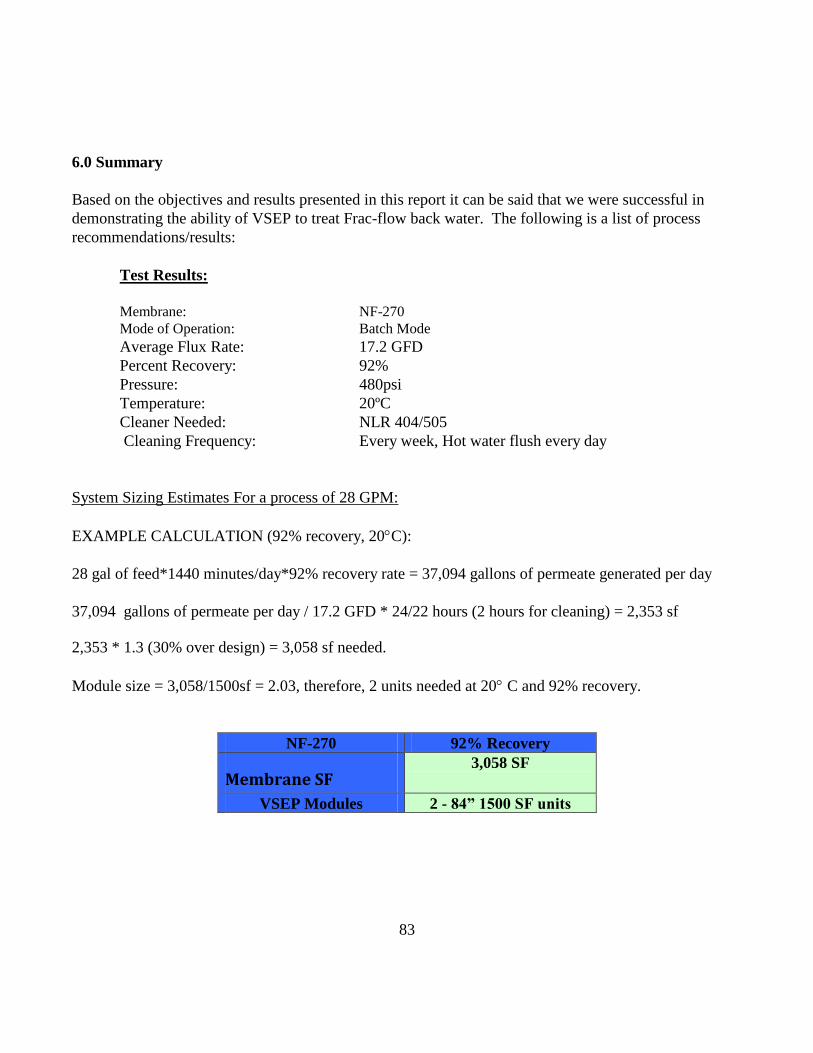
83
6.0 Summary
Based on the objectives and results presented in this report it can be said that we were successful in
demonstrating the ability of VSEP to treat Frac-flow back water. The following is a list of process
recommendations/results:
Test Results:
Membrane: NF-270
Mode of Operation: Batch Mode
Average Flux Rate: 17.2 GFD
Percent Recovery: 92%
Pressure: 480psi
Temperature: 20ºC
Cleaner Needed: NLR 404/505
Cleaning Frequency: Every week, Hot water flush every day
System Sizing Estimates For a process of 28 GPM:
EXAMPLE CALCULATION (92% recovery, 20C):
28 gal of feed*1440 minutes/day*92% recovery rate = 37,094 gallons of permeate generated per day
37,094 gallons of permeate per day / 17.2 GFD * 24/22 hours (2 hours for cleaning) = 2,353 sf
2,353 * 1.3 (30% over design) = 3,058 sf needed.
Module size = 3,058/1500sf = 2.03, therefore, 2 units needed at 20 C and 92% recovery.
NF-270 92% Recovery
Membrane SF 3,058 SF
VSEP Modules 2 - 84” 1500 SF units

84
7.0 System Design Requirements
Stage Type: 2 - 84” 1500 VSEP Elastomers: EPDM
Mode of Operation: Batch Drain Cloth: Polyester
Membrane Type: NF-270 Resin: Epoxy
Operating Temperature: 20 C End Plates: Polypropylene
Design Pressure: 480psi (600max) Membrane Trays: 304
Feed Flow Rate: 28 GPM Operation: Automated
Recovery Rate: 92% Pre-treatment: None
Design Flux Rate: 17.2 GFD AVE
Max Flux After Clean: 140 GFD @ 200psi Cleaning Chemicals: NLR 404/505
Feed Pump Max Flow: 70 GPM @ 480psi Cleaning Frequency: After every week
Permeate Destination: Reuse as Frac water
Concentrate Destination: Hauled for disposal
Some Photos of VSEP units used in Flowback Mobile Treatment in Pennsylvania:


![Monongalia mirror (Morgantown, Va. [W. Va.]).(Morgantown ... › lccn › sn86092163 › ... · BflSf*9SMES General Advertiser, a *AND. '-:4Ti,Reductionin g'rict.achadwick&co'S. "fTJ8T'r«;flv»(l](https://img.dokumen.tips/doc/110x75/5f21b36855a2340bed471ebe/monongalia-mirror-morgantown-va-w-vamorgantown-a-lccn-a-sn86092163.jpg)


