Embed Size (px)
Citation preview
Ontology Matching
OM-2009
Papers from the ISWC Workshop
Introduction
Ontology matching is a key interoperability enabler for the Semantic Web, aswell as a useful tactic in some classical data integration tasks. It takes theontologies as input and determines as output an alignment, that is, a set ofcorrespondences between the semantically related entities of those ontologies.These correspondences can be used for various tasks, such as ontology mergingand data translation. Thus, matching ontologies enables the knowledge anddata expressed in the matched ontologies to interoperate.
The workshop has three goals:
• To bring together leaders from academia, industry and user institutionsto assess how academic advances are addressing real-world requirements.The workshop will strive to improve academic awareness of industrial andfinal user needs, and therefore, direct research towards those needs. Simul-taneously, the workshop will serve to inform industry and user represen-tatives about existing research efforts that may meet their requirements.The workshop will also investigate how the ontology matching technologyis going to evolve.
• To conduct an extensive and rigorous evaluation of ontology matchingapproaches through the OAEI (Ontology Alignment Evaluation Initiative)2009 campaign, http://oaei.ontologymatching.org/2009. This year’sOAEI campaign introduces two new tracks about oriented alignments andabout instance matching (a timely topic for the linked data community).Therefore, the ontology matching evaluation initiative itself will provide asolid ground for discussion of how well the current approaches are meetingbusiness needs.
• To examine similarities and differences from database schema matching,which has received decades of attention but is just beginning to transitionto mainstream tools.
We received 25 submissions for the technical track of the workshop. Theprogram committee selected 6 submissions for oral presentation and 12 submis-sions for poster presentation. 16 matching systems participated in this year’sOAEI campaign. Further information about the Ontology Matching workshopcan be found at: http://om2009.ontologymatching.org/.
i
Acknowledgments. We thank all members of the program committee, au-thors and local organizers for their efforts. We appreciate support from theTrentino as a Lab (TasLab)1 initiative of the European Network of the LivingLabs2 at Informatica Trentina SpA3 and the EU SEALS (Semantic Evaluationat Large Scale)4 project.
Pavel ShvaikoJerome EuzenatFausto GiunchigliaHeiner StuckenschmidtNatasha NoyArnon Rosenthal
October 2009
1http://www.taslab.eu2http://www.openlivinglabs.eu3http://www.infotn.it4http://www.seals-project.eu
ii
Organization
Organizing Committee
Pavel Shvaiko, TasLab, Informatica Trentina SpA, ItalyJerome Euzenat, INRIA & LIG, FranceFausto Giunchiglia, University of Trento, ItalyHeiner Stuckenschmidt, University of Mannheim, GermanyNatasha Noy, Stanford Center for Biomedical Informatics Research, USAArnon Rosenthal, The MITRE Corporation, USA
Program Committee
Yuan An, Drexel University, USAZohra Bellahsene, LIRMM, FrancePaolo Besana, University of Edinburgh, UKOlivier Bodenreider, National Library of Medicine, USAIsabel Cruz, University of Illinois at Chicago, USAJerome David, Universite Pierre Mendes-France, INRIA & LIG, FranceAvigdor Gal, Technion, IsraelJingshan Huang, University of South Alabama, USAWei Hu, Southeast University, ChinaRyutaro Ichise, National Institute of Informatics, JapanAntoine Isaac, Vrije Universiteit Amsterdam, NetherlandsKrzysztof Janowicz, University of Muenster, GermanyChiara Ghidini, Fondazione Bruno Kessler (IRST), ItalyBin He, IBM, USAYannis Kalfoglou, Ricoh Europe plc., UKMonika Lanzenberger, Vienna University of Technology, AustriaPatrick Lambrix, Linkopings Universitet, SwedenMaurizio Lenzerini, University of Rome - Sapienza, ItalyVincenzo Maltese, University of Trento, ItalyFiona McNeill, University of Edinburgh, UKChristian Meilicke, University of Mannheim, GermanyLuca Mion, TasLab, Informatica Trentina SpA, ItalyPeter Mork, The MITRE Corporation, USALeo Obrst, The MITRE Corporation, USAMassimo Paolucci, DoCoMo Labs, GermanyFrancois Scharffe, INRIA & LIG, FranceUmberto Straccia, ISTI-C.N.R., ItalyYork Sure, University of Koblenz, GermanyAndrei Tamilin, Fondazione Bruno Kessler (IRST), ItalyLorenzino Vaccari, PAT, Italy
iii
Ludger van Elst, DFKI, GermanyFrank van Harmelen, Vrije Universiteit Amsterdam, NetherlandsYannis Velegrakis, University of Trento, ItalyBaoshi Yan, Bosch Research, USARui Zhang, University of Trento, ItalySongmao Zhang, Chinese Academy of Sciences, China
Additional Reviewers
Fabien Duchateau, LIRMM, FranceChristophe Gueret, Vrije Universiteit Amsterdam, NetherlandsQiang Liu, Linkopings Universitet, SwedenShenghui Wang, Vrije Universiteit Amsterdam, Netherlands
iv
Table of Contents
PART 1 - Technical Papers
Scalable matching of industry models – a case studyBrian Byrne, Achille Fokoue, Aditya Kalyanpur,Kavitha Srinivas and Min Wang . . . . . . . . . . . . . . . . . . . . . . . . . . . . . . . . . . . . . . . . . . . .1
Mapping-chains for studying concept shift in political ontologiesShenghui Wang, Stefan Schlobach, Janet Takensand Wouter van Atteveldt . . . . . . . . . . . . . . . . . . . . . . . . . . . . . . . . . . . . . . . . . . . . . . . . . 13
A pattern-based ontology matching approach for detectingcomplex correspondencesDominique Ritze, Christian Meilicke, Ondrej Svab-Zamazaland Heiner Stuckenschmidt . . . . . . . . . . . . . . . . . . . . . . . . . . . . . . . . . . . . . . . . . . . . . . . .25
Computing minimal mappingsFausto Giunchiglia, Vincenzo Maltese and Aliaksandr Autayeu . . . . . . . . . . . . .37
Efficient selection of mappings and automaticquality-driven combination of matching methodsIsabel Cruz, Flavio Palandri Antonelli and Cosmin Stroe . . . . . . . . . . . . . . . . . . 49
Measuring the structural preservation of semantic hierarchy alignmentCliff Joslyn, Patrick Paulson and Amanda White . . . . . . . . . . . . . . . . . . . . . . . . . . 61
v
PART 2 - OAEI Papers
Results of the Ontology Alignment Evaluation Initiative 2009Jerome Euzenat, Alfio Ferrara, Laura Hollink, Antoine Isaac,Cliff Joslyn, Veronique Malaise, Christian Meilicke, Andriy Nikolov,Juan Pane, Marta Sabou, Francois Scharffe, Pavel Shvaiko,Vassilis Spiliopoulos, Heiner Stuckenschmidt, Ondrej Svab-Zamazal,Vojtech Svatek, Cassia Trojahn dos Santos, George Vouros andShenghui Wang . . . . . . . . . . . . . . . . . . . . . . . . . . . . . . . . . . . . . . . . . . . . . . . . . . . . . . . . . . .73
Anchor-Flood: results for OAEI 2009Md. Hanif Seddiqui and Masaki Aono . . . . . . . . . . . . . . . . . . . . . . . . . . . . . . . . . . . . 127
Using AgreementMaker to align ontologies for OAEI 2009:Overview, Results, and OutlookIsabel Cruz, Flavio Palandri Antonelli,Cosmin Stroe, Ulas C. Keles and Angela Maduko . . . . . . . . . . . . . . . . . . . . . . . . . 135
AROMA results for OAEI 2009Jerome David . . . . . . . . . . . . . . . . . . . . . . . . . . . . . . . . . . . . . . . . . . . . . . . . . . . . . . . . . . . . 147
ASMOV: results for OAEI 2009Yves R. Jean-Mary, E. Patrick Shironoshita and Mansur R. Kabuka . . . . . 152
DSSim results for OAEI 2009Miklos Nagy, Maria Vargas-Vera and Piotr Stolarski . . . . . . . . . . . . . . . . . . . . . 160
Results of GeRoMeSuite for OAEI 2009Christoph Quix, Sandra Geisler, David Kensche and Xiang Li . . . . . . . . . . . . 170
KOSIMap: ontology alignments results for OAEI 2009Quentin Reul and Jeff Z. Pan . . . . . . . . . . . . . . . . . . . . . . . . . . . . . . . . . . . . . . . . . . . . 177
Lily: ontology alignment results for OAEI 2009Peng Wang and Baowen Xu . . . . . . . . . . . . . . . . . . . . . . . . . . . . . . . . . . . . . . . . . . . . . .186
MapPSO results for OAEI 2009Jurgen Bock, Peng Liu and Jan Hettenhausen . . . . . . . . . . . . . . . . . . . . . . . . . . . . 193
Results of OKKAM feature based entity matchingalgorithm for instance matching contest of OAEI 2009Heiko Stoermer and Nataliya Rassadko . . . . . . . . . . . . . . . . . . . . . . . . . . . . . . . . . . . 200
RiMOM results for OAEI 2009Xiao Zhang, Qian Zhong, Feng Shi, Juanzi Li and Jie Tang . . . . . . . . . . . . . . 208
Alignment results of SOBOM for OAEI 2009Peigang Xu, Haijun Tao, Tianyi Zang and Yadong Wang . . . . . . . . . . . . . . . . 216
vi

Cross-lingual Dutch to English alignment usingEuroWordNet and Dutch WikipediaGosse Bouma . . . . . . . . . . . . . . . . . . . . . . . . . . . . . . . . . . . . . . . . . . . . . . . . . . . . . . . . . . . . 224
TaxoMap in the OAEI 2009 alignment contestFaycal Hamdi, Brigitte Safar, Nobal Niraula and Chantal Reynaud . . . . . . . 230
vii
PART 3 - Posters
Using ontology alignment to dynamically chain web servicesDru McCandless and Leo Obrst . . . . . . . . . . . . . . . . . . . . . . . . . . . . . . . . . . . . . . . . . . 238
Semantic geo-catalog: a scenario and requirementsPavel Shvaiko, Lorenzino Vaccari and Gaia Trecarichi . . . . . . . . . . . . . . . . . . . . 240
Tax and revenue service scenario for ontology matchingStefano Brida, Marco Combetto, Silvano Frasson and Paolo Giorgini . . . . . 242
An ontology-based data matching framework:use case competency-based HRMPeter De Baer, Yan Tang and Pieter De Leenheer . . . . . . . . . . . . . . . . . . . . . . . . 244
Improving bio-ontologies matching using types and adaptive weightsBastien Rance and Christine Froidevaux . . . . . . . . . . . . . . . . . . . . . . . . . . . . . . . . . .246
Parallelization and distribution techniques for ontology matchingin urban computing environmentsAxel Tenschert, Matthias Assel, Alexey Cheptsov,Georgina Gallizo, Emanuele Della Valle and Irene Celino . . . . . . . . . . . . . . . . 248
CompositeMatch: detecting N-ary matches in ontology alignmentKelly Moran, Kajal Claypool and Benjamin Hescott . . . . . . . . . . . . . . . . . . . . . . 250
Recommendations for qualitative ontology matching evaluationsAliaksandr Autayeu, Vincenzo Maltese and Pierre Andrews . . . . . . . . . . . . . . . 252
Implementing semantic precision and recallDaniel Fleischhacker and Heiner Stuckenschmidt . . . . . . . . . . . . . . . . . . . . . . . . . 254
Learning to map ontologies with neural networkYefei Peng, Paul Munro and Ming Mao . . . . . . . . . . . . . . . . . . . . . . . . . . . . . . . . . . 256
Matching natural language data on ontologiesJohannes Heinecke . . . . . . . . . . . . . . . . . . . . . . . . . . . . . . . . . . . . . . . . . . . . . . . . . . . . . . . 258
Reducing polysemy in WordNetKanjana Jiamjitvanich and Mikalai Yatskevich . . . . . . . . . . . . . . . . . . . . . . . . . . . 260
viii

ix
Scalable Matching of Industry Models – A Case
Study
Brian Byrne1, Achille Fokoue2, Aditya Kalyanpur2, Kavitha Srinivas2, and MinWang2
1 IBM Software Group, Information Management, Austin, [email protected]
2 IBM T. J. Watson Research Center, Hawthorne, New Yorkachille, adityakal, ksrinivs, [email protected]
Abstract. A recent approach to the problem of ontology matching hasbeen to convert the problem of ontology matching to information re-trieval. We explore the utility of this approach in matching model el-ements of real UML, ER, EMF and XML-Schema models, where thesemantics of the models are less precisely defined. We validate this ap-proach with domain experts for industry models drawn from very differ-ent domains (healthcare, insurance, and banking). We also observe thatin the field, manually constructed mappings for such large industry mod-els are prone to serious errors. We describe a novel tool we developed todetect suspicious mappings to quickly isolate these errors.keywords: Model matching.
1 Introduction
The world of business is centered around information. Every business deals witha myriad of different semantic expressions of key business information, and ex-pends huge resources working around the inconsistencies, challenges and errorsintroduced by a variety of information models. Typically, these information mod-els organize the data, services, business processes, or vocabulary of an enterprise,and they may exist in different forms such as ER models, UML models, thesauri,ontologies or XML schema. A common problem is that these varying modelsrarely share a common terminology, because they have emerged as a result ofseveral inputs. In some cases, mergers of organizations operating in the samebusiness result in different information models, to express the same exact con-cepts. In other cases, they may have been developed by different organizationalunits to express overlapping business concepts, but in slightly different domains.
Irrespective of how these models came about, today’s business is faced withmany different information models, and an increasing need to integrate acrossthese models, through data integration, shared processes and rules, or reusablebusiness services. In all of these cases, the ability to relate, or map, betweendifferent models is critical. Both human attempts to manually map differentinformation models and and the use of tools to automate mappings however arevery error prone in the real world. For humans, the source of the error comesfrom multiple sources:
1
– The size of these models (typically, these models have several thousand ele-ments each)
– The fact that lexical names of model elements rarely match, or when theydo match, its because of the wrong reasons (e.g., a document may have anendDate attribute, as does a claim, but the two endDate reflect semanticallydifferent things, although they match at the lexical level).
– Models often express concepts at different levels of granularity, and it maynot always be apparent at what level the concept should be mapped. Inmany real world mappings, we have observed a tendency for human analyststo map everything to generic concepts rather than more specific concepts.While these mappings are not necessarily invalid, they have limited utilityin data integration scenarios, or in solution building.
The above points make it clear that there is a need for a tool to perform semi-automated model mapping, where a tool can help suggest appropriate mappingsto a human analyst. Literature on ontology matching and alignment is clearlyhelpful in designing such a tool. Our approach to building such a tool is similarin spirit to the ideas implemented in Falcon-AO [1],[2] and PRIOR ([3]), exceptthat we adapted their techniques to UML, ER and EMF models. Matching oralignment across these models is different from matching ontologies, because thesemantics of these models are poorly defined compared to those of ontologies.Perhaps due to this reason, schema mapping approaches tend to focus mostly onlexical and structural analysis. However, existing schema mapping approachesscale very poorly to large models. Most analysts in the field therefore tend torevert to manual mapping, despite the availability of many schema mappingtools.
We however make the observation that in most industry models, the seman-tics of model elements is buried in documentation (either within the model, orin separate PDF, Excel or Word files). We therefore use techniques describedby Falcon-AO and PRIOR to build a generic representation that allows us toexploit the structural and lexical information about model elements along withsemantics in documentation. The basic idea, as described in PRIOR is to convertthe model mapping problem into a problem of information retrieval. Specifically,each model element is converted into a virtual document with a number of fieldsthat encode the structural, lexical and semantic information associated withthat model element. This information is in turn expressed as a term vector fora document. Mapping across model elements is then measured as a function ofdocument similarity; i.e., the cosine similarity between two term vectors. Thisapproach scales very well because we use the Apache Lucene text search enginefor indexing and searching these virtual documents.
The novelty in our approach is that we also developed an engine to identifysuspicious mappings produced either by our tool or by human analysts. Wecall this tool a Lint engine for model mappings, after the popular Lint toolwhich checks C programs for common software errors. The key observation thatmotivated our development of the Lint engine was that human model mappings
2
were shockingly poor for 3/4 model mappings that were produced in real businessscenarios. Common errors made by human analysts included the following:
– Mapping elements to overly general classes (equivalent to Thing).– Mapping elements to subtypes even when the superclass was the appropri-
ate match. As an example, Hierarchy was mapped to HierarchyType whenHierarchy existed in the other model.
– Mapping elements that were simply invalid or wrong.
We encoded 6 different heuristics to flag suspicious mappings, includingheuristics that can identify common errors made by our own algorithm (e.g.,the tendency to match across elements with duplicate, copied documentation).The Lint engine for model mappings is thus incorporated as a key filter for semi-automated model mapping tool, to reduce the number of false positives thatthe human analyst needs to examine. A second use of our tool is of course toreview the quality of human mappings in cases where the model mappings wereproduced manually.
Our key contributions are as follows:
– We describe a technique to extend existing techniques in ontology mapping tothe problem of model mapping across UML, ER, and EMF models. Unlikeexisting approaches in schema mapping, we exploit semantic informationembedded in documentation along with semantic and lexical information toperform the mapping.
– We describe a novel Lint engine which can be used to review the quality ofmodel mappings produced either by a human or by our algorithm.
– We perform a detailed evaluation of the semi-automated tool on 7 real worldmodel mappings. Four of the seven mappings had human mappings that wereperformed in a business context. We evaluated the Lint engine on these 4mappings. The mappings involved large industry specific framework mod-els with thousands of elements in each model in the domains of healthcare,insurance, and banking, as well as customer models in the domains of health-care and banking. Our approach has therefore been validated on mappingsthat were performed for real business scenarios. In all cases, we validatedthe output of both tools with domain experts.
2 Related Work
Ontology matching or the related problem of schema matching is a well studiedproblem, with a number of different approaches that are too numerous to be out-lined here in detail. We refer the reader instead to surveys of ontology or schemamatching [4–6]. A sampling of ontology matching approaches include GLUE[7], PROMPT [8], HCONE-merge [9] and SAMBO [10]. Sample approaches toschema matching include Cupid [11], Artemis [12], and Clio [13–16]. Our work ismostly closely related to Falcon-AO [1, 2] and PRIOR [3], two recent approachesto ontology matching that combine some of the advantages of earlier approaches
3
such as linguistic and structural matching incorporated within an information-retrieval approach, and seem well positioned to be extended to address matchingin shallow-structured models such as UML, ER and EMF models. Both Falcon-AO and PRIOR have been compared with existing systems in OAEI 2007 andappear to scale well in terms of performance. Because our work addresses match-ing across very large UML, ER and EMF data models (about 5000 elements),we adapted the approaches described in Falcon-AO and PRIOR to these models.Matching or alignment across these models is different from matching ontologies,because the semantics of these models are poorly defined compared to those ofontologies. More importantly, we report the results of applying these techniquesto 7 real ontology matching problems in the field, and describe scenarios wherethe approach is most effective.
3 Overall Approach
3.1 Matching algorithm
Casting the matching problem to an IR problem Similar to approachesoutlined in Falcon-AO [1],[2] and PRIOR ([3]), a fundamental principle in ourapproach is to cast the problem of model matching into a classical InformationRetrieval problem. Model elements (e.g. attributes or classes) from various mod-eling representations (e.g. XML Schema, UML, EMF, ER) are transformed intovirtual documents. A virtual document consists of one or more fields capturingthe structural, lexical and semantic information associated with the correspond-ing model element.
A Vector Space Model (VSM) [17] is then adopted: each field F of a docu-ment is represented as a vector in a NF -dimensional space, with NF denotingthe number of distinct words in field F of all documents. Traditional TF-IDF(Term Frequency - Inverse Document Frequency) values are used as the value ofcoordinates associated to terms. Formally, let DF denotes the vector associatedwith the field F of a virtual document D, and DF [i] denotes the ith coordinateof the vector associated with the field F of a virtual document D:
DF [i] = tfi ∗ idfi (1)
tfi = |ti|/NF (2)
idfi = 1 + log(ND/di) (3)
where
– |ti| represents the number of occurrence, in the field F of document D, ofthe term t corresponding to the ith coordinate of the vector DF ,
– ND corresponds to the total number of documents, and– di is the number of documents in which t appears at least once in F
The similarity sim(A,B) between two model elements A and B is computedas the weighted mean of the cosine of the angle formed by their field vectors.
4
Formally, let D and D′ be the virtual documents corresponding to A and B,respectively. Let q be the number of distinct field names in all documents.
sim(A,B) =
∑q
k=1αk ∗ cosine(DFk
, D′Fk
)∑q
k=1αk
(4)
cosine(DFk, D′
Fk) =
∑NFk
i=1DFk
[i] ∗ D′Fk
[i]
|DFk| ∗ |D′
Fk|
(5)
|DF | =
√√√√NF∑i=1
(DF [i])2 (6)
where αk is the weight associated with the field Fk, which indicates the relativeimportance of information encoded by that field.
In our Lucene3-based implementation, before building document vectors,standard transformations, such as stemming/lemmatization, stop words removal,lowercasing, etc, are performed. In addition to these standard transformations,we also convert camel case words (e.g. “firstName”) into corresponding group ofspace separated words (e.g. “first name”).
Transforming model elements into virtual documents A key step inour approach is the transformation of elements of a data model into virtualdocuments. For simplicity of the presentation, we assume that the data modelis encoded as a UML Class diagram4
The input of the transformation is a model element (e.g. attribute, refer-ence/association, or class). The output is a virtual document with the the fol-lowing fields:
– name. This field consists of the name of the input element.– documentation. This field contains the documentation of the input model
element.– containerClass. For attribute, reference and association, this field contains
the name and documentation of their containing class.– path. This field contains the path from the model root package to the model
element (e.g. for an attribute ”bar” of the class ”foo” located in the package”example”, the path is /example/foo/bar).
– body. This field is made of the union of terms in all fields except path.
While the first two fields encode only lexical information, the next two fields(containerClass and path) capture some of the structure of the modeling ele-ments. In our implementation, when the models to be compared appear verysimilar, which translates to a very large number of discovered mappings, we typ-ically empirically adjust upwards the weight of the “containerClass” and “path”fields to convey more importance to the structural similarity.
3 http://lucene.apache.org/java/docs/4 Our implementation is able to handle more data model representations, including
XML Schemas, ER diagrams, and EMF ECore models.
5
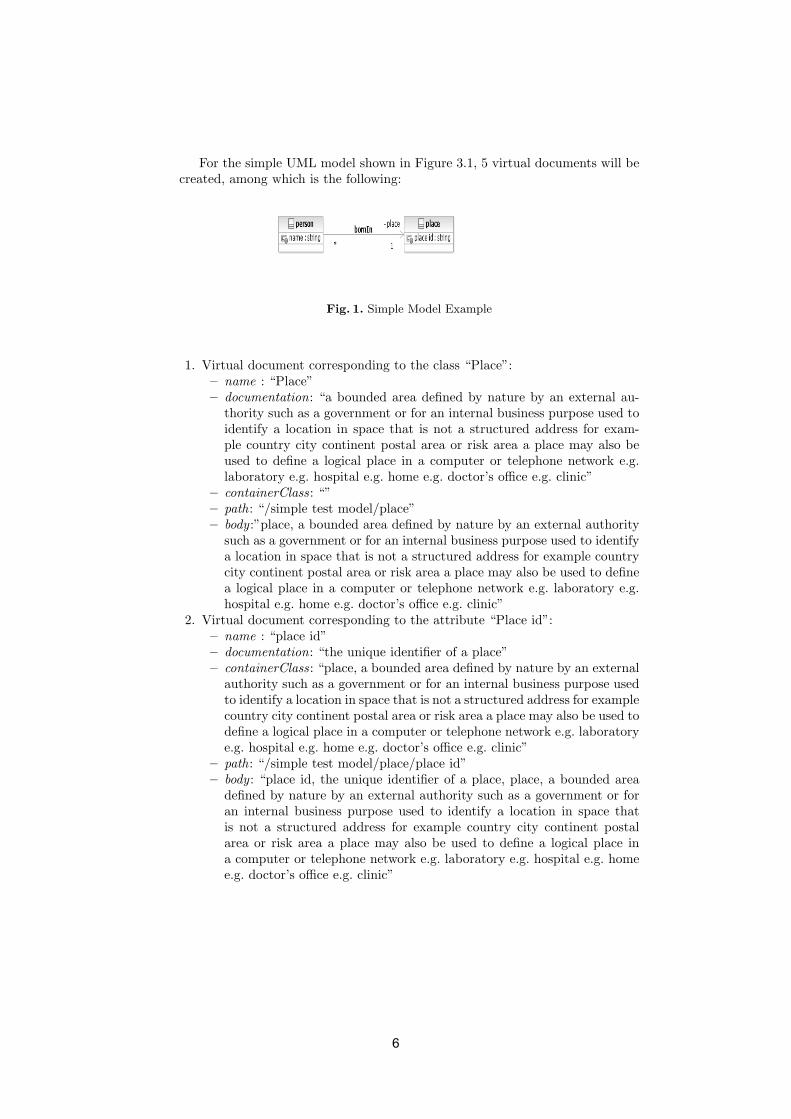
For the simple UML model shown in Figure 3.1, 5 virtual documents will becreated, among which is the following:
Fig. 1. Simple Model Example
1. Virtual document corresponding to the class “Place”:– name : “Place”– documentation: “a bounded area defined by nature by an external au-
thority such as a government or for an internal business purpose used toidentify a location in space that is not a structured address for exam-ple country city continent postal area or risk area a place may also beused to define a logical place in a computer or telephone network e.g.laboratory e.g. hospital e.g. home e.g. doctor’s office e.g. clinic”
– containerClass: “”– path: “/simple test model/place”– body :”place, a bounded area defined by nature by an external authority
such as a government or for an internal business purpose used to identifya location in space that is not a structured address for example countrycity continent postal area or risk area a place may also be used to definea logical place in a computer or telephone network e.g. laboratory e.g.hospital e.g. home e.g. doctor’s office e.g. clinic”
2. Virtual document corresponding to the attribute “Place id”:– name : “place id”– documentation: “the unique identifier of a place”– containerClass: “place, a bounded area defined by nature by an external
authority such as a government or for an internal business purpose usedto identify a location in space that is not a structured address for examplecountry city continent postal area or risk area a place may also be used todefine a logical place in a computer or telephone network e.g. laboratorye.g. hospital e.g. home e.g. doctor’s office e.g. clinic”
– path: “/simple test model/place/place id”– body : “place id, the unique identifier of a place, place, a bounded area
defined by nature by an external authority such as a government or foran internal business purpose used to identify a location in space thatis not a structured address for example country city continent postalarea or risk area a place may also be used to define a logical place ina computer or telephone network e.g. laboratory e.g. hospital e.g. homee.g. doctor’s office e.g. clinic”
6
Adding lexical and semantic similarity between terms The cosine scor-ing scheme presented above (4) is intolerant to even minor lexical or semanticvariations in terms. For example, the cosine score computed using equation (4)for the document vectors (gender: 1, sex: 0) and (gender:0, sex: 1) will be 0although “gender” mentioned in the first document is clearly semantically re-lated to “sex” appearing in the second document. To address this limitation, wemodify the initial vector to add, for a given term t, the indirect contributions ofterms related to t as measured by a term similarity metric. Formally, instead ofusing DFk
(resp. D′Fk
) in equation (4), we used the document vector DFkwhose
coordinates DFk[i], for 1 ≤ i ≤ NFk
, are defined as follows:
DFk[i] = DFk
[i] + βi ∗
NFk∑j=1 & j �=i
termSim(ti, tj) ∗ DFk[j] (7)
βi =
⎧⎨⎩
0 if, for all j �= i,DFk[j] = 0,
1∑ NFkj=1 & j �=i & DFk
[j]�=01
otherwise (8)
where
– termSim is a term similarity measure such as Jaccard or Levenshtein simi-larity measure (for lexical similarity), a semantic similarity measure based onWordNet [18] [19], or a combination of similarity measures. termSim(ti, tj)∗DFk
[j] in (7) measures the contribution to the term ti of the potentially re-lated term tj .
– βi is the weight assigned to indirect contributions of related terms.
For efficiency, when comparing two document vectors, we only add in themodified document vectors, the contributions of terms corresponding to at leastone non-zero coordinate of any of the two vectors.
The equation (7) applied to the previous example transforms (gender:1, sex:0) to (gender: 1, sex: termSim(“sex”, “gender”)) and (gender: 0, sex: 1) to (gen-der: termSim(“gender”, “sex”), sex: 1). Assuming that termSim(“sex”, “gen-der”), which is the same as termSim(“gender”, “sex”), is not equal to zero, thecosine score of the transformed vectors will obviously be different from zero, andwill reflect the similarity between the terms “gender” and “sex”.
For the results reported in the evaluation section, only the Levenshtein simi-larity measure was used. Using a semantic similarity measures based on wordnetsignificantly increasing the algorithm running time with a marginal improvementof quality of the resulting mappings. The running time performance of semanticsimilarity measures based on WordNet, was still unacceptable after restrictingrelated terms to synonyms and hyponyms.
Our approach provides a tigher integration of cosine scoring scheme and aterm similarity measure. In previous work, e.g. Falcon-AO[2], the application ofthe term similarity measure (Levenshtein measure in Falcon-AO) is limited tonames of model elements, and the final score is simply a linear combination ofthe cosine score and the measure of similarity between model element names.
7
4 Evaluation of Model Matching Algorithm
To evaluate the model matching algorithm, we accumulated industry models andcustomer data models from IBM architects who regularly build solutions for cus-tomers. The specific model comparisons we chose were ones that IBM architectsneed mapped in the field. In four cases out of 7 model matching comparisons,the matching had been performed by IBM solutions teams manually. We triedto use these as a ’gold standard’ to evaluate the model matching algorithm, butunfortunately found that in 3 of 4 cases, the quality of the manual model match-ing was exceedingly poor. We address this issue with a tool to assess matchingquality in the next section.
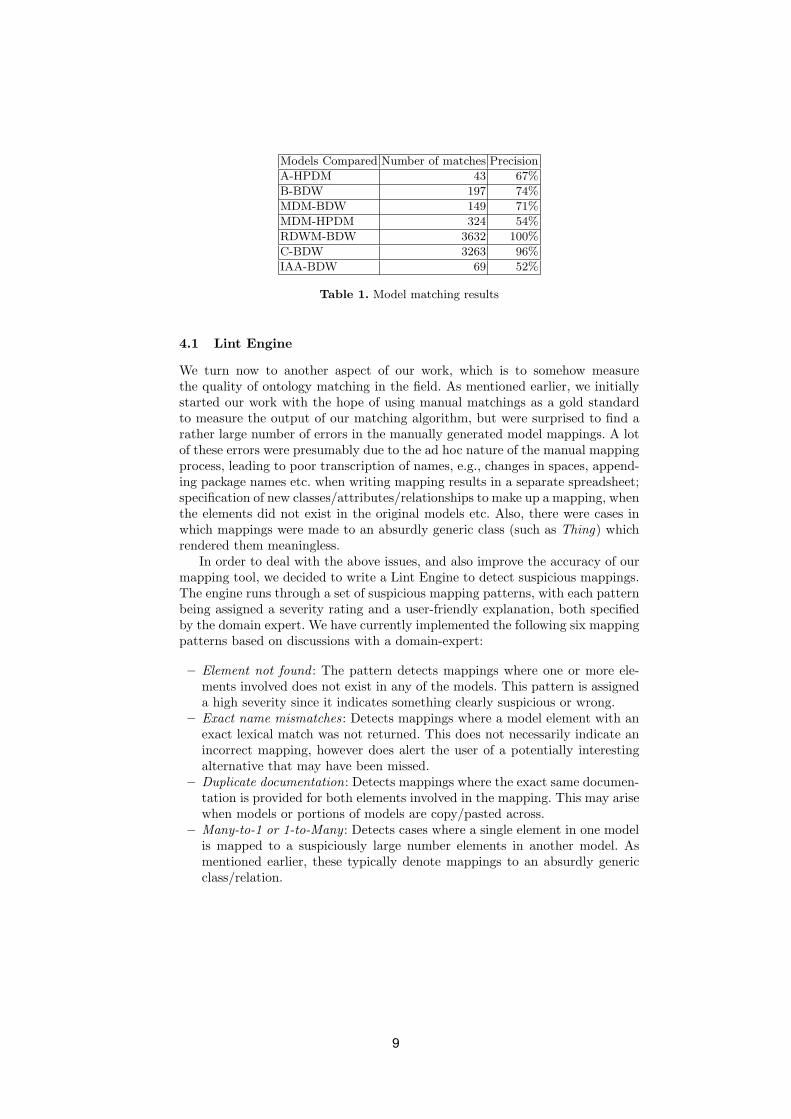
As shown in Table 1, the industry models we used in the comparisons in-cluded BDW (a logical data model for financial services), HPDM (a logical datamodel for healthcare), MDM (a model for the IBM’s solution for master datamanagement), RDWM (a model for warehouse solutions for retail organizations),and IAA (a model for insurance). Model A in the table is a customer ER modelin the healthcare solutions space, model B is a customer logical data model infinancial services, and model C is customer logical data model in retail. To eval-uate our model matching results, we had two IBM architects assess the precisionof the best possible match produced by our algorithm. Manual evaluation of thematches was performed on sample sizes of 100 in 5 of 7 cases (all cases exceptthe IAA-BDW and A-HPDM comparisons). For IAA-BDW, we used a samplesize of 50 because the algorithm produced less than 100 matches. For A-HPDM,we relied on previously created manual mappings to evaluate both precision andrecall (recall was at 25%). The sizes of these models varied from 300 elementsto 5000 elements.
We make two observations about our results:
– (a) The results show a great deal of variability ranging from cases where wehad 100% precision in the top 100 matches, to 52% precision. This reflectedthe degree to which the models shared a common lineage or common vo-cabulary in their development. For example, RDWM was actually derivedfrom BDW, and this is clearly reflected in the model matching results. IAAand BDW target different industries (and therefore do not have much incommon), and this is a scenario where the algorithm tends to make moreerrors. We should point out that although IAA and BDW target differentindustries (insurance and banking respectively), there is a real business needfor mapping common or overlapping concepts across these disparate models,so the matching exercise is not a purely academic one.
– (b) Even in cases where the precision (or recall) was low, the IBM architectsattested to the utility of such a semi-automated approach to model matching,because their current process is entirely manual, tedious and error prone.None of the model mapping tools available to them currently provide resultsthat are usable or verifiable.
8
Models Compared Number of matches Precision
A-HPDM 43 67%
B-BDW 197 74%
MDM-BDW 149 71%
MDM-HPDM 324 54%
RDWM-BDW 3632 100%
C-BDW 3263 96%
IAA-BDW 69 52%
Table 1. Model matching results
4.1 Lint Engine
We turn now to another aspect of our work, which is to somehow measurethe quality of ontology matching in the field. As mentioned earlier, we initiallystarted our work with the hope of using manual matchings as a gold standardto measure the output of our matching algorithm, but were surprised to find arather large number of errors in the manually generated model mappings. A lotof these errors were presumably due to the ad hoc nature of the manual mappingprocess, leading to poor transcription of names, e.g., changes in spaces, append-ing package names etc. when writing mapping results in a separate spreadsheet;specification of new classes/attributes/relationships to make up a mapping, whenthe elements did not exist in the original models etc. Also, there were cases inwhich mappings were made to an absurdly generic class (such as Thing) whichrendered them meaningless.
In order to deal with the above issues, and also improve the accuracy of ourmapping tool, we decided to write a Lint Engine to detect suspicious mappings.The engine runs through a set of suspicious mapping patterns, with each patternbeing assigned a severity rating and a user-friendly explanation, both specifiedby the domain expert. We have currently implemented the following six mappingpatterns based on discussions with a domain-expert:
– Element not found : The pattern detects mappings where one or more ele-ments involved does not exist in any of the models. This pattern is assigneda high severity since it indicates something clearly suspicious or wrong.
– Exact name mismatches : Detects mappings where a model element with anexact lexical match was not returned. This does not necessarily indicate anincorrect mapping, however does alert the user of a potentially interestingalternative that may have been missed.
– Duplicate documentation: Detects mappings where the exact same documen-tation is provided for both elements involved in the mapping. This may arisewhen models or portions of models are copy/pasted across.
– Many-to-1 or 1-to-Many : Detects cases where a single element in one modelis mapped to a suspiciously large number elements in another model. Asmentioned earlier, these typically denote mappings to an absurdly genericclass/relation.
9
– Class-Attribute proliferations: Detects cases when a single class’ attributes/relationsare mapped to attributes/relations of several different classes in the othermodel. What makes this case suspicious is that model mappings are a meansto an end, typically used to specify instance transformations. Transforma-tions can become extremely complex when class-attribute proliferations ex-ist.
– Mapping without documentation: Detects cases where all the elements in-volved in the mapping have no associated documentation. This could arisedue to lexical and structural information playing a role in the mapping,however the lack of documentation points to a potentially weaker match.
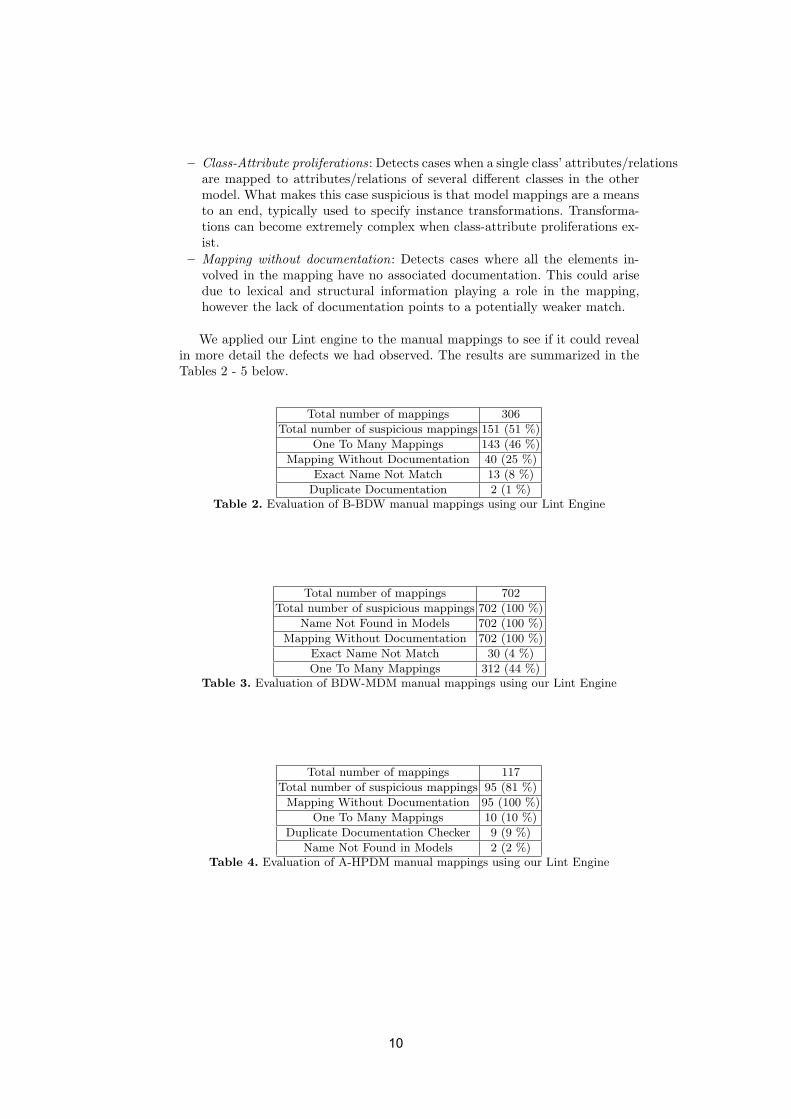
We applied our Lint engine to the manual mappings to see if it could revealin more detail the defects we had observed. The results are summarized in theTables 2 - 5 below.
Total number of mappings 306
Total number of suspicious mappings 151 (51 %)
One To Many Mappings 143 (46 %)
Mapping Without Documentation 40 (25 %)
Exact Name Not Match 13 (8 %)
Duplicate Documentation 2 (1 %)Table 2. Evaluation of B-BDW manual mappings using our Lint Engine
Total number of mappings 702
Total number of suspicious mappings 702 (100 %)
Name Not Found in Models 702 (100 %)
Mapping Without Documentation 702 (100 %)
Exact Name Not Match 30 (4 %)
One To Many Mappings 312 (44 %)Table 3. Evaluation of BDW-MDM manual mappings using our Lint Engine
Total number of mappings 117
Total number of suspicious mappings 95 (81 %)
Mapping Without Documentation 95 (100 %)
One To Many Mappings 10 (10 %)
Duplicate Documentation Checker 9 (9 %)
Name Not Found in Models 2 (2 %)Table 4. Evaluation of A-HPDM manual mappings using our Lint Engine
10
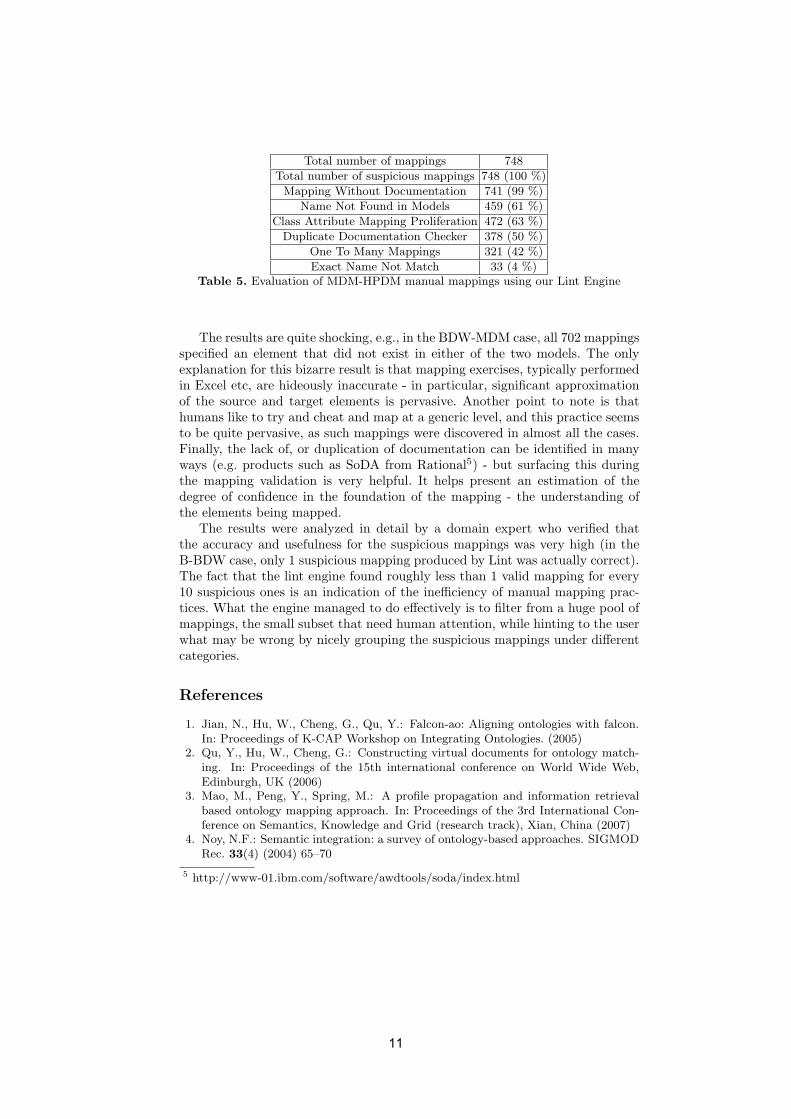
Total number of mappings 748
Total number of suspicious mappings 748 (100 %)
Mapping Without Documentation 741 (99 %)
Name Not Found in Models 459 (61 %)
Class Attribute Mapping Proliferation 472 (63 %)
Duplicate Documentation Checker 378 (50 %)
One To Many Mappings 321 (42 %)
Exact Name Not Match 33 (4 %)Table 5. Evaluation of MDM-HPDM manual mappings using our Lint Engine
The results are quite shocking, e.g., in the BDW-MDM case, all 702 mappingsspecified an element that did not exist in either of the two models. The onlyexplanation for this bizarre result is that mapping exercises, typically performedin Excel etc, are hideously inaccurate - in particular, significant approximationof the source and target elements is pervasive. Another point to note is thathumans like to try and cheat and map at a generic level, and this practice seemsto be quite pervasive, as such mappings were discovered in almost all the cases.Finally, the lack of, or duplication of documentation can be identified in manyways (e.g. products such as SoDA from Rational5) - but surfacing this duringthe mapping validation is very helpful. It helps present an estimation of thedegree of confidence in the foundation of the mapping - the understanding ofthe elements being mapped.
The results were analyzed in detail by a domain expert who verified thatthe accuracy and usefulness for the suspicious mappings was very high (in theB-BDW case, only 1 suspicious mapping produced by Lint was actually correct).The fact that the lint engine found roughly less than 1 valid mapping for every10 suspicious ones is an indication of the inefficiency of manual mapping prac-tices. What the engine managed to do effectively is to filter from a huge pool ofmappings, the small subset that need human attention, while hinting to the userwhat may be wrong by nicely grouping the suspicious mappings under differentcategories.
References
1. Jian, N., Hu, W., Cheng, G., Qu, Y.: Falcon-ao: Aligning ontologies with falcon.In: Proceedings of K-CAP Workshop on Integrating Ontologies. (2005)
2. Qu, Y., Hu, W., Cheng, G.: Constructing virtual documents for ontology match-ing. In: Proceedings of the 15th international conference on World Wide Web,Edinburgh, UK (2006)
3. Mao, M., Peng, Y., Spring, M.: A profile propagation and information retrievalbased ontology mapping approach. In: Proceedings of the 3rd International Con-ference on Semantics, Knowledge and Grid (research track), Xian, China (2007)
4. Noy, N.F.: Semantic integration: a survey of ontology-based approaches. SIGMODRec. 33(4) (2004) 65–70
5 http://www-01.ibm.com/software/awdtools/soda/index.html
11
5. Kolaitis, P.G.: Schema mappings, data exchange, and metadata management. In:Proceedings of the 24th ACM SIGACT-SIGMOD-SIGART Symposium on Princi-ples of Database Systems, Baltimore, Maryland (2005)
6. Bernstein, P.A., Melnik, S.: Model management 2.0: manipulating richer mappings.In: Proceedings of the ACM SIGMOD International Conference on Managementof Data, Beijing, China (2007)
7. Doan, A., Madhavan, J., Dhamankar, R., Domingos, P., Halevy, A.: Learning tomatch ontologies on the semantic web. The VLDB Journal 12(4) (2003) 303–319
8. Noy, N.F., Musen, M.A.: Prompt: Algorithm and tool for automated ontologymerging and alignment. In: Proceedings of the Seventeenth National Conferenceon Artificial Intelligence and Twelfth Conference on on Innovative Applications ofArtificial Intelligence, Austin, Texas, USA (2000)
9. Kotis, K., Vouros, G., Stergiou, K.: Capturing semanticstowards automatic coor-dination of domain ontologies. In: AIMSA. (2004) 22–32
10. Lambrix, P., Tan, H.: Sambo-a system for aligning and merging biomedical on-tologies. Web Semant. 4(3) (2006) 196–206
11. Madhavan, J., Bernstein, P.A., Rahm, E.: Generic schema matching with cupid.In: VLDB ’01: Proceedings of the 27th International Conference on Very LargeData Bases, San Francisco, CA, USA, Morgan Kaufmann Publishers Inc. (2001)49–58
12. Castano, S., De Antonellis, V., De Capitani di Vimercati, S.: Global viewing ofheterogeneous data sources. IEEE Trans. on Knowl. and Data Eng. 13(2) (2001)277–297
13. Miller, R.J., Haas, L.M., Hernandez, M.A.: Schema mapping as query discovery.In: Proceedings of 26th International Conference on Very Large Data Bases, Cairo,Egypt (2000)
14. Miller, R.J., Hernandez, M.A., Haas, L.M., Yan, L.L., Ho, C.T.H., Fagin, R., Popa,L.: The clio project: Managing heterogeneity. SIGMOD Record 30(1) (2001)
15. Bernstein, P.A., Ho, H.: Model management and schema mappings: Theory andpractice. In: Proceedings of the 33rd International Conference on Very Large DataBases, University of Vienna, Austria (2007)
16. Hernandez, M.A., Popa, L., Ho, H., Naumann, F.: Clio: A schema mapping tool forinformation integration. In: Proceedings of the 8th International Symposium onParallel Architectures, Algorithms and Networks, Las Vegas, Nevada, USA (2005)
17. Raghavan, V.V., Wong, S.K.M.: A critical analysis of vector space model forinformation retrieval. Journal of the American Society for Information Science37(5) (January 1999) 279–287
18. Jiang, J.J., Conrath, D.W.: Semantic similarity based on corpus statistics andlexical taxonomy. CoRR cmp-lg/9709008 (1997)
19. Lin, D.: An information-theoretic definition of similarity. In: ICML ’98: Proceed-ings of the Fifteenth International Conference on Machine Learning, San Francisco,CA, USA, Morgan Kaufmann Publishers Inc. (1998) 296–304
12
Mapping-Chains for studying Concept Shift in
Political Ontologies
Shenghui Wang12, Stefan Schlobach2, Janet Takens1, and Wouter vanAtteveldt1
1 Department of Communication Science2 Department of Computer Science
Vrije Universiteit Amsterdam
Abstract. For some years now ontologies have been used in Social Sci-ence, e.g. , in annotation of newspaper articles for disambiguating con-cepts within Media Analysis. These ontologies and annotations have nowbecome objects of study in their own right, as they implicitly repre-sent the shift of meaning of political concept over time. Manual map-pings, which are intrinsically intensional, can hardly capture such subtlechanges, but we claim that automatic instance-based mappings, withtheir extensional character, are more suitable for producing interestingmapping-chains.In this paper, we evaluate the use of instance-based ontology mappingsfor producing concept chains in a case-study in Communication Scienceon a corpus with ontologies describing the Dutch election campaigns since1994. This initial research shows the potential of the associative characterof extensional mapping-chains, but also indicates a number of unsolvedopen questions, most significantly the lack of a proper methodology forevaluating such chains due to the open, explorative character of the task.
1 Introduction
Since 1994 Communications Scientists at the Vrije Universiteit Amsterdam havebeen annotating newspaper articles with controlled vocabularies (of increasingexpressiveness) quantitatively studying the influence of the Media on the polit-ical processes. The idea is to code the meaning of sentences and articles in aformalised graph representation (called NET) similar to RDF triples. In thesetriples actors and issues are taken from an ontology, and the predicate usuallyrepresents opinions and moods. During recent election campaigns all newspaperarticles on Dutch politics were manually coded using the NET method, with adifferent ontology used in each of the elections. Each ontology is more or less anadaptation of a previous one, with different foci, as in each election new issuesemerged and the (societies’ and scientists’) view on issues changed.
As now several of these campaign data sets can easily be queried, also throughthe use of Semantic Web technology, Communication Scientists’ interests startedto also include temporal shifts of political development. In an initial analysis po-litical developments over time were studied by querying the NET representation
13
of the articles from the different campaigns, which required manual mappingsbetween the ontologies. In this paper, we propose a different approach, namelyto study concept shift by using chains of extensional, i.e. , instance-based, map-pings. Our hypothesis is that these mapping-chains represent subtle changes inmeaning of the related concepts over time, and in this paper we will investigatethis claim.
Methodology Following our previous work [1] we use information retrieval tech-niques to calculate document similarity between annotated articles, which weuse subsequently to identify similarity between concepts. Chains between themost similar of these concepts thus produce graph-like structures (lines, trees,or DAGs), which “tell their own” story of Dutch politics over the past 15 years.
Research questions There are two major research questions, one regarding thecorrectness of our hypothesis, the second concerning the validity of our approach.More concretely we have to investigate:
– RQ1: What are suitable structures for representing mapping chains?– RQ2: Can instance-based ontology mapping provide useful mapping-chains
expressing concept shift, and how can we evaluate those chains?
The second research questions relates to a fundamental methodological issue,for which no simple answers exist: the vague character of the success criteriausefulness. To answer RQ2 we will argue for usefulness through qualitative ev-idence, namely by providing some detailed analyses of chains in a real use-case.Automatically evaluating quality of chains is even more difficult. Remember thatwe want to use the extensional semantics of the concepts for determining themappings, which makes the only comparison we have, namely an intensionalgold-standard, difficult to justify. In our use-case, the line between what wasidentified to be a correct extensional mapping and what was an incorrect associ-ation was very fine, and studying this friction will be in our view an importantfuture topic for this type of research.
Data, experiments and evaluation For our experiments we used 5 different on-tologies from the Dutch election campaigns in 1994, 1998, 2002, 2003 and 2006.Our experiment were conducted by mapping each of ontologies with each other.Each ontology was used to annotate (around 5000) newspaper articles of the re-spective campaign. Some initial formal evaluation was done by comparing map-pings with an existing manually created (intensional) alignment. Evaluating thequality of the chains is more tricky, as we will discuss in Section 5.3. The answerto RQ2 therefore remains anecdotal, and finally rather unsatisfactory.
Applications and generality Capturing meaning shift, particularly the exten-sional associations, of concepts over time, can help communication scientists toapply analysis on the dynamics of the political developments over time. This lineof research is also generalisable in many other areas where similar problems oc-cur, such as development of medical systems, e-Science, knowledge management,and other social networks, etc.
14
2 Instance-based matching method
Instance-based ontology matching techniques have shown its capacity of dealingwith matching cases where lexical and structural techniques could not be appliedeffectively [2, 3]. A straightforward method is to measure the common extensionof concepts [4, 5]. The major limitation of this method is usually a lack of sharedinstances. Recently, we have investigated ways of detecting concept correlationusing the similarity between their instances [2, 1]. In our case, coders used con-cepts to describe the content of newspaper articles. We consider an article as aninstance of a concept, if the concept is used to describe this article. Our hypoth-esis is that, even if the ontologies during different election periods are different,two similar articles should have been coded using similar concepts. Therefore,finding similar instances can lead to similar concepts.
Let O1 and O2 be two ontologies which are used to annotate two instancesets I1 and I2. The instance-matching based method consists of two steps:
– Instance enrichment. For each instance i1 in I1, find the most similar instancej2 in I2. We consider i1 to be an instance of the concepts which j2 is describedwith. The same operation is applied in the other direction. In the end, anartificial common instance set is built.
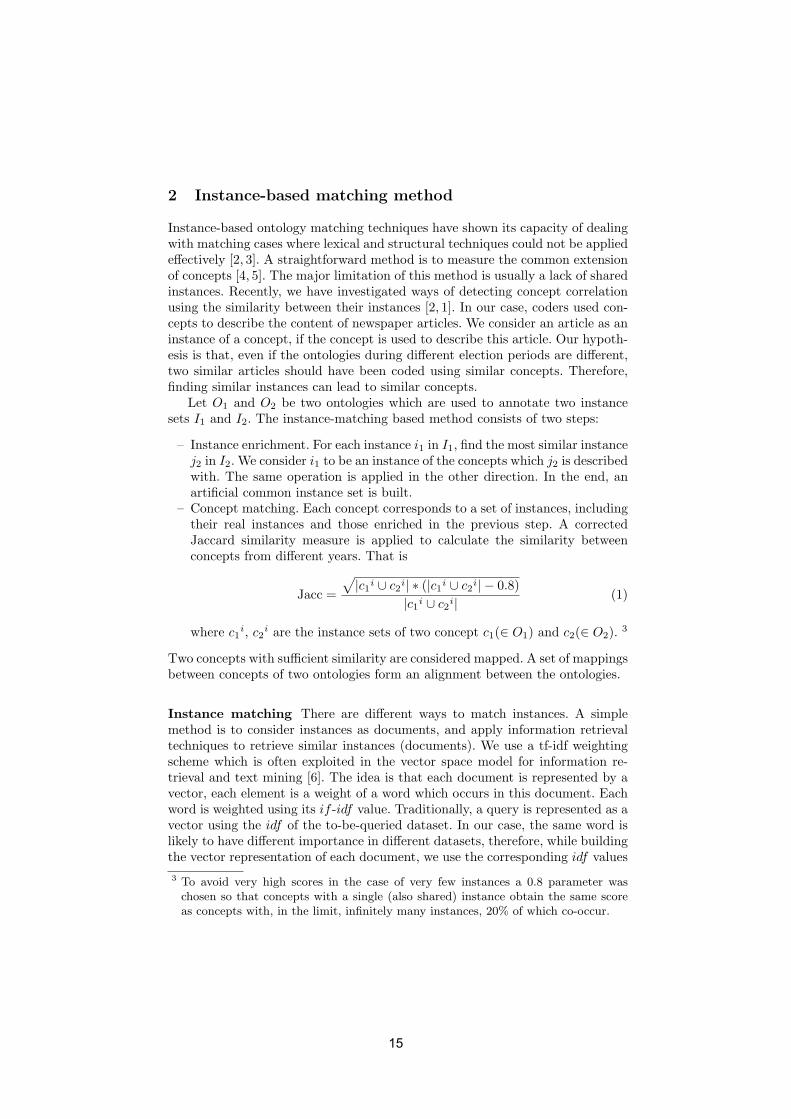
– Concept matching. Each concept corresponds to a set of instances, includingtheir real instances and those enriched in the previous step. A correctedJaccard similarity measure is applied to calculate the similarity betweenconcepts from different years. That is
Jacc =
√|c1i ∪ c2
i| ∗ (|c1i ∪ c2
i| − 0.8)
|c1i ∪ c2
i| (1)
where c1i, c2
i are the instance sets of two concept c1(∈ O1) and c2(∈ O2).3
Two concepts with sufficient similarity are considered mapped. A set of mappingsbetween concepts of two ontologies form an alignment between the ontologies.
Instance matching There are different ways to match instances. A simplemethod is to consider instances as documents, and apply information retrievaltechniques to retrieve similar instances (documents). We use a tf-idf weightingscheme which is often exploited in the vector space model for information re-trieval and text mining [6]. The idea is that each document is represented by avector, each element is a weight of a word which occurs in this document. Eachword is weighted using its if -idf value. Traditionally, a query is represented as avector using the idf of the to-be-queried dataset. In our case, the same word islikely to have different importance in different datasets, therefore, while buildingthe vector representation of each document, we use the corresponding idf values
3 To avoid very high scores in the case of very few instances a 0.8 parameter waschosen so that concepts with a single (also shared) instance obtain the same scoreas concepts with, in the limit, infinitely many instances, 20% of which co-occur.
15
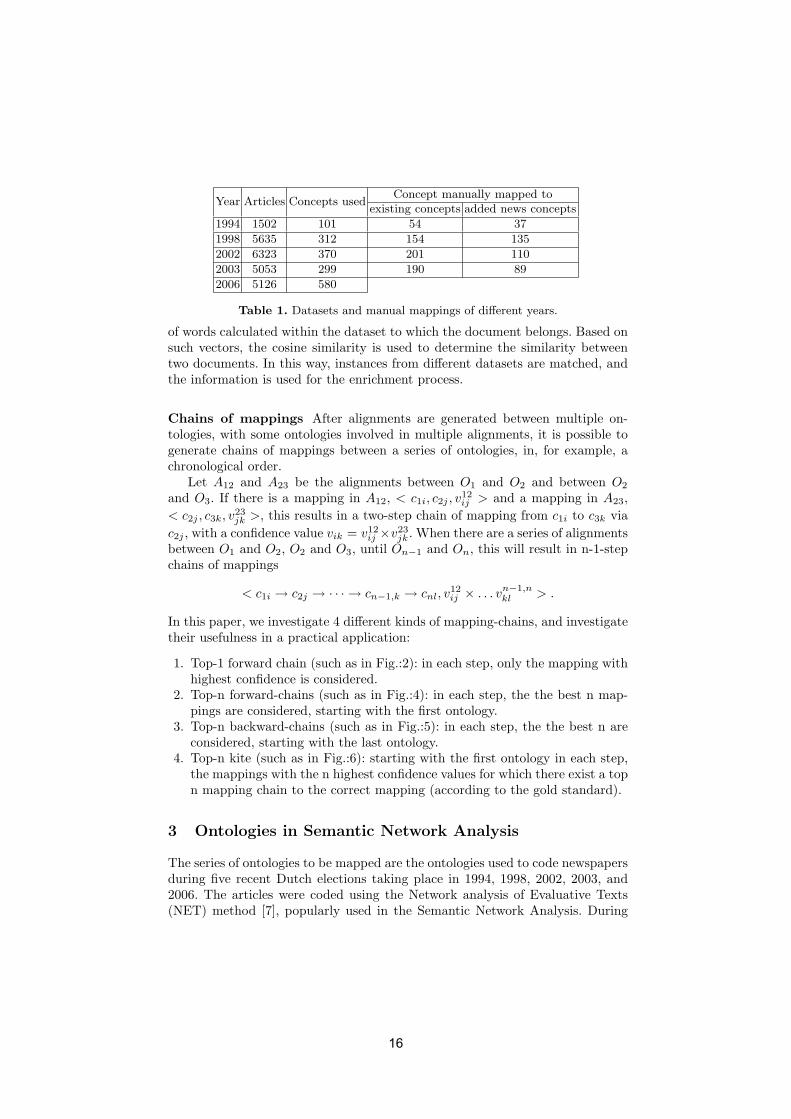
Year Articles Concepts usedConcept manually mapped to
existing concepts added news concepts
1994 1502 101 54 37
1998 5635 312 154 135
2002 6323 370 201 110
2003 5053 299 190 89
2006 5126 580
Table 1. Datasets and manual mappings of different years.
of words calculated within the dataset to which the document belongs. Based onsuch vectors, the cosine similarity is used to determine the similarity betweentwo documents. In this way, instances from different datasets are matched, andthe information is used for the enrichment process.
Chains of mappings After alignments are generated between multiple on-tologies, with some ontologies involved in multiple alignments, it is possible togenerate chains of mappings between a series of ontologies, in, for example, achronological order.
Let A12 and A23 be the alignments between O1 and O2 and between O2
and O3. If there is a mapping in A12, < c1i, c2j , v12ij > and a mapping in A23,
< c2j , c3k, v23
jk >, this results in a two-step chain of mapping from c1i to c3k via
c2j , with a confidence value vik = v12ij ×v23
jk . When there are a series of alignmentsbetween O1 and O2, O2 and O3, until On−1 and On, this will result in n-1-stepchains of mappings
< c1i → c2j → · · · → cn−1,k → cnl, v12
ij × . . . vn−1,nkl > .
In this paper, we investigate 4 different kinds of mapping-chains, and investigatetheir usefulness in a practical application:
1. Top-1 forward chain (such as in Fig.:2): in each step, only the mapping withhighest confidence is considered.
2. Top-n forward-chains (such as in Fig.:4): in each step, the the best n map-pings are considered, starting with the first ontology.
3. Top-n backward-chains (such as in Fig.:5): in each step, the the best n areconsidered, starting with the last ontology.
4. Top-n kite (such as in Fig.:6): starting with the first ontology in each step,the mappings with the n highest confidence values for which there exist a topn mapping chain to the correct mapping (according to the gold standard).
3 Ontologies in Semantic Network Analysis
The series of ontologies to be mapped are the ontologies used to code newspapersduring five recent Dutch elections taking place in 1994, 1998, 2002, 2003, and2006. The articles were coded using the Network analysis of Evaluative Texts(NET) method [7], popularly used in the Semantic Network Analysis. During
16
each election year, annotators coded newspaper articles using the ontology avail-able to them. Take as an example a sentence in a newspaper article during theelection period in 2006.
Example 1. Het Openbaar Ministerie (OM) wil de komende vier jaar mensen-handel uitroeien. (The Justice Department (OM) wants to eliminate human traf-ficking within the next four years.)
The sentence is coded as <om, -1,human trafficking>, where om and humantrafficking are two concepts in the ontology used in 2006, while -1 indicatesthe Justice Department is negative about human trafficking. In this example, weconsider this sentence to be an instance of the two concepts involved. All fiveontologies are represented in the standard SKOS format [8]. Each concept hasan prefLabel and possibly a few altLabel which are the synonyms of this conceptand also used by coders in the coding process. Except the most recent election,all the newspapers are coded at the article level, but mainly based on the firstthree sentences. In 2006, the coding is at the sentence level.
The synonymous concepts were found manually. As shown in Table 1, thenumber of manually mapped concepts is smaller than that of concepts foundin the actual coding. The reason is that new variations of the concepts weremanually input to the database. These variations are very likely to be synonymsof concepts in the ontologies or pure typos, which were not covered during themanual mapping process.
Alignments between ontologies of previous years to the latest 2006 versionhave also been made manually. However, some concepts used in previous yearscannot find the exact correspondences in the 2006 version. In that case, thedomain experts added new concepts to the current version. The last columnof Table 1 indicates how many new concepts were added during the manualaligning process. These new concepts are not used during the coding of 2006articles, which means they do not have any instances in the 2006 corpus andwere therefore not considered in our automated evaluation.
4 Base experiments: single mappings
Before focussing on chains of mappings, we need to show that our methodsfor calculating individual mappings are trustworthy. We first map all previousontologies to the 2006 ontology. According to the extensional mapping technique,one concept can be related to multiple concepts, each with a certain amountof relatedness. As only one mapping for each concept was considered in themanual mapping results, for each concept, we take the mapping with the highestconfidence value (i.e. , the corrected Jaccard similarity) as the final mapping ofthis concept. Table 2 shows precision and recall of these 1:1 mappings.
For all the concepts which were manually mapped with existing concepts inthe 2006 ontology, we also measure the mean reciprocal rank (MRR) mrr =1
|C|∑C
i=1
1
ranki, where C is the set of concepts, the ranki is the rank of the
concept which Ci should be mapped to. When Ci does not have a match, the
17
Year Precision Recall Year Precision Recall1994 0.22 0.22 1998 0.33 0.332002 0.36 0.35 2003 0.4 0.4
Table 2. Evaluation of 1:1 mappings based on the sentence and article level
YearConceptsFound
Conceptsmatched
MRR YearConceptsFound
Conceptsmatched
MRR
1994 532 39 0.41 1998 561 102 0.472002 570 143 0.54 2003 570 136 0.58
Table 3. Mean Reciprocal Rank: from 2006 to the previous years, where “ConceptsFound” is the number of concepts for which we have found some mappings, “Conceptsmatched” is the number of concepts for which we have recovered the correct mapping.
reciprocal rank is set to 0. A higher mrr indicates the correct matches are rankedin the more front position. Table 3 shows that the correct mapping is ranked onaverage within the top 10 proposed ones.
5 Main experiments: Chains of mappings
The main topic of this paper is to investigate the use of chains of mappings ofconcepts from ontologies from 1994 to 2006.
5.1 Quantitative analysis
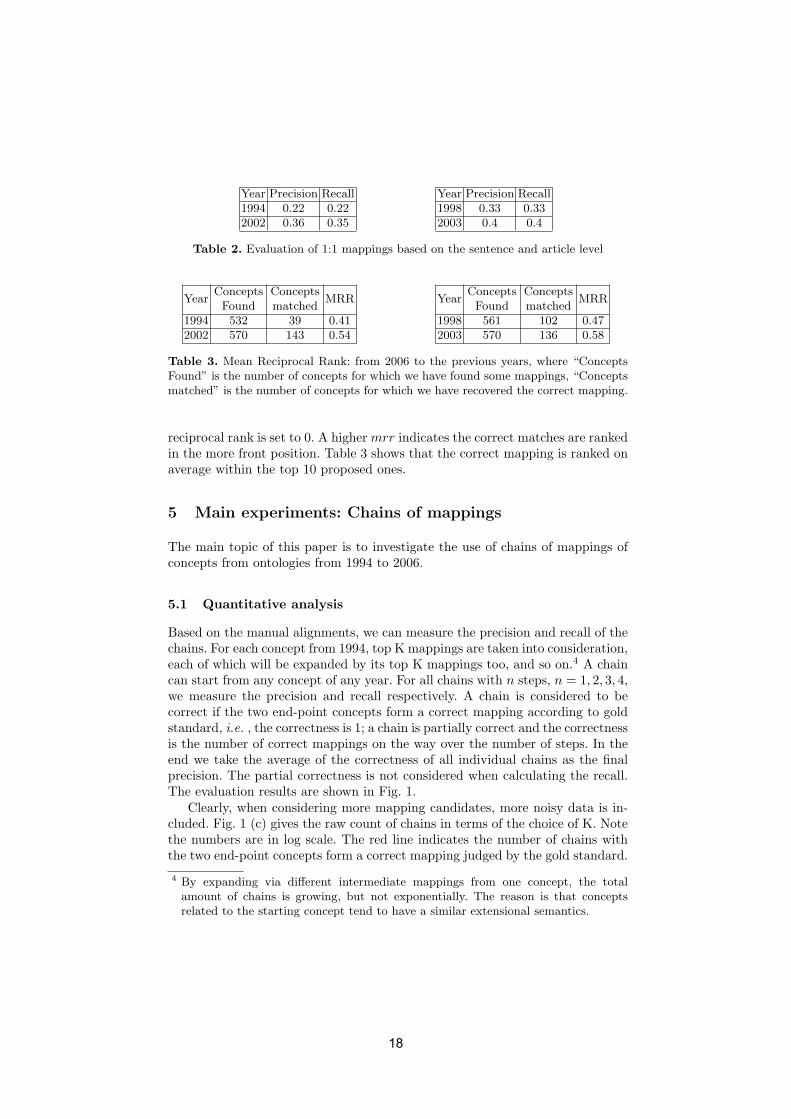
Based on the manual alignments, we can measure the precision and recall of thechains. For each concept from 1994, top K mappings are taken into consideration,each of which will be expanded by its top K mappings too, and so on.4 A chaincan start from any concept of any year. For all chains with n steps, n = 1, 2, 3, 4,we measure the precision and recall respectively. A chain is considered to becorrect if the two end-point concepts form a correct mapping according to goldstandard, i.e. , the correctness is 1; a chain is partially correct and the correctnessis the number of correct mappings on the way over the number of steps. In theend we take the average of the correctness of all individual chains as the finalprecision. The partial correctness is not considered when calculating the recall.The evaluation results are shown in Fig. 1.
Clearly, when considering more mapping candidates, more noisy data is in-cluded. Fig. 1 (c) gives the raw count of chains in terms of the choice of K. Notethe numbers are in log scale. The red line indicates the number of chains withthe two end-point concepts form a correct mapping judged by the gold standard.
4 By expanding via different intermediate mappings from one concept, the totalamount of chains is growing, but not exponentially. The reason is that conceptsrelated to the starting concept tend to have a similar extensional semantics.
18
(a) Precision (b) Recall (c) Raw count
Fig. 1. Performance of the mapping chains. The x-axis indicates, for each concept, thetop K related concepts are considered.
If only taking top 1, 2 or 3 related concepts, when the steps goes up, the numberof correct chains drop, but the total amount of chains drops even faster. Theprecision of multi-step chains is actually higher than that of shorter chains. Thissuggests, even the absolute correctness of direct mappings may not be perfect,a multi-step chains of less perfect mappings may still lead to correct mappingsover all time. Unfortunately, when taking more less related concepts, the numberof correct chains goes up, but the sheer amount of total chains climbs up morerapidly, which cause the precision to drop in the end; the precision of multi-stepchains is lower than that of shorter chains, that is the quality of the mappingsdegraded when the intermediate steps became longer.
5.2 Qualitative analysis of chains
A qualitative analysis of chains of mappings provides interesting insights in thevalue of the matching of ontologies over time for social sciences. A typical exam-ple of mapping of concepts over time will be discussed. The domain-specific
political analysis will be supplemented by a methodological discussion (we callit Metaanalysis provided in italics) from the perspective of the usefulness ofmapping-chains.
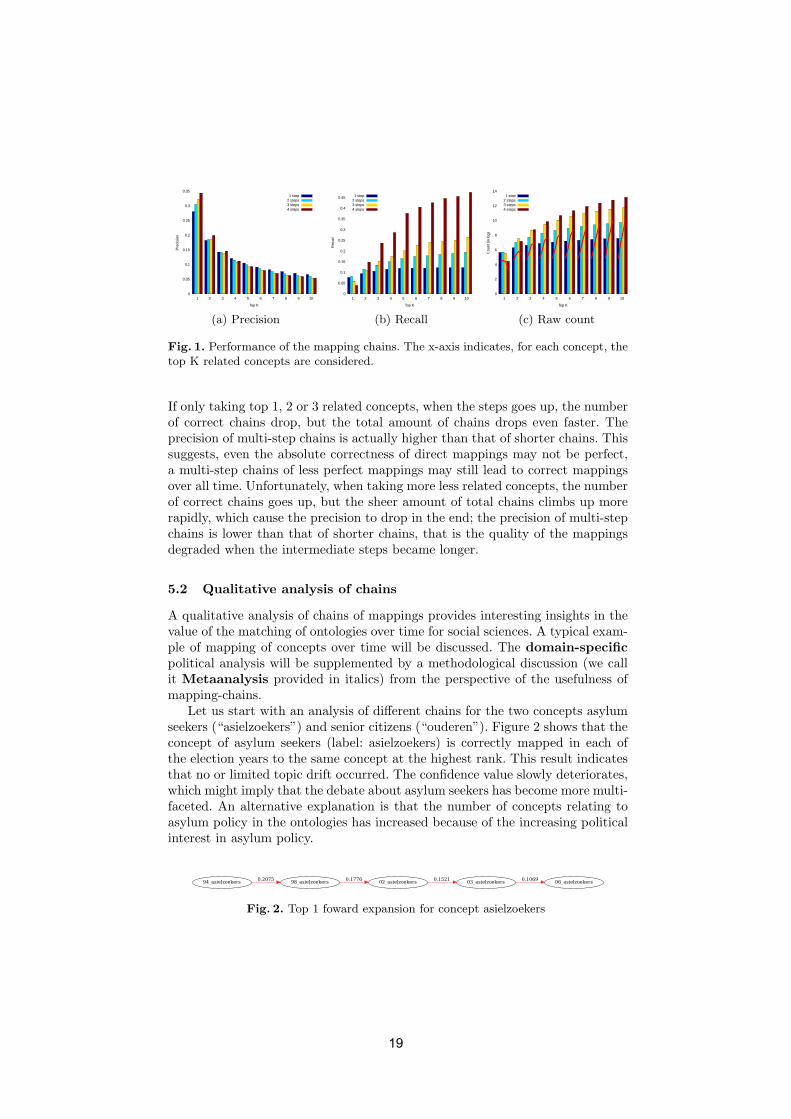
Let us start with an analysis of different chains for the two concepts asylumseekers (“asielzoekers”) and senior citizens (“ouderen”). Figure 2 shows that theconcept of asylum seekers (label: asielzoekers) is correctly mapped in each ofthe election years to the same concept at the highest rank. This result indicatesthat no or limited topic drift occurred. The confidence value slowly deteriorates,which might imply that the debate about asylum seekers has become more multi-faceted. An alternative explanation is that the number of concepts relating toasylum policy in the ontologies has increased because of the increasing politicalinterest in asylum policy.
Fig. 2. Top 1 foward expansion for concept asielzoekers
19
Metaanalysis 1: Even from a simple top 1 forward chain, some lessons canbe drawn. However, note that analyses of this kind depend on the confidencevalues, which are rather dubious at best. Top 1 chains are more interestingobjects of study when more drastic shifts occur.
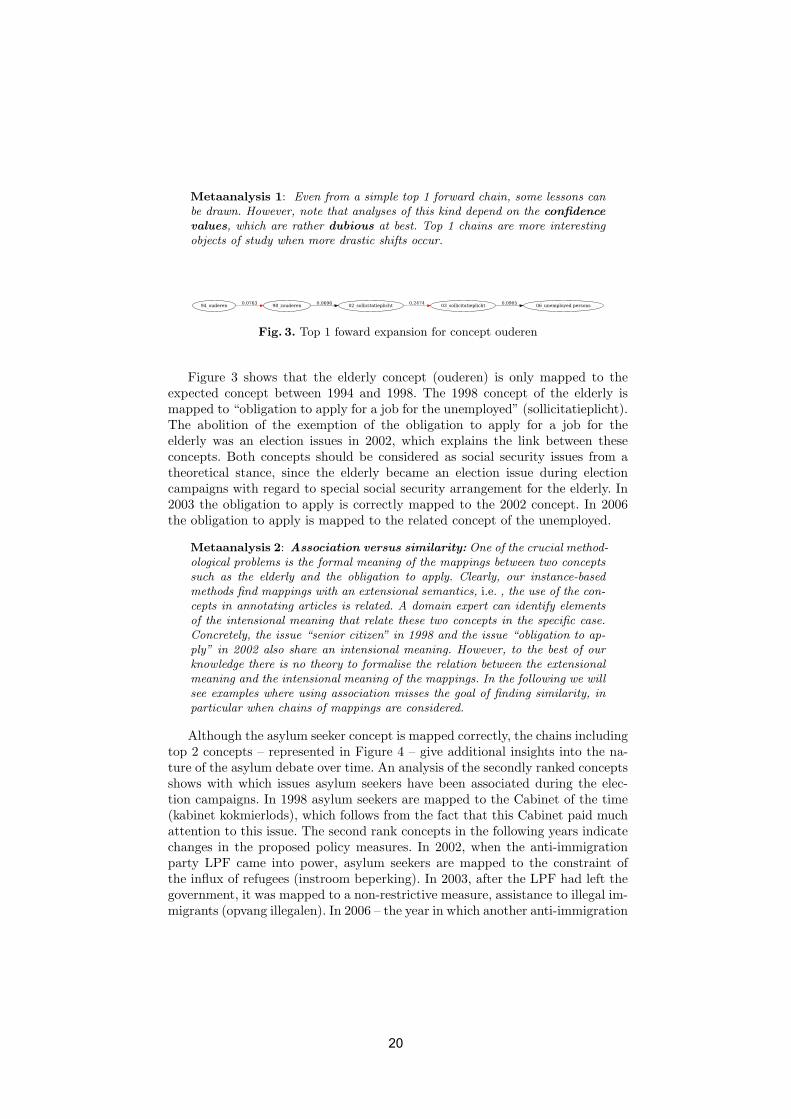
Fig. 3. Top 1 foward expansion for concept ouderen
Figure 3 shows that the elderly concept (ouderen) is only mapped to theexpected concept between 1994 and 1998. The 1998 concept of the elderly ismapped to “obligation to apply for a job for the unemployed” (sollicitatieplicht).The abolition of the exemption of the obligation to apply for a job for theelderly was an election issues in 2002, which explains the link between theseconcepts. Both concepts should be considered as social security issues from atheoretical stance, since the elderly became an election issue during electioncampaigns with regard to special social security arrangement for the elderly. In2003 the obligation to apply is correctly mapped to the 2002 concept. In 2006the obligation to apply is mapped to the related concept of the unemployed.
Metaanalysis 2: Association versus similarity: One of the crucial method-ological problems is the formal meaning of the mappings between two conceptssuch as the elderly and the obligation to apply. Clearly, our instance-basedmethods find mappings with an extensional semantics, i.e. , the use of the con-cepts in annotating articles is related. A domain expert can identify elementsof the intensional meaning that relate these two concepts in the specific case.Concretely, the issue “senior citizen” in 1998 and the issue “obligation to ap-ply” in 2002 also share an intensional meaning. However, to the best of ourknowledge there is no theory to formalise the relation between the extensionalmeaning and the intensional meaning of the mappings. In the following we willsee examples where using association misses the goal of finding similarity, inparticular when chains of mappings are considered.
Although the asylum seeker concept is mapped correctly, the chains includingtop 2 concepts – represented in Figure 4 – give additional insights into the na-ture of the asylum debate over time. An analysis of the secondly ranked conceptsshows with which issues asylum seekers have been associated during the elec-tion campaigns. In 1998 asylum seekers are mapped to the Cabinet of the time(kabinet kokmierlods), which follows from the fact that this Cabinet paid muchattention to this issue. The second rank concepts in the following years indicatechanges in the proposed policy measures. In 2002, when the anti-immigrationparty LPF came into power, asylum seekers are mapped to the constraint ofthe influx of refugees (instroom beperking). In 2003, after the LPF had left thegovernment, it was mapped to a non-restrictive measure, assistance to illegal im-migrants (opvang illegalen). In 2006 – the year in which another anti-immigration
20
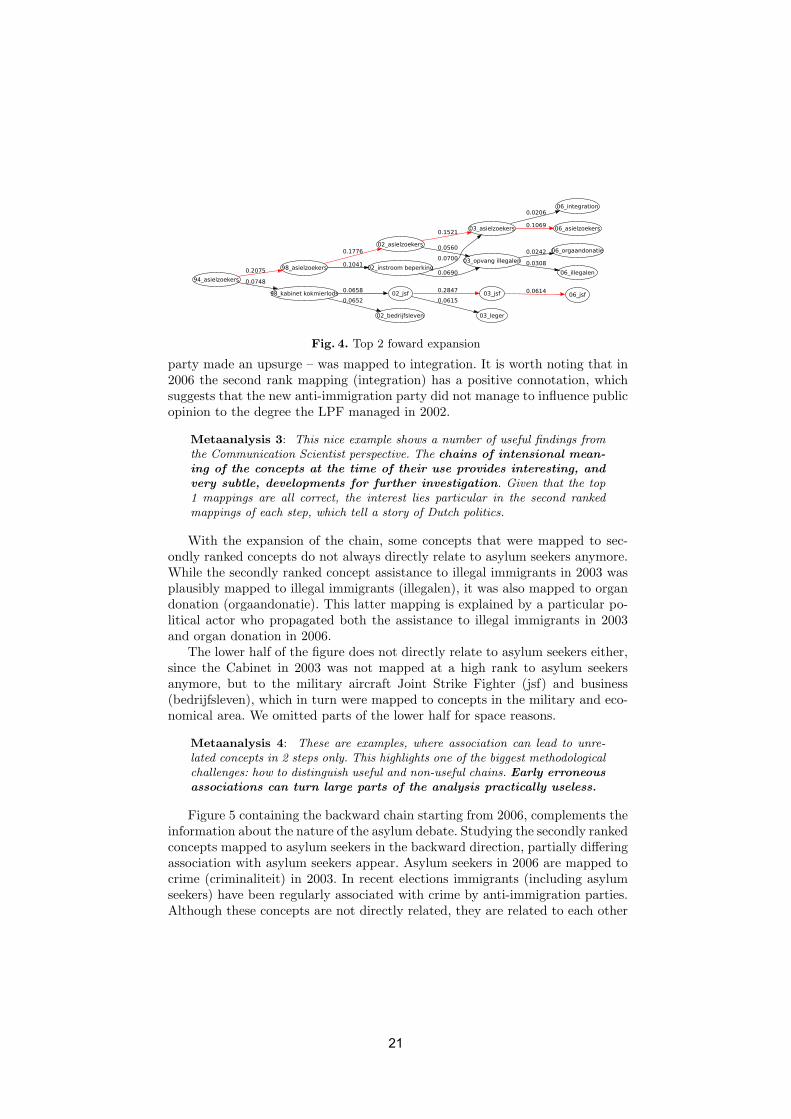
Fig. 4. Top 2 foward expansion
party made an upsurge – was mapped to integration. It is worth noting that in2006 the second rank mapping (integration) has a positive connotation, whichsuggests that the new anti-immigration party did not manage to influence publicopinion to the degree the LPF managed in 2002.
Metaanalysis 3: This nice example shows a number of useful findings fromthe Communication Scientist perspective. The chains of intensional mean-ing of the concepts at the time of their use provides interesting, andvery subtle, developments for further investigation. Given that the top1 mappings are all correct, the interest lies particular in the second rankedmappings of each step, which tell a story of Dutch politics.
With the expansion of the chain, some concepts that were mapped to sec-ondly ranked concepts do not always directly relate to asylum seekers anymore.While the secondly ranked concept assistance to illegal immigrants in 2003 wasplausibly mapped to illegal immigrants (illegalen), it was also mapped to organdonation (orgaandonatie). This latter mapping is explained by a particular po-litical actor who propagated both the assistance to illegal immigrants in 2003and organ donation in 2006.
The lower half of the figure does not directly relate to asylum seekers either,since the Cabinet in 2003 was not mapped at a high rank to asylum seekersanymore, but to the military aircraft Joint Strike Fighter (jsf) and business(bedrijfsleven), which in turn were mapped to concepts in the military and eco-nomical area. We omitted parts of the lower half for space reasons.
Metaanalysis 4: These are examples, where association can lead to unre-lated concepts in 2 steps only. This highlights one of the biggest methodologicalchallenges: how to distinguish useful and non-useful chains. Early erroneousassociations can turn large parts of the analysis practically useless.
Figure 5 containing the backward chain starting from 2006, complements theinformation about the nature of the asylum debate. Studying the secondly rankedconcepts mapped to asylum seekers in the backward direction, partially differingassociation with asylum seekers appear. Asylum seekers in 2006 are mapped tocrime (criminaliteit) in 2003. In recent elections immigrants (including asylumseekers) have been regularly associated with crime by anti-immigration parties.Although these concepts are not directly related, they are related to each other
21
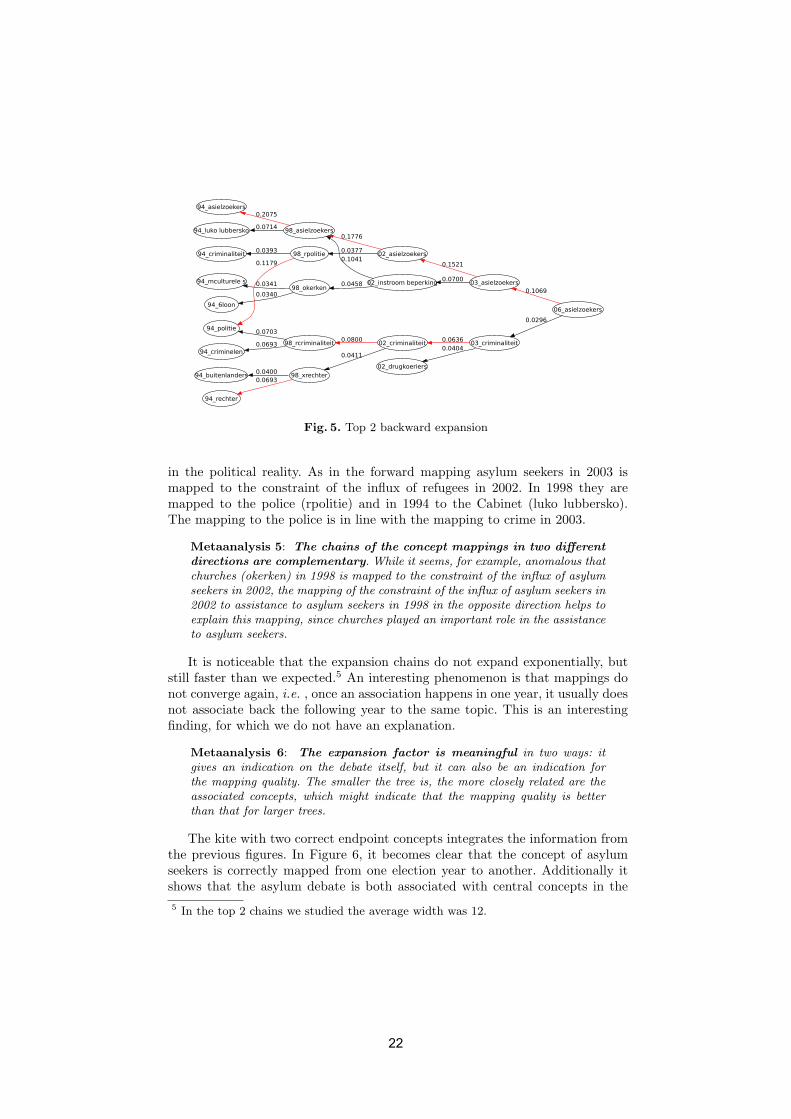
Fig. 5. Top 2 backward expansion
in the political reality. As in the forward mapping asylum seekers in 2003 ismapped to the constraint of the influx of refugees in 2002. In 1998 they aremapped to the police (rpolitie) and in 1994 to the Cabinet (luko lubbersko).The mapping to the police is in line with the mapping to crime in 2003.
Metaanalysis 5: The chains of the concept mappings in two differentdirections are complementary. While it seems, for example, anomalous thatchurches (okerken) in 1998 is mapped to the constraint of the influx of asylumseekers in 2002, the mapping of the constraint of the influx of asylum seekers in2002 to assistance to asylum seekers in 1998 in the opposite direction helps toexplain this mapping, since churches played an important role in the assistanceto asylum seekers.
It is noticeable that the expansion chains do not expand exponentially, butstill faster than we expected.5 An interesting phenomenon is that mappings donot converge again, i.e. , once an association happens in one year, it usually doesnot associate back the following year to the same topic. This is an interestingfinding, for which we do not have an explanation.
Metaanalysis 6: The expansion factor is meaningful in two ways: itgives an indication on the debate itself, but it can also be an indication forthe mapping quality. The smaller the tree is, the more closely related are theassociated concepts, which might indicate that the mapping quality is betterthan that for larger trees.
The kite with two correct endpoint concepts integrates the information fromthe previous figures. In Figure 6, it becomes clear that the concept of asylumseekers is correctly mapped from one election year to another. Additionally itshows that the asylum debate is both associated with central concepts in the
5 In the top 2 chains we studied the average width was 12.
22
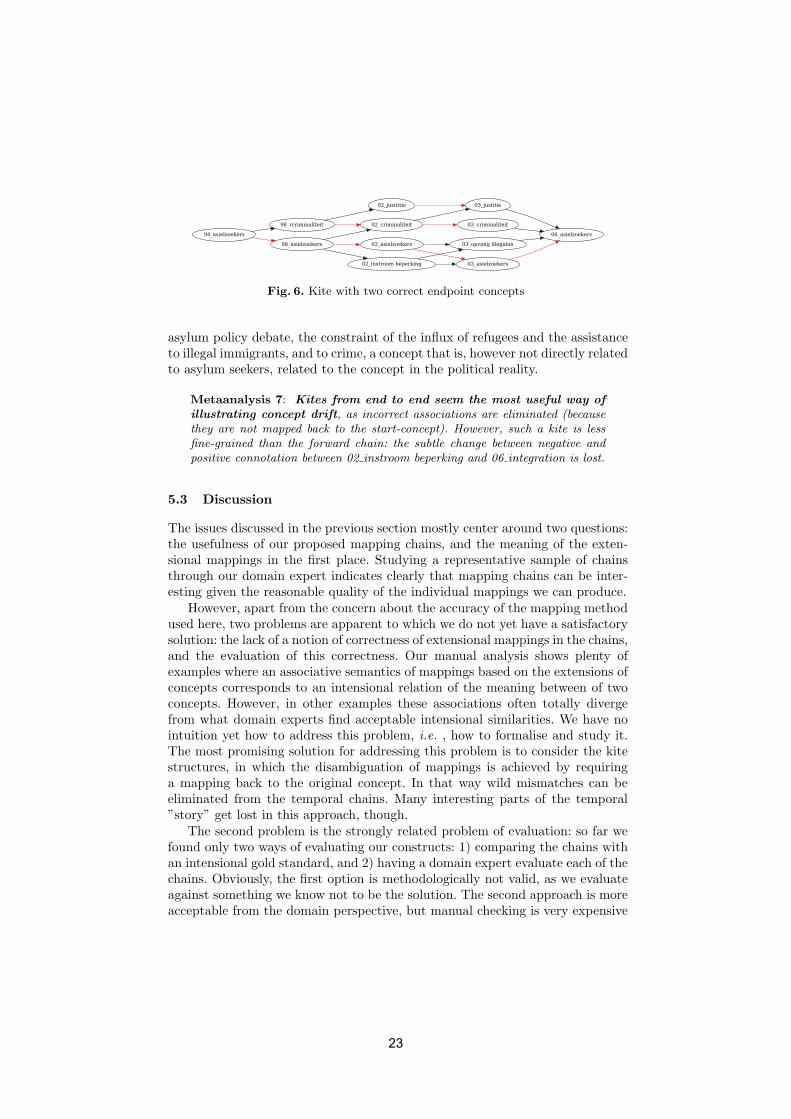
Fig. 6. Kite with two correct endpoint concepts
asylum policy debate, the constraint of the influx of refugees and the assistanceto illegal immigrants, and to crime, a concept that is, however not directly relatedto asylum seekers, related to the concept in the political reality.
Metaanalysis 7: Kites from end to end seem the most useful way ofillustrating concept drift, as incorrect associations are eliminated (becausethey are not mapped back to the start-concept). However, such a kite is lessfine-grained than the forward chain: the subtle change between negative andpositive connotation between 02 instroom beperking and 06 integration is lost.
5.3 Discussion
The issues discussed in the previous section mostly center around two questions:the usefulness of our proposed mapping chains, and the meaning of the exten-sional mappings in the first place. Studying a representative sample of chainsthrough our domain expert indicates clearly that mapping chains can be inter-esting given the reasonable quality of the individual mappings we can produce.
However, apart from the concern about the accuracy of the mapping methodused here, two problems are apparent to which we do not yet have a satisfactorysolution: the lack of a notion of correctness of extensional mappings in the chains,and the evaluation of this correctness. Our manual analysis shows plenty ofexamples where an associative semantics of mappings based on the extensions ofconcepts corresponds to an intensional relation of the meaning between of twoconcepts. However, in other examples these associations often totally divergefrom what domain experts find acceptable intensional similarities. We have nointuition yet how to address this problem, i.e. , how to formalise and study it.The most promising solution for addressing this problem is to consider the kitestructures, in which the disambiguation of mappings is achieved by requiringa mapping back to the original concept. In that way wild mismatches can beeliminated from the temporal chains. Many interesting parts of the temporal”story” get lost in this approach, though.
The second problem is the strongly related problem of evaluation: so far wefound only two ways of evaluating our constructs: 1) comparing the chains withan intensional gold standard, and 2) having a domain expert evaluate each of thechains. Obviously, the first option is methodologically not valid, as we evaluateagainst something we know not to be the solution. The second approach is moreacceptable from the domain perspective, but manual checking is very expensive
23
and difficult to quantify, if it is not yet impossible to identify all “intertestingchains.” The only practical solutions we found so far is to use the spreadingfactor of the top K chains over time. In our view, the fewer leaves such a treehas, the semantically closer the mappings should be. However, this idea is buildon intuition rather than empirical findings.
6 Conclusion
In this paper we introduced different representations of mapping chains andevaluated them over sequences of political ontologies in a Media study driven byCommunication Scientists. We used instance-based mappings between pairs ofontologies to calculate sequences of extensional mappings and show, for a usecaseanalysing Dutch election campaigns, some interesting qualitative findings.
Apart from these stimulating examples we also provided an initial evaluationof our proposal, both qualitative and quantitative. However, this evaluation istricky, as neither the notion of correctness of an extensional mapping is well-defined, nor do we have a sound evaluation methodology yet.
For us the general lessons for the ontology mapping community is twofold:that the semantics of mappings is not yet fully understood, particularly, w.r.t.,extensional semantics, and that mappings in a dynamic context are challenging,and worthwhile, objects of study in addition to their known static variants.
References
1. Schopman, B., Wang, S., Schlobach, S.: Deriving concept mappings through instancemappings. In: Proceedings of the 3rd Asian Semantic Web Conference, Bangkok,Thailand (2008)
2. Wang, S., Englebienne, G., Schlobach, S.: Learning concept mappings from instancesimilarity. In: Proceedings of the 7th International Semantic Web Conference (ISWC2008). Volume 5318 of Lecture Notes in Computer Science., Karlsruhe, Germany,Springer (October 2008) 339–355
3. Wang, S., Isaac, A., Schopman, B., Schlobach, S., van der Meij, L.: Matching multi-lingual subject vocabularies. In: Proceedings of the 13th European Conference onDigital Libraries (ECDL2009), Corfu, Greece (September 2009)
4. Euzenat, J., Shvaiko, P.: Ontology Matching. Springer Verlag (2007)5. Isaac, A., van der Meij, L., Schlobach, S., Wang, S.: An empirical study of instance-
based ontology matching. In: Proceedings of the 6th International Semantic WebConference (ISWC 2007). Volume 4825 of Lecture Notes in Computer Science.,Busan, Korea, Springer (2007)
6. Salton, G., McGill, M.J.: Introduction to Modern Information Retrieval. McGraw-Hill (1983)
7. Van Cuilenburg, J., Kleinnijenhuis, J., De ridder, J.: Towards a graph theory ofjournalistic texts. European Journal of Communication 1 (1986) 65–96
8. Isaac, A., Summers, E.: SKOS Primer. W3C Group Note (2009)
24
A pattern-based ontology matching approach fordetecting complex correspondences
Dominique Ritze1, Christian Meilicke1, Ondrej Svab-Zamazal2, and Heiner
Stuckenschmidt1
1University of Mannheim,
[email protected], {christian, heiner}@informatik.uni-mannheim.de2University of Economics, Prague, [email protected]
Abstract. State of the art ontology matching techniques are limited to detect
simple correspondences between atomic concepts and properties. Nevertheless,
for many concepts and properties atomic counterparts will not exist, while it is
possible to construct equivalent complex concept and property descriptions. We
define a correspondence where at least one of the linked entities is non-atomic as
complex correspondence. Further, we introduce several patterns describing com-
plex correspondences. In particular, we focus on methods for automatically de-
tecting complex correspondences. These methods are based on a combination of
basic matching techniques. We conduct experiments with different datasets and
discuss the results.
1 Introduction
Ontology matching is referred to as a means for resolving the problem of semantic het-
erogeneity [3]. This problem is caused by the possibility to describe the same domain
by the use of ontologies that differ to a large degree. Ontology engineers might, for ex-
ample, chose different vocabularies to describe the same entities. There might also be
ontologies where some parts are modeled in a fine grained way, while in other ontolo-
gies there are only shallow concept hierarchies in the relevant branches. These kinds of
heterogeneities can be resolved by state of the art ontology matching systems, which
might e.g. detect that hasAuthor and writtenBy are equivalent properties and only dif-
ferent vocabulary is used. Moreover a matching system might identify, that Author is
more general as both concepts FirstAuthor and CoAuthor.
However, ontological heterogeneities are not restricted to these kind of problems:
different modeling styles might require more than equivalence or subsumption corre-
spondences between atomic concepts and properties.1 Semantic relations between com-
plex descriptions become necessary. This is illustrated by the following example: While
in one ontology we have an atomic concept AcceptedPaper, in another ontology we have
the general concept Paper and the boolean property accepted. An AcceptedPaper in the
first ontology corresponds in the second ontology to a Paper that has been accepted.
Such a correspondence, where at least one of the linked entities is a complex concept
1 Atomic concepts/properties are sometimes also referred to as named concepts/properties resp.
concept/property names.
25
or property description, is referred to as complex correspondence in the following. As
main contribution of this paper we suggest an automated pattern based approach to de-
tect certain types of complex correspondences and study its performance by applying
it on different datasets. Even though different researchers were concerned with similar
topics (see [11]), to our knowledge none of the resulting works was concerned with au-
tomated detection in an experimental setting. Exceptions can be found in the machine
learning community (see Section 2).
We first discuss related work centered around the notion of a complex correspon-
dence in Section 2. We then present four patterns of complex correspondences in Sec-
tion 3. In Section 4 we suggest the algorithms we designed to detect occurrences of
these patterns. Each of these algorithms is described as a conjunction of conditions,
which are easy to check by basic matching techniques. In Section 5 we apply the algo-
rithms on two datasets from the OAEI and show that the proposed techniques can be
used to detect a significant amount of complex correspondences. We end with a conclu-
sion in Section 6.
2 Related Work
Complex matching is a well known topic in database schema matching. In [1] the au-
thors describe complex matches as matching corresponding attributes on which some
operation was applied, e.g. a name is equivalent with concatenation of a first-name and a
last-name. There are several systems dealing with this kind of database schema match-
ing. On the other hand complex matching is relatively new in the ontology matching
field. Most of the state of the art matchers just find (simple) correspondences between
two atomic terms. However, pragmatic concerns call for complex matching. We also
experienced this during discussions at the OM-2008. It turns out that simple corre-
spondences are too limited to capture all meaningful relations between concepts and
properties of two related ontologies. This is an important aspect with respect to ap-
plication scenarios making use of alignments e.g. instance migration scenarios. There
are three diverse aspects of complex correspondences: designing (defining), finding and
representing them.
In [8] complex correspondences are mainly considered from design and representa-
tion aspects. Complex correspondences are captured as correspondence patterns. They
are solutions for recurring mismatches being raised during aligning two ontologies.
These patterns are now being included within Ontology Design Patterns (ODP)2. This
work considers complex matching as task that had to be conducted by a human user,
which might e.g. be a domain expert. Experts can take advantage of diverse templates
for capturing complex and correct matching. However, this collection of patterns can
also be exploited by some automated matching approach, as suggested and shown in
this paper.
In [11] authors tried to find complex correspondences using pattern-based detection
of different semantic structures in ontologies. The most refined pattern is concerned
2 In the taxonomy of patterns at the ODP portal (http://ontologydesignpatterns.org/wiki/OPTypes) category AlignmentODP corresponds best with the patterns in this
paper, while category CorrespondeceODP is a more general category.
26
with ’N-ary’ relation detection. After detecting an instance of the pattern (using query
language and some string-based heuristics) additional conditions (mainly string-based
comparisons) over related entities wrt. matching are checked. While there are some
experiments with pattern detection in one ontology, experiments with matching tasks
are missing.
Furthermore, in [12] the authors consider an approach for pattern-based ontology
transformation useful for diverse purposes. One particular use case is ontology match-
ing where this method enables finding further originally missed correspondences. On-
tologies are transformed according to transformation patterns and then any matcher
can be applied. Authors hypothesize that matchers can work with some structures bet-
ter than with others. This approach uses Expressive alignment language3 based on [2]
which extends the original INRIA alignment format. This language enables to express
complex structures on each side of an alignment (set operators, restriction for entities
and relations). Furthermore it is possible to use variables and transformation functions
for transforming attribute values. ”Basically, complex correspondences are employed
indirectly in the ontology matching process at a pre-processing step where ontology pat-
terns are detected and transformed [13].” Unlike, in this paper complex correspondences
are detected directly taking advantage of information from not only two ontologies be-
ing aligned but also from a reference alignment composed of simple correspondences.
Regarding ontology matching, there are a few matchers trying to find complex cor-
respondences based on machine learning approaches (see [9] for a general description).
A concrete matching system is presented in [6]. These approaches take correspondences
with more than two atomic terms into account, but require the ontologies to include
matchable instances. However, ontologies often contain disjoint sets of instances, such
that for each instance of one ontology there exists no counterpart in the other ontology
and vice versa. The approach proposed in this paper does not require the existence of
matchable instances at all.
3 Complex Correspondence Patterns
In the following we propose four patterns for complex correspondences that, due to a
preparatory study, we expect to occur frequently within ontology matching problems.
We first report about our preparatory study, followed by a detailed presentation of each
pattern. Each pattern is also explained by an example depicted in Figure 1. Without
explicitly mentioning it, we will refer to Figure 1 throughout this section. Further we
use O1 and O2 to refer to two aligned ontologies, and we use prefix notation i#C to
refer to an entity C from ontology Oi.
First of all we had to collect different types of complex correspondences. We con-
sidered the examples found in [9] and also profited from the discussion of the consensus
track at OM 2008, which highlighted the need for complex correspondences.4 After we
had a few ideas, we started observing two sets of ontologies manually to detect concrete
examples for complex correspondences. The specific ontologies which we examined are
the SIGKDD, CMT, EKAW, IASTED, and CONFOF ontologies of the conference dataset
3 http://alignapi.gforge.inria.fr/language.html4 http://nb.vse.cz/˜svabo/oaei2008/cbw08.pdf
27
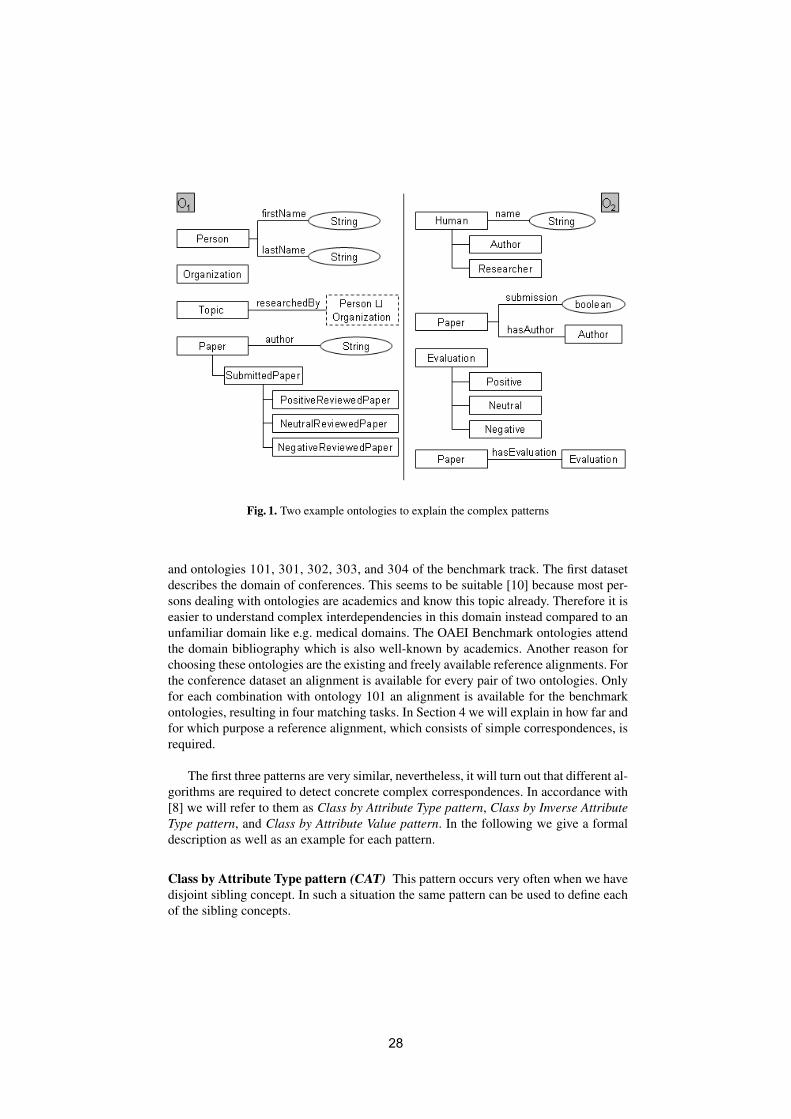
Fig. 1. Two example ontologies to explain the complex patterns
and ontologies 101, 301, 302, 303, and 304 of the benchmark track. The first dataset
describes the domain of conferences. This seems to be suitable [10] because most per-
sons dealing with ontologies are academics and know this topic already. Therefore it is
easier to understand complex interdependencies in this domain instead compared to an
unfamiliar domain like e.g. medical domains. The OAEI Benchmark ontologies attend
the domain bibliography which is also well-known by academics. Another reason for
choosing these ontologies are the existing and freely available reference alignments. For
the conference dataset an alignment is available for every pair of two ontologies. Only
for each combination with ontology 101 an alignment is available for the benchmark
ontologies, resulting in four matching tasks. In Section 4 we will explain in how far and
for which purpose a reference alignment, which consists of simple correspondences, is
required.
The first three patterns are very similar, nevertheless, it will turn out that different al-
gorithms are required to detect concrete complex correspondences. In accordance with
[8] we will refer to them as Class by Attribute Type pattern, Class by Inverse AttributeType pattern, and Class by Attribute Value pattern. In the following we give a formal
description as well as an example for each pattern.
Class by Attribute Type pattern (CAT) This pattern occurs very often when we have
disjoint sibling concept. In such a situation the same pattern can be used to define each
of the sibling concepts.
28
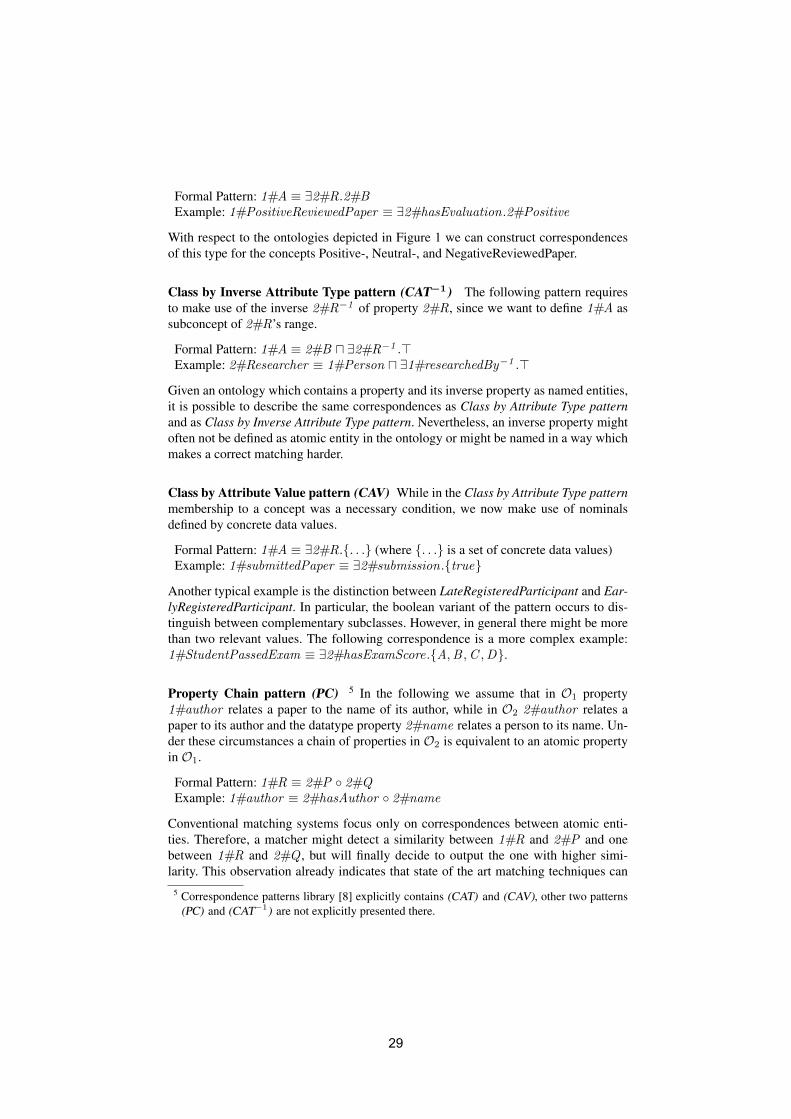
Formal Pattern: 1#A ≡ ∃2#R.2#BExample: 1#PositiveReviewedPaper ≡ ∃2#hasEvaluation.2#Positive
With respect to the ontologies depicted in Figure 1 we can construct correspondences
of this type for the concepts Positive-, Neutral-, and NegativeReviewedPaper.
Class by Inverse Attribute Type pattern (CAT−1) The following pattern requires
to make use of the inverse 2#R−1 of property 2#R, since we want to define 1#A as
subconcept of 2#R’s range.
Formal Pattern: 1#A ≡ 2#B � ∃2#R−1 .Example: 2#Researcher ≡ 1#Person � ∃1#researchedBy−1 .
Given an ontology which contains a property and its inverse property as named entities,
it is possible to describe the same correspondences as Class by Attribute Type patternand as Class by Inverse Attribute Type pattern. Nevertheless, an inverse property might
often not be defined as atomic entity in the ontology or might be named in a way which
makes a correct matching harder.
Class by Attribute Value pattern (CAV) While in the Class by Attribute Type patternmembership to a concept was a necessary condition, we now make use of nominals
defined by concrete data values.
Formal Pattern: 1#A ≡ ∃2#R.{. . .} (where {. . .} is a set of concrete data values)
Example: 1#submittedPaper ≡ ∃2#submission.{true}Another typical example is the distinction between LateRegisteredParticipant and Ear-lyRegisteredParticipant. In particular, the boolean variant of the pattern occurs to dis-
tinguish between complementary subclasses. However, in general there might be more
than two relevant values. The following correspondence is a more complex example:
1#StudentPassedExam ≡ ∃2#hasExamScore.{A,B ,C ,D}.
Property Chain pattern (PC) 5 In the following we assume that in O1 property
1#author relates a paper to the name of its author, while in O2 2#author relates a
paper to its author and the datatype property 2#name relates a person to its name. Un-
der these circumstances a chain of properties in O2 is equivalent to an atomic property
in O1.
Formal Pattern: 1#R ≡ 2#P ◦ 2#QExample: 1#author ≡ 2#hasAuthor ◦ 2#name
Conventional matching systems focus only on correspondences between atomic enti-
ties. Therefore, a matcher might detect a similarity between 1#R and 2#P and one
between 1#R and 2#Q , but will finally decide to output the one with higher simi-
larity. This observation already indicates that state of the art matching techniques can
5 Correspondence patterns library [8] explicitly contains (CAT) and (CAV), other two patterns
(PC) and (CAT−1) are not explicitly presented there.
29
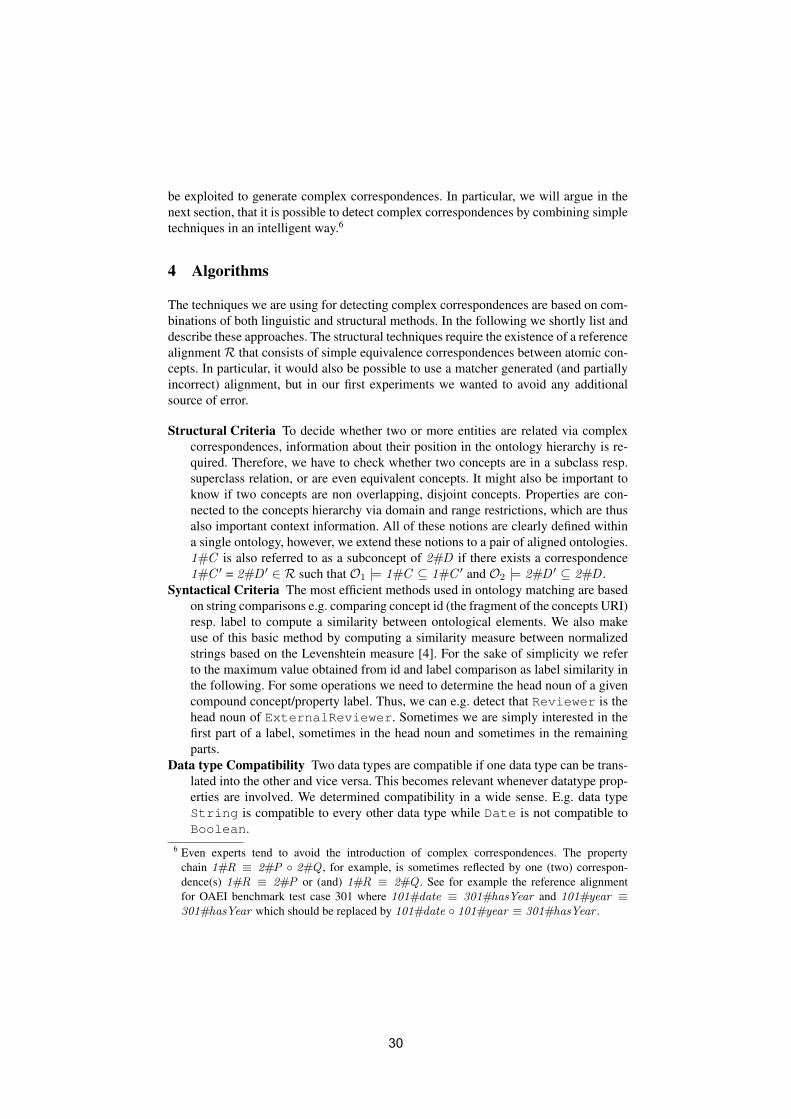
be exploited to generate complex correspondences. In particular, we will argue in the
next section, that it is possible to detect complex correspondences by combining simple
techniques in an intelligent way.6
4 Algorithms
The techniques we are using for detecting complex correspondences are based on com-
binations of both linguistic and structural methods. In the following we shortly list and
describe these approaches. The structural techniques require the existence of a reference
alignment R that consists of simple equivalence correspondences between atomic con-
cepts. In particular, it would also be possible to use a matcher generated (and partially
incorrect) alignment, but in our first experiments we wanted to avoid any additional
source of error.
Structural Criteria To decide whether two or more entities are related via complex
correspondences, information about their position in the ontology hierarchy is re-
quired. Therefore, we have to check whether two concepts are in a subclass resp.
superclass relation, or are even equivalent concepts. It might also be important to
know if two concepts are non overlapping, disjoint concepts. Properties are con-
nected to the concepts hierarchy via domain and range restrictions, which are thus
also important context information. All of these notions are clearly defined within
a single ontology, however, we extend these notions to a pair of aligned ontologies.
1#C is also referred to as a subconcept of 2#D if there exists a correspondence
1#C ′ = 2#D ′ ∈ R such that O1 |= 1#C ⊆ 1#C ′ and O2 |= 2#D ′ ⊆ 2#D .
Syntactical Criteria The most efficient methods used in ontology matching are based
on string comparisons e.g. comparing concept id (the fragment of the concepts URI)
resp. label to compute a similarity between ontological elements. We also make
use of this basic method by computing a similarity measure between normalized
strings based on the Levenshtein measure [4]. For the sake of simplicity we refer
to the maximum value obtained from id and label comparison as label similarity in
the following. For some operations we need to determine the head noun of a given
compound concept/property label. Thus, we can e.g. detect that Reviewer is the
head noun of ExternalReviewer. Sometimes we are simply interested in the
first part of a label, sometimes in the head noun and sometimes in the remaining
parts.
Data type Compatibility Two data types are compatible if one data type can be trans-
lated into the other and vice versa. This becomes relevant whenever datatype prop-
erties are involved. We determined compatibility in a wide sense. E.g. data type
String is compatible to every other data type while Date is not compatible to
Boolean.
6 Even experts tend to avoid the introduction of complex correspondences. The property
chain 1#R ≡ 2#P ◦ 2#Q , for example, is sometimes reflected by one (two) correspon-
dence(s) 1#R ≡ 2#P or (and) 1#R ≡ 2#Q . See for example the reference alignment
for OAEI benchmark test case 301 where 101#date ≡ 301#hasYear and 101#year ≡301#hasYear which should be replaced by 101#date ◦ 101#year ≡ 301#hasYear .
30
A more detailed description can be found in [7]. Overall we emphasize that our
methodology does not exceed basic functionalities which we normally would expect to
be part of any state of the art matching system.
Class by Attribute Type pattern A correspondence 1#A ≡ ∃2#R.2#B of the CATtype is generated by our algorithm, if all following conditions hold.
1. The string that results from removing the head noun from the label of 1#A is
similar to the label of 2#B .
2. There exists a class 2#C that is a superclass of 2#B , range of 2#R and has also a
label similar to 2#R.
3. The domain of 2#R is a superclass of 1#A due to R.
Notice that these conditions are a complete description of our approach for detect-
ing the CAT pattern. The following example will clarify why such a straightforward
approach works.
Fig. 2. Conditions relevant for detecting CAT correspondence 1#Accepted Paper ≡∃2#hasDecision.2#Acceptance .
With respect to the ontologies depicted in Figure 2 our approach will detect that
1#Accepted Paper ≡ ∃2#hasDecision.2#Acceptance . The label of Accepted Papercan be split up into prefix Accepted and head noun Paper. On the one hand the
string Accepted is similar to Acceptance, but on the other hand Accepted Paper =
Acceptance is not contained in R. Object property hasDecision accomplishes all con-
ditions required by our algorithm: Acceptance has a superclass Decision which is the
range of hasDecision and the labels Decision and hasDecision are similar. More-
over the domain of hasDecision is a superclass of Accepted Paper due R, which con-
tains correspondence 1#Paper = 2#Paper .
31
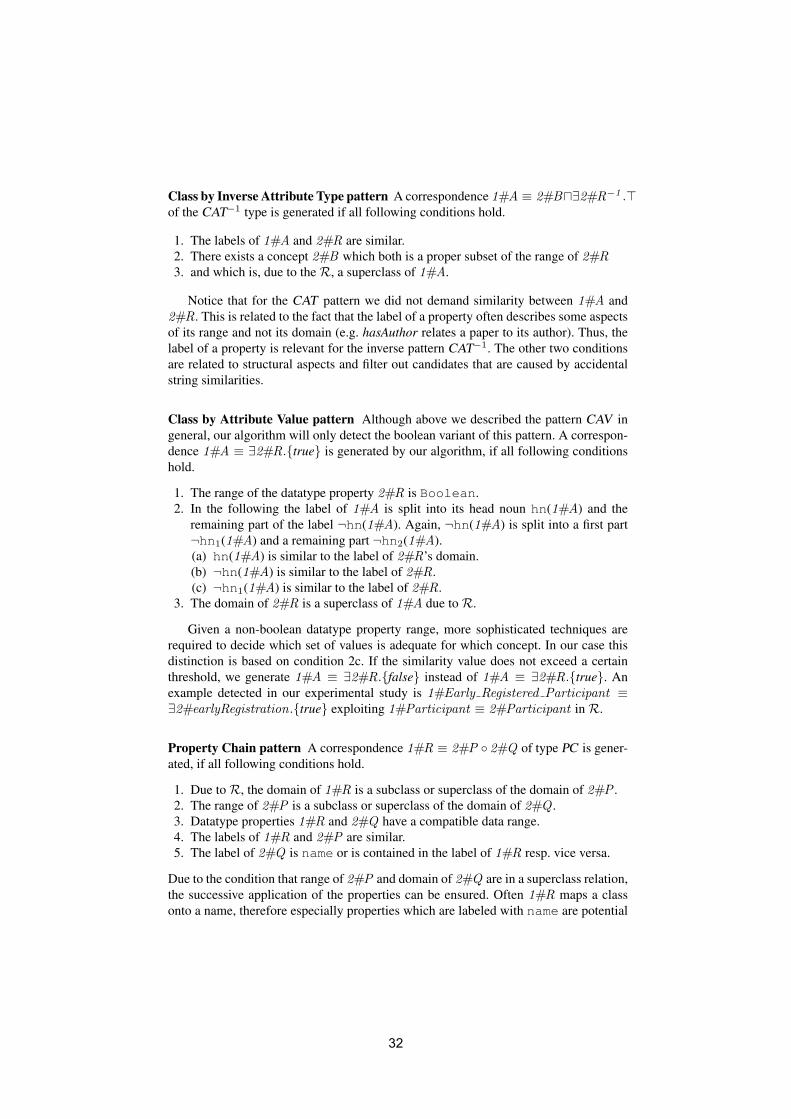
Class by Inverse Attribute Type pattern A correspondence 1#A ≡ 2#B�∃2#R−1 .of the CAT−1 type is generated if all following conditions hold.
1. The labels of 1#A and 2#R are similar.
2. There exists a concept 2#B which both is a proper subset of the range of 2#R3. and which is, due to the R, a superclass of 1#A.
Notice that for the CAT pattern we did not demand similarity between 1#A and
2#R. This is related to the fact that the label of a property often describes some aspects
of its range and not its domain (e.g. hasAuthor relates a paper to its author). Thus, the
label of a property is relevant for the inverse pattern CAT−1. The other two conditions
are related to structural aspects and filter out candidates that are caused by accidental
string similarities.
Class by Attribute Value pattern Although above we described the pattern CAV in
general, our algorithm will only detect the boolean variant of this pattern. A correspon-
dence 1#A ≡ ∃2#R.{true} is generated by our algorithm, if all following conditions
hold.
1. The range of the datatype property 2#R is Boolean.
2. In the following the label of 1#A is split into its head noun hn(1#A) and the
remaining part of the label ¬hn(1#A). Again, ¬hn(1#A) is split into a first part
¬hn1(1#A) and a remaining part ¬hn2(1#A).
(a) hn(1#A) is similar to the label of 2#R’s domain.
(b) ¬hn(1#A) is similar to the label of 2#R.
(c) ¬hn1(1#A) is similar to the label of 2#R.
3. The domain of 2#R is a superclass of 1#A due to R.
Given a non-boolean datatype property range, more sophisticated techniques are
required to decide which set of values is adequate for which concept. In our case this
distinction is based on condition 2c. If the similarity value does not exceed a certain
threshold, we generate 1#A ≡ ∃2#R.{false} instead of 1#A ≡ ∃2#R.{true}. An
example detected in our experimental study is 1#Early Registered Participant ≡∃2#earlyRegistration.{true} exploiting 1#Participant ≡ 2#Participant in R.
Property Chain pattern A correspondence 1#R ≡ 2#P ◦ 2#Q of type PC is gener-
ated, if all following conditions hold.
1. Due to R, the domain of 1#R is a subclass or superclass of the domain of 2#P .
2. The range of 2#P is a subclass or superclass of the domain of 2#Q .
3. Datatype properties 1#R and 2#Q have a compatible data range.
4. The labels of 1#R and 2#P are similar.
5. The label of 2#Q is name or is contained in the label of 1#R resp. vice versa.
Due to the condition that range of 2#P and domain of 2#Q are in a superclass relation,
the successive application of the properties can be ensured. Often 1#R maps a class
onto a name, therefore especially properties which are labeled with name are potential
32
mapping candidates. An example for this pattern has already been given in the previous
section. With respect to Figure 1 we have 1#R = 1#author , 2#P = 2#hasAuthor ,
2#Q = 2#name . The property 1#author relates a paper to the name of its author,
2#hasAuthor relates a paper to its author and 2#name an author to its name. Thus, a
chain of properties is required to express 1#author in the terminology defined by O2.
A second set of conditions aims to cover a different naming strategy. The first three
conditions are the same as above, but the last ones have to be replaced as follows.
4. The labels of 1#R and 2#Q are similar.
5. The labels of 2#P and its range or the labels of the properties 2#P and 2#Q are
similar.
An example, depicted in Figure 4, of a property chain that fulfills these conditions:
1#hasYear = 2#date ◦ 2#year where 2#date is an object property with 2#Date as
abstract range.
Fig. 3. Conditions relevant for detecting PC correspondence 1#hasYear ≡ 2#date ◦ 2#year
For all patterns of the class by and property chain family we additionally check for
each candidate correspondence whether there exists a constituent that already occurs in
the reference alignment. In this case we trust the simple correspondence in the reference
alignment and do not generate the complex correspondence.
5 Experiments
The algorithms described in the previous section have been implemented in a matching
tool available at http://dominique-ritze.de/complex-mappings/. We
applied our tool on three datasets referred to as CONFERENCE 1, CONFERENCE 2 and
BENCHMARK. These datasets have been taken from corresponding tracks of the Ontol-
ogy Alignment Evaluation Initiative (OAEI). As BENCHMARK we refer to the matching
tasks #301 - #304 of the OAEI Benchmark track. We abstained from using the other test
cases, because they are generated by systematic variations of the #101 ontology, which
33
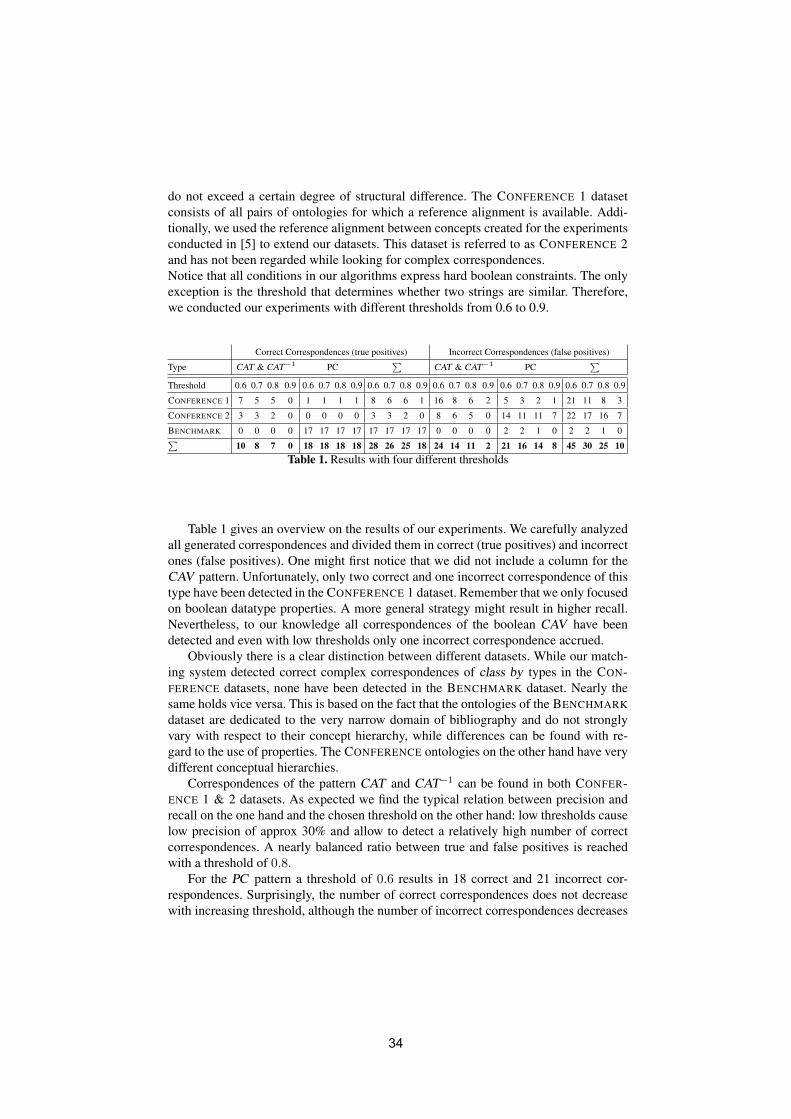
do not exceed a certain degree of structural difference. The CONFERENCE 1 dataset
consists of all pairs of ontologies for which a reference alignment is available. Addi-
tionally, we used the reference alignment between concepts created for the experiments
conducted in [5] to extend our datasets. This dataset is referred to as CONFERENCE 2
and has not been regarded while looking for complex correspondences.
Notice that all conditions in our algorithms express hard boolean constraints. The only
exception is the threshold that determines whether two strings are similar. Therefore,
we conducted our experiments with different thresholds from 0.6 to 0.9.
Correct Correspondences (true positives) Incorrect Correspondences (false positives)
Type CAT & CAT−1 PC∑
CAT & CAT−1 PC∑
Threshold 0.6 0.7 0.8 0.9 0.6 0.7 0.8 0.9 0.6 0.7 0.8 0.9 0.6 0.7 0.8 0.9 0.6 0.7 0.8 0.9 0.6 0.7 0.8 0.9
CONFERENCE 1 7 5 5 0 1 1 1 1 8 6 6 1 16 8 6 2 5 3 2 1 21 11 8 3
CONFERENCE 2 3 3 2 0 0 0 0 0 3 3 2 0 8 6 5 0 14 11 11 7 22 17 16 7
BENCHMARK 0 0 0 0 17 17 17 17 17 17 17 17 0 0 0 0 2 2 1 0 2 2 1 0∑10 8 7 0 18 18 18 18 28 26 25 18 24 14 11 2 21 16 14 8 45 30 25 10
Table 1. Results with four different thresholds
Table 1 gives an overview on the results of our experiments. We carefully analyzed
all generated correspondences and divided them in correct (true positives) and incorrect
ones (false positives). One might first notice that we did not include a column for the
CAV pattern. Unfortunately, only two correct and one incorrect correspondence of this
type have been detected in the CONFERENCE 1 dataset. Remember that we only focused
on boolean datatype properties. A more general strategy might result in higher recall.
Nevertheless, to our knowledge all correspondences of the boolean CAV have been
detected and even with low thresholds only one incorrect correspondence accrued.
Obviously there is a clear distinction between different datasets. While our match-
ing system detected correct complex correspondences of class by types in the CON-
FERENCE datasets, none have been detected in the BENCHMARK dataset. Nearly the
same holds vice versa. This is based on the fact that the ontologies of the BENCHMARK
dataset are dedicated to the very narrow domain of bibliography and do not strongly
vary with respect to their concept hierarchy, while differences can be found with re-
gard to the use of properties. The CONFERENCE ontologies on the other hand have very
different conceptual hierarchies.
Correspondences of the pattern CAT and CAT−1 can be found in both CONFER-
ENCE 1 & 2 datasets. As expected we find the typical relation between precision and
recall on the one hand and the chosen threshold on the other hand: low thresholds cause
low precision of approx 30% and allow to detect a relatively high number of correct
correspondences. A nearly balanced ratio between true and false positives is reached
with a threshold of 0.8.
For the PC pattern a threshold of 0.6 results in 18 correct and 21 incorrect cor-
respondences. Surprisingly, the number of correct correspondences does not decrease
with increasing threshold, although the number of incorrect correspondences decreases
34
significantly. This is based on the fact that the relevant entities occurring in the PC pat-
tern are very often not only similar but identical after normalization (e.g. concept Dateand property date). This observation indicates that there is still room for improvement
by choosing different thresholds for different patterns.
Another surprising result is the high number of false property chains in the CON-
FERENCE 1 and in particular in the CONFERENCE 2 dataset compared to the BENCH-
MARK dataset. Due to the existence of a reference alignment with high coverage of
properties for the BENCHMARK dataset many incorrect property chains have not been
generated. Their constituents already occurred in simple correspondence of the refer-
ence alignment. The same does not hold for the CONFERENCE datasets. There are many
properties that have no counterpart in one of the other ontologies.
Our experimental study points to the problem of evaluating the quality of a complex
alignment. Due to the fact that complex correspondences are missing in the reference
alignments, our results cannot be compared against a gold standard, resulting in miss-
ing recall values. Even though it might be possible to construct a complete reference
alignment for a finite number of patterns, it will be extremely laborious to construct a
complete reference alignment, which contains all non-trivial complex correspondences.
Nevertheless, a comparison against the size of the simple reference alignments might
deliver some useful insights. The number of property correspondences in the union of
all BENCHMARK reference alignments is 139 (only 63 concept correspondences), while
we could find 17 additional property chains with our approach. For the CONFERENCE
datasets we counted 275 concept correspondences (only the CONFERENCE 1 dataset
comprised additionally 12 property correspondences). Here we detected 12 complex
correspondences of different class by types. These results indicate that the proposed
complex ontology matching strategy increased recall by approx. 4% with respect to
concept correspondences and by approx. 10% with repect to property correspondences.
Interpreting these results, we have to keep in mind that the generation of complex
correspondences is much harder compared to the generation of simple correspondences.
While a balanced rate of correct and incorrect correspondences will not be acceptable
for simple matching tasks, a similar result is positive with respect to the complex match-
ing task which we tackle with our approach.
6 Conclusion
We proposed a pattern based approach to detect different types of complex correspon-
dences. Our approach does not rely on machine learning techniques, which require the
availability of instance correspondences. On the contrary, it is based on state of the
art matching techniques and additionally exploits an input alignment which consists of
simple correspondences. In an experimental study we have shown that our approach,
which is simply based on checking conditions specific to a particular pattern, is suffi-
cient to detect a significant amount of complex correspondences, while the number of
false positives is relatively low, if considering that complex correspondences are quite
hard to detect.
Although first results are promising, we know that the task of verifying the correct-
ness of complex correspondences requires human interaction. A pattern based approach,
35
as proposed in this paper, will in most cases fail to generate highly precise alignments.
This is based on the fact that the generation of complex correspondences is significantly
harder compared to the task of generating simple correspondences. Suppose, given con-
cept AcceptedPaper of O1, a user is searching in O2 for an equivalent concept. First of
all, there are as much simple hypotheses available as there are atomic concepts in O2.
The situation changes dramatically when there exists no atomic counterpart and a com-
plex correspondence is required. The search space explodes and it becomes impossible
for a human expert to evaluate each possible combination. We know that the proposed
patterns covers only a small part of an infinite search space. Nevertheless, this small
part might still be large enough to find a significant fraction of those correspondences
that will not be detected at all without a supporting system.
Acknowledgment The work has been partially supported by the German Science Foun-
dation (DFG) under contract STU 266/3-1 and STU 266/5-1 and by the IGA VSE grant
no. 20/08 ”Evaluation and matching ontologies via patterns”.
References1. A. Doan and A. Y. Halevy. Semantic-integration research in the database community. AI
Magazine, pages 83–94, 2005.2. J. Euzenat, F. Scharffe, and A. Zimmermann. Expressive alignment language and implemen-
tation. deliverable 2.2.10, Knowledge web, 2007.3. J. Euzenat and P. Shvaiko. Ontology Matching. Springer, 2007.4. V. I. Levenshtein. Binary codes capable of correcting deletions and insertions and reversals.
Doklady Akademii Nauk SSSR, pages 845–848, 1965. In Russian. English Translation in
Soviet Physics Doklady, 10(8) p. 707710, 1966.5. C. Meilicke, A. Tamilin, and H. Stuckenschmidt. Repairing Ontology Mappings. In Pro-
ceedings of the 22nd Conference on Artificial Intelligence, Vancouver, Canada, 2007.6. H. Qin, D. Dou, and P. LePendu. Discovering Executable Semantic Mappings Between
Ontologies. On the Move to Meaningful Internet Systems 2007: CoopIS, DOA, ODBASE,GADA, and IS, pages 832–849, 2007.
7. D. Ritze. Generating Complex Ontology Alignments, University Mannheim (Bachelor the-
sis), 2009.8. F. Scharffe. Correspondence Patterns Representation. PhD thesis, University of Innsbruck,
2009.9. H. Stuckenschmidt, L. Predoiu, and C. Meilicke. Learning Complex Ontology Alignments
A Challenge for ILP Research. In Proceedings of the 18th International Conference onInductive Logic Programming, 2008.
10. O. Svab, V. Svatek, P. Berka, D. Rak, and P. Tomasek. OntoFarm: Towards an Experimental
Collection of Parallel Ontologies. In Poster Proceedings of the International Semantic WebConference, 2005.
11. O. Svab-Zamazal and V. Svatek. Towards Ontology Matching via Pattern-Based Detection
of Semantic Structures in OWL Ontologies. In Proceedings of the Znalosti Czecho-SlovakKnowledge Technology conference, 2009.
12. O. Svab-Zamazal, V. Svatek, J. David, and F. Scharffe. Towards Metamorphic Semantic
Models. In Poster session at European Semantic Web Conference, 2009.13. O. Svab-Zamazal, V. Svatek, and F. Scharffe. Pattern-based Ontology Transformation Ser-
vice. In Proceedings of the 1st International Conference on Knowledge Engineering andOntology Development, 2009.
36
Computing minimal mappings
Fausto Giunchiglia, Vincenzo Maltese, Aliaksandr Autayeu
Dipartimento di Ingegneria e Scienza dell’Informazione (DISI) - Università di Trento {fausto, maltese, autayeu}@disi.unitn.it
Abstract. Given two classifications, or lightweight ontologies, we compute the minimal mapping, namely the subset of all possible correspondences, called mapping elements, between them such that i) all the others can be computed from them in time linear in the size of the input ontologies, and ii) none of them can be dropped without losing property i). In this paper we provide a formal definition of minimal mappings and define a time efficient computation algo-rithm which minimizes the number of comparisons between the nodes of the two input ontologies. The experimental results show a substantial improvement both in the computation time and in the number of mapping elements which need to be handled.
Keywords: Ontology matching, lightweight ontologies, minimal mappings
1 Introduction
Given any two graph-like structures, e.g., database and XML schemas, classifica-tions, thesauri and ontologies, matching is usually identified as the problem of finding those nodes in the two structures which semantically correspond to one another. Any such pair of nodes, along with the semantic relationship holding between the two, is what we informally call a mapping element. In the last few years a lot of work has been done on this topic both in the digital libraries [15, 16, 17, 21] and the computer science [2, 3, 4, 5, 6, 8, 9] communities. In this paper we concentrate on lightweight ontologies (or formal classifications), as formally defined in [1, 7], and we focus on the problem of finding minimal mappings, that is, the subset of all possible corre-spondences, called mapping elements, such that i) all the others can be computed from them in time linear in the size of the input graphs, and ii) none of them can be dropped without losing property i). This must not be seen as a limitation. There are plenty of schemas in the world which can be translated, with almost no loss of infor-mation, into lightweight ontologies. For instance, thesauri, library classifications, file systems, email folder structures, web directories, business catalogues and so on. Lightweight ontologies are well defined and pervasive. The main advantage of mini-mal mappings is that they are the minimal amount of information that needs to be dealt with. Notice that this is a rather important feature as the number of possible mapping elements can grow up to n*m with n and m being the size of the two input ontologies. Minimal mappings provide clear usability advantages. Many systems and corresponding interfaces, mostly graphical, have been provided for the management of mappings but all of them hardly scale with the increasing number of nodes, and the resulting visualizations are rather messy [3]. Furthermore, the maintenance of smaller sets makes the work of the user much easier, faster and less error prone [11].
37
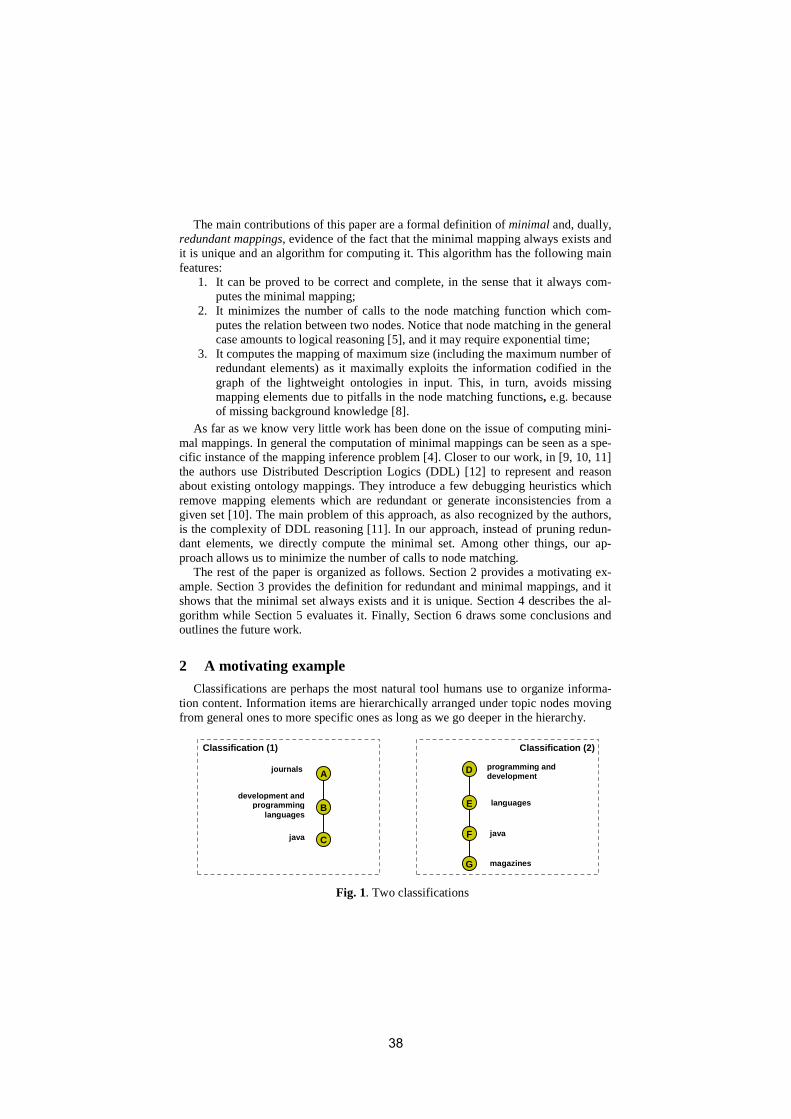
The main contributions of this paper are a formal definition of minimal and, dually, redundant mappings, evidence of the fact that the minimal mapping always exists and it is unique and an algorithm for computing it. This algorithm has the following main features:
1. It can be proved to be correct and complete, in the sense that it always com-putes the minimal mapping;
2. It minimizes the number of calls to the node matching function which com-putes the relation between two nodes. Notice that node matching in the general case amounts to logical reasoning [5], and it may require exponential time;
3. It computes the mapping of maximum size (including the maximum number of redundant elements) as it maximally exploits the information codified in the graph of the lightweight ontologies in input. This, in turn, avoids missing mapping elements due to pitfalls in the node matching functions, e.g. because of missing background knowledge [8].
As far as we know very little work has been done on the issue of computing mini-mal mappings. In general the computation of minimal mappings can be seen as a spe-cific instance of the mapping inference problem [4]. Closer to our work, in [9, 10, 11] the authors use Distributed Description Logics (DDL) [12] to represent and reason about existing ontology mappings. They introduce a few debugging heuristics which remove mapping elements which are redundant or generate inconsistencies from a given set [10]. The main problem of this approach, as also recognized by the authors, is the complexity of DDL reasoning [11]. In our approach, instead of pruning redun-dant elements, we directly compute the minimal set. Among other things, our ap-proach allows us to minimize the number of calls to node matching.
The rest of the paper is organized as follows. Section 2 provides a motivating ex-ample. Section 3 provides the definition for redundant and minimal mappings, and it shows that the minimal set always exists and it is unique. Section 4 describes the al-gorithm while Section 5 evaluates it. Finally, Section 6 draws some conclusions and outlines the future work.
2 A motivating example
Classifications are perhaps the most natural tool humans use to organize informa-tion content. Information items are hierarchically arranged under topic nodes moving from general ones to more specific ones as long as we go deeper in the hierarchy.
Fig. 1. Two classifications
journals
development and programming
languages
java
programming and development
languages
java
Classification (1) Classification (2)
magazines
A
B
C
D
E
F
G
38
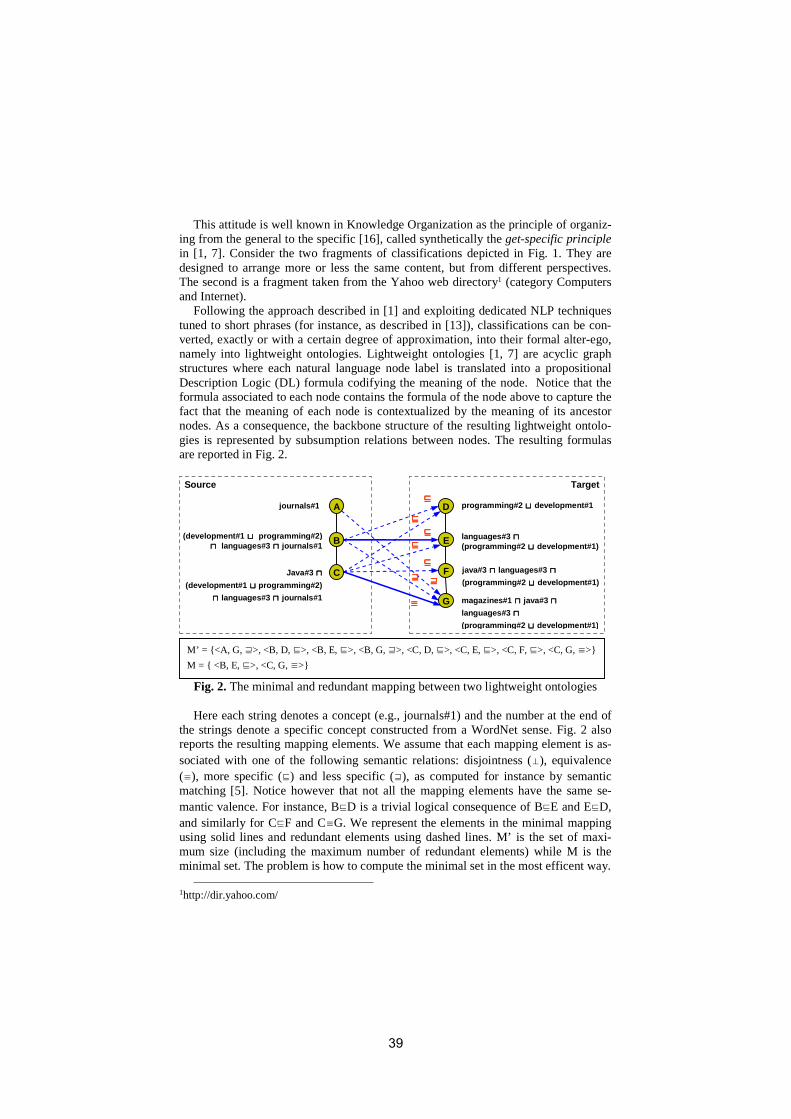
This attitude is well known in Knowledge Organization as the principle of organiz-ing from the general to the specific [16], called synthetically the get-specific principlein [1, 7]. Consider the two fragments of classifications depicted in Fig. 1. They are designed to arrange more or less the same content, but from different perspectives. The second is a fragment taken from the Yahoo web directory1 (category Computers and Internet).
Following the approach described in [1] and exploiting dedicated NLP techniques tuned to short phrases (for instance, as described in [13]), classifications can be con-verted, exactly or with a certain degree of approximation, into their formal alter-ego, namely into lightweight ontologies. Lightweight ontologies [1, 7] are acyclic graph structures where each natural language node label is translated into a propositional Description Logic (DL) formula codifying the meaning of the node. Notice that the formula associated to each node contains the formula of the node above to capture the fact that the meaning of each node is contextualized by the meaning of its ancestor nodes. As a consequence, the backbone structure of the resulting lightweight ontolo-gies is represented by subsumption relations between nodes. The resulting formulas are reported in Fig. 2.
Fig. 2. The minimal and redundant mapping between two lightweight ontologies
Here each string denotes a concept (e.g., journals#1) and the number at the end of the strings denote a specific concept constructed from a WordNet sense. Fig. 2 also reports the resulting mapping elements. We assume that each mapping element is as-sociated with one of the following semantic relations: disjointness (⊥), equivalence (≡), more specific (�) and less specific (�), as computed for instance by semantic matching [5]. Notice however that not all the mapping elements have the same se-mantic valence. For instance, B�D is a trivial logical consequence of B�E and E�D, and similarly for C�F and C≡G. We represent the elements in the minimal mapping using solid lines and redundant elements using dashed lines. M’ is the set of maxi-mum size (including the maximum number of redundant elements) while M is the minimal set. The problem is how to compute the minimal set in the most efficent way.
1http://dir.yahoo.com/
M’ = {<A, G, �>, <B, D, �>, <B, E, �>, <B, G, �>, <C, D, �>, <C, E, �>, <C, F, �>, <C, G, ≡>}
M = { <B, E, �>, <C, G, ≡>}
Source Target
A
B
C
D
E
F
G
��������
≡≡≡≡
��������
��������
����journals#1 programming#2 � � � � development#1
languages#3 ����(programming#2 � � � � development#1)
java#3 � � � � languages#3 ����(programming#2 � � � � development#1)
magazines#1 � � � � java#3 � � � � languages#3 � � � � (programming#2 � � � � development#1)
(development#1 � � � � programming#2) ���� languages#3 � � � � journals#1
Java#3 � � � � (development#1 ���� programming#2)
� � � � languages#3 � � � � journals#1
39
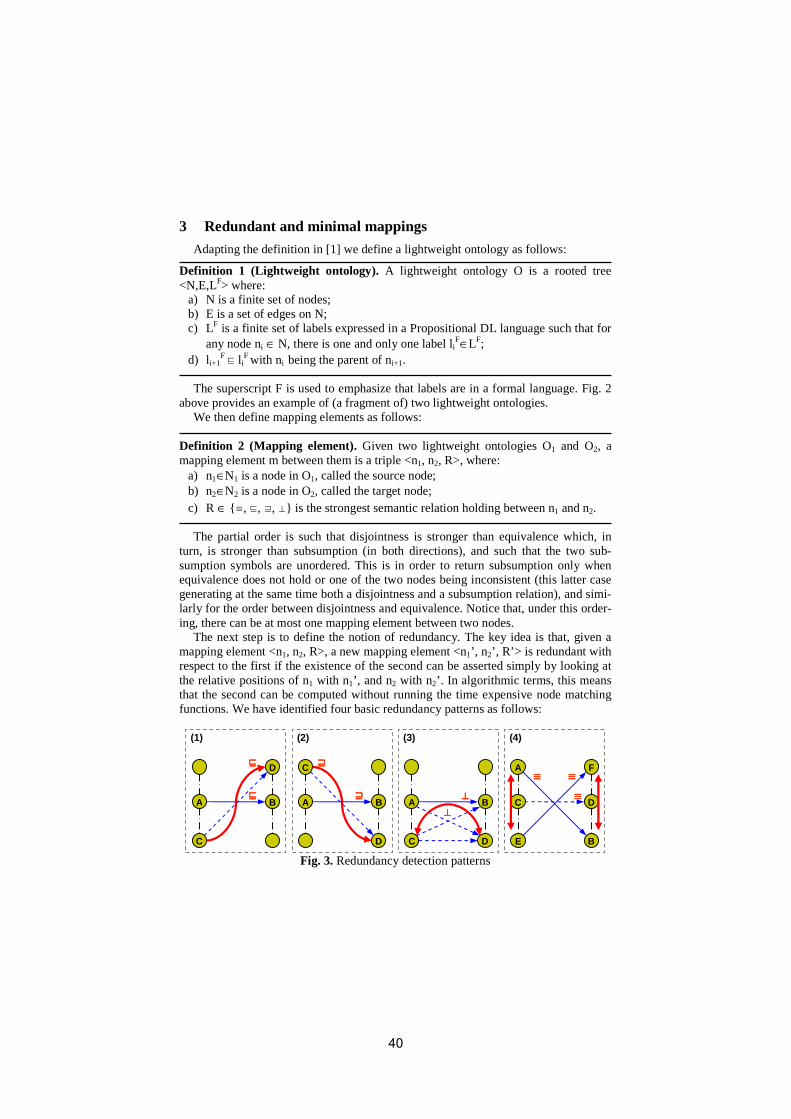
3 Redundant and minimal mappings
Adapting the definition in [1] we define a lightweight ontology as follows:
Definition 1 (Lightweight ontology). A lightweight ontology O is a rooted tree <N,E,LF> where:
a) N is a finite set of nodes; b) E is a set of edges on N; c) LF is a finite set of labels expressed in a Propositional DL language such that for
any node ni ∈ N, there is one and only one label liF∈LF;
d) li+1F � li
F with ni being the parent of ni+1.
The superscript F is used to emphasize that labels are in a formal language. Fig. 2 above provides an example of (a fragment of) two lightweight ontologies.
We then define mapping elements as follows:
Definition 2 (Mapping element). Given two lightweight ontologies O1 and O2, a mapping element m between them is a triple <n1, n2, R>, where:
a) n1∈N1 is a node in O1, called the source node; b) n2∈N2 is a node in O2, called the target node; c) R ∈ {≡, �, �, ⊥} is the strongest semantic relation holding between n1 and n2.
The partial order is such that disjointness is stronger than equivalence which, in turn, is stronger than subsumption (in both directions), and such that the two sub-sumption symbols are unordered. This is in order to return subsumption only when equivalence does not hold or one of the two nodes being inconsistent (this latter case generating at the same time both a disjointness and a subsumption relation), and simi-larly for the order between disjointness and equivalence. Notice that, under this order-ing, there can be at most one mapping element between two nodes.
The next step is to define the notion of redundancy. The key idea is that, given a mapping element <n1, n2, R>, a new mapping element <n1’, n2’, R’> is redundant with respect to the first if the existence of the second can be asserted simply by looking at the relative positions of n1 with n1’, and n2 with n2’. In algorithmic terms, this means that the second can be computed without running the time expensive node matching functions. We have identified four basic redundancy patterns as follows:
Fig. 3. Redundancy detection patterns
A B
C
D
(1)
����
����A B
(2)
C
D
����
����A B
C
(3)
D
⊥⊥⊥⊥C D
E
F
(4)
A
B
≡≡≡≡≡≡≡≡
⊥⊥⊥⊥
≡≡≡≡
40
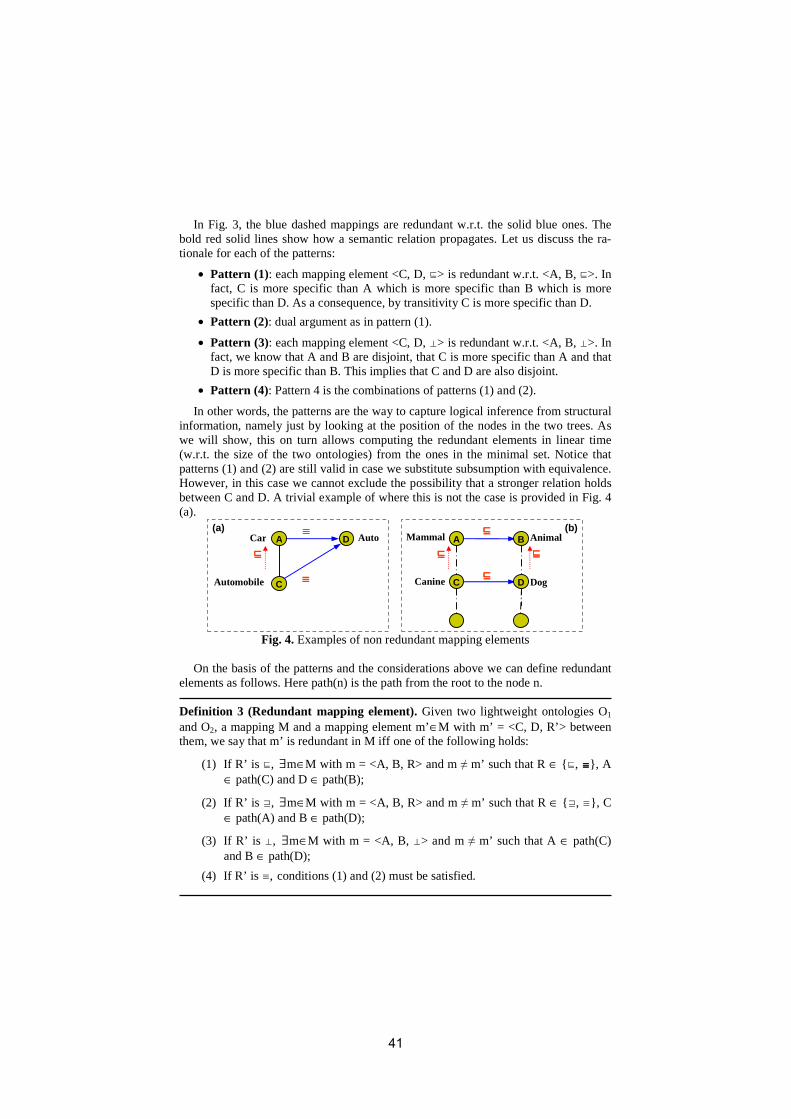
In Fig. 3, the blue dashed mappings are redundant w.r.t. the solid blue ones. The bold red solid lines show how a semantic relation propagates. Let us discuss the ra-tionale for each of the patterns:
• Pattern (1): each mapping element <C, D, �> is redundant w.r.t. <A, B, �>. In fact, C is more specific than A which is more specific than B which is more specific than D. As a consequence, by transitivity C is more specific than D.
• Pattern (2): dual argument as in pattern (1).
• Pattern (3): each mapping element <C, D, ⊥> is redundant w.r.t. <A, B, ⊥>. In fact, we know that A and B are disjoint, that C is more specific than A and that D is more specific than B. This implies that C and D are also disjoint.
• Pattern (4): Pattern 4 is the combinations of patterns (1) and (2).
In other words, the patterns are the way to capture logical inference from structural information, namely just by looking at the position of the nodes in the two trees. As we will show, this on turn allows computing the redundant elements in linear time (w.r.t. the size of the two ontologies) from the ones in the minimal set. Notice that patterns (1) and (2) are still valid in case we substitute subsumption with equivalence. However, in this case we cannot exclude the possibility that a stronger relation holds between C and D. A trivial example of where this is not the case is provided in Fig. 4 (a).
Fig. 4. Examples of non redundant mapping elements
On the basis of the patterns and the considerations above we can define redundant elements as follows. Here path(n) is the path from the root to the node n.
Definition 3 (Redundant mapping element). Given two lightweight ontologies O1
and O2, a mapping M and a mapping element m’∈M with m’ = <C, D, R’> between them, we say that m’ is redundant in M iff one of the following holds:
(1) If R’ is �, ∃m∈M with m = <A, B, R> and m ≠ m’ such that R ∈ {�, ≡≡≡≡}, A ∈ path(C) and D ∈ path(B);
(2) If R’ is �, ∃m∈M with m = <A, B, R> and m ≠ m’ such that R ∈ {�, ≡}, C ∈ path(A) and B ∈ path(D);
(3) If R’ is ⊥, ∃m∈M with m = <A, B, ⊥> and m ≠ m’ such that A ∈ path(C) and B ∈ path(D);
(4) If R’ is ≡, conditions (1) and (2) must be satisfied.
C
DA
����Car
Automobile
≡≡≡≡Auto
≡≡≡≡ C D
B
����
A����
���� ����Mammal
Canine
Animal
Dog
(a) (b)
41
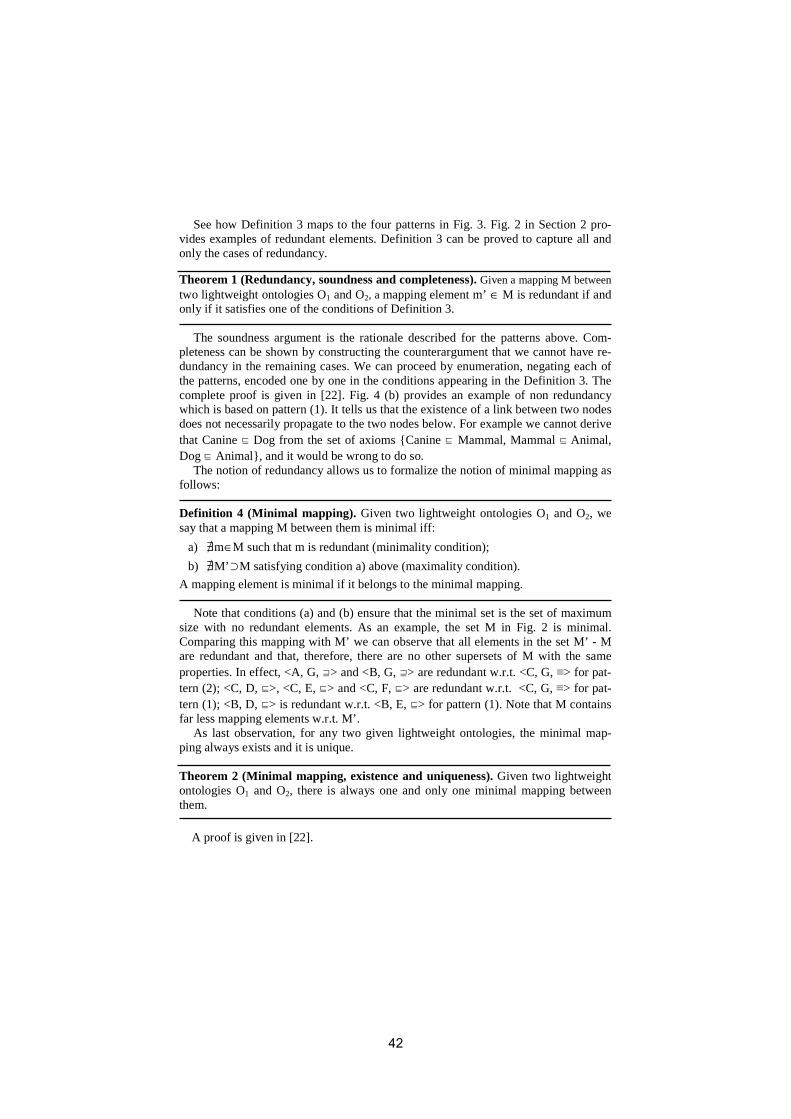
See how Definition 3 maps to the four patterns in Fig. 3. Fig. 2 in Section 2 pro-vides examples of redundant elements. Definition 3 can be proved to capture all and only the cases of redundancy.
Theorem 1 (Redundancy, soundness and completeness). Given a mapping M between two lightweight ontologies O1 and O2, a mapping element m’ ∈ M is redundant if and only if it satisfies one of the conditions of Definition 3.
The soundness argument is the rationale described for the patterns above. Com-pleteness can be shown by constructing the counterargument that we cannot have re-dundancy in the remaining cases. We can proceed by enumeration, negating each of the patterns, encoded one by one in the conditions appearing in the Definition 3. The complete proof is given in [22]. Fig. 4 (b) provides an example of non redundancy which is based on pattern (1). It tells us that the existence of a link between two nodes does not necessarily propagate to the two nodes below. For example we cannot derive that Canine � Dog from the set of axioms {Canine � Mammal, Mammal � Animal, Dog � Animal}, and it would be wrong to do so.
The notion of redundancy allows us to formalize the notion of minimal mapping as follows:
Definition 4 (Minimal mapping). Given two lightweight ontologies O1 and O2, we say that a mapping M between them is minimal iff:
a) m∈M such that m is redundant (minimality condition);
b) M’⊃M satisfying condition a) above (maximality condition).
A mapping element is minimal if it belongs to the minimal mapping.
Note that conditions (a) and (b) ensure that the minimal set is the set of maximum size with no redundant elements. As an example, the set M in Fig. 2 is minimal. Comparing this mapping with M’ we can observe that all elements in the set M’ - M are redundant and that, therefore, there are no other supersets of M with the same properties. In effect, <A, G, �> and <B, G, �> are redundant w.r.t. <C, G, ≡> for pat-tern (2); <C, D, �>, <C, E, �> and <C, F, �> are redundant w.r.t. <C, G, ≡> for pat-tern (1); <B, D, �> is redundant w.r.t. <B, E, �> for pattern (1). Note that M contains far less mapping elements w.r.t. M’.
As last observation, for any two given lightweight ontologies, the minimal map-ping always exists and it is unique.
Theorem 2 (Minimal mapping, existence and uniqueness). Given two lightweight ontologies O1 and O2, there is always one and only one minimal mapping between them.
A proof is given in [22].
42
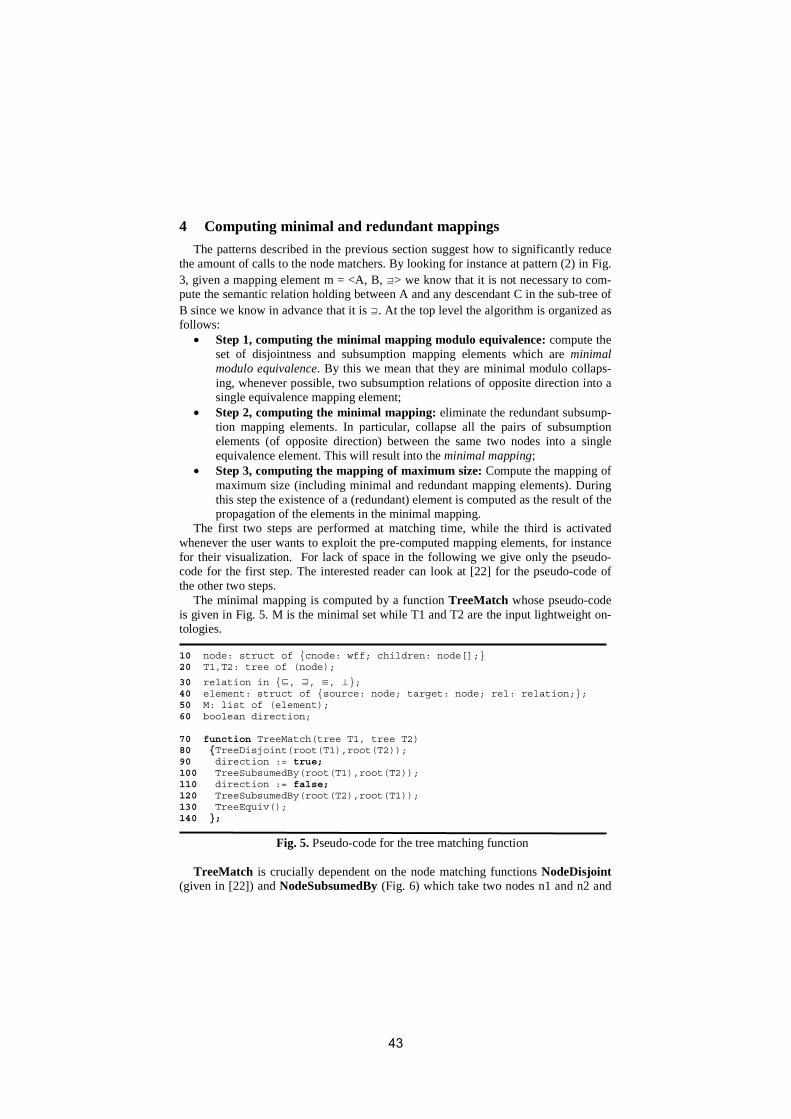
4 Computing minimal and redundant mappings
The patterns described in the previous section suggest how to significantly reduce the amount of calls to the node matchers. By looking for instance at pattern (2) in Fig. 3, given a mapping element m = <A, B, �> we know that it is not necessary to com-pute the semantic relation holding between A and any descendant C in the sub-tree of B since we know in advance that it is �. At the top level the algorithm is organized as follows:
• Step 1, computing the minimal mapping modulo equivalence: compute the set of disjointness and subsumption mapping elements which are minimal modulo equivalence. By this we mean that they are minimal modulo collaps-ing, whenever possible, two subsumption relations of opposite direction into a single equivalence mapping element;
• Step 2, computing the minimal mapping: eliminate the redundant subsump-tion mapping elements. In particular, collapse all the pairs of subsumption elements (of opposite direction) between the same two nodes into a single equivalence element. This will result into the minimal mapping;
• Step 3, computing the mapping of maximum size: Compute the mapping of maximum size (including minimal and redundant mapping elements). During this step the existence of a (redundant) element is computed as the result of the propagation of the elements in the minimal mapping.
The first two steps are performed at matching time, while the third is activated whenever the user wants to exploit the pre-computed mapping elements, for instance for their visualization. For lack of space in the following we give only the pseudo-code for the first step. The interested reader can look at [22] for the pseudo-code of the other two steps.
The minimal mapping is computed by a function TreeMatch whose pseudo-code is given in Fig. 5. M is the minimal set while T1 and T2 are the input lightweight on-tologies.
10 node: struct of {cnode: wff; children: node[];} 20 T1,T2: tree of (node);
30 relation in {�, �, ≡, ⊥}; 40 element: struct of {source: node; target: node; rel: relation;}; 50 M: list of (element); 60 boolean direction;
70 function TreeMatch(tree T1, tree T2) 80 {TreeDisjoint(root(T1),root(T2)); 90 direction := true;100 TreeSubsumedBy(root(T1),root(T2)); 110 direction := false;120 TreeSubsumedBy(root(T2),root(T1)); 130 TreeEquiv(); 140 };
Fig. 5. Pseudo-code for the tree matching function
TreeMatch is crucially dependent on the node matching functions NodeDisjoint (given in [22]) and NodeSubsumedBy (Fig. 6) which take two nodes n1 and n2 and
43
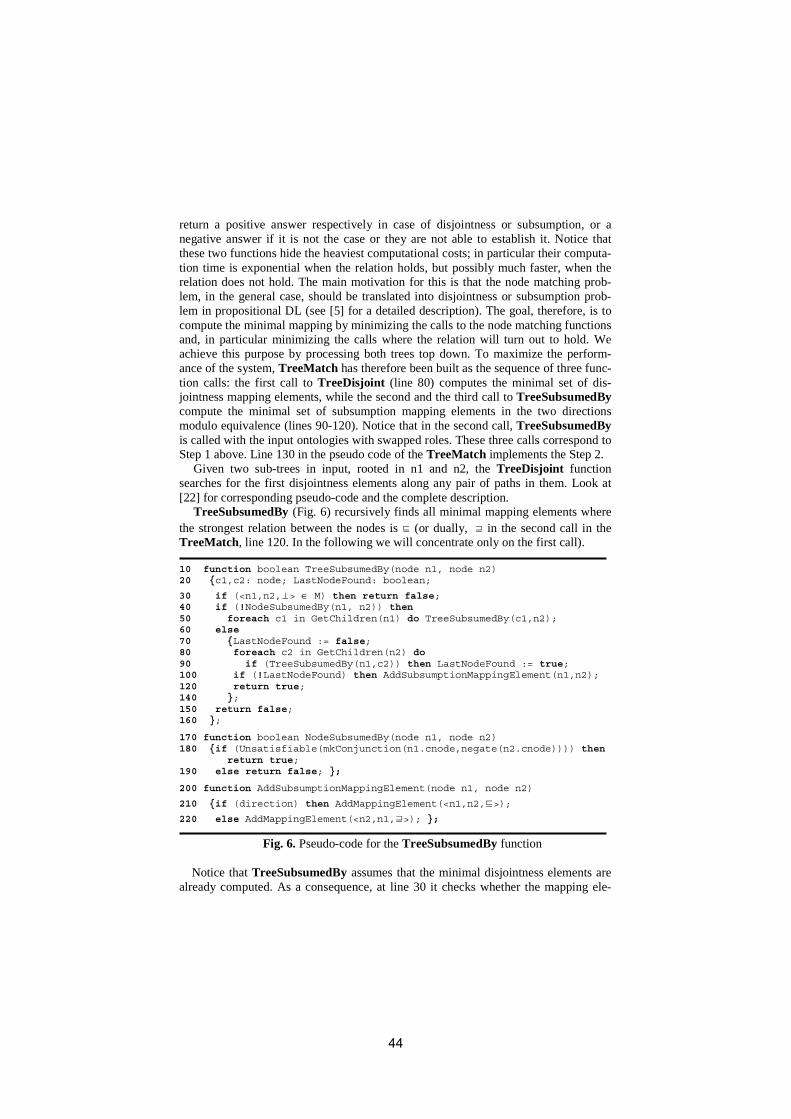
return a positive answer respectively in case of disjointness or subsumption, or a negative answer if it is not the case or they are not able to establish it. Notice that these two functions hide the heaviest computational costs; in particular their computa-tion time is exponential when the relation holds, but possibly much faster, when the relation does not hold. The main motivation for this is that the node matching prob-lem, in the general case, should be translated into disjointness or subsumption prob-lem in propositional DL (see [5] for a detailed description). The goal, therefore, is to compute the minimal mapping by minimizing the calls to the node matching functions and, in particular minimizing the calls where the relation will turn out to hold. We achieve this purpose by processing both trees top down. To maximize the perform-ance of the system, TreeMatch has therefore been built as the sequence of three func-tion calls: the first call to TreeDisjoint (line 80) computes the minimal set of dis-jointness mapping elements, while the second and the third call to TreeSubsumedBycompute the minimal set of subsumption mapping elements in the two directions modulo equivalence (lines 90-120). Notice that in the second call, TreeSubsumedByis called with the input ontologies with swapped roles. These three calls correspond to Step 1 above. Line 130 in the pseudo code of the TreeMatch implements the Step 2.
Given two sub-trees in input, rooted in n1 and n2, the TreeDisjoint function searches for the first disjointness elements along any pair of paths in them. Look at [22] for corresponding pseudo-code and the complete description.
TreeSubsumedBy (Fig. 6) recursively finds all minimal mapping elements where the strongest relation between the nodes is � (or dually, � in the second call in the TreeMatch, line 120. In the following we will concentrate only on the first call).
10 function boolean TreeSubsumedBy(node n1, node n2) 20 {c1,c2: node; LastNodeFound: boolean;
30 if (<n1,n2,⊥> ∈ M) then return false; 40 if (!NodeSubsumedBy(n1, n2)) then50 foreach c1 in GetChildren(n1) do TreeSubsumedBy(c1,n2); 60 else 70 {LastNodeFound := false; 80 foreach c2 in GetChildren(n2) do 90 if (TreeSubsumedBy(n1,c2)) then LastNodeFound := true; 100 if (!LastNodeFound) then AddSubsumptionMappingElement(n1,n2); 120 return true; 140 }; 150 return false; 160 };
170 function boolean NodeSubsumedBy(node n1, node n2) 180 {if (Unsatisfiable(mkConjunction(n1.cnode,negate(n2.cnode)))) then return true; 190 else return false; };
200 function AddSubsumptionMappingElement(node n1, node n2)
210 {if (direction) then AddMappingElement(<n1,n2,�>); 220 else AddMappingElement(<n2,n1,�>); };
Fig. 6. Pseudo-code for the TreeSubsumedBy function
Notice that TreeSubsumedBy assumes that the minimal disjointness elements are already computed. As a consequence, at line 30 it checks whether the mapping ele-
44
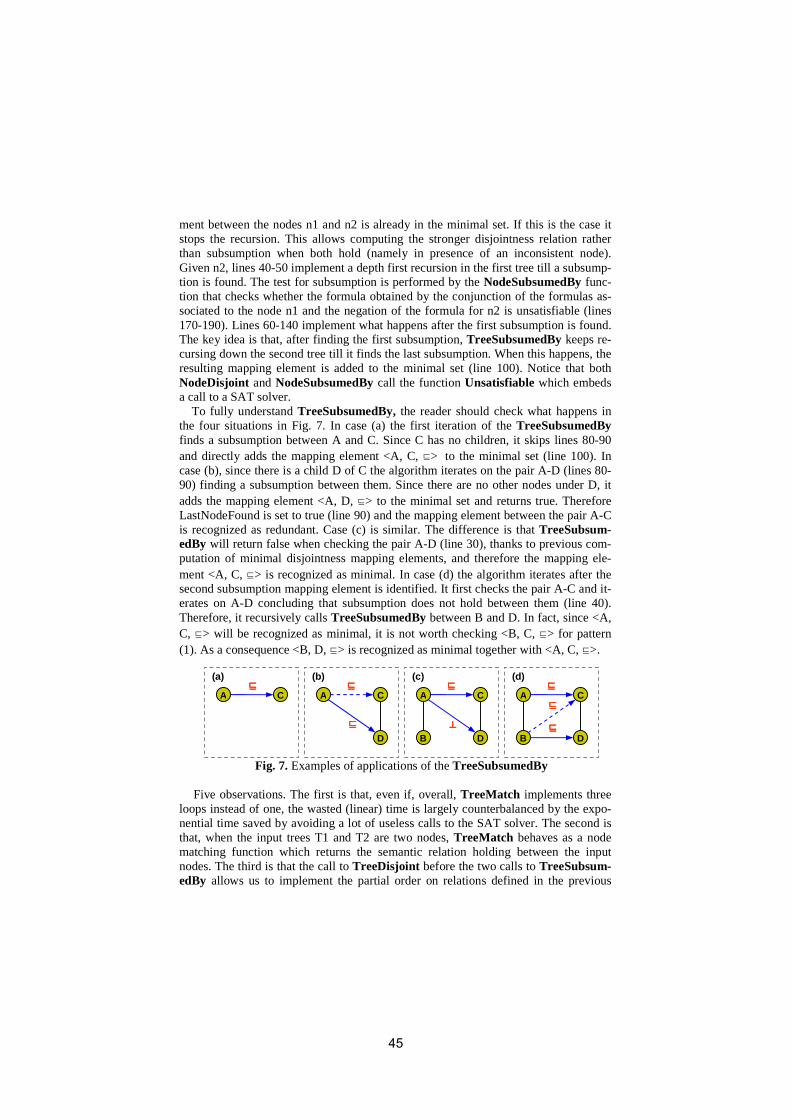
ment between the nodes n1 and n2 is already in the minimal set. If this is the case it stops the recursion. This allows computing the stronger disjointness relation rather than subsumption when both hold (namely in presence of an inconsistent node). Given n2, lines 40-50 implement a depth first recursion in the first tree till a subsump-tion is found. The test for subsumption is performed by the NodeSubsumedBy func-tion that checks whether the formula obtained by the conjunction of the formulas as-sociated to the node n1 and the negation of the formula for n2 is unsatisfiable (lines 170-190). Lines 60-140 implement what happens after the first subsumption is found. The key idea is that, after finding the first subsumption, TreeSubsumedBy keeps re-cursing down the second tree till it finds the last subsumption. When this happens, the resulting mapping element is added to the minimal set (line 100). Notice that both NodeDisjoint and NodeSubsumedBy call the function Unsatisfiable which embeds a call to a SAT solver.
To fully understand TreeSubsumedBy, the reader should check what happens in the four situations in Fig. 7. In case (a) the first iteration of the TreeSubsumedByfinds a subsumption between A and C. Since C has no children, it skips lines 80-90 and directly adds the mapping element <A, C, �> to the minimal set (line 100). In case (b), since there is a child D of C the algorithm iterates on the pair A-D (lines 80-90) finding a subsumption between them. Since there are no other nodes under D, it adds the mapping element <A, D, �> to the minimal set and returns true. Therefore LastNodeFound is set to true (line 90) and the mapping element between the pair A-C is recognized as redundant. Case (c) is similar. The difference is that TreeSubsum-edBy will return false when checking the pair A-D (line 30), thanks to previous com-putation of minimal disjointness mapping elements, and therefore the mapping ele-ment <A, C, �> is recognized as minimal. In case (d) the algorithm iterates after the second subsumption mapping element is identified. It first checks the pair A-C and it-erates on A-D concluding that subsumption does not hold between them (line 40). Therefore, it recursively calls TreeSubsumedBy between B and D. In fact, since <A, C, �> will be recognized as minimal, it is not worth checking <B, C, �> for pattern (1). As a consequence <B, D, �> is recognized as minimal together with <A, C, �>.
Fig. 7. Examples of applications of the TreeSubsumedBy
Five observations. The first is that, even if, overall, TreeMatch implements three loops instead of one, the wasted (linear) time is largely counterbalanced by the expo-nential time saved by avoiding a lot of useless calls to the SAT solver. The second is that, when the input trees T1 and T2 are two nodes, TreeMatch behaves as a node matching function which returns the semantic relation holding between the input nodes. The third is that the call to TreeDisjoint before the two calls to TreeSubsum-edBy allows us to implement the partial order on relations defined in the previous
CA����
D
CA����
(a) (b)
����B D
CA����
(c)
⊥⊥⊥⊥B D
CA����
(d)
����
����
45
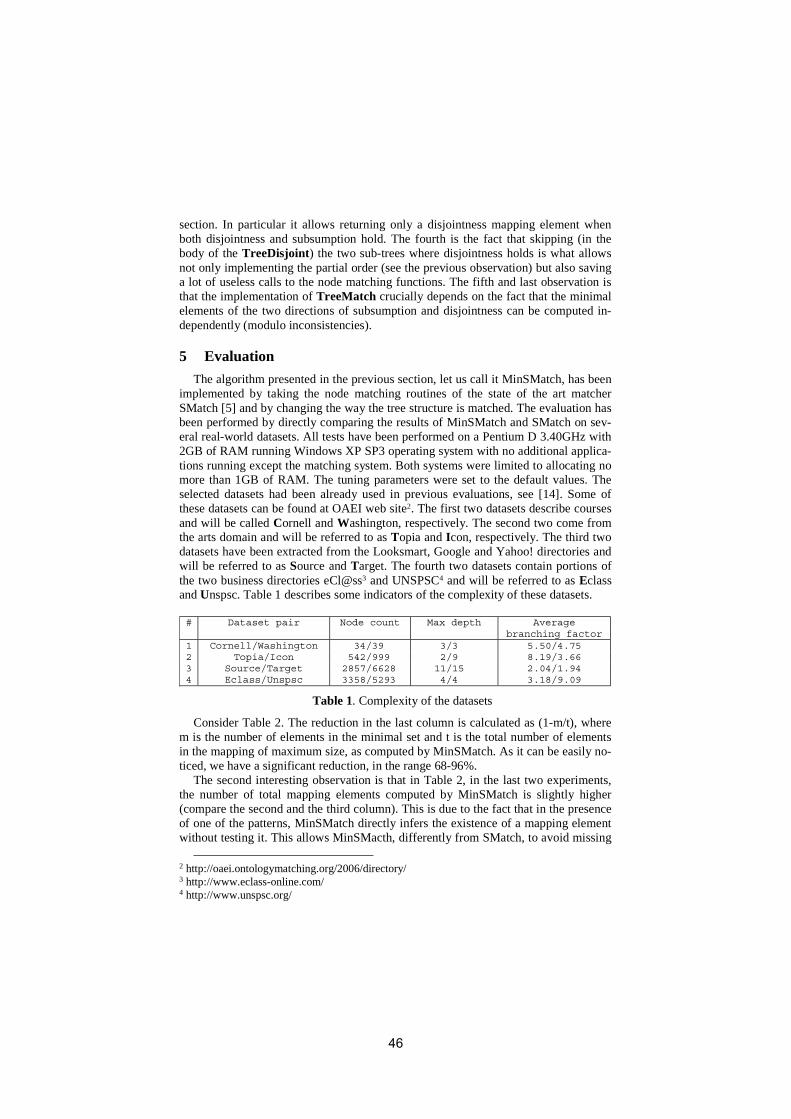
section. In particular it allows returning only a disjointness mapping element when both disjointness and subsumption hold. The fourth is the fact that skipping (in the body of the TreeDisjoint) the two sub-trees where disjointness holds is what allows not only implementing the partial order (see the previous observation) but also saving a lot of useless calls to the node matching functions. The fifth and last observation is that the implementation of TreeMatch crucially depends on the fact that the minimal elements of the two directions of subsumption and disjointness can be computed in-dependently (modulo inconsistencies).
5 Evaluation
The algorithm presented in the previous section, let us call it MinSMatch, has been implemented by taking the node matching routines of the state of the art matcher SMatch [5] and by changing the way the tree structure is matched. The evaluation has been performed by directly comparing the results of MinSMatch and SMatch on sev-eral real-world datasets. All tests have been performed on a Pentium D 3.40GHz with 2GB of RAM running Windows XP SP3 operating system with no additional applica-tions running except the matching system. Both systems were limited to allocating no more than 1GB of RAM. The tuning parameters were set to the default values. The selected datasets had been already used in previous evaluations, see [14]. Some of these datasets can be found at OAEI web site2. The first two datasets describe courses and will be called Cornell and Washington, respectively. The second two come from the arts domain and will be referred to as Topia and Icon, respectively. The third two datasets have been extracted from the Looksmart, Google and Yahoo! directories and will be referred to as Source and Target. The fourth two datasets contain portions of the two business directories eCl@ss3 and UNSPSC4 and will be referred to as Eclass and Unspsc. Table 1 describes some indicators of the complexity of these datasets.
# Dataset pair Node count Max depth Average branching factor
1 Cornell/Washington 34/39 3/3 5.50/4.75 2 Topia/Icon 542/999 2/9 8.19/3.66 3 Source/Target 2857/6628 11/15 2.04/1.94 4 Eclass/Unspsc 3358/5293 4/4 3.18/9.09
Table 1. Complexity of the datasets
Consider Table 2. The reduction in the last column is calculated as (1-m/t), where m is the number of elements in the minimal set and t is the total number of elements in the mapping of maximum size, as computed by MinSMatch. As it can be easily no-ticed, we have a significant reduction, in the range 68-96%.
The second interesting observation is that in Table 2, in the last two experiments, the number of total mapping elements computed by MinSMatch is slightly higher (compare the second and the third column). This is due to the fact that in the presence of one of the patterns, MinSMatch directly infers the existence of a mapping element without testing it. This allows MinSMacth, differently from SMatch, to avoid missing
2 http://oaei.ontologymatching.org/2006/directory/ 3 http://www.eclass-online.com/ 4 http://www.unspsc.org/
46
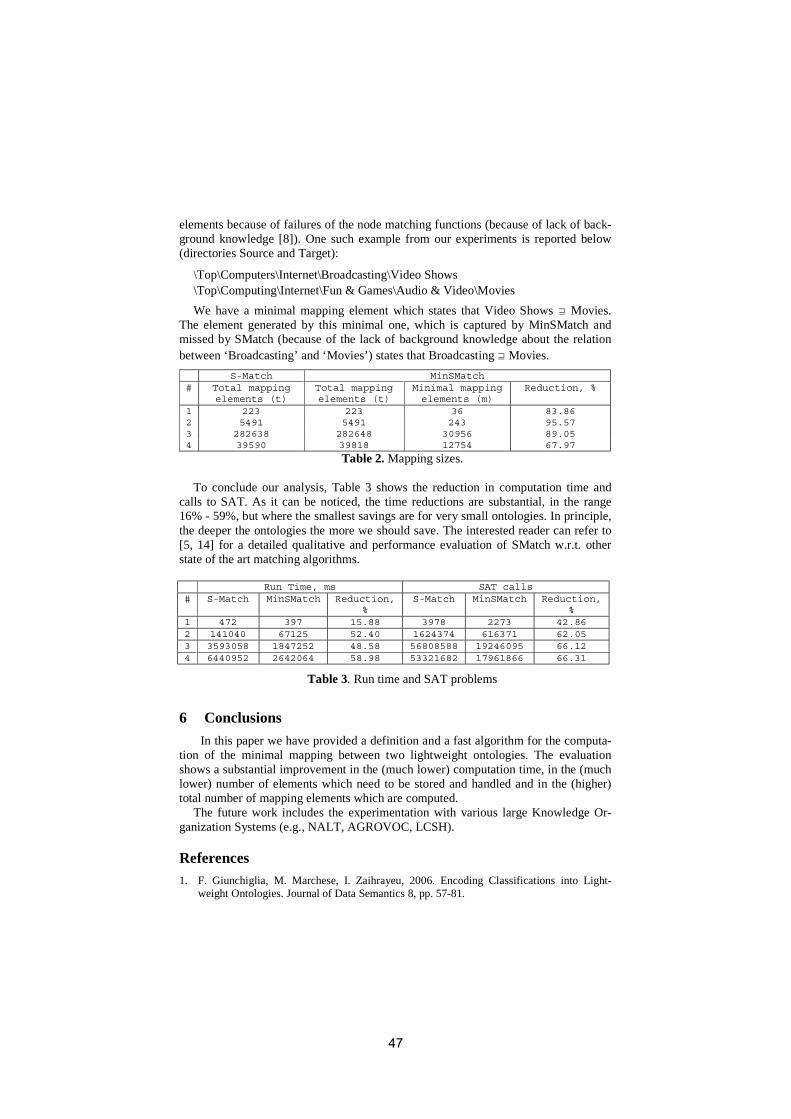
elements because of failures of the node matching functions (because of lack of back-ground knowledge [8]). One such example from our experiments is reported below (directories Source and Target):
\Top\Computers\Internet\Broadcasting\Video Shows \Top\Computing\Internet\Fun & Games\Audio & Video\Movies
We have a minimal mapping element which states that Video Shows � Movies. The element generated by this minimal one, which is captured by MinSMatch and missed by SMatch (because of the lack of background knowledge about the relation between ‘Broadcasting’ and ‘Movies’) states that Broadcasting � Movies.
S-Match MinSMatch # Total mapping
elements (t) Total mapping elements (t)
Minimal mapping elements (m)
Reduction, %
1 223 223 36 83.86 2 5491 5491 243 95.57 3 282638 282648 30956 89.05 4 39590 39818 12754 67.97
Table 2. Mapping sizes.
To conclude our analysis, Table 3 shows the reduction in computation time and calls to SAT. As it can be noticed, the time reductions are substantial, in the range 16% - 59%, but where the smallest savings are for very small ontologies. In principle, the deeper the ontologies the more we should save. The interested reader can refer to [5, 14] for a detailed qualitative and performance evaluation of SMatch w.r.t. other state of the art matching algorithms.
Run Time, ms SAT calls # S-Match MinSMatch Reduction,
% S-Match MinSMatch Reduction,
% 1 472 397 15.88 3978 2273 42.86 2 141040 67125 52.40 1624374 616371 62.05 3 3593058 1847252 48.58 56808588 19246095 66.12 4 6440952 2642064 58.98 53321682 17961866 66.31
Table 3. Run time and SAT problems
6 Conclusions
In this paper we have provided a definition and a fast algorithm for the computa-tion of the minimal mapping between two lightweight ontologies. The evaluation shows a substantial improvement in the (much lower) computation time, in the (much lower) number of elements which need to be stored and handled and in the (higher) total number of mapping elements which are computed.
The future work includes the experimentation with various large Knowledge Or-ganization Systems (e.g., NALT, AGROVOC, LCSH).
References 1. F. Giunchiglia, M. Marchese, I. Zaihrayeu, 2006. Encoding Classifications into Light-
weight Ontologies. Journal of Data Semantics 8, pp. 57-81.
47
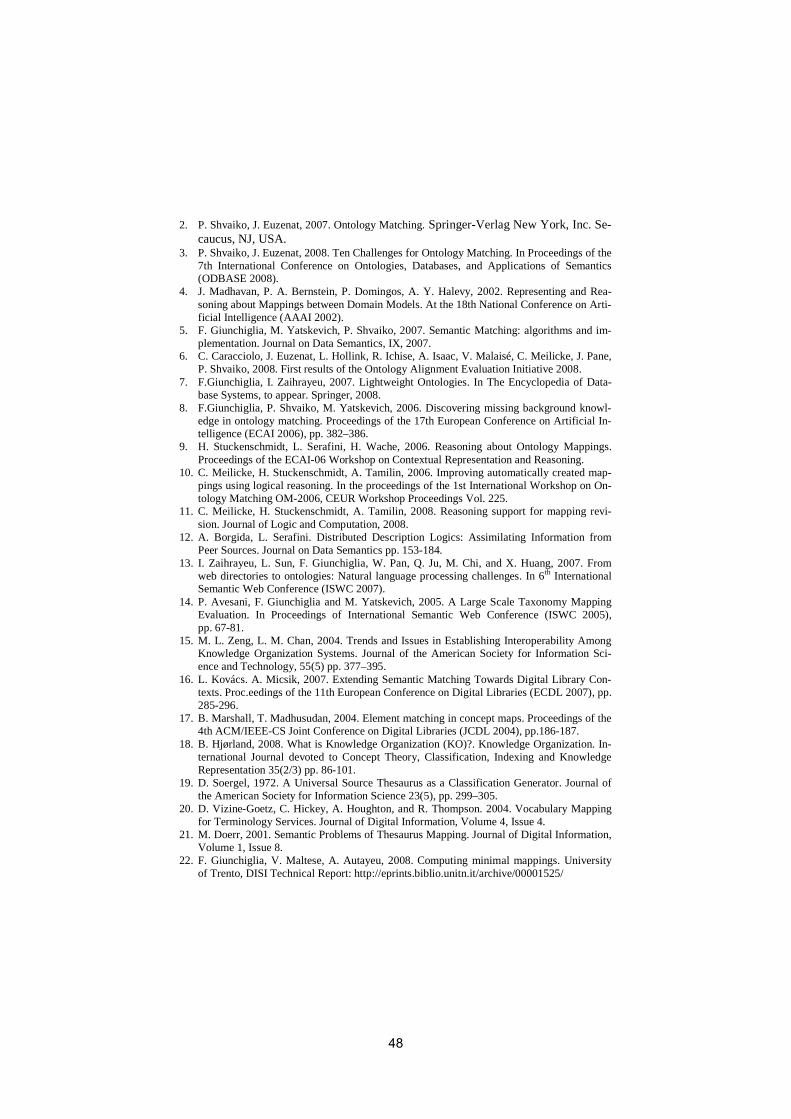
2. P. Shvaiko, J. Euzenat, 2007. Ontology Matching. Springer-Verlag New York, Inc. Se-caucus, NJ, USA.
3. P. Shvaiko, J. Euzenat, 2008. Ten Challenges for Ontology Matching. In Proceedings of the 7th International Conference on Ontologies, Databases, and Applications of Semantics (ODBASE 2008).
4. J. Madhavan, P. A. Bernstein, P. Domingos, A. Y. Halevy, 2002. Representing and Rea-soning about Mappings between Domain Models. At the 18th National Conference on Arti-ficial Intelligence (AAAI 2002).
5. F. Giunchiglia, M. Yatskevich, P. Shvaiko, 2007. Semantic Matching: algorithms and im-plementation. Journal on Data Semantics, IX, 2007.
6. C. Caracciolo, J. Euzenat, L. Hollink, R. Ichise, A. Isaac, V. Malaisé, C. Meilicke, J. Pane, P. Shvaiko, 2008. First results of the Ontology Alignment Evaluation Initiative 2008.
7. F.Giunchiglia, I. Zaihrayeu, 2007. Lightweight Ontologies. In The Encyclopedia of Data-base Systems, to appear. Springer, 2008.
8. F.Giunchiglia, P. Shvaiko, M. Yatskevich, 2006. Discovering missing background knowl-edge in ontology matching. Proceedings of the 17th European Conference on Artificial In-telligence (ECAI 2006), pp. 382–386.
9. H. Stuckenschmidt, L. Serafini, H. Wache, 2006. Reasoning about Ontology Mappings. Proceedings of the ECAI-06 Workshop on Contextual Representation and Reasoning.
10. C. Meilicke, H. Stuckenschmidt, A. Tamilin, 2006. Improving automatically created map-pings using logical reasoning. In the proceedings of the 1st International Workshop on On-tology Matching OM-2006, CEUR Workshop Proceedings Vol. 225.
11. C. Meilicke, H. Stuckenschmidt, A. Tamilin, 2008. Reasoning support for mapping revi-sion. Journal of Logic and Computation, 2008.
12. A. Borgida, L. Serafini. Distributed Description Logics: Assimilating Information from Peer Sources. Journal on Data Semantics pp. 153-184.
13. I. Zaihrayeu, L. Sun, F. Giunchiglia, W. Pan, Q. Ju, M. Chi, and X. Huang, 2007. From web directories to ontologies: Natural language processing challenges. In 6th International Semantic Web Conference (ISWC 2007).
14. P. Avesani, F. Giunchiglia and M. Yatskevich, 2005. A Large Scale Taxonomy Mapping Evaluation. In Proceedings of International Semantic Web Conference (ISWC 2005), pp. 67-81.
15. M. L. Zeng, L. M. Chan, 2004. Trends and Issues in Establishing Interoperability Among Knowledge Organization Systems. Journal of the American Society for Information Sci-ence and Technology, 55(5) pp. 377–395.
16. L. Kovács. A. Micsik, 2007. Extending Semantic Matching Towards Digital Library Con-texts. Proc.eedings of the 11th European Conference on Digital Libraries (ECDL 2007), pp. 285-296.
17. B. Marshall, T. Madhusudan, 2004. Element matching in concept maps. Proceedings of the 4th ACM/IEEE-CS Joint Conference on Digital Libraries (JCDL 2004), pp.186-187.
18. B. Hjørland, 2008. What is Knowledge Organization (KO)?. Knowledge Organization. In-ternational Journal devoted to Concept Theory, Classification, Indexing and Knowledge Representation 35(2/3) pp. 86-101.
19. D. Soergel, 1972. A Universal Source Thesaurus as a Classification Generator. Journal of the American Society for Information Science 23(5), pp. 299–305.
20. D. Vizine-Goetz, C. Hickey, A. Houghton, and R. Thompson. 2004. Vocabulary Mapping for Terminology Services. Journal of Digital Information, Volume 4, Issue 4.
21. M. Doerr, 2001. Semantic Problems of Thesaurus Mapping. Journal of Digital Information, Volume 1, Issue 8.
22. F. Giunchiglia, V. Maltese, A. Autayeu, 2008. Computing minimal mappings. University of Trento, DISI Technical Report: http://eprints.biblio.unitn.it/archive/00001525/
48
Efficient Selection of Mappings and AutomaticQuality-driven Combination of Matching Methods�
Isabel F. Cruz, Flavio Palandri Antonelli, and Cosmin Stroe
ADVIS LabDepartment of Computer ScienceUniversity of Illinois at Chicago
{ifc | flav | cstroe1}@cs.uic.edu
Abstract. The AgreementMaker system for ontology matching includes anextensible architecture that facilitates the integration and performance tun-ing of a variety of matching methods, an evaluation mechanism, which canmake use of a reference matching or rely solely on “inherent” quality measures,and a multi-purpose user interface, which drives both the matching methodsand the evaluation strategies. In this paper, we focus on two main featuresof AgreementMaker. The former is an optimized method that performs theselection of mappings given the similarities between entities computed by anymatching algorithm, a threshold value, and the desired cardinalities of themappings. Experiments show that our method is more efficient than the typ-ically adopted combinatorial method. The latter is the evaluation framework,which includes three “inherent” quality measures that can be used both toevaluate matching methods when a reference matching is not available andto combine multiple matching results by defining the weighting scheme of afully automatic combination method.
1 Introduction
The quest for correctness, completeness, and efficiency in the process of finding corre-spondences (or mappings) between semantically related entities of different real-worldontologies is a difficult and challenging task for several reasons. For example, an algo-rithm may be effective for a given scenario, but not for others. Even within the samescenario, the use of different parameters can change the outcome significantly. There-fore, state-of-the-art ontology matching systems [8] tend to adopt different strategieswithin the same infrastructure even though the intelligent combination of multiplematching results is still an open problem.
Our collaboration with domain experts in the geospatial domain [3] has revealedthat they value automatic matching methods, especially for ontologies with thousandsof concepts. However, they want to be able to evaluate the matching process, thusrequiring to be directly involved in the loop. Such considerations have motivatedthe most recent features of the AgreementMaker system1 for ontology matching [1,2]. These features include a comprehensive user interface supporting both advancedvisualization techniques and a control panel that drives all the matching methodsand evaluation strategies (Figure 1) and an extensible architecture to incorporatenew methods easily and to tune their performance. In this paper we concentrate onan optimization technique to produce the final set of mappings efficiently and on
� Research supported by NSF Awards ITR IIS-0326284, IIS-0513553, and IIS-0812258.1 www.AgreementMaker.org.
49
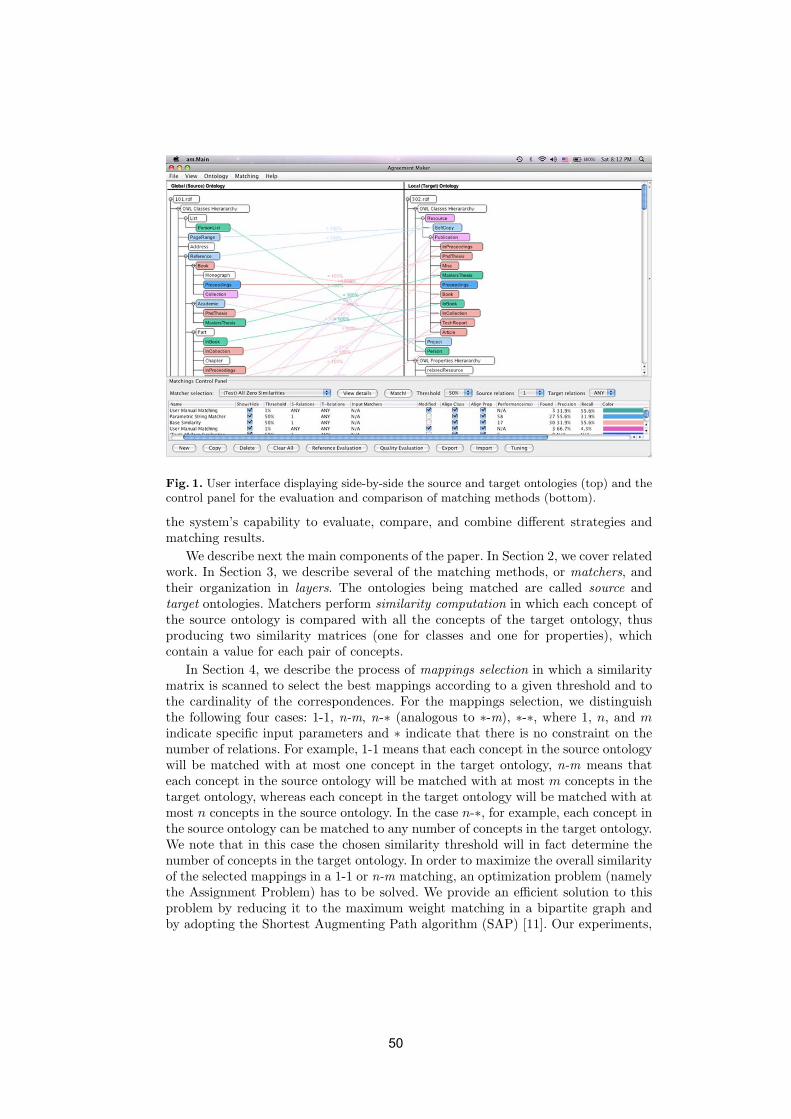
Fig. 1. User interface displaying side-by-side the source and target ontologies (top) and thecontrol panel for the evaluation and comparison of matching methods (bottom).
the system’s capability to evaluate, compare, and combine different strategies andmatching results.
We describe next the main components of the paper. In Section 2, we cover relatedwork. In Section 3, we describe several of the matching methods, or matchers, andtheir organization in layers. The ontologies being matched are called source andtarget ontologies. Matchers perform similarity computation in which each concept ofthe source ontology is compared with all the concepts of the target ontology, thusproducing two similarity matrices (one for classes and one for properties), whichcontain a value for each pair of concepts.
In Section 4, we describe the process of mappings selection in which a similaritymatrix is scanned to select the best mappings according to a given threshold and tothe cardinality of the correspondences. For the mappings selection, we distinguishthe following four cases: 1-1, n-m, n-∗ (analogous to ∗-m), ∗-∗, where 1, n, and mindicate specific input parameters and ∗ indicate that there is no constraint on thenumber of relations. For example, 1-1 means that each concept in the source ontologywill be matched with at most one concept in the target ontology, n-m means thateach concept in the source ontology will be matched with at most m concepts in thetarget ontology, whereas each concept in the target ontology will be matched with atmost n concepts in the source ontology. In the case n-∗, for example, each concept inthe source ontology can be matched to any number of concepts in the target ontology.We note that in this case the chosen similarity threshold will in fact determine thenumber of concepts in the target ontology. In order to maximize the overall similarityof the selected mappings in a 1-1 or n-m matching, an optimization problem (namelythe Assignment Problem) has to be solved. We provide an efficient solution to thisproblem by reducing it to the maximum weight matching in a bipartite graph andby adopting the Shortest Augmenting Path algorithm (SAP) [11]. Our experiments,
50
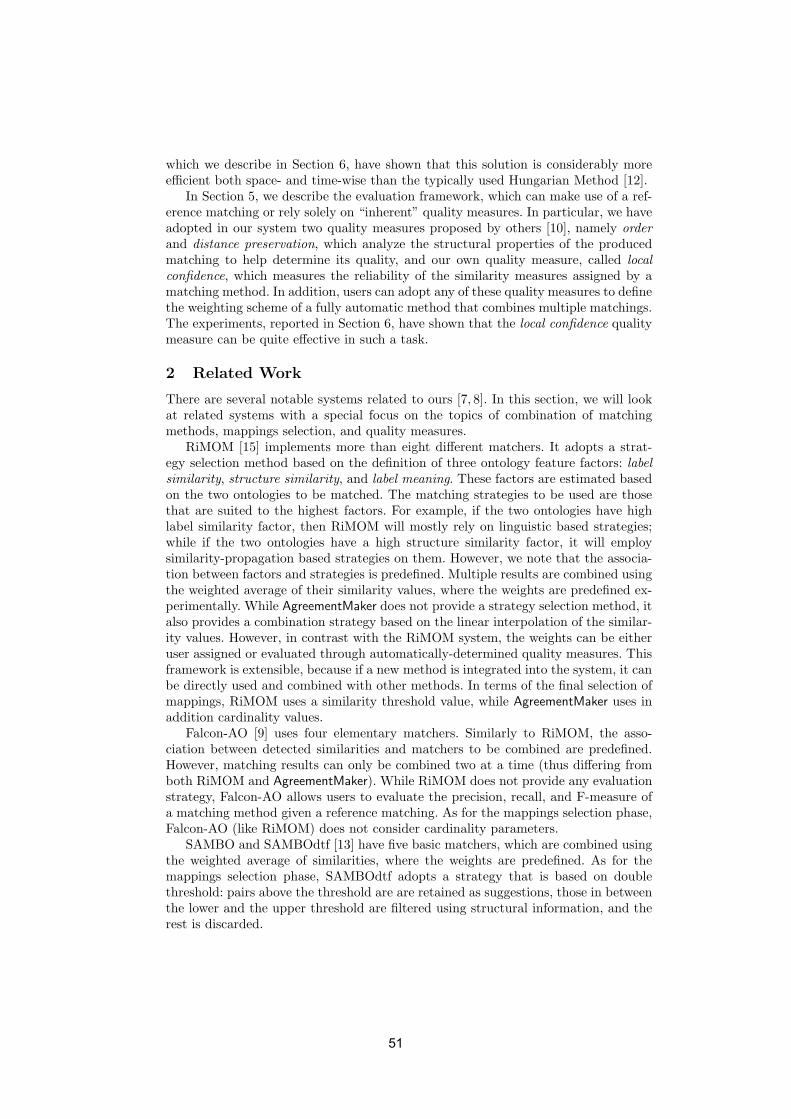
which we describe in Section 6, have shown that this solution is considerably moreefficient both space- and time-wise than the typically used Hungarian Method [12].
In Section 5, we describe the evaluation framework, which can make use of a ref-erence matching or rely solely on “inherent” quality measures. In particular, we haveadopted in our system two quality measures proposed by others [10], namely orderand distance preservation, which analyze the structural properties of the producedmatching to help determine its quality, and our own quality measure, called localconfidence, which measures the reliability of the similarity measures assigned by amatching method. In addition, users can adopt any of these quality measures to definethe weighting scheme of a fully automatic method that combines multiple matchings.The experiments, reported in Section 6, have shown that the local confidence qualitymeasure can be quite effective in such a task.
2 Related Work
There are several notable systems related to ours [7, 8]. In this section, we will lookat related systems with a special focus on the topics of combination of matchingmethods, mappings selection, and quality measures.
RiMOM [15] implements more than eight different matchers. It adopts a strat-egy selection method based on the definition of three ontology feature factors: labelsimilarity, structure similarity, and label meaning. These factors are estimated basedon the two ontologies to be matched. The matching strategies to be used are thosethat are suited to the highest factors. For example, if the two ontologies have highlabel similarity factor, then RiMOM will mostly rely on linguistic based strategies;while if the two ontologies have a high structure similarity factor, it will employsimilarity-propagation based strategies on them. However, we note that the associa-tion between factors and strategies is predefined. Multiple results are combined usingthe weighted average of their similarity values, where the weights are predefined ex-perimentally. While AgreementMaker does not provide a strategy selection method, italso provides a combination strategy based on the linear interpolation of the similar-ity values. However, in contrast with the RiMOM system, the weights can be eitheruser assigned or evaluated through automatically-determined quality measures. Thisframework is extensible, because if a new method is integrated into the system, it canbe directly used and combined with other methods. In terms of the final selection ofmappings, RiMOM uses a similarity threshold value, while AgreementMaker uses inaddition cardinality values.
Falcon-AO [9] uses four elementary matchers. Similarly to RiMOM, the asso-ciation between detected similarities and matchers to be combined are predefined.However, matching results can only be combined two at a time (thus differing fromboth RiMOM and AgreementMaker). While RiMOM does not provide any evaluationstrategy, Falcon-AO allows users to evaluate the precision, recall, and F-measure ofa matching method given a reference matching. As for the mappings selection phase,Falcon-AO (like RiMOM) does not consider cardinality parameters.
SAMBO and SAMBOdtf [13] have five basic matchers, which are combined usingthe weighted average of similarities, where the weights are predefined. As for themappings selection phase, SAMBOdtf adopts a strategy that is based on doublethreshold: pairs above the threshold are are retained as suggestions, those in betweenthe lower and the upper threshold are filtered using structural information, and therest is discarded.
51
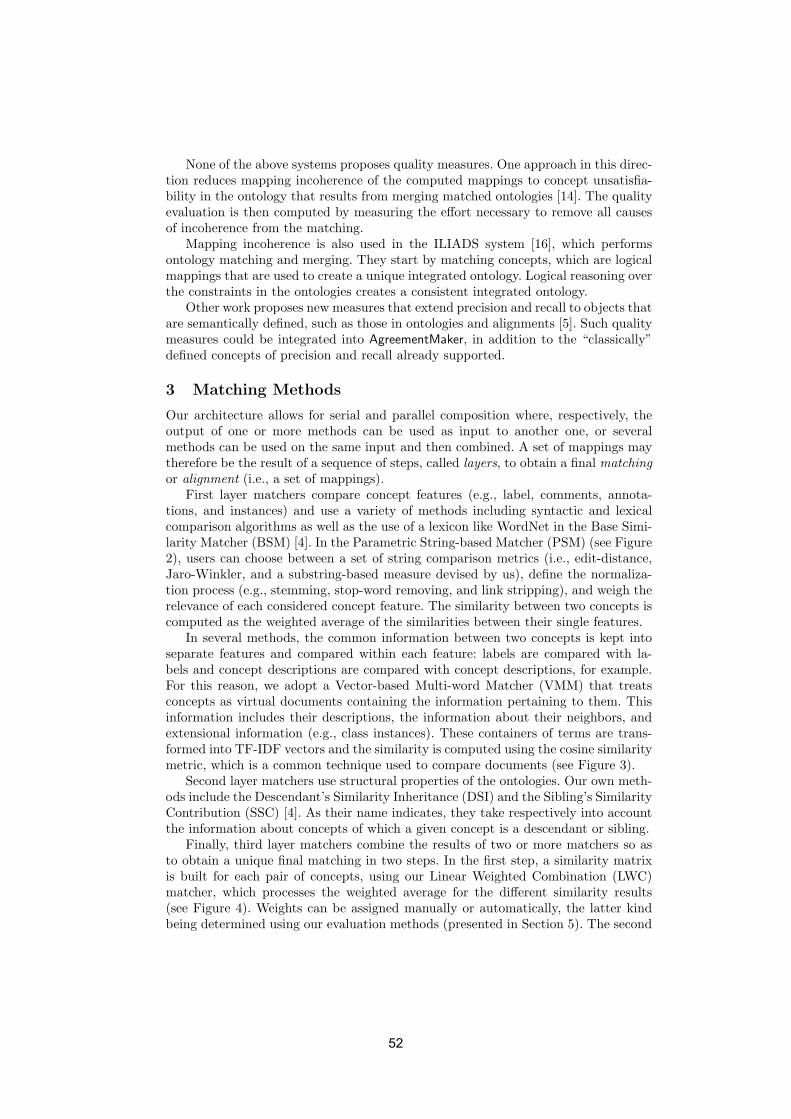
None of the above systems proposes quality measures. One approach in this direc-tion reduces mapping incoherence of the computed mappings to concept unsatisfia-bility in the ontology that results from merging matched ontologies [14]. The qualityevaluation is then computed by measuring the effort necessary to remove all causesof incoherence from the matching.
Mapping incoherence is also used in the ILIADS system [16], which performsontology matching and merging. They start by matching concepts, which are logicalmappings that are used to create a unique integrated ontology. Logical reasoning overthe constraints in the ontologies creates a consistent integrated ontology.
Other work proposes new measures that extend precision and recall to objects thatare semantically defined, such as those in ontologies and alignments [5]. Such qualitymeasures could be integrated into AgreementMaker, in addition to the “classically”defined concepts of precision and recall already supported.
3 Matching Methods
Our architecture allows for serial and parallel composition where, respectively, theoutput of one or more methods can be used as input to another one, or severalmethods can be used on the same input and then combined. A set of mappings maytherefore be the result of a sequence of steps, called layers, to obtain a final matchingor alignment (i.e., a set of mappings).
First layer matchers compare concept features (e.g., label, comments, annota-tions, and instances) and use a variety of methods including syntactic and lexicalcomparison algorithms as well as the use of a lexicon like WordNet in the Base Simi-larity Matcher (BSM) [4]. In the Parametric String-based Matcher (PSM) (see Figure2), users can choose between a set of string comparison metrics (i.e., edit-distance,Jaro-Winkler, and a substring-based measure devised by us), define the normaliza-tion process (e.g., stemming, stop-word removing, and link stripping), and weigh therelevance of each considered concept feature. The similarity between two concepts iscomputed as the weighted average of the similarities between their single features.
In several methods, the common information between two concepts is kept intoseparate features and compared within each feature: labels are compared with la-bels and concept descriptions are compared with concept descriptions, for example.For this reason, we adopt a Vector-based Multi-word Matcher (VMM) that treatsconcepts as virtual documents containing the information pertaining to them. Thisinformation includes their descriptions, the information about their neighbors, andextensional information (e.g., class instances). These containers of terms are trans-formed into TF-IDF vectors and the similarity is computed using the cosine similaritymetric, which is a common technique used to compare documents (see Figure 3).
Second layer matchers use structural properties of the ontologies. Our own meth-ods include the Descendant’s Similarity Inheritance (DSI) and the Sibling’s SimilarityContribution (SSC) [4]. As their name indicates, they take respectively into accountthe information about concepts of which a given concept is a descendant or sibling.
Finally, third layer matchers combine the results of two or more matchers so asto obtain a unique final matching in two steps. In the first step, a similarity matrixis built for each pair of concepts, using our Linear Weighted Combination (LWC)matcher, which processes the weighted average for the different similarity results(see Figure 4). Weights can be assigned manually or automatically, the latter kindbeing determined using our evaluation methods (presented in Section 5). The second
52
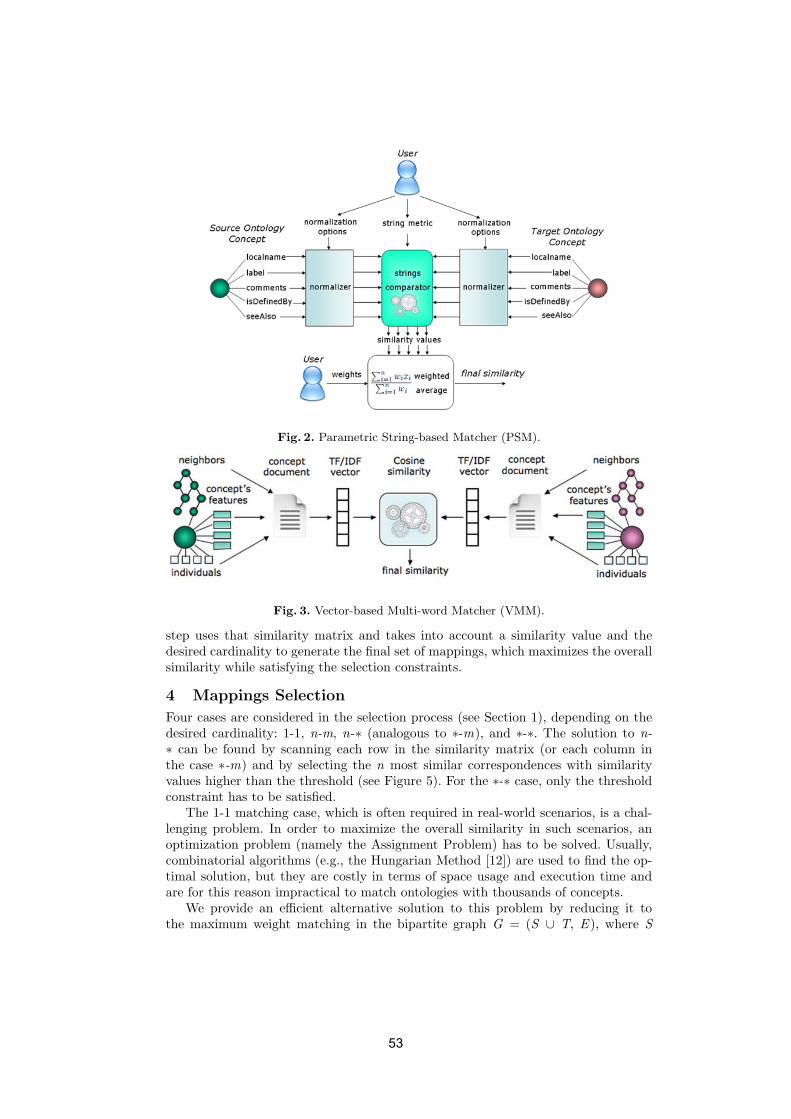
Fig. 2. Parametric String-based Matcher (PSM).
Fig. 3. Vector-based Multi-word Matcher (VMM).
step uses that similarity matrix and takes into account a similarity value and thedesired cardinality to generate the final set of mappings, which maximizes the overallsimilarity while satisfying the selection constraints.
4 Mappings Selection
Four cases are considered in the selection process (see Section 1), depending on thedesired cardinality: 1-1, n-m, n-∗ (analogous to ∗-m), and ∗-∗. The solution to n-∗ can be found by scanning each row in the similarity matrix (or each column inthe case ∗-m) and by selecting the n most similar correspondences with similarityvalues higher than the threshold (see Figure 5). For the ∗-∗ case, only the thresholdconstraint has to be satisfied.
The 1-1 matching case, which is often required in real-world scenarios, is a chal-lenging problem. In order to maximize the overall similarity in such scenarios, anoptimization problem (namely the Assignment Problem) has to be solved. Usually,combinatorial algorithms (e.g., the Hungarian Method [12]) are used to find the op-timal solution, but they are costly in terms of space usage and execution time andare for this reason impractical to match ontologies with thousands of concepts.
We provide an efficient alternative solution to this problem by reducing it tothe maximum weight matching in the bipartite graph G = (S ∪ T, E ), where S
53
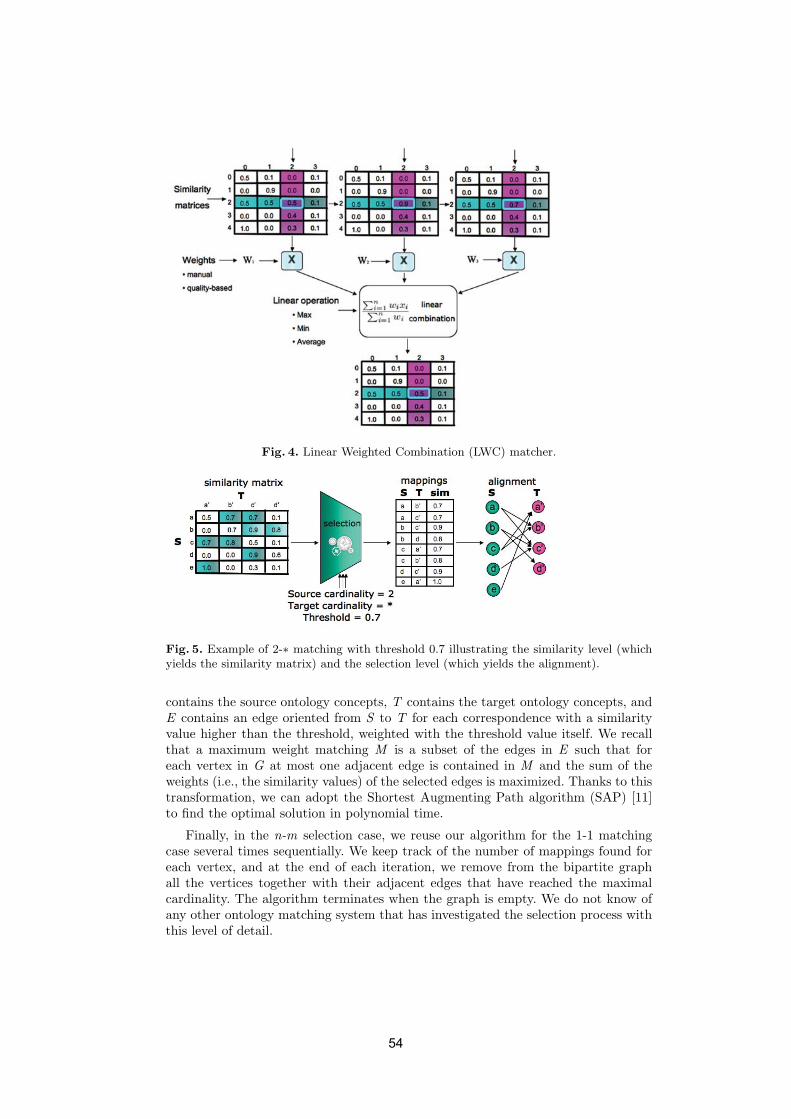
Fig. 4. Linear Weighted Combination (LWC) matcher.
Fig. 5. Example of 2-∗ matching with threshold 0.7 illustrating the similarity level (whichyields the similarity matrix) and the selection level (which yields the alignment).
contains the source ontology concepts, T contains the target ontology concepts, andE contains an edge oriented from S to T for each correspondence with a similarityvalue higher than the threshold, weighted with the threshold value itself. We recallthat a maximum weight matching M is a subset of the edges in E such that foreach vertex in G at most one adjacent edge is contained in M and the sum of theweights (i.e., the similarity values) of the selected edges is maximized. Thanks to thistransformation, we can adopt the Shortest Augmenting Path algorithm (SAP) [11]to find the optimal solution in polynomial time.
Finally, in the n-m selection case, we reuse our algorithm for the 1-1 matchingcase several times sequentially. We keep track of the number of mappings found foreach vertex, and at the end of each iteration, we remove from the bipartite graphall the vertices together with their adjacent edges that have reached the maximalcardinality. The algorithm terminates when the graph is empty. We do not know ofany other ontology matching system that has investigated the selection process withthis level of detail.
54
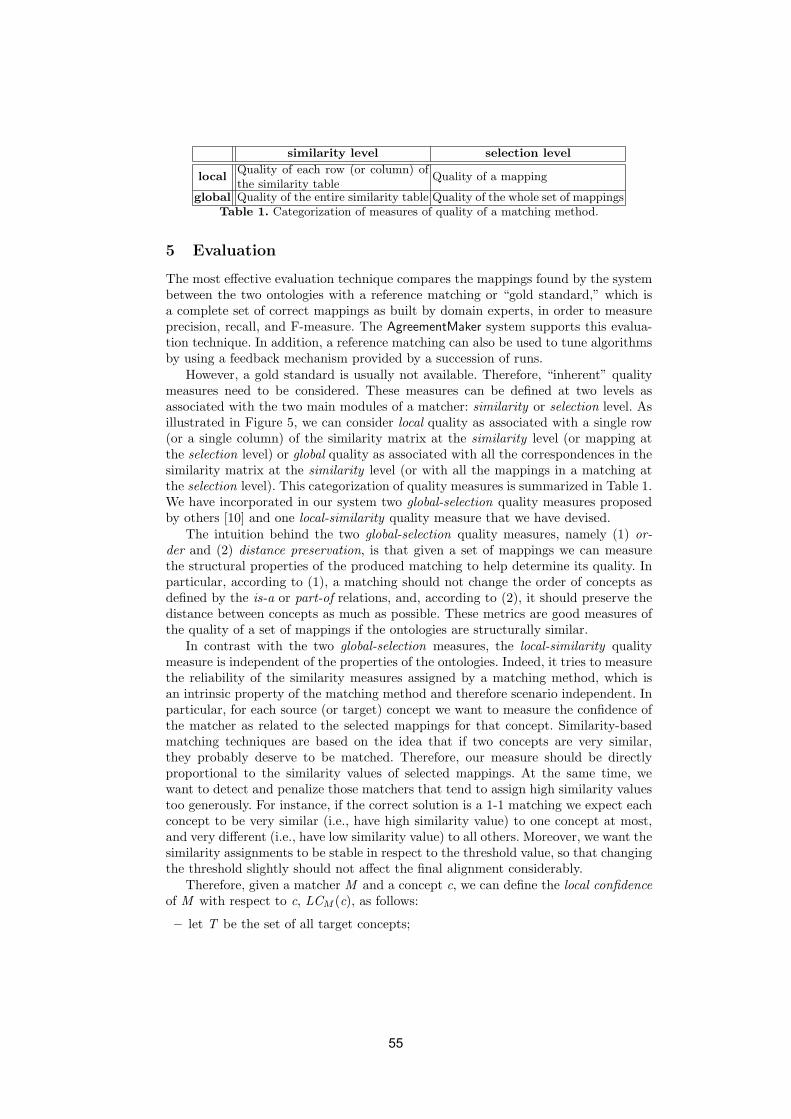
similarity level selection level
localQuality of each row (or column) ofthe similarity table
Quality of a mapping
global Quality of the entire similarity table Quality of the whole set of mappingsTable 1. Categorization of measures of quality of a matching method.
5 Evaluation
The most effective evaluation technique compares the mappings found by the systembetween the two ontologies with a reference matching or “gold standard,” which isa complete set of correct mappings as built by domain experts, in order to measureprecision, recall, and F-measure. The AgreementMaker system supports this evalua-tion technique. In addition, a reference matching can also be used to tune algorithmsby using a feedback mechanism provided by a succession of runs.
However, a gold standard is usually not available. Therefore, “inherent” qualitymeasures need to be considered. These measures can be defined at two levels asassociated with the two main modules of a matcher: similarity or selection level. Asillustrated in Figure 5, we can consider local quality as associated with a single row(or a single column) of the similarity matrix at the similarity level (or mapping atthe selection level) or global quality as associated with all the correspondences in thesimilarity matrix at the similarity level (or with all the mappings in a matching atthe selection level). This categorization of quality measures is summarized in Table 1.We have incorporated in our system two global-selection quality measures proposedby others [10] and one local-similarity quality measure that we have devised.
The intuition behind the two global-selection quality measures, namely (1) or-der and (2) distance preservation, is that given a set of mappings we can measurethe structural properties of the produced matching to help determine its quality. Inparticular, according to (1), a matching should not change the order of concepts asdefined by the is-a or part-of relations, and, according to (2), it should preserve thedistance between concepts as much as possible. These metrics are good measures ofthe quality of a set of mappings if the ontologies are structurally similar.
In contrast with the two global-selection measures, the local-similarity qualitymeasure is independent of the properties of the ontologies. Indeed, it tries to measurethe reliability of the similarity measures assigned by a matching method, which isan intrinsic property of the matching method and therefore scenario independent. Inparticular, for each source (or target) concept we want to measure the confidence ofthe matcher as related to the selected mappings for that concept. Similarity-basedmatching techniques are based on the idea that if two concepts are very similar,they probably deserve to be matched. Therefore, our measure should be directlyproportional to the similarity values of selected mappings. At the same time, wewant to detect and penalize those matchers that tend to assign high similarity valuestoo generously. For instance, if the correct solution is a 1-1 matching we expect eachconcept to be very similar (i.e., have high similarity value) to one concept at most,and very different (i.e., have low similarity value) to all others. Moreover, we want thesimilarity assignments to be stable in respect to the threshold value, so that changingthe threshold slightly should not affect the final alignment considerably.
Therefore, given a matcher M and a concept c, we can define the local confidenceof M with respect to c, LCM (c), as follows:
– let T be the set of all target concepts;
55
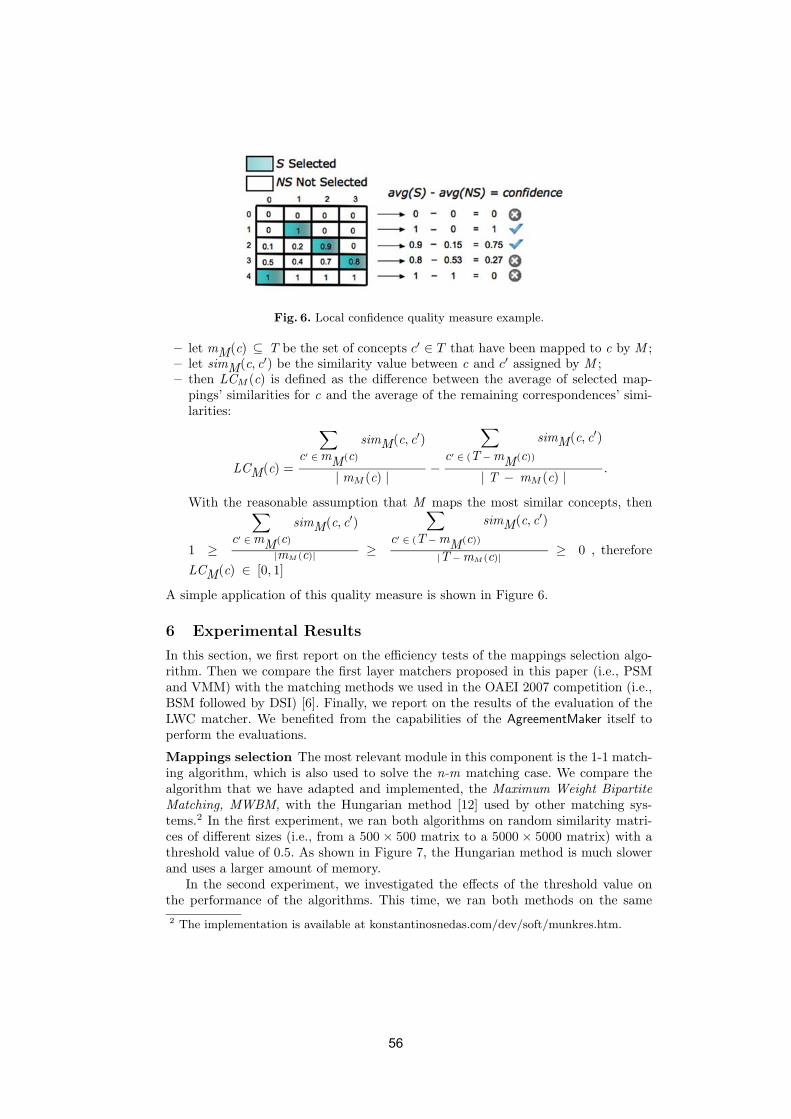
Fig. 6. Local confidence quality measure example.
– let mM(c) ⊆ T be the set of concepts c′ ∈ T that have been mapped to c by M ;– let simM(c, c′) be the similarity value between c and c′ assigned by M ;– then LCM (c) is defined as the difference between the average of selected map-
pings’ similarities for c and the average of the remaining correspondences’ simi-larities:
LCM(c) =
∑c′ ∈ mM(c)
simM(c, c′)
| mM (c) | −
∑c′ ∈ (T − mM(c))
simM(c, c′)
| T − mM (c) | .
With the reasonable assumption that M maps the most similar concepts, then
1 ≥
∑c′ ∈ mM(c)
simM(c, c′)
|mM (c)| ≥
∑c′ ∈ (T − mM(c))
simM(c, c′)
|T − mM (c)| ≥ 0 , therefore
LCM(c) ∈ [0, 1]
A simple application of this quality measure is shown in Figure 6.
6 Experimental Results
In this section, we first report on the efficiency tests of the mappings selection algo-rithm. Then we compare the first layer matchers proposed in this paper (i.e., PSMand VMM) with the matching methods we used in the OAEI 2007 competition (i.e.,BSM followed by DSI) [6]. Finally, we report on the results of the evaluation of theLWC matcher. We benefited from the capabilities of the AgreementMaker itself toperform the evaluations.
Mappings selection The most relevant module in this component is the 1-1 match-ing algorithm, which is also used to solve the n-m matching case. We compare thealgorithm that we have adapted and implemented, the Maximum Weight BipartiteMatching, MWBM, with the Hungarian method [12] used by other matching sys-tems.2 In the first experiment, we ran both algorithms on random similarity matri-ces of different sizes (i.e., from a 500 × 500 matrix to a 5000 × 5000 matrix) with athreshold value of 0.5. As shown in Figure 7, the Hungarian method is much slowerand uses a larger amount of memory.
In the second experiment, we investigated the effects of the threshold value onthe performance of the algorithms. This time, we ran both methods on the same
2 The implementation is available at konstantinosnedas.com/dev/soft/munkres.htm.
56
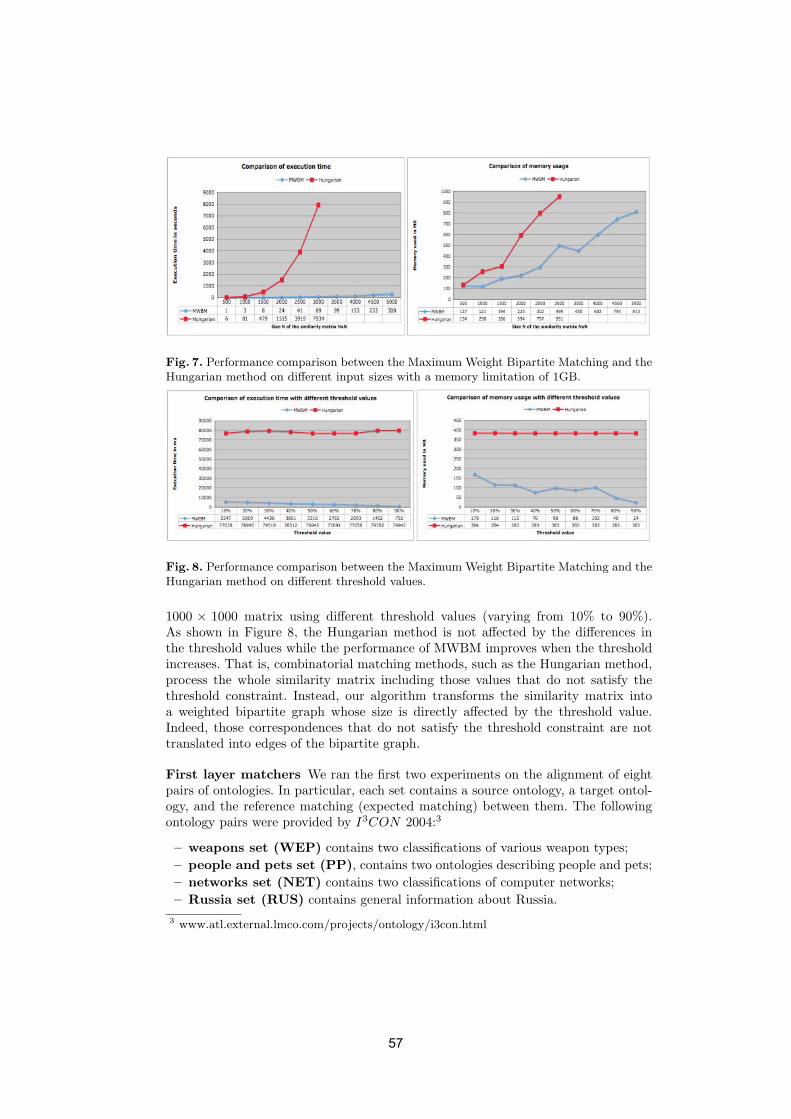
Fig. 7. Performance comparison between the Maximum Weight Bipartite Matching and theHungarian method on different input sizes with a memory limitation of 1GB.
Fig. 8. Performance comparison between the Maximum Weight Bipartite Matching and theHungarian method on different threshold values.
1000 × 1000 matrix using different threshold values (varying from 10% to 90%).As shown in Figure 8, the Hungarian method is not affected by the differences inthe threshold values while the performance of MWBM improves when the thresholdincreases. That is, combinatorial matching methods, such as the Hungarian method,process the whole similarity matrix including those values that do not satisfy thethreshold constraint. Instead, our algorithm transforms the similarity matrix intoa weighted bipartite graph whose size is directly affected by the threshold value.Indeed, those correspondences that do not satisfy the threshold constraint are nottranslated into edges of the bipartite graph.
First layer matchers We ran the first two experiments on the alignment of eightpairs of ontologies. In particular, each set contains a source ontology, a target ontol-ogy, and the reference matching (expected matching) between them. The followingontology pairs were provided by I3CON 2004:3
– weapons set (WEP) contains two classifications of various weapon types;
– people and pets set (PP), contains two ontologies describing people and pets;
– networks set (NET) contains two classifications of computer networks;
– Russia set (RUS) contains general information about Russia.
3 www.atl.external.lmco.com/projects/ontology/i3con.html
57
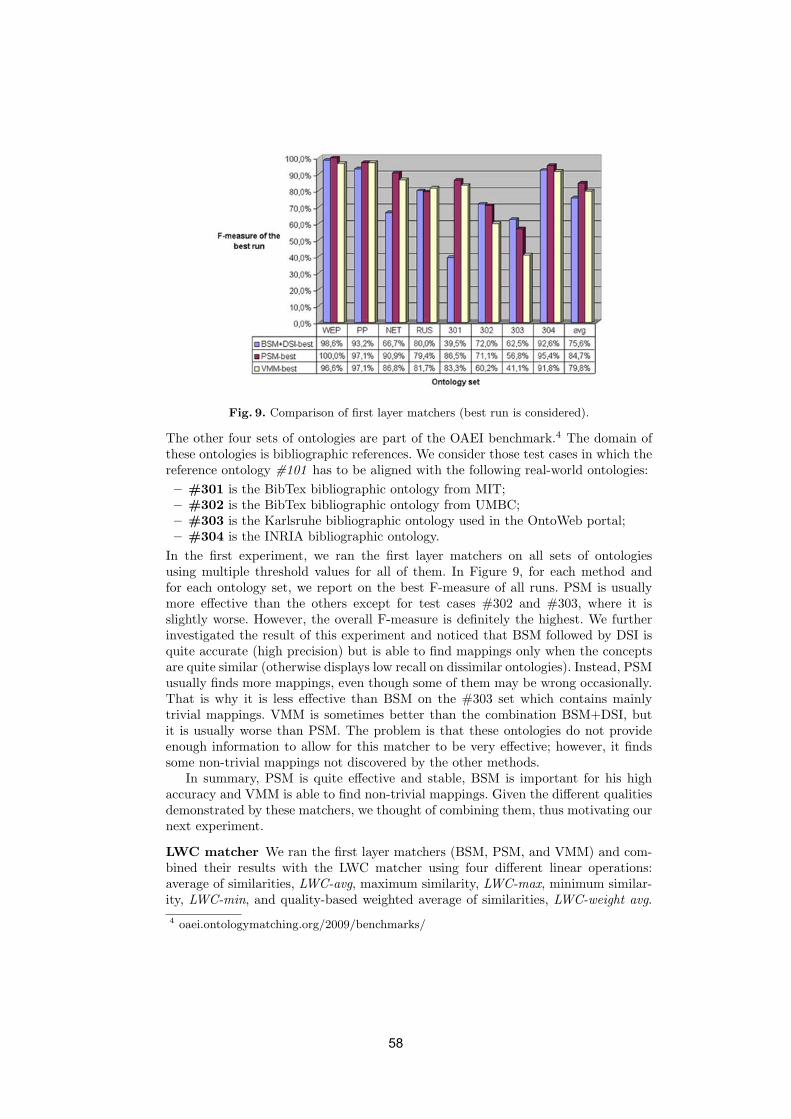
Fig. 9. Comparison of first layer matchers (best run is considered).
The other four sets of ontologies are part of the OAEI benchmark.4 The domain ofthese ontologies is bibliographic references. We consider those test cases in which thereference ontology #101 has to be aligned with the following real-world ontologies:
– #301 is the BibTex bibliographic ontology from MIT;– #302 is the BibTex bibliographic ontology from UMBC;– #303 is the Karlsruhe bibliographic ontology used in the OntoWeb portal;– #304 is the INRIA bibliographic ontology.
In the first experiment, we ran the first layer matchers on all sets of ontologiesusing multiple threshold values for all of them. In Figure 9, for each method andfor each ontology set, we report on the best F-measure of all runs. PSM is usuallymore effective than the others except for test cases #302 and #303, where it isslightly worse. However, the overall F-measure is definitely the highest. We furtherinvestigated the result of this experiment and noticed that BSM followed by DSI isquite accurate (high precision) but is able to find mappings only when the conceptsare quite similar (otherwise displays low recall on dissimilar ontologies). Instead, PSMusually finds more mappings, even though some of them may be wrong occasionally.That is why it is less effective than BSM on the #303 set which contains mainlytrivial mappings. VMM is sometimes better than the combination BSM+DSI, butit is usually worse than PSM. The problem is that these ontologies do not provideenough information to allow for this matcher to be very effective; however, it findssome non-trivial mappings not discovered by the other methods.
In summary, PSM is quite effective and stable, BSM is important for his highaccuracy and VMM is able to find non-trivial mappings. Given the different qualitiesdemonstrated by these matchers, we thought of combining them, thus motivating ournext experiment.
LWC matcher We ran the first layer matchers (BSM, PSM, and VMM) and com-bined their results with the LWC matcher using four different linear operations:average of similarities, LWC-avg, maximum similarity, LWC-max, minimum similar-ity, LWC-min, and quality-based weighted average of similarities, LWC-weight avg.4 oaei.ontologymatching.org/2009/benchmarks/
58
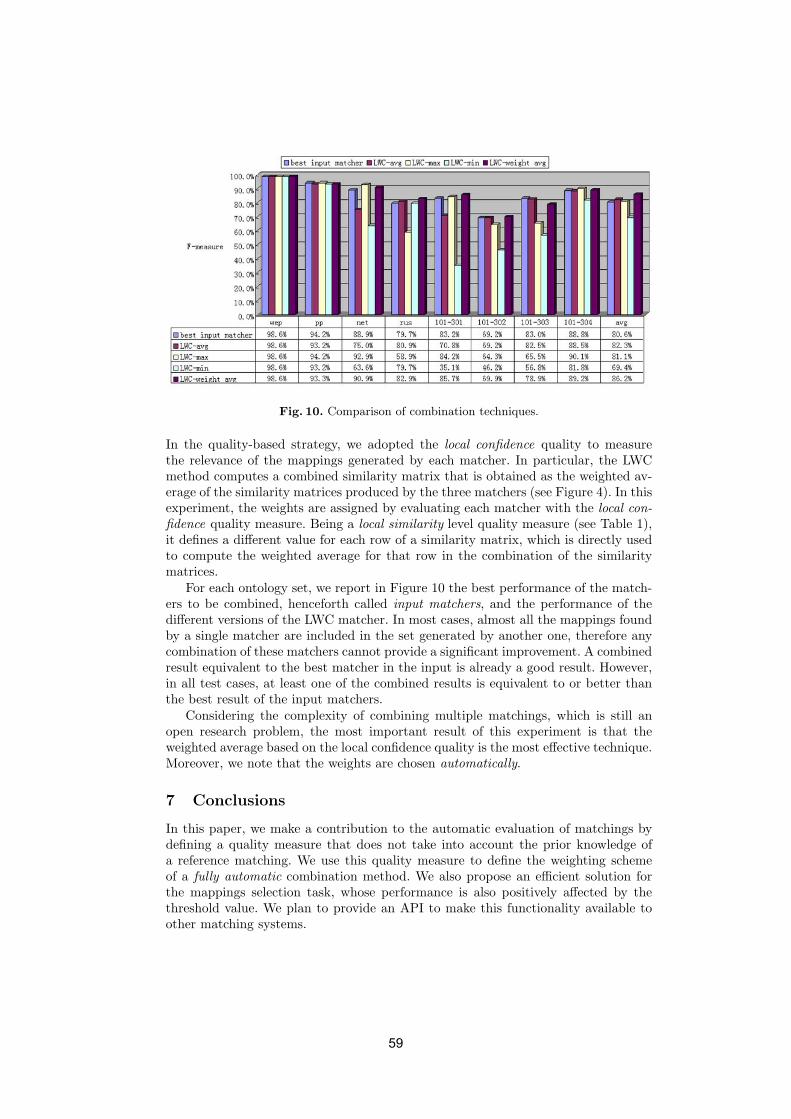
Fig. 10. Comparison of combination techniques.
In the quality-based strategy, we adopted the local confidence quality to measurethe relevance of the mappings generated by each matcher. In particular, the LWCmethod computes a combined similarity matrix that is obtained as the weighted av-erage of the similarity matrices produced by the three matchers (see Figure 4). In thisexperiment, the weights are assigned by evaluating each matcher with the local con-fidence quality measure. Being a local similarity level quality measure (see Table 1),it defines a different value for each row of a similarity matrix, which is directly usedto compute the weighted average for that row in the combination of the similaritymatrices.
For each ontology set, we report in Figure 10 the best performance of the match-ers to be combined, henceforth called input matchers, and the performance of thedifferent versions of the LWC matcher. In most cases, almost all the mappings foundby a single matcher are included in the set generated by another one, therefore anycombination of these matchers cannot provide a significant improvement. A combinedresult equivalent to the best matcher in the input is already a good result. However,in all test cases, at least one of the combined results is equivalent to or better thanthe best result of the input matchers.
Considering the complexity of combining multiple matchings, which is still anopen research problem, the most important result of this experiment is that theweighted average based on the local confidence quality is the most effective technique.Moreover, we note that the weights are chosen automatically.
7 Conclusions
In this paper, we make a contribution to the automatic evaluation of matchings bydefining a quality measure that does not take into account the prior knowledge ofa reference matching. We use this quality measure to define the weighting schemeof a fully automatic combination method. We also propose an efficient solution forthe mappings selection task, whose performance is also positively affected by thethreshold value. We plan to provide an API to make this functionality available toother matching systems.
59
In the future, we will take advantage of our extensible architecture and add newmatching methods, for example, to our instance based methods. We plan to studynew quality measures to enhance the current evaluation capabilities and our quality-based combination technique. Another direction for future research includes usingpartial reference matchings to perform the alignment of full ontologies.
References
1. I. F. Cruz, F. Palandri Antonelli, and C. Stroe. AgreementMaker: Efficient Matchingfor Large Real-World Schemas and Ontologies. PVLDB, 2(2):1586–1589, 2009.
2. I. F. Cruz, F. Palandri Antonelli, and C. Stroe. Integrated Ontology Matching andEvaluation. In International Semantic Web Conference (Posters & Demos), 2009. Toappear.
3. I. F. Cruz, A. Rajendran, W. Sunna, and N. Wiegand. Handling Semantic Hetero-geneities using Declarative Agreements. In ACM Symposium on Advances in GeographicInformation Systems (ACM GIS), pages 168–174, 2002.
4. I. F. Cruz and W. Sunna. Structural Alignment Methods with Applications to Geospa-tial Ontologies. Transactions in GIS, Special Issue on Semantic Similarity Measurementand Geospatial Applications, 12(6):683–711, December 2008.
5. J. Euzenat. Semantic Precision and Recall for Ontology Alignment Evaluation. InInternational Joint Conference on Artificial Intelligence (IJCAI), pages 348–353, 2007.
6. J. Euzenat, A. Isaac, C. Meilicke, P. Shvaiko, H. Stuckenschmidt, O. Svab, V. Svatek,W. R. van Hage, and M. Yatskevich. Results of the Ontology Evaluation Initiative 2007.In ISWC International Workshop on Ontology Matching (OM), volume 304, pages 96–132. CEUR-WS, 2007.
7. J. Euzenat, M. Mochol, P. Shvaiko, H. Stuckenschmidt, V. Svatek, W. R. van Hage,and M. Yatskevich. Results of the Ontology Alignment Evaluation Initiative. In ISWCInternational Workshop on Ontology Matching (OM), volume 225, pages 73–95. CEUR-WS, 2006.
8. J. Euzenat and P. Shvaiko. Ontology matching. Springer-Verlag, Heidelberg (DE), 2007.9. N. Jian, W. Hu, G. Cheng, and Y. Qu. Falcon-AO: Aligning Ontologies with Falcon. In
K-CAP 2005 Workshop on Integrating Ontologies, volume 156, pages 85–91. CEUR-WS,2005.
10. C. Joslyn, A. Donaldson, and P. Paulson. Evaluating the Structural Quality of SemanticHierarchy Alignments. In International Semantic Web Conference (Posters & Demos),volume 401. CEUR-WS, 2008.
11. R. M. Karp. An Algorithm to Solve the m× n Assignment Problem in Expected TimeO(mn log n). Networks, 10(2):143–152, 1980.
12. H. W. Kuhn. The Hungarian Method for the Assignment Problem. Naval ResearchLogistic Quarterly, 2:83–97, 1955.
13. P. Lambrix, H. Tan, and Q. Liu. SAMBO and SAMBOdtf Results for the OntologyAlignment Evaluation Initiative 2008. In ISWC International Workshop on OntologyMatching (OM), volume 431. CEUR-WS, 2008.
14. C. Meilicke and H. Stuckenschmidt. Incoherence as a Basis for Measuring the Qualityof Ontology Mappings. In ISWC International Workshop on Ontology Matching (OM),volume 431. CEUR-WS, 2008.
15. J. Tang, J. Li, B. Liang, X. Huang, Y. Li, and K. Wang. Using Bayesian Decision forOntology Mapping. Journal of Web Semantics, 4(4):243–262, 2006.
16. O. Udrea, L. Getoor, and R. J. Miller. Leveraging Data and Structure in OntologyIntegration. In ACM SIGMOD International Conference on Management of Data,pages 449–460, 2007.
60
Measuring the Structural Preservation of
Semantic Hierarchy Alignments
Cliff A Joslyn, Patrick Paulson, and Amanda White
Pacific Northwest National Laboratory, Richland, WA, USA{cjoslyn,patrick.paulson,amanda.white}@pnl.gov
Abstract. We present a method to measure the amount of structuraldistortion carried by an alignment between two taxonomic cores of on-tologies represented as semantic hierarchies. We present our formalismbased in metric order theory. We then illustrate the results of such ananalysis on the Anatomy track of the 2008 Ontology Alignment Evalua-tion Initiative (OAEI).
Key words: Ontology alignment; lattice theory; order theory.
1 IntroductionSince top-down, monolithic development of unitary ontologies is at best difficult,and at worst undesirable, ontology alignment is increasingly seen as a critical Se-mantic Web technology [4, 17]. Although many semantic relations can be presentin ontologies, they tend to be dominated by their taxonomic cores; that is, sub-sumptive inheritance (is-a) and/or meronomic compositional (part-of) classhierarchies. Thus techniques which address the specific nature of these structuresas semantic hierarchies are critical for ontology management tasks.
An alignment is modeled as a mapping (single- or multi-valued) between twosemantic hierarchies, taking concepts from one into another. Depending on therelative size, structure, and domains of the two hierarchies, their quality, andthe size and quality of the alignment, different properties of the alignment mighthold. It might be that that mapping is partial in one direction or the other; it maybe concentrated in one portion or another of each hierarchy; may takes nodeswhich are “close together” in one hierarchy into nodes which are “far apart”in the other; and may take nodes in a particular structural relationship (e.g.parent-child or sibling) into the same or a different such structural relationship.Knowledge of such properties is valuable for the ontology designer and aligner,an important adjunct to visual inspection of large ontologies and alignments.
One straightforward example of this reasoning is to say that if the two se-mantic hierarchies were intended to model the same domain, then an alignmentmapping should be structure-preserving, taking pairs of nodes which are closetogether in one structure into pairs which are also close together in the other,and similarly for pairs of nodes which are far apart. To the extent that this is notthe case, this could indicate a problem with either one ontology, the other, thealignment mapping, or some combination of these structures. Even when seman-tic or pragmatic criteria dictate that it is appropriate for a mapping to violatestructural preservation, it is still valuable to be able to measure and quantify theamount of structural preservation or distortion which an alignment introduces.
61
2 Joslyn et al.
This is true both after the alignment has been produced, and also while thealignment is being produced, for example in an interactive environment such asthe Protege tool PROMPT [17].
We describe an algorithmic approach to the measurement of the extent towhich an ontology alignment preserves the structural properties of the two on-tologies. We use order theory (the formal theory of hierarchy represented byordered sets and lattices [3]) to model taxonomies as semantic hierarchies on setsof nodes P , where nodes a ∈ P are ontology concepts related by transitive edgessuch as subsumption (“is-a”) or composition (“part-of”). These in turn arerepresented as finite, bounded, partially ordered sets (posets) P = 〈P,≤〉, wherethe relation ≤ is one (or a union) of these transitive link types. Such orderedstructures are not, in general, trees, nor even lattices, but can be rich in multipleinheritance and lack unique least common subsumers between nodes.
We demonstrate our approach by analyzing the alignments of the Anatomytrack of the 2008 Ontology Alignment Evaluation Initiative (OAEI) campaign(http://oaei.ontologymatching.org/2008/anatomy). We compare the precision andrecall results of the OAEI against our discrepancy measures, as well as analyzethe highest discrepancy nodes and alignment links.
Prior work in both ontology alignment in general, and graph matching inknowledge systems (e.g. [7]), is voluminous, and order theory is used in manyareas of computer science outside of knowledge systems. But there is relativelylittle in the ontology literature about measuring structural relations in ontologies,and we’ve been able to find nothing in the specific use of a lattice theoreticalapproach to hierarchy mapping and measurement. Kalfoglou and Schorlemmer[12] have an approach to order morphisms similar to ours; and some researchers[5,17] take a structure mapping approach, but do so as a graph theory problem,not using hierarchy theory. Although He and Xiaoyong [8] recognize the need towork in order theory, they don’t actually do so.
The algebraic relations among class extents and intents used by a numberof researchers (e.g. [14,15]) do point to metric properties similar to ours. Butwhile these have implications for an order-theoretical approach, they are notthemselves explicitly order-theoretical. The closest correlate to our order metricapproach is in the use of “semantic similarity” measures [1]. Still, these aregenerally used within a particular lexical or bio-ontology, and have only beenused to a small extent [19] as an adjunct to the alignment problem. Some ofour work [10] marries structural similarities with our order metrics. We areactively working [18] to identify how our order metrics are actually foundationalto semantic similarities, and generate them as a special case.
An early desription of this concept has been previously reported in a poster[11].
2 Order Theory for Semantic Hierarchy Alignment
We represent semantic hierarchies as bounded, partially ordered sets (posets)P = 〈P,≤〉 [3], where P is a finite set of ontology nodes, and ≤ ⊆ P 2 is a reflex-ive, anti-symmetric, and transitive binary relation such as subsumption (“is-a”)
62
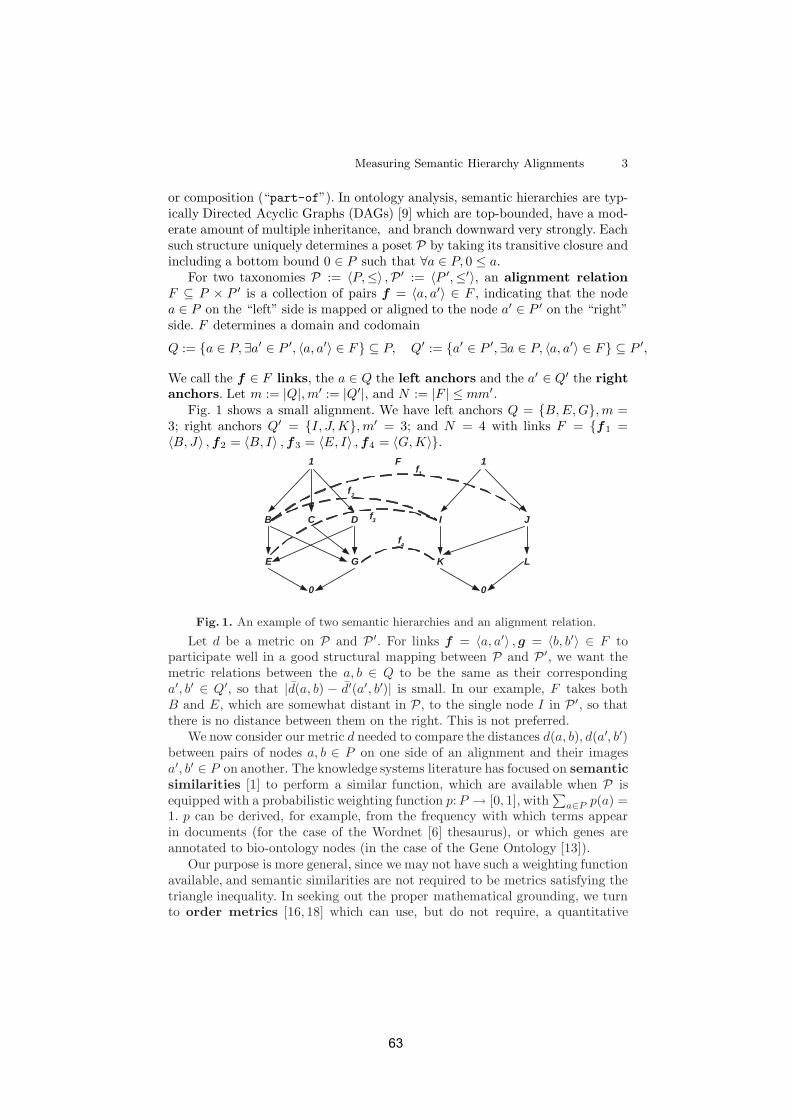
Measuring Semantic Hierarchy Alignments 3
or composition (“part-of”). In ontology analysis, semantic hierarchies are typ-ically Directed Acyclic Graphs (DAGs) [9] which are top-bounded, have a mod-erate amount of multiple inheritance, and branch downward very strongly. Eachsuch structure uniquely determines a poset P by taking its transitive closure andincluding a bottom bound 0 ∈ P such that ∀a ∈ P, 0 ≤ a.
For two taxonomies P := 〈P,≤〉 ,P′ := 〈P ′,≤′〉, an alignment relationF ⊆ P × P ′ is a collection of pairs f = 〈a, a′〉 ∈ F , indicating that the nodea ∈ P on the “left” side is mapped or aligned to the node a′ ∈ P ′ on the “right”side. F determines a domain and codomain
Q := {a ∈ P, ∃a′ ∈ P ′, 〈a, a′〉 ∈ F} ⊆ P, Q′ := {a′ ∈ P ′, ∃a ∈ P, 〈a, a′〉 ∈ F} ⊆ P ′,
We call the f ∈ F links, the a ∈ Q the left anchors and the a′ ∈ Q′ the rightanchors. Let m := |Q|, m′ := |Q′|, and N := |F | ≤ mm′.
Fig. 1 shows a small alignment. We have left anchors Q = {B, E, G}, m =3; right anchors Q′ = {I, J, K}, m′ = 3; and N = 4 with links F = {f1 =〈B, J〉 , f2 = 〈B, I〉 , f3 = 〈E, I〉 , f4 = 〈G, K〉}.
G
B C
E K
I J
L
D
1 1F
0 0
f1
f2
f3
f4
Fig. 1. An example of two semantic hierarchies and an alignment relation.
Let d be a metric on P and P′. For links f = 〈a, a′〉 , g = 〈b, b′〉 ∈ F toparticipate well in a good structural mapping between P and P ′, we want themetric relations between the a, b ∈ Q to be the same as their correspondinga′, b′ ∈ Q′, so that |d(a, b) − d′(a′, b′)| is small. In our example, F takes bothB and E, which are somewhat distant in P, to the single node I in P ′, so thatthere is no distance between them on the right. This is not preferred.
We now consider our metric d needed to compare the distances d(a, b), d(a′, b′)between pairs of nodes a, b ∈ P on one side of an alignment and their imagesa′, b′ ∈ P on another. The knowledge systems literature has focused on semanticsimilarities [1] to perform a similar function, which are available when P isequipped with a probabilistic weighting function p: P → [0, 1], with
∑a∈P p(a) =
1. p can be derived, for example, from the frequency with which terms appearin documents (for the case of the Wordnet [6] thesaurus), or which genes areannotated to bio-ontology nodes (in the case of the Gene Ontology [13]).
Our purpose is more general, since we may not have such a weighting functionavailable, and semantic similarities are not required to be metrics satisfying thetriangle inequality. In seeking out the proper mathematical grounding, we turnto order metrics [16, 18] which can use, but do not require, a quantitative
63
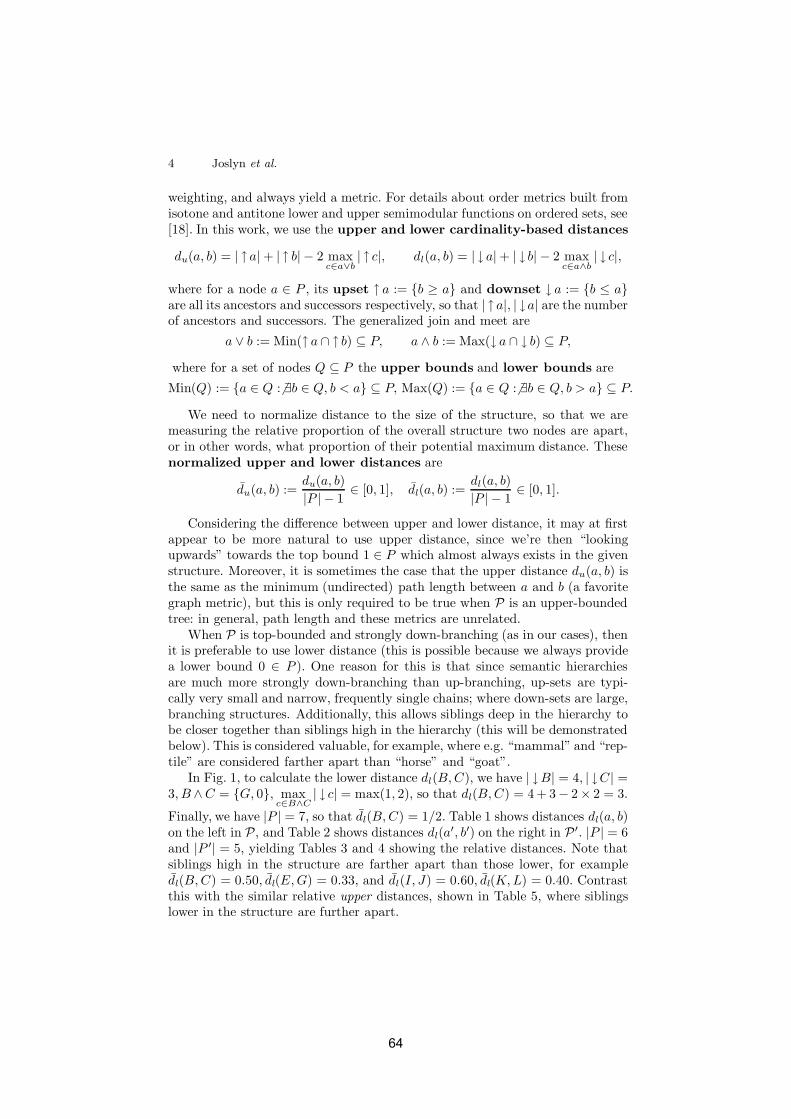
4 Joslyn et al.
weighting, and always yield a metric. For details about order metrics built fromisotone and antitone lower and upper semimodular functions on ordered sets, see[18]. In this work, we use the upper and lower cardinality-based distances
du(a, b) = | ↑a| + | ↑ b| − 2 maxc∈a∨b
| ↑ c|, dl(a, b) = | ↓a|+ | ↓ b| − 2 maxc∈a∧b
| ↓ c|,
where for a node a ∈ P , its upset ↑ a := {b ≥ a} and downset ↓ a := {b ≤ a}are all its ancestors and successors respectively, so that | ↑a|, | ↓a| are the numberof ancestors and successors. The generalized join and meet are
a ∨ b := Min(↑ a ∩ ↑ b) ⊆ P, a ∧ b := Max(↓ a ∩ ↓ b) ⊆ P,
where for a set of nodes Q ⊆ P the upper bounds and lower bounds are
Min(Q) := {a ∈ Q :� ∃b ∈ Q, b < a} ⊆ P, Max(Q) := {a ∈ Q :� ∃b ∈ Q, b > a} ⊆ P.
We need to normalize distance to the size of the structure, so that we aremeasuring the relative proportion of the overall structure two nodes are apart,or in other words, what proportion of their potential maximum distance. Thesenormalized upper and lower distances are
du(a, b) :=du(a, b)|P | − 1
∈ [0, 1], dl(a, b) :=dl(a, b)|P | − 1
∈ [0, 1].
Considering the difference between upper and lower distance, it may at firstappear to be more natural to use upper distance, since we’re then “lookingupwards” towards the top bound 1 ∈ P which almost always exists in the givenstructure. Moreover, it is sometimes the case that the upper distance du(a, b) isthe same as the minimum (undirected) path length between a and b (a favoritegraph metric), but this is only required to be true when P is an upper-boundedtree: in general, path length and these metrics are unrelated.
When P is top-bounded and strongly down-branching (as in our cases), thenit is preferable to use lower distance (this is possible because we always providea lower bound 0 ∈ P ). One reason for this is that since semantic hierarchiesare much more strongly down-branching than up-branching, up-sets are typi-cally very small and narrow, frequently single chains; where down-sets are large,branching structures. Additionally, this allows siblings deep in the hierarchy tobe closer together than siblings high in the hierarchy (this will be demonstratedbelow). This is considered valuable, for example, where e.g. “mammal” and “rep-tile” are considered farther apart than “horse” and “goat”.
In Fig. 1, to calculate the lower distance dl(B, C), we have | ↓B| = 4, | ↓C| =3, B ∧C = {G, 0}, max
c∈B∧C| ↓ c| = max(1, 2), so that dl(B, C) = 4 + 3− 2× 2 = 3.
Finally, we have |P | = 7, so that dl(B, C) = 1/2. Table 1 shows distances dl(a, b)on the left in P, and Table 2 shows distances dl(a′, b′) on the right in P′. |P | = 6and |P ′| = 5, yielding Tables 3 and 4 showing the relative distances. Note thatsiblings high in the structure are farther apart than those lower, for exampledl(B, C) = 0.50, dl(E, G) = 0.33, and dl(I, J) = 0.60, dl(K, L) = 0.40. Contrastthis with the similar relative upper distances, shown in Table 5, where siblingslower in the structure are further apart.
64
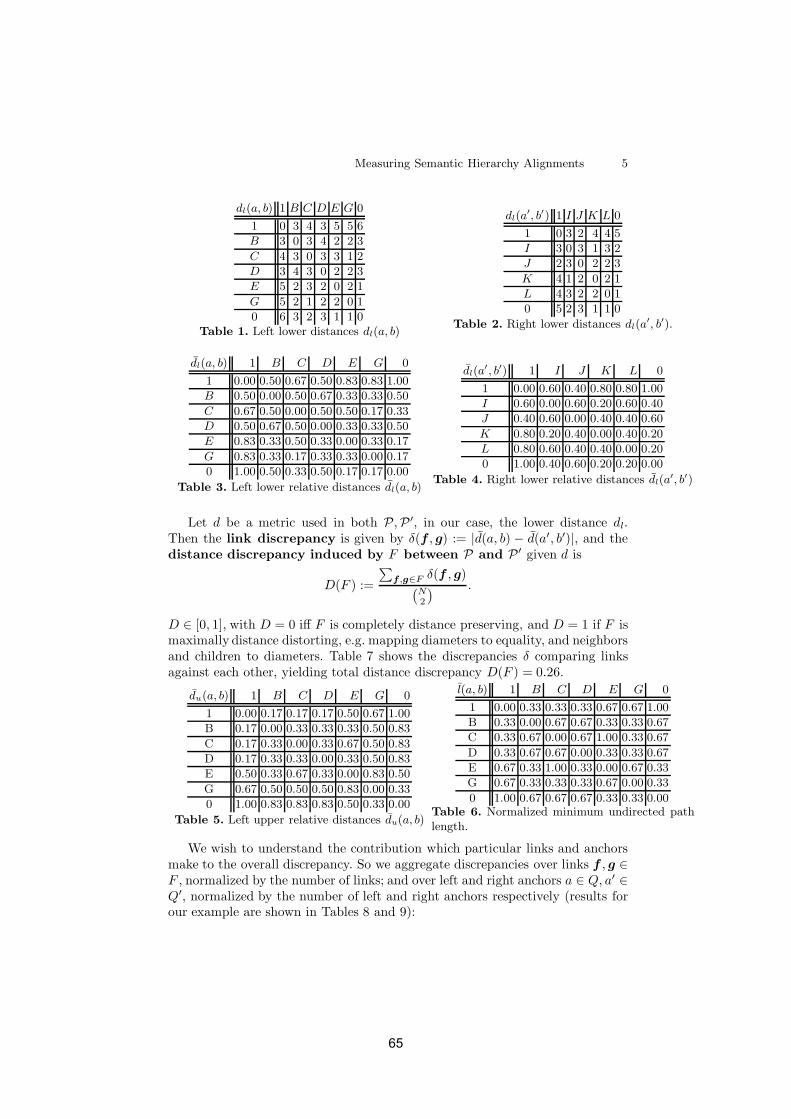
Measuring Semantic Hierarchy Alignments 5
dl(a, b) 1 B C D E G 0
1 0 3 4 3 5 5 6
B 3 0 3 4 2 2 3
C 4 3 0 3 3 1 2
D 3 4 3 0 2 2 3
E 5 2 3 2 0 2 1
G 5 2 1 2 2 0 1
0 6 3 2 3 1 1 0Table 1. Left lower distances dl(a, b)
dl(a′, b′) 1 I J K L 0
1 0 3 2 4 4 5
I 3 0 3 1 3 2
J 2 3 0 2 2 3
K 4 1 2 0 2 1
L 4 3 2 2 0 1
0 5 2 3 1 1 0
Table 2. Right lower distances dl(a′, b′).
dl(a, b) 1 B C D E G 0
1 0.00 0.50 0.67 0.50 0.83 0.83 1.00
B 0.50 0.00 0.50 0.67 0.33 0.33 0.50
C 0.67 0.50 0.00 0.50 0.50 0.17 0.33
D 0.50 0.67 0.50 0.00 0.33 0.33 0.50
E 0.83 0.33 0.50 0.33 0.00 0.33 0.17
G 0.83 0.33 0.17 0.33 0.33 0.00 0.17
0 1.00 0.50 0.33 0.50 0.17 0.17 0.00
Table 3. Left lower relative distances dl(a, b)
dl(a′, b′) 1 I J K L 0
1 0.00 0.60 0.40 0.80 0.80 1.00
I 0.60 0.00 0.60 0.20 0.60 0.40
J 0.40 0.60 0.00 0.40 0.40 0.60
K 0.80 0.20 0.40 0.00 0.40 0.20
L 0.80 0.60 0.40 0.40 0.00 0.20
0 1.00 0.40 0.60 0.20 0.20 0.00
Table 4. Right lower relative distances dl(a′, b′)
Let d be a metric used in both P,P′, in our case, the lower distance dl.Then the link discrepancy is given by δ(f , g) := |d(a, b) − d(a′, b′)|, and thedistance discrepancy induced by F between P and P ′ given d is
D(F ) :=
∑f ,g∈F δ(f , g)
(N2
) .
D ∈ [0, 1], with D = 0 iff F is completely distance preserving, and D = 1 if F ismaximally distance distorting, e.g. mapping diameters to equality, and neighborsand children to diameters. Table 7 shows the discrepancies δ comparing linksagainst each other, yielding total distance discrepancy D(F ) = 0.26.
du(a, b) 1 B C D E G 0
1 0.00 0.17 0.17 0.17 0.50 0.67 1.00
B 0.17 0.00 0.33 0.33 0.33 0.50 0.83
C 0.17 0.33 0.00 0.33 0.67 0.50 0.83
D 0.17 0.33 0.33 0.00 0.33 0.50 0.83
E 0.50 0.33 0.67 0.33 0.00 0.83 0.50
G 0.67 0.50 0.50 0.50 0.83 0.00 0.33
0 1.00 0.83 0.83 0.83 0.50 0.33 0.00
Table 5. Left upper relative distances du(a, b)
l(a, b) 1 B C D E G 0
1 0.00 0.33 0.33 0.33 0.67 0.67 1.00
B 0.33 0.00 0.67 0.67 0.33 0.33 0.67
C 0.33 0.67 0.00 0.67 1.00 0.33 0.67
D 0.33 0.67 0.67 0.00 0.33 0.33 0.67
E 0.67 0.33 1.00 0.33 0.00 0.67 0.33
G 0.67 0.33 0.33 0.33 0.67 0.00 0.33
0 1.00 0.67 0.67 0.67 0.33 0.33 0.00Table 6. Normalized minimum undirected pathlength.
We wish to understand the contribution which particular links and anchorsmake to the overall discrepancy. So we aggregate discrepancies over links f , g ∈F , normalized by the number of links; and over left and right anchors a ∈ Q, a′ ∈Q′, normalized by the number of left and right anchors respectively (results forour example are shown in Tables 8 and 9):
65
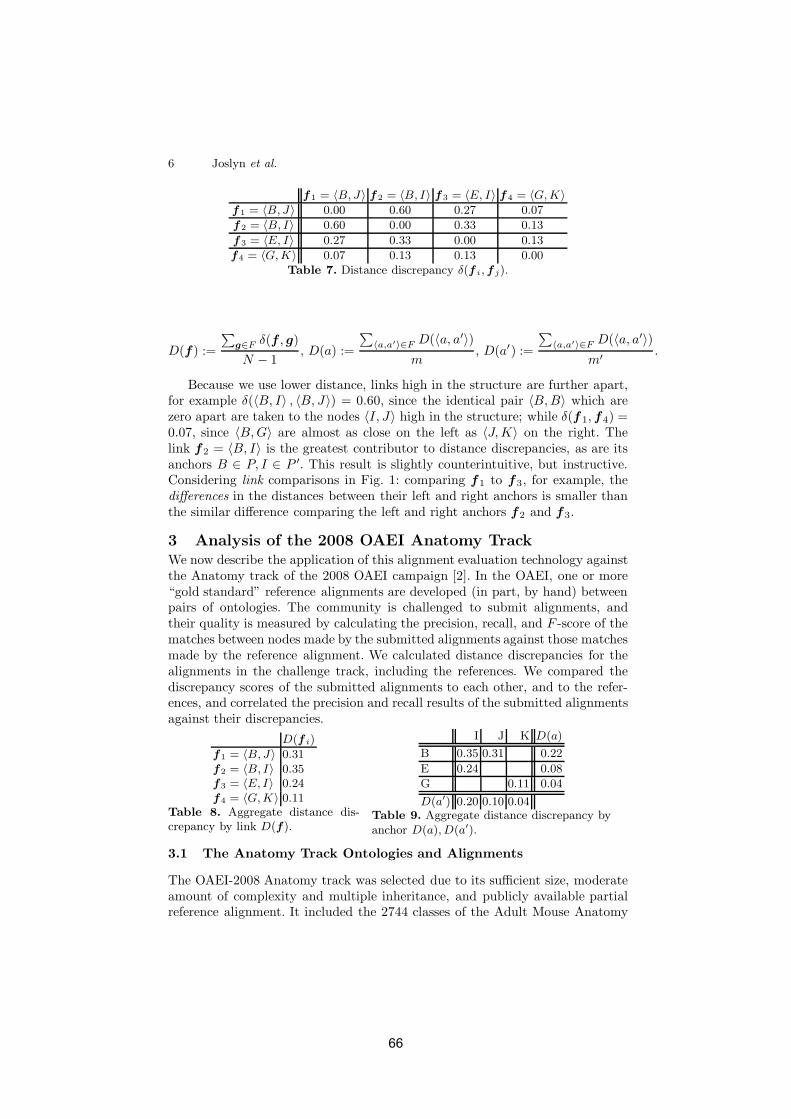
6 Joslyn et al.
f1 = 〈B,J〉 f2 = 〈B, I〉 f3 = 〈E, I〉 f4 = 〈G,K〉f1 = 〈B,J〉 0.00 0.60 0.27 0.07
f2 = 〈B, I〉 0.60 0.00 0.33 0.13
f3 = 〈E, I〉 0.27 0.33 0.00 0.13
f4 = 〈G,K〉 0.07 0.13 0.13 0.00Table 7. Distance discrepancy δ(f i,f j).
D(f) :=
∑g∈F δ(f , g)N − 1
, D(a) :=
∑〈a,a′〉∈F D(〈a, a′〉)
m, D(a′) :=
∑〈a,a′〉∈F D(〈a, a′〉)
m′ .
Because we use lower distance, links high in the structure are further apart,for example δ(〈B, I〉 , 〈B, J〉) = 0.60, since the identical pair 〈B, B〉 which arezero apart are taken to the nodes 〈I, J〉 high in the structure; while δ(f1, f4) =0.07, since 〈B, G〉 are almost as close on the left as 〈J, K〉 on the right. Thelink f2 = 〈B, I〉 is the greatest contributor to distance discrepancies, as are itsanchors B ∈ P, I ∈ P ′. This result is slightly counterintuitive, but instructive.Considering link comparisons in Fig. 1: comparing f1 to f3, for example, thedifferences in the distances between their left and right anchors is smaller thanthe similar difference comparing the left and right anchors f2 and f3.
3 Analysis of the 2008 OAEI Anatomy TrackWe now describe the application of this alignment evaluation technology againstthe Anatomy track of the 2008 OAEI campaign [2]. In the OAEI, one or more“gold standard” reference alignments are developed (in part, by hand) betweenpairs of ontologies. The community is challenged to submit alignments, andtheir quality is measured by calculating the precision, recall, and F -score of thematches between nodes made by the submitted alignments against those matchesmade by the reference alignment. We calculated distance discrepancies for thealignments in the challenge track, including the references. We compared thediscrepancy scores of the submitted alignments to each other, and to the refer-ences, and correlated the precision and recall results of the submitted alignmentsagainst their discrepancies.
D(f i)
f1 = 〈B,J〉 0.31f2 = 〈B, I〉 0.35f3 = 〈E, I〉 0.24f4 = 〈G,K〉 0.11
Table 8. Aggregate distance dis-crepancy by link D(f).
I J K D(a)
B 0.35 0.31 0.22
E 0.24 0.08
G 0.11 0.04
D(a′) 0.20 0.10 0.04Table 9. Aggregate distance discrepancy byanchor D(a),D(a′).
3.1 The Anatomy Track Ontologies and Alignments
The OAEI-2008 Anatomy track was selected due to its sufficient size, moderateamount of complexity and multiple inheritance, and publicly available partialreference alignment. It included the 2744 classes of the Adult Mouse Anatomy
66
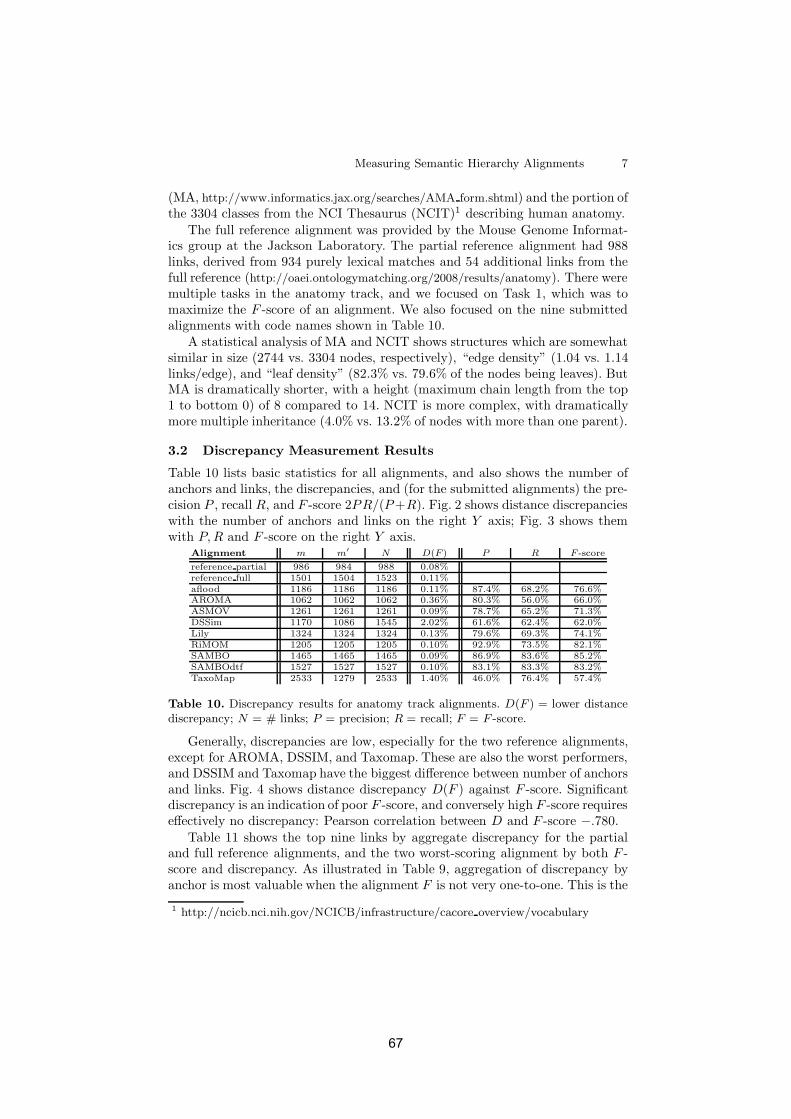
Measuring Semantic Hierarchy Alignments 7
(MA, http://www.informatics.jax.org/searches/AMA form.shtml) and the portion ofthe 3304 classes from the NCI Thesaurus (NCIT)1 describing human anatomy.
The full reference alignment was provided by the Mouse Genome Informat-ics group at the Jackson Laboratory. The partial reference alignment had 988links, derived from 934 purely lexical matches and 54 additional links from thefull reference (http://oaei.ontologymatching.org/2008/results/anatomy). There weremultiple tasks in the anatomy track, and we focused on Task 1, which was tomaximize the F -score of an alignment. We also focused on the nine submittedalignments with code names shown in Table 10.
A statistical analysis of MA and NCIT shows structures which are somewhatsimilar in size (2744 vs. 3304 nodes, respectively), “edge density” (1.04 vs. 1.14links/edge), and “leaf density” (82.3% vs. 79.6% of the nodes being leaves). ButMA is dramatically shorter, with a height (maximum chain length from the top1 to bottom 0) of 8 compared to 14. NCIT is more complex, with dramaticallymore multiple inheritance (4.0% vs. 13.2% of nodes with more than one parent).
3.2 Discrepancy Measurement Results
Table 10 lists basic statistics for all alignments, and also shows the number ofanchors and links, the discrepancies, and (for the submitted alignments) the pre-cision P , recall R, and F -score 2PR/(P +R). Fig. 2 shows distance discrepancieswith the number of anchors and links on the right Y axis; Fig. 3 shows themwith P, R and F -score on the right Y axis.
Alignment m m′ N D(F ) P R F -score
reference partial 986 984 988 0.08%reference full 1501 1504 1523 0.11%aflood 1186 1186 1186 0.11% 87.4% 68.2% 76.6%AROMA 1062 1062 1062 0.36% 80.3% 56.0% 66.0%ASMOV 1261 1261 1261 0.09% 78.7% 65.2% 71.3%DSSim 1170 1086 1545 2.02% 61.6% 62.4% 62.0%Lily 1324 1324 1324 0.13% 79.6% 69.3% 74.1%RiMOM 1205 1205 1205 0.10% 92.9% 73.5% 82.1%SAMBO 1465 1465 1465 0.09% 86.9% 83.6% 85.2%SAMBOdtf 1527 1527 1527 0.10% 83.1% 83.3% 83.2%TaxoMap 2533 1279 2533 1.40% 46.0% 76.4% 57.4%
Table 10. Discrepancy results for anatomy track alignments. D(F ) = lower distancediscrepancy; N = # links; P = precision; R = recall; F = F -score.
Generally, discrepancies are low, especially for the two reference alignments,except for AROMA, DSSIM, and Taxomap. These are also the worst performers,and DSSIM and Taxomap have the biggest difference between number of anchorsand links. Fig. 4 shows distance discrepancy D(F ) against F -score. Significantdiscrepancy is an indication of poor F -score, and conversely high F -score requireseffectively no discrepancy: Pearson correlation between D and F -score −.780.
Table 11 shows the top nine links by aggregate discrepancy for the partialand full reference alignments, and the two worst-scoring alignment by both F -score and discrepancy. As illustrated in Table 9, aggregation of discrepancy byanchor is most valuable when the alignment F is not very one-to-one. This is the
1 http://ncicb.nci.nih.gov/NCICB/infrastructure/cacore overview/vocabulary
67
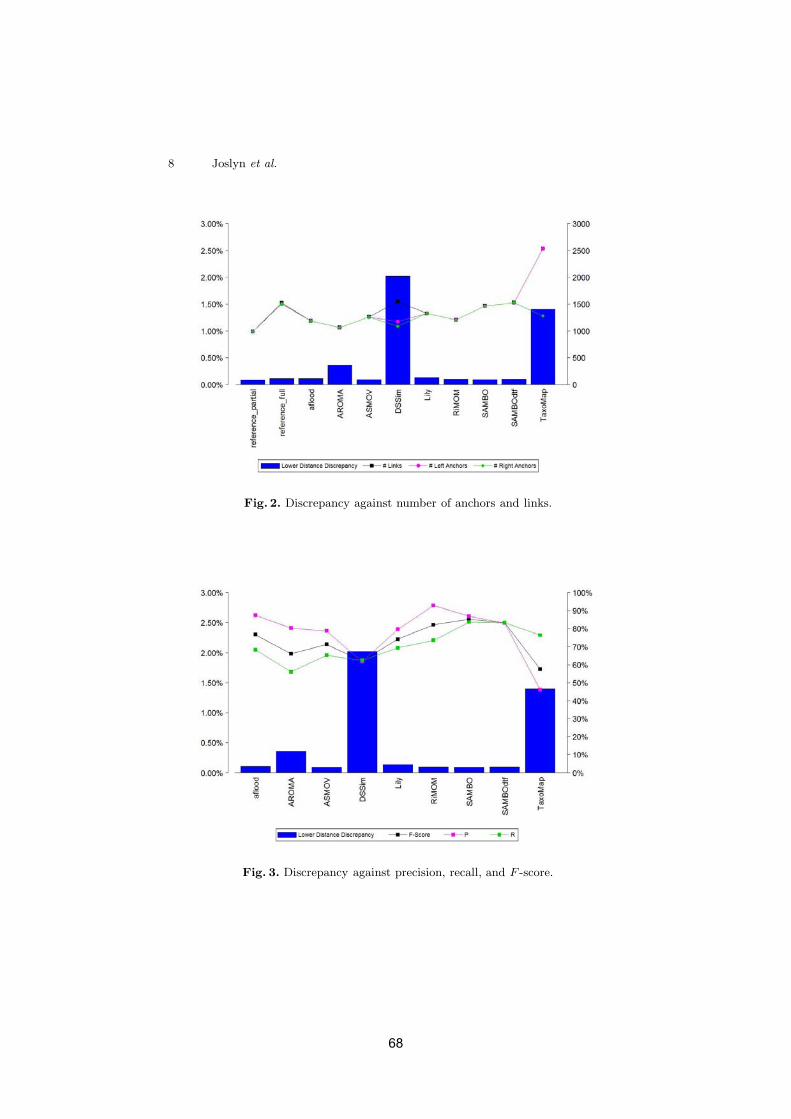
8 Joslyn et al.
Fig. 2. Discrepancy against number of anchors and links.
Fig. 3. Discrepancy against precision, recall, and F -score.
68
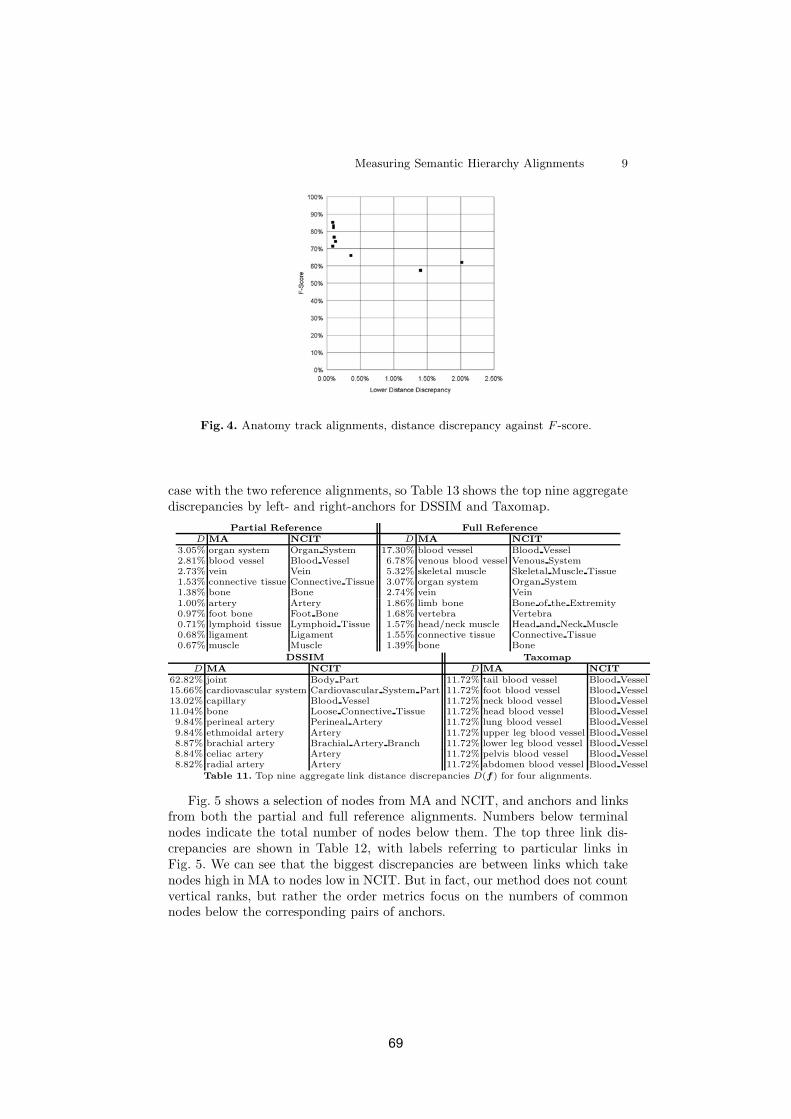
Measuring Semantic Hierarchy Alignments 9
Fig. 4. Anatomy track alignments, distance discrepancy against F -score.
case with the two reference alignments, so Table 13 shows the top nine aggregatediscrepancies by left- and right-anchors for DSSIM and Taxomap.
Partial Reference Full ReferenceD MA NCIT D MA NCIT
3.05% organ system Organ System 17.30% blood vessel Blood Vessel2.81% blood vessel Blood Vessel 6.78% venous blood vessel Venous System2.73% vein Vein 5.32% skeletal muscle Skeletal Muscle Tissue1.53% connective tissue Connective Tissue 3.07% organ system Organ System1.38% bone Bone 2.74% vein Vein1.00% artery Artery 1.86% limb bone Bone of the Extremity0.97% foot bone Foot Bone 1.68% vertebra Vertebra0.71% lymphoid tissue Lymphoid Tissue 1.57% head/neck muscle Head and Neck Muscle0.68% ligament Ligament 1.55% connective tissue Connective Tissue0.67% muscle Muscle 1.39% bone Bone
DSSIM TaxomapD MA NCIT D MA NCIT
62.82% joint Body Part 11.72% tail blood vessel Blood Vessel15.66% cardiovascular system Cardiovascular System Part 11.72% foot blood vessel Blood Vessel13.02% capillary Blood Vessel 11.72% neck blood vessel Blood Vessel11.04% bone Loose Connective Tissue 11.72% head blood vessel Blood Vessel9.84% perineal artery Perineal Artery 11.72% lung blood vessel Blood Vessel9.84% ethmoidal artery Artery 11.72% upper leg blood vessel Blood Vessel8.87% brachial artery Brachial Artery Branch 11.72% lower leg blood vessel Blood Vessel8.84% celiac artery Artery 11.72% pelvis blood vessel Blood Vessel8.82% radial artery Artery 11.72% abdomen blood vessel Blood Vessel
Table 11. Top nine aggregate link distance discrepancies D(f ) for four alignments.
Fig. 5 shows a selection of nodes from MA and NCIT, and anchors and linksfrom both the partial and full reference alignments. Numbers below terminalnodes indicate the total number of nodes below them. The top three link dis-crepancies are shown in Table 12, with labels referring to particular links inFig. 5. We can see that the biggest discrepancies are between links which takenodes high in MA to nodes low in NCIT. But in fact, our method does not countvertical ranks, but rather the order metrics focus on the numbers of commonnodes below the corresponding pairs of anchors.
69
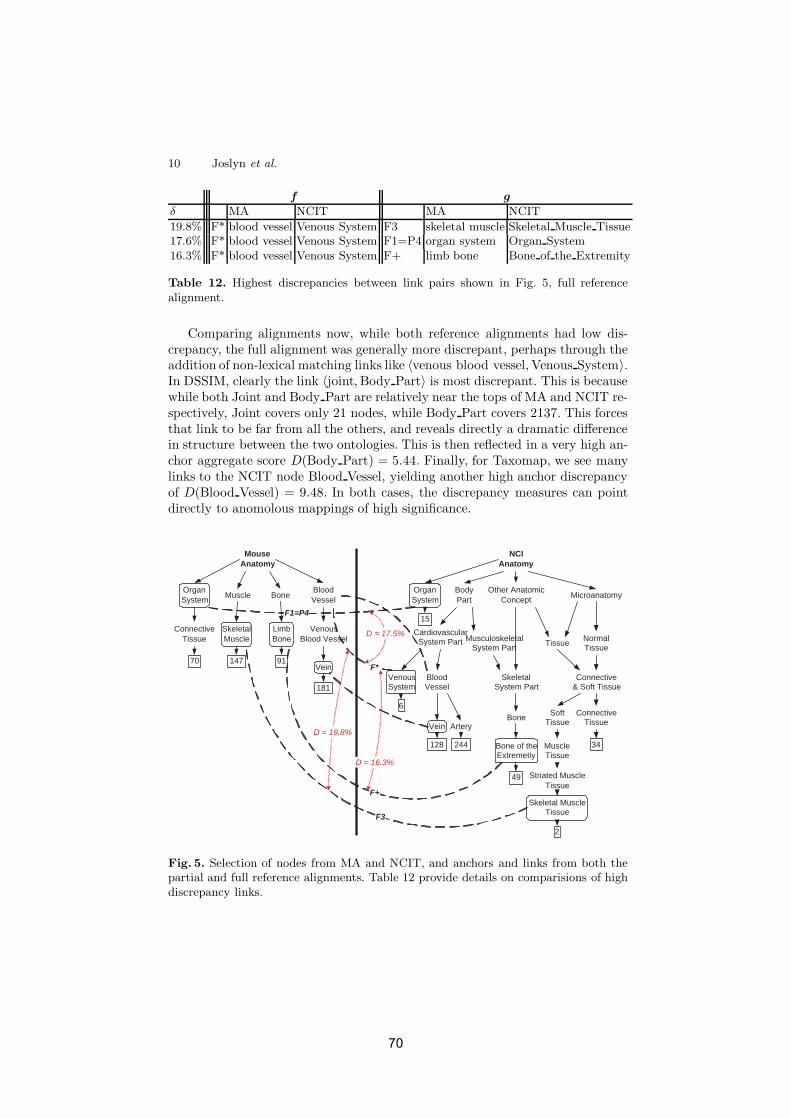
10 Joslyn et al.
f g
δ MA NCIT MA NCIT
19.8% F* blood vessel Venous System F3 skeletal muscle Skeletal Muscle Tissue17.6% F* blood vessel Venous System F1=P4 organ system Organ System16.3% F* blood vessel Venous System F+ limb bone Bone of the Extremity
Table 12. Highest discrepancies between link pairs shown in Fig. 5, full referencealignment.
Comparing alignments now, while both reference alignments had low dis-crepancy, the full alignment was generally more discrepant, perhaps through theaddition of non-lexical matching links like 〈venous blood vessel, Venous System〉.In DSSIM, clearly the link 〈joint, Body Part〉 is most discrepant. This is becausewhile both Joint and Body Part are relatively near the tops of MA and NCIT re-spectively, Joint covers only 21 nodes, while Body Part covers 2137. This forcesthat link to be far from all the others, and reveals directly a dramatic differencein structure between the two ontologies. This is then reflected in a very high an-chor aggregate score D(Body Part) = 5.44. Finally, for Taxomap, we see manylinks to the NCIT node Blood Vessel, yielding another high anchor discrepancyof D(Blood Vessel) = 9.48. In both cases, the discrepancy measures can pointdirectly to anomolous mappings of high significance.
MouseAnatomy
OrganSystem
Muscle
ConnectiveTissue
SkeletalMuscle
Bone
LimbBone
NCIAnatomy
MicroanatomyBodyPart
MusculoskeletalSystem Part
BloodVessel
Artery
70
OrganSystem
BloodVessel
VenousBlood Vessel
Vein
NormalTissue
Tissue
Connective& Soft Tissue
ConnectiveTissue
SoftTissue
MuscleTissue
Striated MuscleTissue
Skeletal MuscleTissue
Other AnatomicConcept
SkeletalSystem Part
Bone
Bone of theExtremetiy
CardiovascularSystem Part
Vein
VenousSystem
147 91
181
34
2
49
6
244128
15F1=P4
F*
F+
F3
D = 19.8%
D = 16.3%
D = 17.5%
Fig. 5. Selection of nodes from MA and NCIT, and anchors and links from both thepartial and full reference alignments. Table 12 provide details on comparisions of highdiscrepancy links.
70
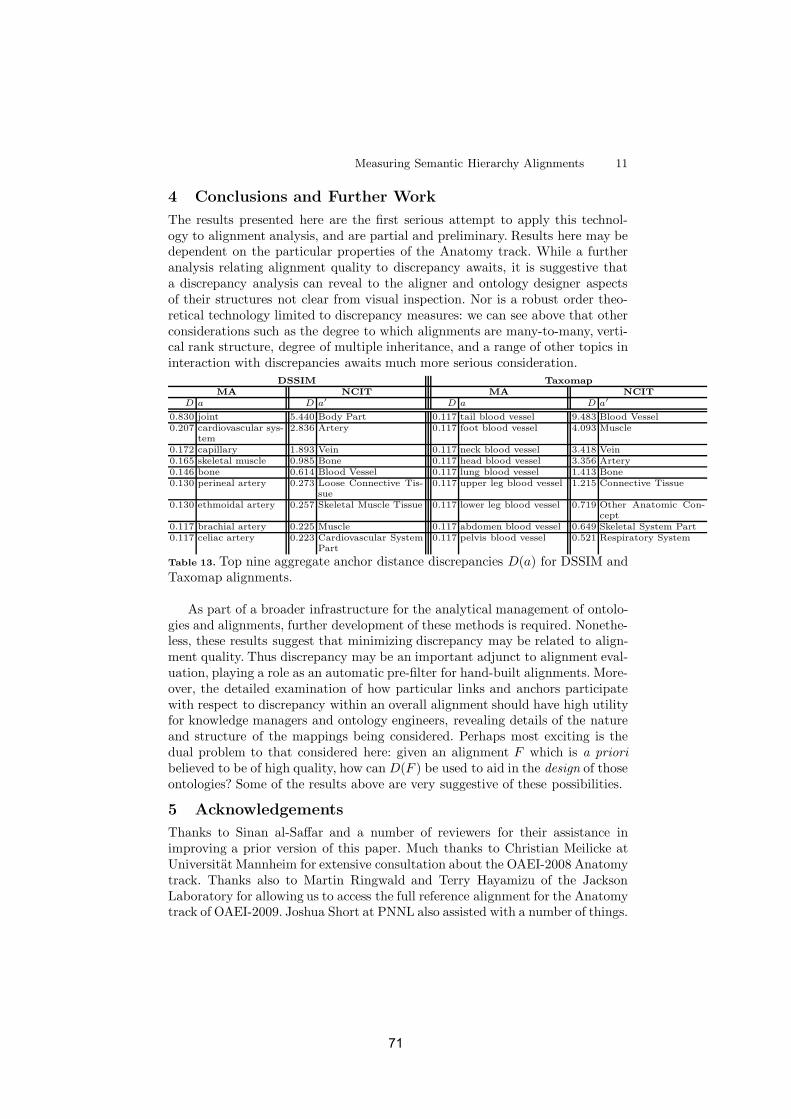
Measuring Semantic Hierarchy Alignments 11
4 Conclusions and Further Work
The results presented here are the first serious attempt to apply this technol-ogy to alignment analysis, and are partial and preliminary. Results here may bedependent on the particular properties of the Anatomy track. While a furtheranalysis relating alignment quality to discrepancy awaits, it is suggestive thata discrepancy analysis can reveal to the aligner and ontology designer aspectsof their structures not clear from visual inspection. Nor is a robust order theo-retical technology limited to discrepancy measures: we can see above that otherconsiderations such as the degree to which alignments are many-to-many, verti-cal rank structure, degree of multiple inheritance, and a range of other topics ininteraction with discrepancies awaits much more serious consideration.
DSSIM TaxomapMA NCIT MA NCIT
D a D a′ D a D a′
0.830 joint 5.440 Body Part 0.117 tail blood vessel 9.483 Blood Vessel0.207 cardiovascular sys-
tem2.836 Artery 0.117 foot blood vessel 4.093 Muscle
0.172 capillary 1.893 Vein 0.117 neck blood vessel 3.418 Vein0.165 skeletal muscle 0.985 Bone 0.117 head blood vessel 3.356 Artery0.146 bone 0.614 Blood Vessel 0.117 lung blood vessel 1.413 Bone0.130 perineal artery 0.273 Loose Connective Tis-
sue0.117 upper leg blood vessel 1.215 Connective Tissue
0.130 ethmoidal artery 0.257 Skeletal Muscle Tissue 0.117 lower leg blood vessel 0.719 Other Anatomic Con-cept
0.117 brachial artery 0.225 Muscle 0.117 abdomen blood vessel 0.649 Skeletal System Part0.117 celiac artery 0.223 Cardiovascular System
Part0.117 pelvis blood vessel 0.521 Respiratory System
Table 13. Top nine aggregate anchor distance discrepancies D(a) for DSSIM andTaxomap alignments.
As part of a broader infrastructure for the analytical management of ontolo-gies and alignments, further development of these methods is required. Nonethe-less, these results suggest that minimizing discrepancy may be related to align-ment quality. Thus discrepancy may be an important adjunct to alignment eval-uation, playing a role as an automatic pre-filter for hand-built alignments. More-over, the detailed examination of how particular links and anchors participatewith respect to discrepancy within an overall alignment should have high utilityfor knowledge managers and ontology engineers, revealing details of the natureand structure of the mappings being considered. Perhaps most exciting is thedual problem to that considered here: given an alignment F which is a prioribelieved to be of high quality, how can D(F ) be used to aid in the design of thoseontologies? Some of the results above are very suggestive of these possibilities.
5 Acknowledgements
Thanks to Sinan al-Saffar and a number of reviewers for their assistance inimproving a prior version of this paper. Much thanks to Christian Meilicke atUniversitat Mannheim for extensive consultation about the OAEI-2008 Anatomytrack. Thanks also to Martin Ringwald and Terry Hayamizu of the JacksonLaboratory for allowing us to access the full reference alignment for the Anatomytrack of OAEI-2009. Joshua Short at PNNL also assisted with a number of things.
71
12 Joslyn et al.
References1. Butanitsky, A and Hirst, G: (2006) “Evaluating WordNet-based Measures of Lex-
ical Semantic Relatedness”, Computational Linguistics, v. 32:1, pp. 13-472. Caracciolo, Caterina; Stuckenschmidt, Heiner; Svab, Ondrej; et al.: (2008) “First
Results of the Ontology Alignment Evaluation Initiative 2008”, in: Proc. 3rd Int.Wshop. On Ontology Matching (OM2008),
3. Davey, BA and Priestly, HA: (1990) Introduction to Lattices and Order, CambridgeUP, Cambridge UK, 2nd Edition
4. Euzenat, J and Shvaiko, P: (2007) Ontology Matching, Springer-Verlag, Hiedelberg5. Falconer, Sean M and Maslov, Dmitri: (2006) “Hierarchical Alignment of Weighted
Directed Acyclic Graphs”, arVix:cs.DS/0606124v16. Fellbaum, Christiane, ed.: (1998) Wordnet: An Electronic Lexical Database, MIT
Press, Cambridge, MA7. Feng, Y; Goldstone, RL; and Menkov, V: (2004) “ABSURDIST II: A Graph Match-
ing Algorithm and its Application to Conceptual System Translation”, in: Proc.7th Int. Florida AI Research Society Conference (FLAIRS 04), v. 2, pp. 640-645
8. He, Hu and Xiaoyong, Du: (2007) “Ontology Hierarchies Matching by LatticesAlignment”, in: Proc. Ontology Matching 2007 (OM-2007), ISWC 2007
9. Joslyn, Cliff: (2009) “Hierarchy Analysis of Knowledge Networks”, in: IJCAI Int.Wshop. on Graph Structures for Knowledge Representation and Reasoning, in press
10. Joslyn, Cliff; Baddeley, Bob; Blake, Judith; et al.: (2009) “Automated Annotation-Based Bio-Ontology Alignment with Structural Validation”, in: Proc. Int. Conf.on Biomedical Ontology (ICBO 09)
11. Joslyn, Cliff; Donaldson, Alex; and Paulson, Patrick: (2008)“Evaluating the Structural Quality of Semantic Hierarchy Align-ments”, poster at the Int. Semantic Web Conf. (ISWC 08),http://dblp.uni-trier.de/db/conf/semweb/iswc2008p.html#JoslynDP08
12. Y Kalfoglou, M Schorlemmer: (2002) “IF-Map: An Ontology-Mapping Methodbased on Information-Flow Theory”, Proc. 1st Int. Conf. Ontologies, Databasesand Application of Semantics (ODBASE’02), Irvine, CA, USA
13. Lord, PW; Stevens, Robert; Brass, A; CA Goble: (2003) “Investigating SemanticSimilarity Measures Across the Gene Ontology: the Relationship Between Sequenceand Annotation”, Bioinformatics, v. 10, pp. 1275-1283
14. Maedche, Alexander and Staab, Steffen: (2002) “Measuring Similarity BetweenOntologies”, in: Proc. 13th Int. Conf. Knowledge Engineering and Knowledge Man-agement. Ontologies and the Semantic Web, LNCS, v. 2473, pp. 251-263
15. Meilicke, Christian and Stuckenschmidt, Heiner: (2008) “Incoherence as a Basisfor Measuring the Quality of Ontology Mappings”, in: Proc. 3rd Int. Wshop OnOntology Matching (OM2008), ed. Pavel Shvaiko et al., Karlsruhe
16. Monjardet, B: (1981) “Metrics on Partially Ordered Sets - A Survey”, DiscreteMathematics, v. 35, pp. 173-184
17. Noy, N and Musen, MA: (2003) “The PROMPT Suite: Interactive Tools for Ontol-ogy Merging and Mapping”, Int. J. Human-Computer Studies, v. 59, pp. 983-1024
18. Orum, C and Joslyn, CA: (2009) “Valuations and Metrics on Partially OrderedSets”, http://arxiv.org/abs/0903.2679v1, submitted
19. Sanfilippo, A; Posse, C; Gopalan, B; et al.: (2007) “Combining Hierarchical andAssociative Gene Ontology Relations With Textual Evidence in Estimating Geneand Gene Product Similarity”, IEEE Trans. on Nanobioscience, v. 6:1, pp. 51-59
20. Schroder, Bernd SW: (2003) Ordered Sets, Birkhauser, Boston
72
Results of theOntology Alignment Evaluation Initiative 2009?
Jérôme Euzenat1, Alfio Ferrara7, Laura Hollink2, Antoine Isaac2, Cliff Joslyn10,Véronique Malaisé2, Christian Meilicke3, Andriy Nikolov8, Juan Pane4, Marta
Sabou8, François Scharffe1, Pavel Shvaiko5, Vassilis Spiliopoulos9, HeinerStuckenschmidt3, Ondrej Šváb-Zamazal6, Vojtech Svátek6, Cássia Trojahn1, George
Vouros9, and Shenghui Wang2
1 INRIA & LIG, Montbonnot, France{Jerome.Euzenat,Francois.Scharffe,Cassia.Trojahn}@inrialpes.fr
2 Vrije Universiteit Amsterdam, The Netherlands{laurah,vmalaise,aisaac,swang}@few.vu.nl
3 University of Mannheim, Mannheim, Germany{christian,heiner}@informatik.uni-mannheim.de
4 University of Trento, Povo, Trento, [email protected]
5 TasLab, Informatica Trentina, Trento, [email protected]
6 University of Economics, Prague, Czech Republic{svabo,svatek}@vse.cz
7 Universita degli studi di Milano, [email protected]
8 The Open university, UK{r.sabou,a.nikolov}@open.ac.uk
9 University of the Aegean, Greece{vspiliop,georgev}@aegean.gr
10 Pacific Northwest National Laboratory, [email protected]
Abstract. Ontology matching consists of finding correspondences between on-tology entities. OAEI campaigns aim at comparing ontology matching systemson precisely defined test cases. Test cases can use ontologies of different nature(from expressive OWL ontologies to simple directories) and use different modal-ities, e.g., blind evaluation, open evaluation, consensus. OAEI-2009 builds overprevious campaigns by having 5 tracks with 11 test cases followed by 16 partici-pants. This paper is an overall presentation of the OAEI 2009 campaign.
1 Introduction
The Ontology Alignment Evaluation Initiative1 (OAEI) is a coordinated internationalinitiative that organizes the evaluation of the increasing number of ontology matching? This paper improves on the “Preliminary results” initially published in the on-site proceedings
of the ISWC workshop on Ontology Matching (OM-2009). The only official results of thecampaign, however, are on the OAEI web site.
1 http://oaei.ontologymatching.org
73
systems [10]. The main goal of OAEI is to compare systems and algorithms on the samebasis and to allow anyone for drawing conclusions about the best matching strategies.Our ambition is that from such evaluations, tool developers can learn and improve theirsystems. The OAEI campaign provides the evaluation of matching systems on consen-sus test cases.
Two first events were organized in 2004: (i) the Information Interpretation and In-tegration Conference (I3CON) held at the NIST Performance Metrics for IntelligentSystems (PerMIS) workshop and (ii) the Ontology Alignment Contest held at the Eval-uation of Ontology-based Tools (EON) workshop of the annual International SemanticWeb Conference (ISWC) [23]. Then, unique OAEI campaigns occurred in 2005 at theworkshop on Integrating Ontologies held in conjunction with the International Con-ference on Knowledge Capture (K-Cap) [2], in 2006 at the first Ontology Matchingworkshop collocated with ISWC [9], in 2007 at the second Ontology Matching work-shop collocated with ISWC+ASWC [11], and in 2008, OAEI results were presentedat the third Ontology Matching workshop collocated with ISWC [4]. Finally, in 2009,OAEI results were presented at the fourth Ontology Matching workshop collocated withISWC, in Chantilly, Virginia USA2.
We have continued previous years’ trend by having a large variety of test cases thatemphasize different aspects of ontology matching. This year we introduced two newtracks that have been identified in the previous years:
oriented alignments in which the reference alignments are not restricted to equiva-lence but also comprise subsumption relations;
instance matching dedicated to the delivery of alignment between instances as neces-sary for producing linked data.
This paper serves as an introduction to the evaluation campaign of 2009 and to theresults provided in the following papers. The remainder of the paper is organized asfollows. In Section 2 we present the overall testing methodology that has been used.Sections 3-10 discuss in turn the settings and the results of each of the test cases. Sec-tion 11 evaluates, across all tracks, the participant results with respect to their capacityto preserve the structure of ontologies. Section 12 overviews lessons learned from thecampaign. Finally, Section 13 outlines future plans and Section 14 concludes the paper.
2 General methodology
We first present the test cases proposed this year to OAEI participants. Then, we de-scribe the three steps of the OAEI campaign and report on the general execution of thecampaign. In particular, we list participants and the tests they considered.
2.1 Tracks and test cases
This year’s campaign has consisted of 5 tracks gathering 11 data sets and differentevaluation modalities.
2 http://om2009.ontologymatching.org
74
The benchmark track (§3): Like in previous campaigns, a systematic benchmark se-ries has been produced. The goal of this benchmark series is to identify the areas inwhich each matching algorithm is strong and weak. The test is based on one partic-ular ontology dedicated to the very narrow domain of bibliography and a numberof alternative ontologies of the same domain for which alignments are provided.
The expressive ontologies track offers ontologies using OWL modeling capabilities:Anatomy (§4): The anatomy real world case is about matching the Adult Mouse
Anatomy (2744 classes) and the NCI Thesaurus (3304 classes) describing thehuman anatomy.
Conference (§5): Participants are asked to find all correct correspondences (equiv-alence and/or subsumption) and/or ‘interesting correspondences’ within a col-lection of ontologies describing the domain of organizing conferences (the do-main being well understandable for every researcher). Results are evaluateda posteriori in part manually and in part by data-mining techniques and logi-cal reasoning techniques. They are also evaluated against reference alignmentsbased on a subset of the whole collection.
The directories and thesauri track proposes web directories, thesauri and generallyless expressive resources:Fishery gears: This test case features four different classification schemes, ex-
pressed in OWL, adopted by different fishery information systems in FIM di-vision of FAO. An alignment performed on this 4 schemes should be able tospot out equivalence, or a degree of similarity between the fishing gear typesand the groups of gears, so as to enable a future exercise of data aggregationacross systems.
Directory (§6): The directory real world case consists of matching web sites direc-tories (like open directory or Yahoo’s). It is more than 4 thousand elementarytests.
Library (§7): Three large SKOS subject heading lists for libraries have to bematched using relations from the SKOS vocabulary. Results are evaluated onthe basis of (i) a partial reference alignment (ii) using the alignments to re-index books from one vocabulary to the other.
Oriented alignments (benchmark-subs §8) :This track focuses on the evaluation of alignments that contain other relations thanequivalences.
Instance matching (§9): The instance data matching track aims at evaluating toolsable to identify similar instances among different datasets. It features Web datasets,as well as a generated benchmark:Eprints-Rexa-Sweto/DBLP benchmark (ARS) three datasets containing in-
stances from the domain of scientific publications;TAP-Sweto-Tesped-DBpedia three datasets covering several topics and struc-
tured according to different ontologies;IIMB A benchmark generated using one dataset and modifying it according to
various criteria.Very large crosslingual resources (§10): The purpose of this task (vlcr) is to
match the Thesaurus of the Netherlands Institute for Sound and Vision (calledGTAA) to two other resources: the English WordNet from Princeton Universityand DBpedia.
75
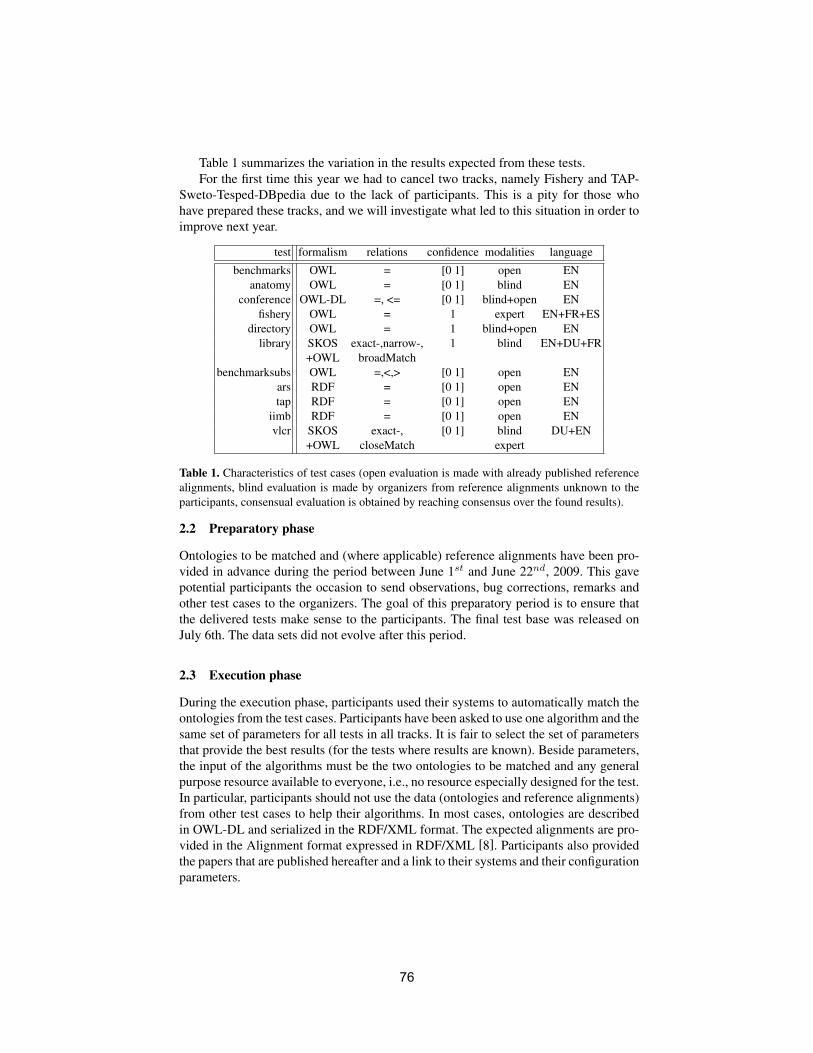
Table 1 summarizes the variation in the results expected from these tests.For the first time this year we had to cancel two tracks, namely Fishery and TAP-
Sweto-Tesped-DBpedia due to the lack of participants. This is a pity for those whohave prepared these tracks, and we will investigate what led to this situation in order toimprove next year.
test formalism relations confidence modalities language
benchmarks OWL = [0 1] open ENanatomy OWL = [0 1] blind EN
conference OWL-DL =, <= [0 1] blind+open ENfishery OWL = 1 expert EN+FR+ES
directory OWL = 1 blind+open ENlibrary SKOS exact-,narrow-, 1 blind EN+DU+FR
+OWL broadMatchbenchmarksubs OWL =,<,> [0 1] open EN
ars RDF = [0 1] open ENtap RDF = [0 1] open EN
iimb RDF = [0 1] open ENvlcr SKOS exact-, [0 1] blind DU+EN
+OWL closeMatch expert
Table 1. Characteristics of test cases (open evaluation is made with already published referencealignments, blind evaluation is made by organizers from reference alignments unknown to theparticipants, consensual evaluation is obtained by reaching consensus over the found results).
2.2 Preparatory phase
Ontologies to be matched and (where applicable) reference alignments have been pro-vided in advance during the period between June 1st and June 22nd, 2009. This gavepotential participants the occasion to send observations, bug corrections, remarks andother test cases to the organizers. The goal of this preparatory period is to ensure thatthe delivered tests make sense to the participants. The final test base was released onJuly 6th. The data sets did not evolve after this period.
2.3 Execution phase
During the execution phase, participants used their systems to automatically match theontologies from the test cases. Participants have been asked to use one algorithm and thesame set of parameters for all tests in all tracks. It is fair to select the set of parametersthat provide the best results (for the tests where results are known). Beside parameters,the input of the algorithms must be the two ontologies to be matched and any generalpurpose resource available to everyone, i.e., no resource especially designed for the test.In particular, participants should not use the data (ontologies and reference alignments)from other test cases to help their algorithms. In most cases, ontologies are describedin OWL-DL and serialized in the RDF/XML format. The expected alignments are pro-vided in the Alignment format expressed in RDF/XML [8]. Participants also providedthe papers that are published hereafter and a link to their systems and their configurationparameters.
76
2.4 Evaluation phase
The organizers have evaluated the alignments provided by the participants and returnedcomparisons on these results.
In order to ensure that it is possible to process automatically the provided results, theparticipants have been requested to provide (preliminary) results by September 1st. Inthe case of blind tests only the organizers did the evaluation with regard to the withheldreference alignments.
The standard evaluation measures are precision and recall computed against thereference alignments. For the matter of aggregation of the measures we use weightedharmonic means (weights being the size of the true positives). This clearly helps in thecase of empty alignments. Another technique that has been used is the computation ofprecision/recall graphs so it was advised that participants provide their results with aweight to each correspondence they found. New measures addressing some limitationsof precision and recall have also been used for testing purposes as well as measurescompensating for the lack of complete reference alignments.
2.5 Comments on the execution
After a decreased number of participants last year, this year the number increased again:4 participants in 2004, 7 in 2005, 10 in 2006, 17 in 2007, 13 in 2008, and 16 in 2009.
The number of covered runs has slightly increased: 53 in 2009, 50 in 2008, and 48in 2007. This may be due to the increasing specialization of tests: some systems arespecifically designed for instance matching or for anatomy.
We have had not enough time to systematically validate the results which had beenprovided by the participants, but we run a few systems and we scrutinized some of theresults.
The list of participants is summarized in Table 2. Similar to previous years notall participants provided results for all tests. They usually did those which are easierto run, such as benchmark, anatomy, directory, and conference. The variety of testsand the short time given to provide results have certainly prevented participants fromconsidering more tests.
The sets of participants is divided in two main categories: those who participatedin the instance matching track and those who participated in ontology matching tracks.Only a few systems (DSSim and RiMOM) participated in both types of tracks.
The summary of the results track by track is provided in the following sections.
3 Benchmark
The goal of the benchmark tests is to provide a stable and detailed picture of eachalgorithm. For that purpose, the algorithms are run on systematically generated testcases.
77
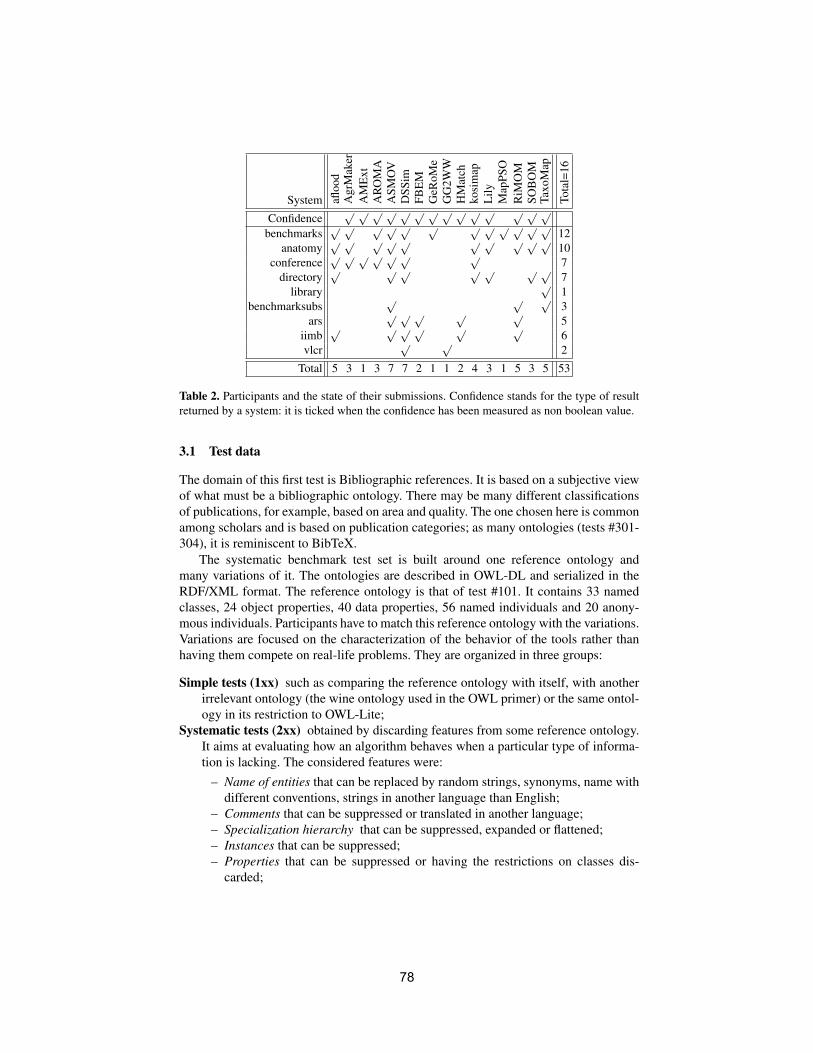
System afloo
dA
grM
aker
AM
Ext
AR
OM
AA
SMO
VD
SSim
FBE
MG
eRoM
eG
G2W
WH
Mat
chko
sim
apL
ilyM
apPS
OR
iMO
MSO
BO
MTa
xoM
ap
Tota
l=16
Confidence√ √ √ √ √ √ √ √ √ √ √ √ √ √
benchmarks√ √ √ √ √ √ √ √ √ √ √ √
12anatomy
√ √ √ √ √ √ √ √ √ √10
conference√ √ √ √ √ √ √
7directory
√ √ √ √ √ √ √7
library√
1benchmarksubs
√ √ √3
ars√ √ √ √ √
5iimb
√ √ √ √ √ √6
vlcr√ √
2
Total 5 3 1 3 7 7 2 1 1 2 4 3 1 5 3 5 53
Table 2. Participants and the state of their submissions. Confidence stands for the type of resultreturned by a system: it is ticked when the confidence has been measured as non boolean value.
3.1 Test data
The domain of this first test is Bibliographic references. It is based on a subjective viewof what must be a bibliographic ontology. There may be many different classificationsof publications, for example, based on area and quality. The one chosen here is commonamong scholars and is based on publication categories; as many ontologies (tests #301-304), it is reminiscent to BibTeX.
The systematic benchmark test set is built around one reference ontology andmany variations of it. The ontologies are described in OWL-DL and serialized in theRDF/XML format. The reference ontology is that of test #101. It contains 33 namedclasses, 24 object properties, 40 data properties, 56 named individuals and 20 anony-mous individuals. Participants have to match this reference ontology with the variations.Variations are focused on the characterization of the behavior of the tools rather thanhaving them compete on real-life problems. They are organized in three groups:
Simple tests (1xx) such as comparing the reference ontology with itself, with anotherirrelevant ontology (the wine ontology used in the OWL primer) or the same ontol-ogy in its restriction to OWL-Lite;
Systematic tests (2xx) obtained by discarding features from some reference ontology.It aims at evaluating how an algorithm behaves when a particular type of informa-tion is lacking. The considered features were:
– Name of entities that can be replaced by random strings, synonyms, name withdifferent conventions, strings in another language than English;
– Comments that can be suppressed or translated in another language;– Specialization hierarchy that can be suppressed, expanded or flattened;– Instances that can be suppressed;– Properties that can be suppressed or having the restrictions on classes dis-
carded;
78
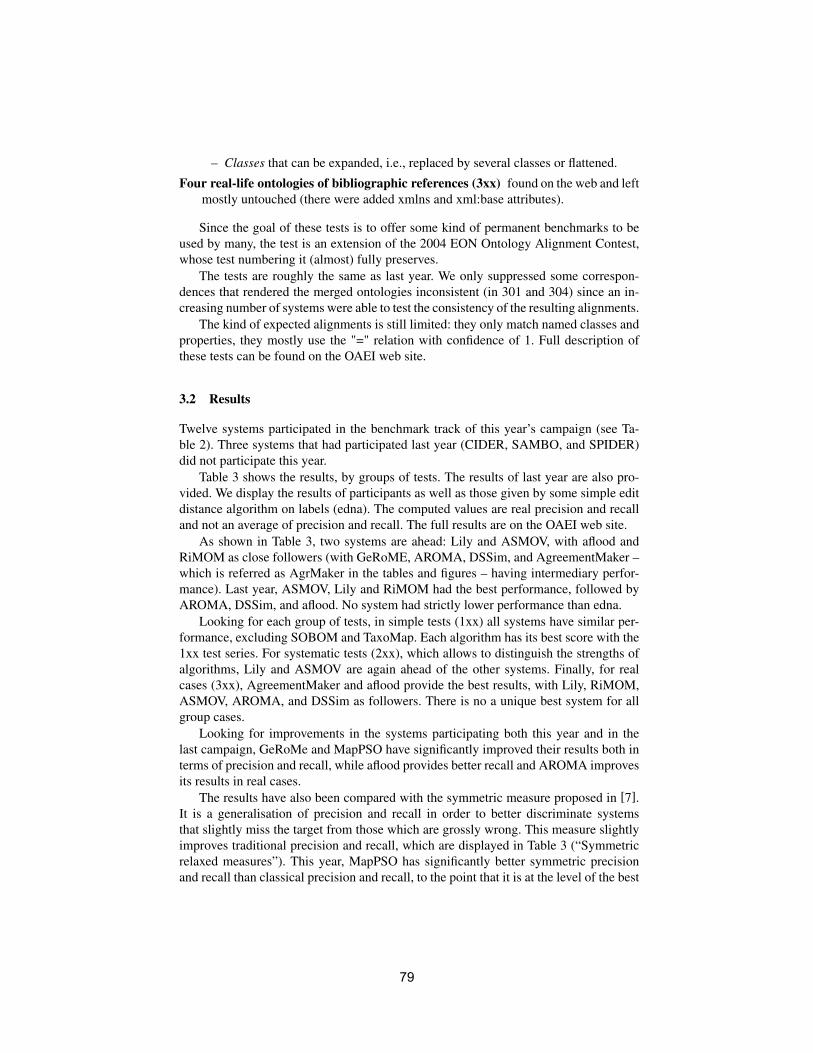
– Classes that can be expanded, i.e., replaced by several classes or flattened.
Four real-life ontologies of bibliographic references (3xx) found on the web and leftmostly untouched (there were added xmlns and xml:base attributes).
Since the goal of these tests is to offer some kind of permanent benchmarks to beused by many, the test is an extension of the 2004 EON Ontology Alignment Contest,whose test numbering it (almost) fully preserves.
The tests are roughly the same as last year. We only suppressed some correspon-dences that rendered the merged ontologies inconsistent (in 301 and 304) since an in-creasing number of systems were able to test the consistency of the resulting alignments.
The kind of expected alignments is still limited: they only match named classes andproperties, they mostly use the "=" relation with confidence of 1. Full description ofthese tests can be found on the OAEI web site.
3.2 Results
Twelve systems participated in the benchmark track of this year’s campaign (see Ta-ble 2). Three systems that had participated last year (CIDER, SAMBO, and SPIDER)did not participate this year.
Table 3 shows the results, by groups of tests. The results of last year are also pro-vided. We display the results of participants as well as those given by some simple editdistance algorithm on labels (edna). The computed values are real precision and recalland not an average of precision and recall. The full results are on the OAEI web site.
As shown in Table 3, two systems are ahead: Lily and ASMOV, with aflood andRiMOM as close followers (with GeRoME, AROMA, DSSim, and AgreementMaker –which is referred as AgrMaker in the tables and figures – having intermediary perfor-mance). Last year, ASMOV, Lily and RiMOM had the best performance, followed byAROMA, DSSim, and aflood. No system had strictly lower performance than edna.
Looking for each group of tests, in simple tests (1xx) all systems have similar per-formance, excluding SOBOM and TaxoMap. Each algorithm has its best score with the1xx test series. For systematic tests (2xx), which allows to distinguish the strengths ofalgorithms, Lily and ASMOV are again ahead of the other systems. Finally, for realcases (3xx), AgreementMaker and aflood provide the best results, with Lily, RiMOM,ASMOV, AROMA, and DSSim as followers. There is no a unique best system for allgroup cases.
Looking for improvements in the systems participating both this year and in thelast campaign, GeRoMe and MapPSO have significantly improved their results both interms of precision and recall, while aflood provides better recall and AROMA improvesits results in real cases.
The results have also been compared with the symmetric measure proposed in [7].It is a generalisation of precision and recall in order to better discriminate systemsthat slightly miss the target from those which are grossly wrong. This measure slightlyimproves traditional precision and recall, which are displayed in Table 3 (“Symmetricrelaxed measures”). This year, MapPSO has significantly better symmetric precisionand recall than classical precision and recall, to the point that it is at the level of the best
79
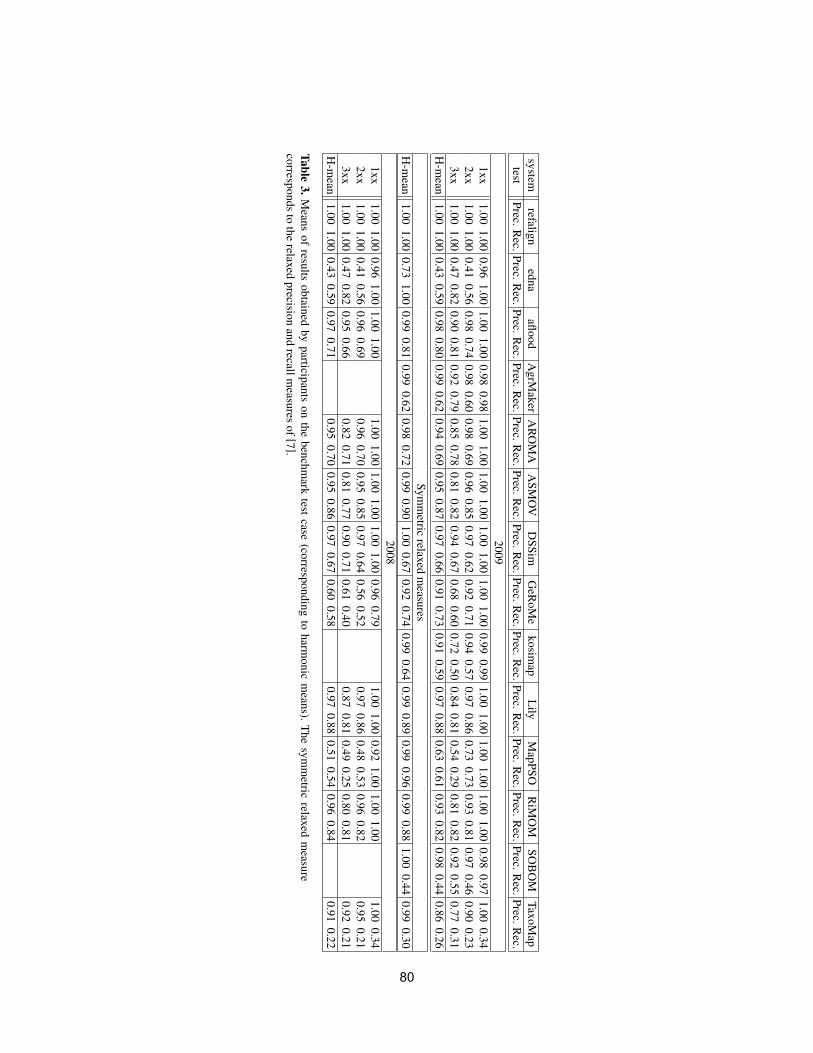
systemrefalign
ednaaflood
AgrM
akerA
RO
MA
ASM
OV
DSSim
GeR
oMe
kosimap
Lily
MapPSO
RiM
OM
SOB
OM
TaxoMap
testPrec.R
ec.Prec.R
ec.Prec.R
ec.Prec.R
ec.Prec.R
ec.Prec.R
ec.Prec.R
ec.Prec.R
ec.Prec.R
ec.Prec.R
ec.Prec.R
ec.Prec.R
ec.Prec.R
ec.Prec.R
ec.
20091xx
1.001.00
0.961.00
1.001.00
0.980.98
1.001.00
1.001.00
1.001.00
1.001.00
0.990.99
1.001.00
1.001.00
1.001.00
0.980.97
1.000.34
2xx1.00
1.000.41
0.560.98
0.740.98
0.600.98
0.690.96
0.850.97
0.620.92
0.710.94
0.570.97
0.860.73
0.730.93
0.810.97
0.460.90
0.233xx
1.001.00
0.470.82
0.900.81
0.920.79
0.850.78
0.810.82
0.940.67
0.680.60
0.720.50
0.840.81
0.540.29
0.810.82
0.920.55
0.770.31
H-m
ean1.00
1.000.43
0.590.98
0.800.99
0.620.94
0.690.95
0.870.97
0.660.91
0.730.91
0.590.97
0.880.63
0.610.93
0.820.98
0.440.86
0.26
Symm
etricrelaxed
measures
H-m
ean1.00
1.000.73
1.000.99
0.810.99
0.620.98
0.720.99
0.901.00
0.670.92
0.740.99
0.640.99
0.890.99
0.960.99
0.881.00
0.440.99
0.302008
1xx1.00
1.000.96
1.001.00
1.001.00
1.001.00
1.001.00
1.000.96
0.791.00
1.000.92
1.001.00
1.001.00
0.342xx
1.001.00
0.410.56
0.960.69
0.960.70
0.950.85
0.970.64
0.560.52
0.970.86
0.480.53
0.960.82
0.950.21
3xx1.00
1.000.47
0.820.95
0.660.82
0.710.81
0.770.90
0.710.61
0.400.87
0.810.49
0.250.80
0.810.92
0.21H
-mean
1.001.00
0.430.59
0.970.71
0.950.70
0.950.86
0.970.67
0.600.58
0.970.88
0.510.54
0.960.84
0.910.22
Table3.
Means
ofresults
obtainedby
participantson
thebenchm
arktest
case(corresponding
toharm
onicm
eans).T
hesym
metric
relaxedm
easurecorresponds
tothe
relaxedprecision
andrecallm
easuresof [7 ].
80
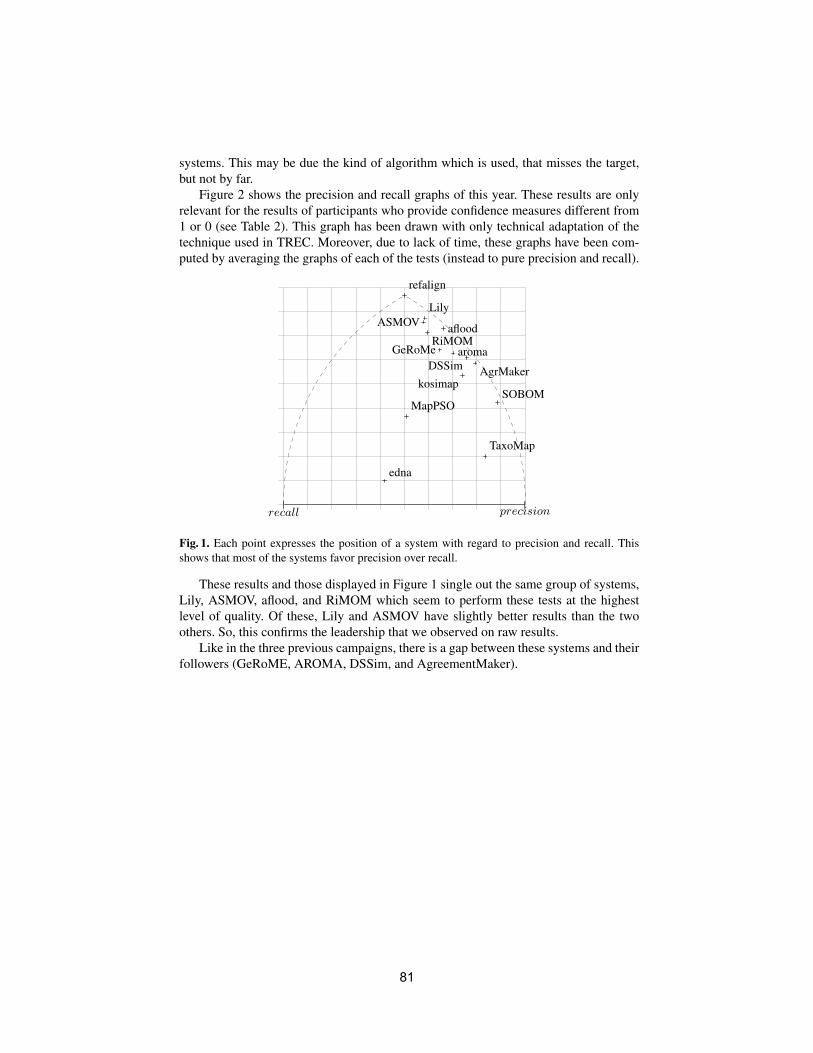
systems. This may be due the kind of algorithm which is used, that misses the target,but not by far.
Figure 2 shows the precision and recall graphs of this year. These results are onlyrelevant for the results of participants who provide confidence measures different from1 or 0 (see Table 2). This graph has been drawn with only technical adaptation of thetechnique used in TREC. Moreover, due to lack of time, these graphs have been com-puted by averaging the graphs of each of the tests (instead to pure precision and recall).
recall precision
refalign
edna
aflood
AgrMaker
aroma
ASMOV
DSSimGeRoMe
kosimap
Lily
MapPSO
RiMOM
SOBOM
TaxoMap
Fig. 1. Each point expresses the position of a system with regard to precision and recall. Thisshows that most of the systems favor precision over recall.
These results and those displayed in Figure 1 single out the same group of systems,Lily, ASMOV, aflood, and RiMOM which seem to perform these tests at the highestlevel of quality. Of these, Lily and ASMOV have slightly better results than the twoothers. So, this confirms the leadership that we observed on raw results.
Like in the three previous campaigns, there is a gap between these systems and theirfollowers (GeRoME, AROMA, DSSim, and AgreementMaker).
81
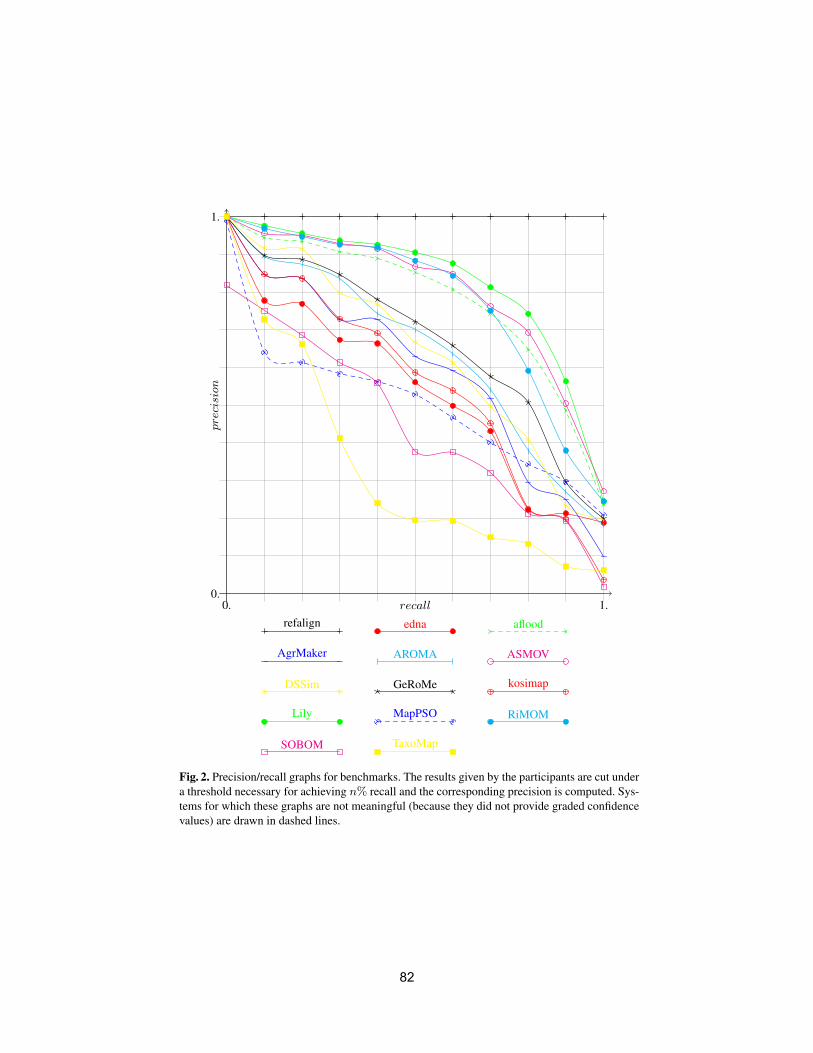
recall0. 1.0.
precision
1.
refalign edna aflood
AgrMaker AROMA ASMOV
DSSim GeRoMe kosimap
Lily MapPSO RiMOM
SOBOM TaxoMap
Fig. 2. Precision/recall graphs for benchmarks. The results given by the participants are cut undera threshold necessary for achieving n% recall and the corresponding precision is computed. Sys-tems for which these graphs are not meaningful (because they did not provide graded confidencevalues) are drawn in dashed lines.
82
4 Anatomy
Within the anatomy track we confront existing matching technology with real worldontologies. Currently, we find such real world cases primarily in the biomedical domain,where a significant number of ontologies have been built covering different aspects ofmedical research. Due to the complexity and the specialized vocabulary of the domain,matching biomedical ontologies is one of the hardest alignment problems.
4.1 Test data and experimental setting
The ontologies of the anatomy track are the NCI Thesaurus describing the humananatomy, published by the National Cancer Institute (NCI)3, and the Adult MouseAnatomical Dictionary4, which has been developed as part of the Mouse Gene Ex-pression Database project. Both resources are part of the Open Biomedical Ontologies(OBO). A detailed description of the data set has been given in the context of OAEI2007 [11] and 2008 [4].
As proposed in 2008 the task of automatically generating an alignment has beendivided into four subtasks. Task #1 is obligatory for participants of the anatomy track,while task #2, #3 and #4 are optional tasks.
– For task #1 the matcher has to be applied with standard settings to obtain a resultthat is as good as possible with respect to the expected F-measure.
– In task #2 / #3 an alignment has to be generated that favors precision over recall andvice versa. Systems configurable with respect to these requirements will be moreuseful in particular application scenarios.
– In task #4 we simulate that a group of domain experts created an incomplete refer-ence alignmentRp. Given both ontologies as well asRp, a matching system shouldbe able to exploit the additional information encoded in Rp.
Due to the harmonization of the ontologies applied in the process of generating areference alignment (see [3] and [11]), a high number of rather trivial correspondences(61%) can be found by simple string comparison techniques. At the same time, wehave a good share of non-trivial correspondences (39%). The partial reference align-ment used in subtrack #4 is the union of all trivial correspondences and 54 non-trivialcorrespondences.
4.2 Results
In total, ten systems participated in the anatomy track (in 2007 there were elevenparticipants, in 2008 nine systems participated). An overview is given in Table 4.While the number of participants is stable, we find systems participating for the firsttime (SOBOM, kosimap), systems re-entering the competition after a year of absence(AgreementMaker, which is referred to as AgrMaker in the tables) and systems contin-uously participating (ASMOV, DSSim, Lily, RiMOM, TaxoMap).
3 http://www.cancer.gov/cancerinfo/terminologyresources/4 http://www.informatics.jax.org/searches/AMA_form.shtml
83
System 2007 2008 2009aflood -
√ √
AgrMaker√
-√
+AROMA -
√ √
AOAS√
+ - -ASMOV
√ √ √
DSSim√ √ √
Falcon-AO√
- -kosimap - -
√
Lily√ √ √
Prior+√
- -RiMOM
√ √+
√
SAMBO√
+√
+ -SOBOM - -
√+
TaxoMap√ √ √
X-SOM√
- -avg. F-measure 0.598 0.718 0.764
Table 4. Overview on anatomy participants from 2007 to 2009, a√
-symbol indicates that thesystem participated, + indicates that the system achieved an F-measure ≥ 0.8 in subtrack #1.
In Table 4 we have marked the participants with an F-measure ≥ 0.8 with a +symbol. Unfortunately, the top performers of the last two years do not participate thisyear (AOAS in 2007, SAMBO in 2008). In the last row of the table the average of theobtained F-measures is shown. We observe significant improvements over time. How-ever, in each of the three years the top systems generated alignments with F-measure of≈ 0.85. It seems that there is an upper bound which is hard to exceed.
Runtime Due to the evaluation process of the OAEI, the submitted alignments havebeen generated by the participants, who run the respective systems on their own ma-chines. Nevertheless, the resulting runtime measurements provide an approximate basisfor a useful comparison. In 2007, we observed significant differences with respect to thestated runtimes. Lily required several days for completing the matching task and morethan half of the systems could not match the ontologies in less than one hour. In 2008we already observed increased runtimes. This year’s evaluation revealed that only onesystem still requires more than one hour. The fastest system is aflood (15 sec) followedby AROMA, which requires approximately 1 minute. Notice that aflood is run with aconfiguration optimized for runtime efficiency in task #1, it requires 4 minutes with aconfiguration which aims at generating an optimal alignment used for #2, #3, and #4.Detailed information about runtimes can be found in the second column of Table 5.
Results for subtracks #1, #2 and #3 Table 5 lists the results of the participants indescending order with respect to the F-measure achieved for subtrack #1. In the firsttwo rows we find SOBOM and AgreementMaker. Both systems have very good resultsand distance themselves from the remaining systems. SOBOM, although participatingfor the first time, submitted the best result in 2009. The system seems to be optimized
84
System Task #1 Task #2 Task #3 Recall+
Runtime Prec. Rec. F Prec. Rec. F Prec. Rec. F #1 #3
SOBOM ≈ 19 min 0.952 0.777 0.855 - - - - - - 0.431 -
AgrMaker ≈ 23 min 0.865 0.798 0.831 0.967 0.682 0.800 0.511 0.815 0.628 0.489 0.553
RiMOM ≈ 10 min 0.940 0.684 0.792 - - - - - - 0.183 -
TaxoMap ≈ 12 min 0.870 0.678 0.762 0.953 0.609 0.743 0.458 0.716 0.559 0.222 0.319
DSSim ≈ 12 min 0.853 0.676 0.754 0.973 0.620 0.757 0.041 0.135 0.063 0.185 0.061
ASMOV ≈ 5 min 0.746 0.755 0.751 0.821 0.736 0.776 0.725 0.767 0.745 0.419 0.474
aflood ≈ 15 sec / 4 min 0.873 0.653 0.747 0.892 0.712 0.792 0.827 0.763 0.794 0.197 0.484
Lily ≈ 99 min 0.738 0.739 0.739 0.869 0.559 0.681 0.534 0.774 0.632 0.477 0.548
AROMA ≈ 1 min 0.775 0.678 0.723 - - - - - - 0.368 -
kosimap ≈ 5 min 0.866 0.619 0.722 0.907 0.446 0.598 0.866 0.619 0.722 0.154 0.154
Table 5. Participants and results with respect to runtime, precision, recall, recall+ and F-measure.
for generating a precise alignment, however, the submitted alignment contains also anumber of non trivial correspondences (see the column Recall+ for subtrack #1).5
AgreementMaker generates a less precise alignment, but manages to output a highernumber of correct correspondences. None of the other systems detected a higher numberof non-trivial correspondences for both subtrack #1 and #3 in 2009. However, it cannottop the SAMBO submission of 2008, which is known for its extensive use of biomedicalbackground knowledge.
The RiMOM system is slightly worse with respect to the achieved F-measure com-pared to its 2008 submission. The precision has been improved, however, this causeda loss of recall and in particular a significant loss of recall+. Unfortunately, RiMOMdid not participate in subtask #3, so we cannot make statements about its strength indetecting non-trivial correspondences based on a different configuration.
The systems listed in the following columns achieve similar results with respect tothe overall quality of the generated alignments (F-measures between 0.72 and 0.76).However, significant differences can be found in terms of the trade-off between preci-sion and recall. All systems except ASMOV and Lily favor precision over recall. Noticethat a F-measure of 0.755 can easily be achieved by constructing a highly precise align-ment without detecting any non-trivial correspondences. At the same time it is relativelyhard to generate an alignment with a F-measure of 0.755 that favors recall over preci-sion. Thus, the results of ASMOV and Lily have to be interpreted more positively thanindicated by the F-measure.
The observation that it is not hard to construct a highly precise alignment with ac-ceptable recall is supported by the results of subtask #2, where we find relatively sim-ilar results for all participants. In particular, it turned out that some systems (ASMOV,DSSim) have their best F-measure in track #2. The evaluation results for aflood requiresome additional explanations. aflood is run for track #1 with a configuration which re-sults in a significant reduction of the runtime (15 sec), while for track #2 and #3 the
5 Recall+ is defined as recall restricted to the subset of non trivial correspondences in the refer-ence alignment. A detailed definition can be found in the results paper of 2007 [11].
85
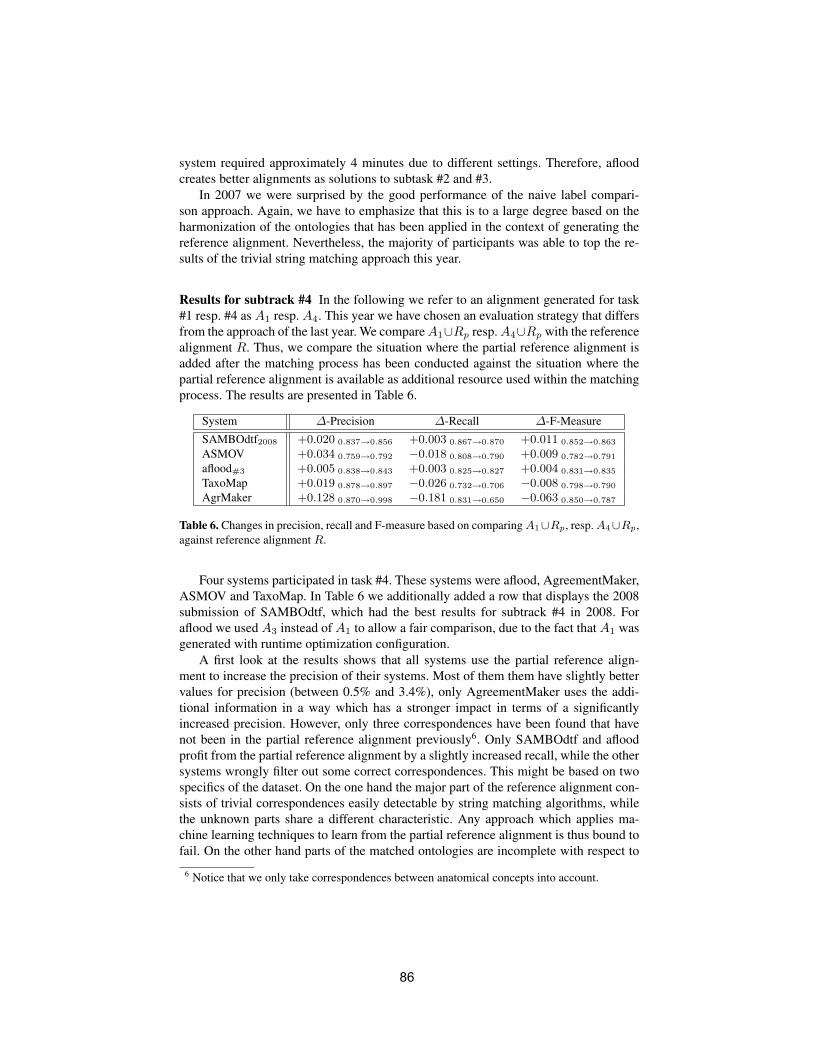
system required approximately 4 minutes due to different settings. Therefore, afloodcreates better alignments as solutions to subtask #2 and #3.
In 2007 we were surprised by the good performance of the naive label compari-son approach. Again, we have to emphasize that this is to a large degree based on theharmonization of the ontologies that has been applied in the context of generating thereference alignment. Nevertheless, the majority of participants was able to top the re-sults of the trivial string matching approach this year.
Results for subtrack #4 In the following we refer to an alignment generated for task#1 resp. #4 as A1 resp. A4. This year we have chosen an evaluation strategy that differsfrom the approach of the last year. We compareA1∪Rp resp.A4∪Rp with the referencealignment R. Thus, we compare the situation where the partial reference alignment isadded after the matching process has been conducted against the situation where thepartial reference alignment is available as additional resource used within the matchingprocess. The results are presented in Table 6.
System ∆-Precision ∆-Recall ∆-F-Measure
SAMBOdtf2008 +0.020 0.837→0.856 +0.003 0.867→0.870 +0.011 0.852→0.863
ASMOV +0.034 0.759→0.792 −0.018 0.808→0.790 +0.009 0.782→0.791
aflood#3 +0.005 0.838→0.843 +0.003 0.825→0.827 +0.004 0.831→0.835
TaxoMap +0.019 0.878→0.897 −0.026 0.732→0.706 −0.008 0.798→0.790
AgrMaker +0.128 0.870→0.998 −0.181 0.831→0.650 −0.063 0.850→0.787
Table 6. Changes in precision, recall and F-measure based on comparingA1∪Rp, resp.A4∪Rp,against reference alignment R.
Four systems participated in task #4. These systems were aflood, AgreementMaker,ASMOV and TaxoMap. In Table 6 we additionally added a row that displays the 2008submission of SAMBOdtf, which had the best results for subtrack #4 in 2008. Foraflood we used A3 instead of A1 to allow a fair comparison, due to the fact that A1 wasgenerated with runtime optimization configuration.
A first look at the results shows that all systems use the partial reference align-ment to increase the precision of their systems. Most of them them have slightly bettervalues for precision (between 0.5% and 3.4%), only AgreementMaker uses the addi-tional information in a way which has a stronger impact in terms of a significantlyincreased precision. However, only three correspondences have been found that havenot been in the partial reference alignment previously6. Only SAMBOdtf and afloodprofit from the partial reference alignment by a slightly increased recall, while the othersystems wrongly filter out some correct correspondences. This might be based on twospecifics of the dataset. On the one hand the major part of the reference alignment con-sists of trivial correspondences easily detectable by string matching algorithms, whilethe unknown parts share a different characteristic. Any approach which applies ma-chine learning techniques to learn from the partial reference alignment is thus bound tofail. On the other hand parts of the matched ontologies are incomplete with respect to
6 Notice that we only take correspondences between anatomical concepts into account.
86
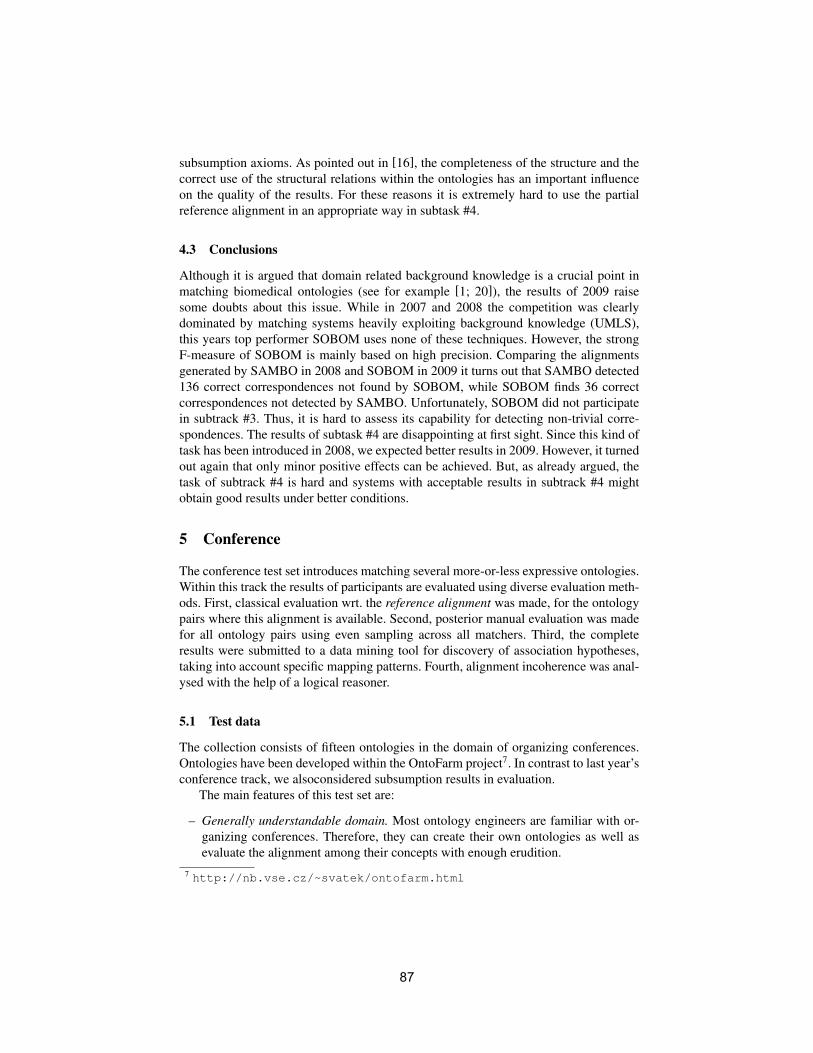
subsumption axioms. As pointed out in [16], the completeness of the structure and thecorrect use of the structural relations within the ontologies has an important influenceon the quality of the results. For these reasons it is extremely hard to use the partialreference alignment in an appropriate way in subtask #4.
4.3 Conclusions
Although it is argued that domain related background knowledge is a crucial point inmatching biomedical ontologies (see for example [1; 20]), the results of 2009 raisesome doubts about this issue. While in 2007 and 2008 the competition was clearlydominated by matching systems heavily exploiting background knowledge (UMLS),this years top performer SOBOM uses none of these techniques. However, the strongF-measure of SOBOM is mainly based on high precision. Comparing the alignmentsgenerated by SAMBO in 2008 and SOBOM in 2009 it turns out that SAMBO detected136 correct correspondences not found by SOBOM, while SOBOM finds 36 correctcorrespondences not detected by SAMBO. Unfortunately, SOBOM did not participatein subtrack #3. Thus, it is hard to assess its capability for detecting non-trivial corre-spondences. The results of subtask #4 are disappointing at first sight. Since this kind oftask has been introduced in 2008, we expected better results in 2009. However, it turnedout again that only minor positive effects can be achieved. But, as already argued, thetask of subtrack #4 is hard and systems with acceptable results in subtrack #4 mightobtain good results under better conditions.
5 Conference
The conference test set introduces matching several more-or-less expressive ontologies.Within this track the results of participants are evaluated using diverse evaluation meth-ods. First, classical evaluation wrt. the reference alignment was made, for the ontologypairs where this alignment is available. Second, posterior manual evaluation was madefor all ontology pairs using even sampling across all matchers. Third, the completeresults were submitted to a data mining tool for discovery of association hypotheses,taking into account specific mapping patterns. Fourth, alignment incoherence was anal-ysed with the help of a logical reasoner.
5.1 Test data
The collection consists of fifteen ontologies in the domain of organizing conferences.Ontologies have been developed within the OntoFarm project7. In contrast to last year’sconference track, we alsoconsidered subsumption results in evaluation.
The main features of this test set are:
– Generally understandable domain. Most ontology engineers are familiar with or-ganizing conferences. Therefore, they can create their own ontologies as well asevaluate the alignment among their concepts with enough erudition.
7 http://nb.vse.cz/~svatek/ontofarm.html
87
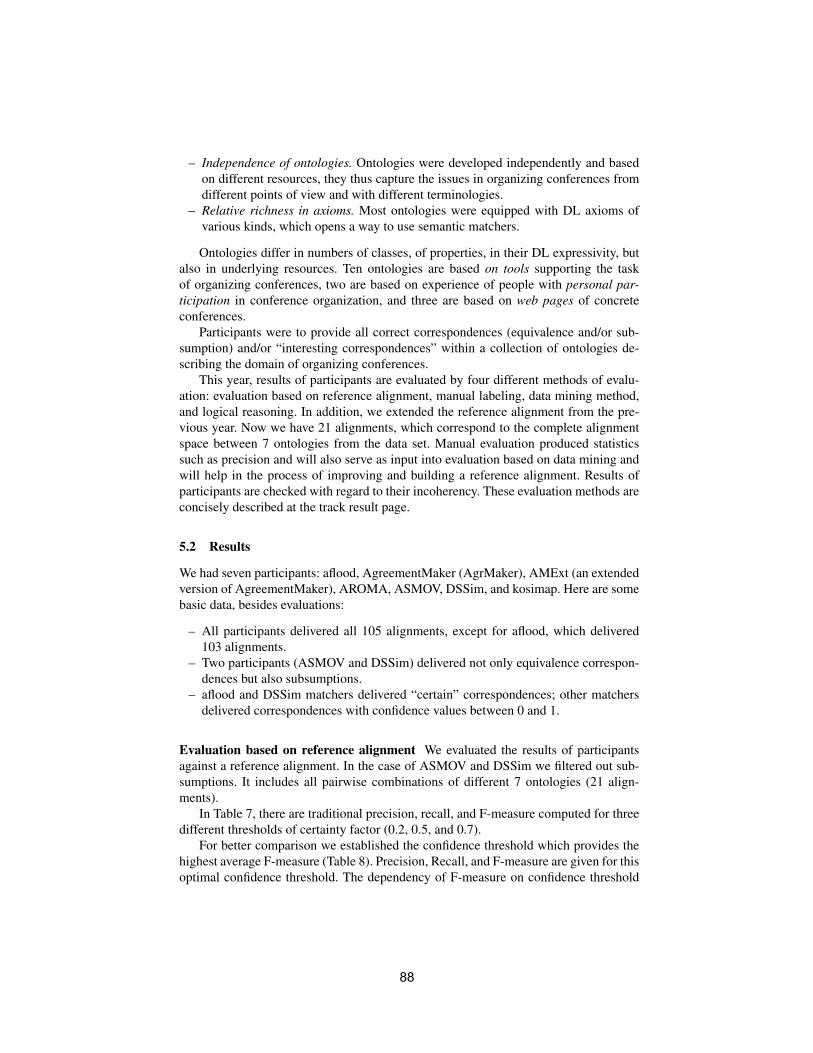
– Independence of ontologies. Ontologies were developed independently and basedon different resources, they thus capture the issues in organizing conferences fromdifferent points of view and with different terminologies.
– Relative richness in axioms. Most ontologies were equipped with DL axioms ofvarious kinds, which opens a way to use semantic matchers.
Ontologies differ in numbers of classes, of properties, in their DL expressivity, butalso in underlying resources. Ten ontologies are based on tools supporting the taskof organizing conferences, two are based on experience of people with personal par-ticipation in conference organization, and three are based on web pages of concreteconferences.
Participants were to provide all correct correspondences (equivalence and/or sub-sumption) and/or “interesting correspondences” within a collection of ontologies de-scribing the domain of organizing conferences.
This year, results of participants are evaluated by four different methods of evalu-ation: evaluation based on reference alignment, manual labeling, data mining method,and logical reasoning. In addition, we extended the reference alignment from the pre-vious year. Now we have 21 alignments, which correspond to the complete alignmentspace between 7 ontologies from the data set. Manual evaluation produced statisticssuch as precision and will also serve as input into evaluation based on data mining andwill help in the process of improving and building a reference alignment. Results ofparticipants are checked with regard to their incoherency. These evaluation methods areconcisely described at the track result page.
5.2 Results
We had seven participants: aflood, AgreementMaker (AgrMaker), AMExt (an extendedversion of AgreementMaker), AROMA, ASMOV, DSSim, and kosimap. Here are somebasic data, besides evaluations:
– All participants delivered all 105 alignments, except for aflood, which delivered103 alignments.
– Two participants (ASMOV and DSSim) delivered not only equivalence correspon-dences but also subsumptions.
– aflood and DSSim matchers delivered “certain” correspondences; other matchersdelivered correspondences with confidence values between 0 and 1.
Evaluation based on reference alignment We evaluated the results of participantsagainst a reference alignment. In the case of ASMOV and DSSim we filtered out sub-sumptions. It includes all pairwise combinations of different 7 ontologies (21 align-ments).
In Table 7, there are traditional precision, recall, and F-measure computed for threedifferent thresholds of certainty factor (0.2, 0.5, and 0.7).
For better comparison we established the confidence threshold which provides thehighest average F-measure (Table 8). Precision, Recall, and F-measure are given for thisoptimal confidence threshold. The dependency of F-measure on confidence threshold
88
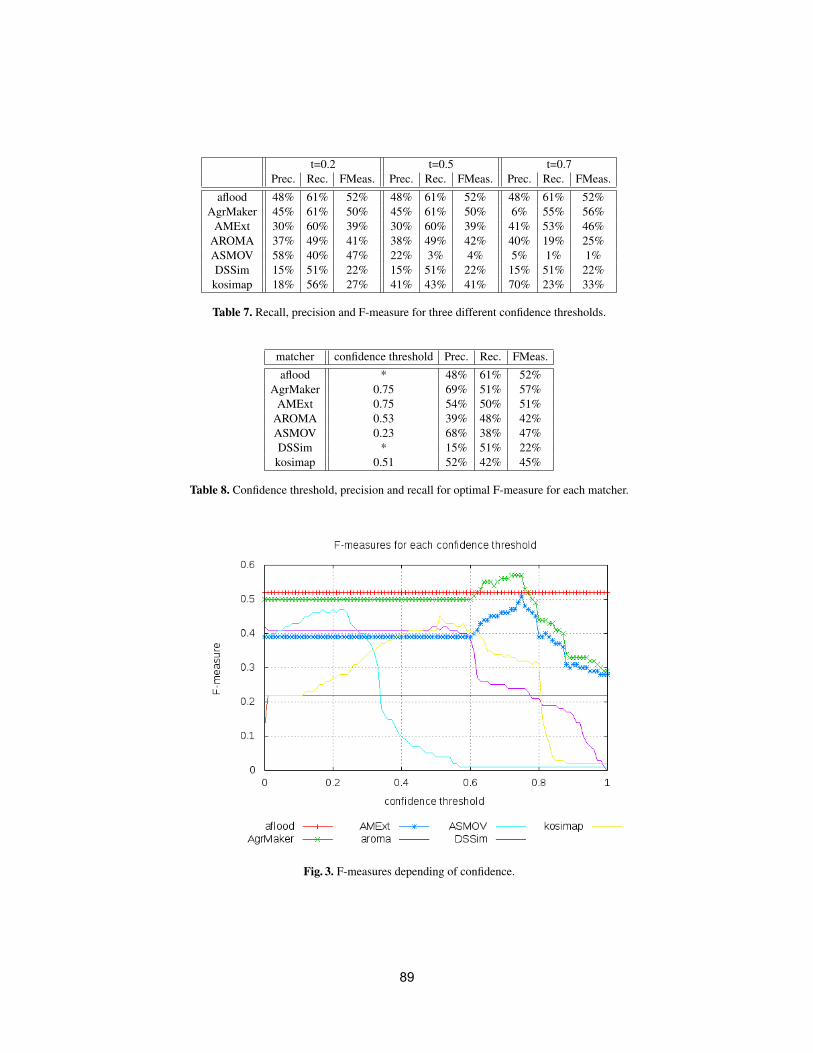
t=0.2 t=0.5 t=0.7Prec. Rec. FMeas. Prec. Rec. FMeas. Prec. Rec. FMeas.
aflood 48% 61% 52% 48% 61% 52% 48% 61% 52%AgrMaker 45% 61% 50% 45% 61% 50% 6% 55% 56%
AMExt 30% 60% 39% 30% 60% 39% 41% 53% 46%AROMA 37% 49% 41% 38% 49% 42% 40% 19% 25%ASMOV 58% 40% 47% 22% 3% 4% 5% 1% 1%DSSim 15% 51% 22% 15% 51% 22% 15% 51% 22%kosimap 18% 56% 27% 41% 43% 41% 70% 23% 33%
Table 7. Recall, precision and F-measure for three different confidence thresholds.
matcher confidence threshold Prec. Rec. FMeas.
aflood * 48% 61% 52%AgrMaker 0.75 69% 51% 57%
AMExt 0.75 54% 50% 51%AROMA 0.53 39% 48% 42%ASMOV 0.23 68% 38% 47%DSSim * 15% 51% 22%kosimap 0.51 52% 42% 45%
Table 8. Confidence threshold, precision and recall for optimal F-measure for each matcher.
Fig. 3. F-measures depending of confidence.
89
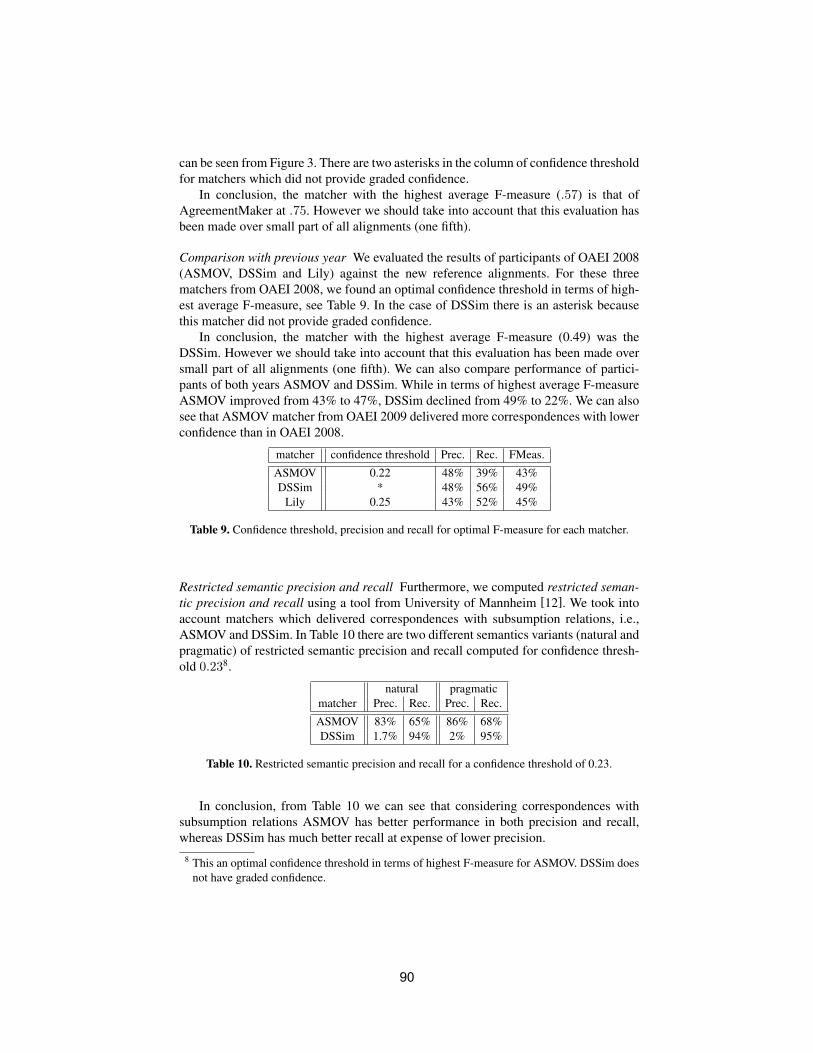
can be seen from Figure 3. There are two asterisks in the column of confidence thresholdfor matchers which did not provide graded confidence.
In conclusion, the matcher with the highest average F-measure (.57) is that ofAgreementMaker at .75. However we should take into account that this evaluation hasbeen made over small part of all alignments (one fifth).
Comparison with previous year We evaluated the results of participants of OAEI 2008(ASMOV, DSSim and Lily) against the new reference alignments. For these threematchers from OAEI 2008, we found an optimal confidence threshold in terms of high-est average F-measure, see Table 9. In the case of DSSim there is an asterisk becausethis matcher did not provide graded confidence.
In conclusion, the matcher with the highest average F-measure (0.49) was theDSSim. However we should take into account that this evaluation has been made oversmall part of all alignments (one fifth). We can also compare performance of partici-pants of both years ASMOV and DSSim. While in terms of highest average F-measureASMOV improved from 43% to 47%, DSSim declined from 49% to 22%. We can alsosee that ASMOV matcher from OAEI 2009 delivered more correspondences with lowerconfidence than in OAEI 2008.
matcher confidence threshold Prec. Rec. FMeas.
ASMOV 0.22 48% 39% 43%DSSim * 48% 56% 49%
Lily 0.25 43% 52% 45%
Table 9. Confidence threshold, precision and recall for optimal F-measure for each matcher.
Restricted semantic precision and recall Furthermore, we computed restricted seman-tic precision and recall using a tool from University of Mannheim [12]. We took intoaccount matchers which delivered correspondences with subsumption relations, i.e.,ASMOV and DSSim. In Table 10 there are two different semantics variants (natural andpragmatic) of restricted semantic precision and recall computed for confidence thresh-old 0.238.
natural pragmaticmatcher Prec. Rec. Prec. Rec.
ASMOV 83% 65% 86% 68%DSSim 1.7% 94% 2% 95%
Table 10. Restricted semantic precision and recall for a confidence threshold of 0.23.
In conclusion, from Table 10 we can see that considering correspondences withsubsumption relations ASMOV has better performance in both precision and recall,whereas DSSim has much better recall at expense of lower precision.
8 This an optimal confidence threshold in terms of highest F-measure for ASMOV. DSSim doesnot have graded confidence.
90
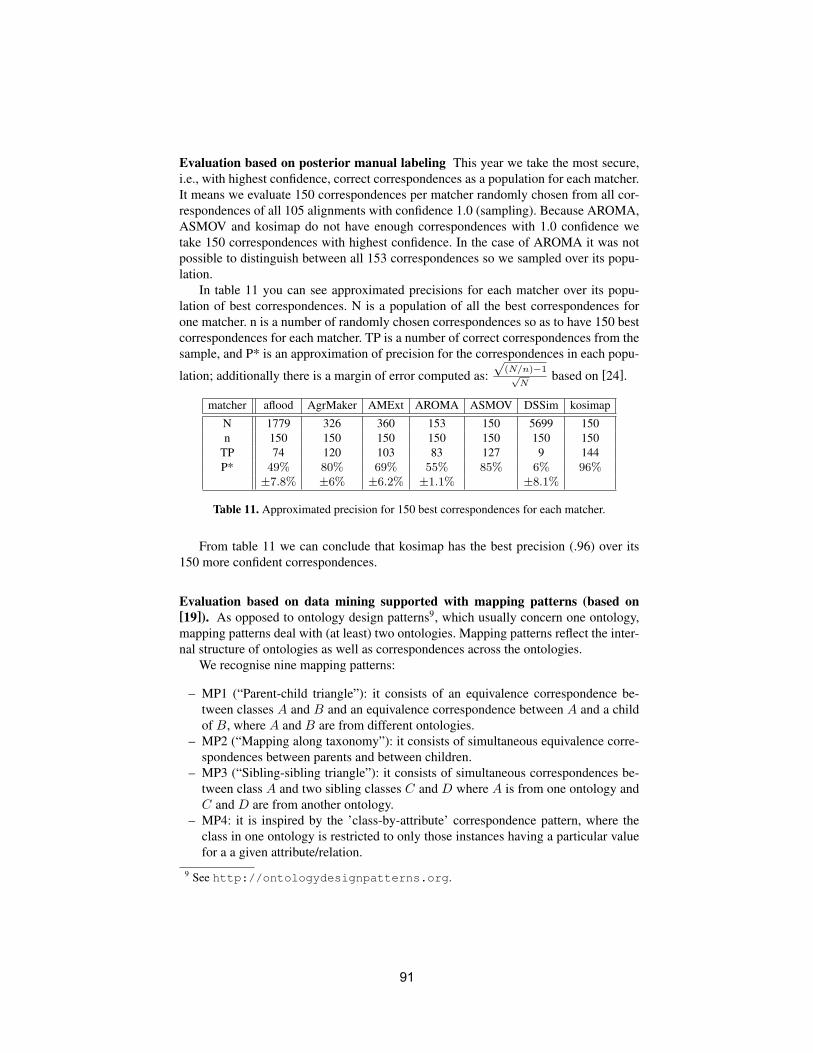
Evaluation based on posterior manual labeling This year we take the most secure,i.e., with highest confidence, correct correspondences as a population for each matcher.It means we evaluate 150 correspondences per matcher randomly chosen from all cor-respondences of all 105 alignments with confidence 1.0 (sampling). Because AROMA,ASMOV and kosimap do not have enough correspondences with 1.0 confidence wetake 150 correspondences with highest confidence. In the case of AROMA it was notpossible to distinguish between all 153 correspondences so we sampled over its popu-lation.
In table 11 you can see approximated precisions for each matcher over its popu-lation of best correspondences. N is a population of all the best correspondences forone matcher. n is a number of randomly chosen correspondences so as to have 150 bestcorrespondences for each matcher. TP is a number of correct correspondences from thesample, and P* is an approximation of precision for the correspondences in each popu-
lation; additionally there is a margin of error computed as:√
(N/n)−1√N
based on [24].
matcher aflood AgrMaker AMExt AROMA ASMOV DSSim kosimap
N 1779 326 360 153 150 5699 150n 150 150 150 150 150 150 150
TP 74 120 103 83 127 9 144P* 49% 80% 69% 55% 85% 6% 96%
±7.8% ±6% ±6.2% ±1.1% ±8.1%
Table 11. Approximated precision for 150 best correspondences for each matcher.
From table 11 we can conclude that kosimap has the best precision (.96) over its150 more confident correspondences.
Evaluation based on data mining supported with mapping patterns (based on[19]). As opposed to ontology design patterns9, which usually concern one ontology,mapping patterns deal with (at least) two ontologies. Mapping patterns reflect the inter-nal structure of ontologies as well as correspondences across the ontologies.
We recognise nine mapping patterns:
– MP1 (“Parent-child triangle”): it consists of an equivalence correspondence be-tween classes A and B and an equivalence correspondence between A and a childof B, where A and B are from different ontologies.
– MP2 (“Mapping along taxonomy”): it consists of simultaneous equivalence corre-spondences between parents and between children.
– MP3 (“Sibling-sibling triangle”): it consists of simultaneous correspondences be-tween class A and two sibling classes C and D where A is from one ontology andC and D are from another ontology.
– MP4: it is inspired by the ’class-by-attribute’ correspondence pattern, where theclass in one ontology is restricted to only those instances having a particular valuefor a a given attribute/relation.
9 See http://ontologydesignpatterns.org.
91
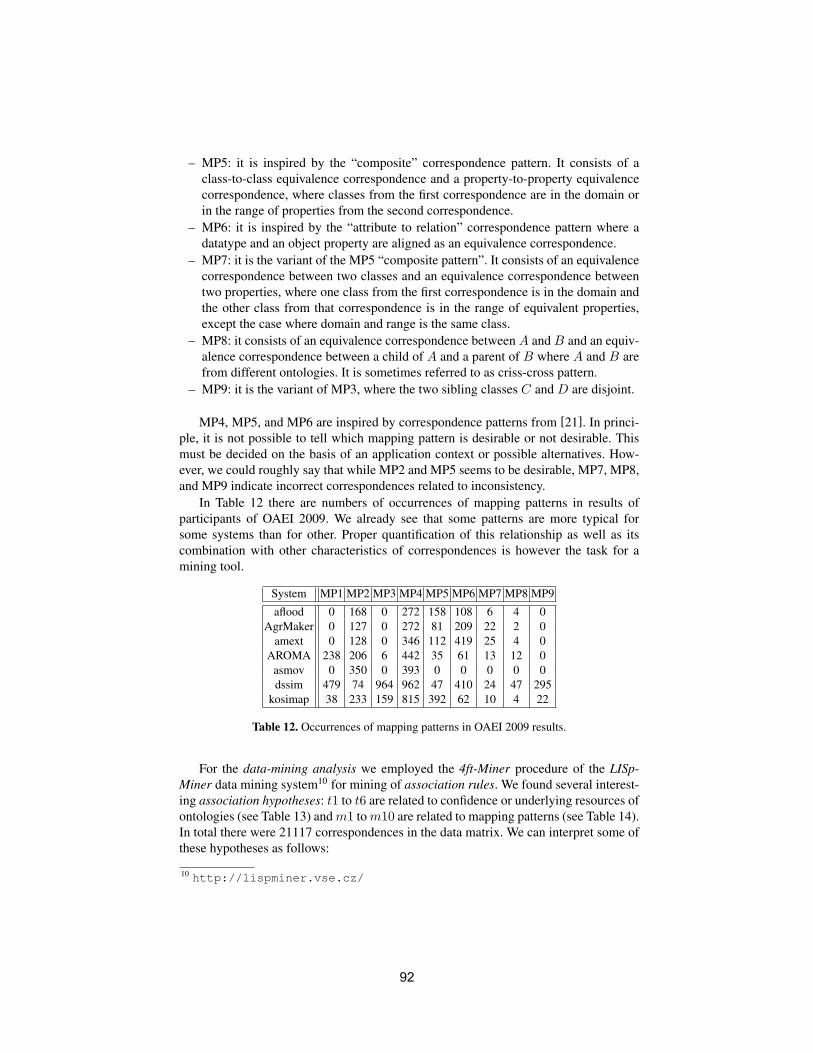
– MP5: it is inspired by the “composite” correspondence pattern. It consists of aclass-to-class equivalence correspondence and a property-to-property equivalencecorrespondence, where classes from the first correspondence are in the domain orin the range of properties from the second correspondence.
– MP6: it is inspired by the “attribute to relation” correspondence pattern where adatatype and an object property are aligned as an equivalence correspondence.
– MP7: it is the variant of the MP5 “composite pattern”. It consists of an equivalencecorrespondence between two classes and an equivalence correspondence betweentwo properties, where one class from the first correspondence is in the domain andthe other class from that correspondence is in the range of equivalent properties,except the case where domain and range is the same class.
– MP8: it consists of an equivalence correspondence between A and B and an equiv-alence correspondence between a child of A and a parent of B where A and B arefrom different ontologies. It is sometimes referred to as criss-cross pattern.
– MP9: it is the variant of MP3, where the two sibling classes C and D are disjoint.
MP4, MP5, and MP6 are inspired by correspondence patterns from [21]. In princi-ple, it is not possible to tell which mapping pattern is desirable or not desirable. Thismust be decided on the basis of an application context or possible alternatives. How-ever, we could roughly say that while MP2 and MP5 seems to be desirable, MP7, MP8,and MP9 indicate incorrect correspondences related to inconsistency.
In Table 12 there are numbers of occurrences of mapping patterns in results ofparticipants of OAEI 2009. We already see that some patterns are more typical forsome systems than for other. Proper quantification of this relationship as well as itscombination with other characteristics of correspondences is however the task for amining tool.
System MP1 MP2 MP3 MP4 MP5 MP6 MP7 MP8 MP9
aflood 0 168 0 272 158 108 6 4 0AgrMaker 0 127 0 272 81 209 22 2 0
amext 0 128 0 346 112 419 25 4 0AROMA 238 206 6 442 35 61 13 12 0
asmov 0 350 0 393 0 0 0 0 0dssim 479 74 964 962 47 410 24 47 295
kosimap 38 233 159 815 392 62 10 4 22
Table 12. Occurrences of mapping patterns in OAEI 2009 results.
For the data-mining analysis we employed the 4ft-Miner procedure of the LISp-Miner data mining system10 for mining of association rules. We found several interest-ing association hypotheses: t1 to t6 are related to confidence or underlying resources ofontologies (see Table 13) andm1 tom10 are related to mapping patterns (see Table 14).In total there were 21117 correspondences in the data matrix. We can interpret some ofthese hypotheses as follows:
10 http://lispminer.vse.cz/
92
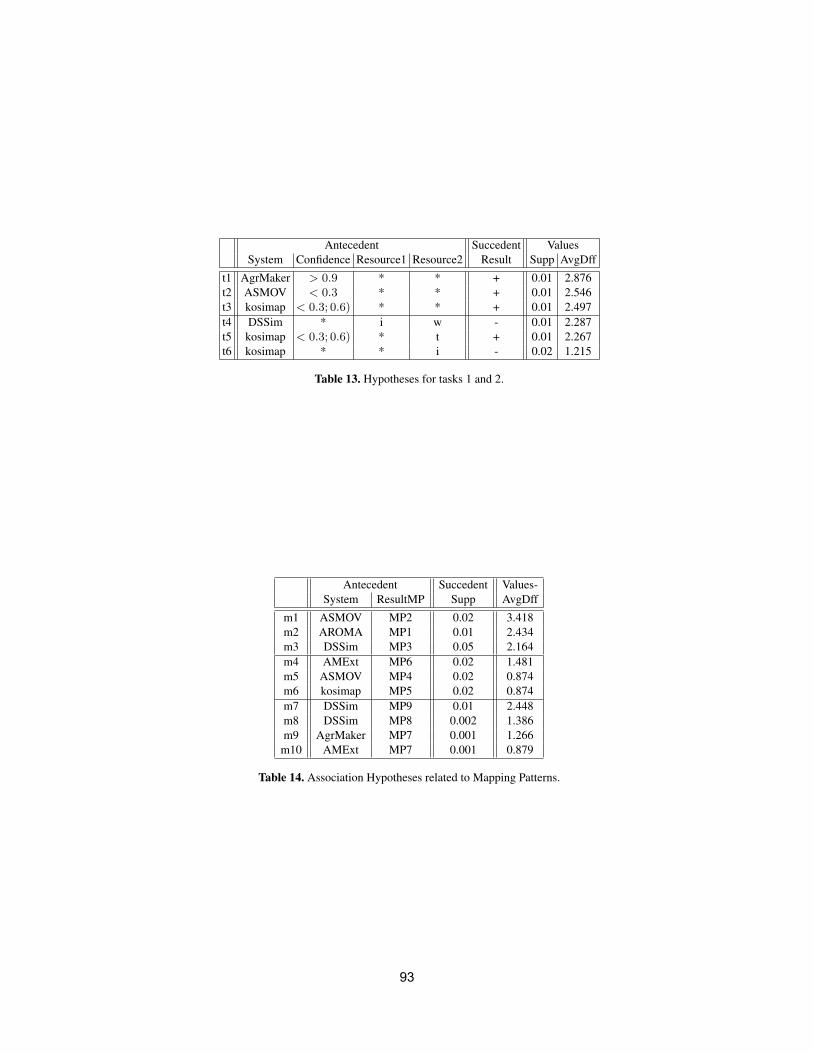
Antecedent Succedent ValuesSystem Confidence Resource1 Resource2 Result Supp AvgDff
t1 AgrMaker > 0.9 * * + 0.01 2.876t2 ASMOV < 0.3 * * + 0.01 2.546t3 kosimap < 0.3; 0.6) * * + 0.01 2.497t4 DSSim * i w - 0.01 2.287t5 kosimap < 0.3; 0.6) * t + 0.01 2.267t6 kosimap * * i - 0.02 1.215
Table 13. Hypotheses for tasks 1 and 2.
Antecedent Succedent Values-System ResultMP Supp AvgDff
m1 ASMOV MP2 0.02 3.418m2 AROMA MP1 0.01 2.434m3 DSSim MP3 0.05 2.164m4 AMExt MP6 0.02 1.481m5 ASMOV MP4 0.02 0.874m6 kosimap MP5 0.02 0.874m7 DSSim MP9 0.01 2.448m8 DSSim MP8 0.002 1.386m9 AgrMaker MP7 0.001 1.266
m10 AMExt MP7 0.001 0.879
Table 14. Association Hypotheses related to Mapping Patterns.
93
– Hypothesis t1: Correspondences that are produced by system AgreementMaker andhave high confidence values (higher than 0.9) are by 287%, i.e. almost four times,more often correct than correspondences produced by all systems with all confi-dence values (on average).
– Hypothesis t4: Correspondences that are produced by system DSSim where ontol-ogy 1 is based on expert knowledge and ontology 2 is based on web are by 228%,i.e., more than three times, more often incorrect than correspondences produced byall systems for all types of ontologies (on average).
– Hypothesis m1: Correspondences that are produced by matcher ASMOV are by341%, i.e., more than four times, more often part of MP2 than correspondencesproduced by all systems (on average).
– Hypothesis m4: Correspondences that are produced by matcher AMExt are by148%, i.e., more than twice, more often part of MP6 than correspondences pro-duced by all systems (on average).
– Hypothesis m7: Correspondences that are produced by matcher DSSim are by244%, i.e., more than three times, more often part of MP9 than correspondencesproduced by all systems (on average).
– Hypothesis m9: Correspondences that are produced by matcher AgreementMakerare by 126%, i.e., more twice, more often part of MP7 than correspondences pro-duced by all systems (on average).
In conclusion, regarding the first three hypotheses we could say that Agreement-Maker is more sure about correspondences with high values than other matchers, AS-MOV is suprisingly more correct about correspondences with low confidence valuesthan other matchers and kosimap is more correct for correspondences with mediumconfidence values. According to next three hypotheses we could say that kosimap worksbetter with ontologies based on tool than web. Further DSSim has problems with align-ing “expert’ ontologies” and “web” ontologies.
Regarding the three first mapping patterns, ASMOV found MP2, AROMA MP1,and DSSim MP3. Furthermore, AMExt found MP6 as simple correspondence, whichis discutable. Maybe it could be better to find instead of datatype property to objectproperty “property-chain” which would allow mapping between datatype property todatatype property via object property as an intermediate mapping element. ASMOVfound some correspondences where one class is restricted over certain property’s value(MP4) and kosimap found composite pattern (MP5). Finally, some occurrences of thelast three mapping patterns were found over the results of DSSim, AgreementMaker,and AMExt. However these related hypotheses had low support except for DSSim andMP9. Anyway we can say that these matchers could be improved if they check theconsistency of their results.
Evaluation based on alignment coherence In 2008 we evaluated for the first timethe coherence of the submitted alignments. Again, we picked up the same evaluationapproach using the maximum cardinality measure mt
card proposed in [17]. The mtcard
measure compares the number of correspondences that have to be removed to arriveat a coherent subset against the number of all correspondences in the alignment. Theresulting number can be considered as the degree of alignment incoherence. A number
94
of 0% means, for example, that the alignment is coherent. In particular, we use thepragmatic alignment semantic as defined in [18] to interpret the correspondences of analignment.
In our experiments we focused on equivalence correspondences and removed sub-sumption correspondences from the submitted alignments prior to our evaluation. Weapplied our evaluation approach to the subset of those matching tasks where a referencealignment is available. We used the Pellet reasoner to perform our experiments and ex-cluded the Iasted ontology, which caused reasoning problems in combination with someof the other ontologies.
Results are presented in Table 15. For all systems we used the alignments after ap-plying the optimal confidence threshold (see subscript), and the systems marked with *are those systems that did not deliver a graded confidence. Comparing the correspond-ing results, the ASMOV system clearly distances itself from the remaining participants.All of the generated alignments were coherent and thus we measured 0% degree of in-coherence. However, the thresholded ASMOV alignments contain only few correspon-dences compared to the alignments of the other systems, which makes it more probableto construct coherent alignments. Thus, we also included the untresholded ASMOValignments (no subscript) in our analysis: We measured a degree of incoherence of1.8%, a value that is still significantly lower compared to the other systems. These re-sults also concide with the results presented in Table 14 related to the occurrence of theMP7 to MP9 mapping patterns.
While the verification component built into ASMOV detects most incoherences,none of the other systems uses similar strategies. We have to conclude that logicalaspects play only a subordinate role within the approaches implemented in the othermatching systems. Additionally, we analyzed what happens when the verification com-ponent of ASMOV is turned off.11 The results are presented in the ASMOVx row. No-tice that the measured values are now similar to the coherence characteristics of theother systems.
In conclusion, these observations also offer an explanation for the significant dif-ference between DSSim and ASMOV with respect to restricted semantic precision andrecall (see again Table 10). Computing restricted semantic precision and recall of analignment A requires to compute the closure of A with respect to derivable subsump-tion correspondences. Suppose now thatA is incoherent and a large fraction of conceptsC1, ..., Cn in O1 and D1, ..., Dm in O2 becomes unsatisfiable. It follows that A entailseach correspondence of the type ... w Ci with i = 1 . . . n, respectively Dj v ... withj = 1 . . .m. A highly incoherent alignment will thus entail a huge amount of incorrectcorrespondences. This is the explanation for DSSim’s low precision of approximately2%. These considerations also indicate that the degree of incoherence might have astrong effect on any application that requires to exploit an alignment in a reasoningcontext.
11 We would like to thank Yves R. Jean-Mary for providing us with the corresponding set ofalignments.
95
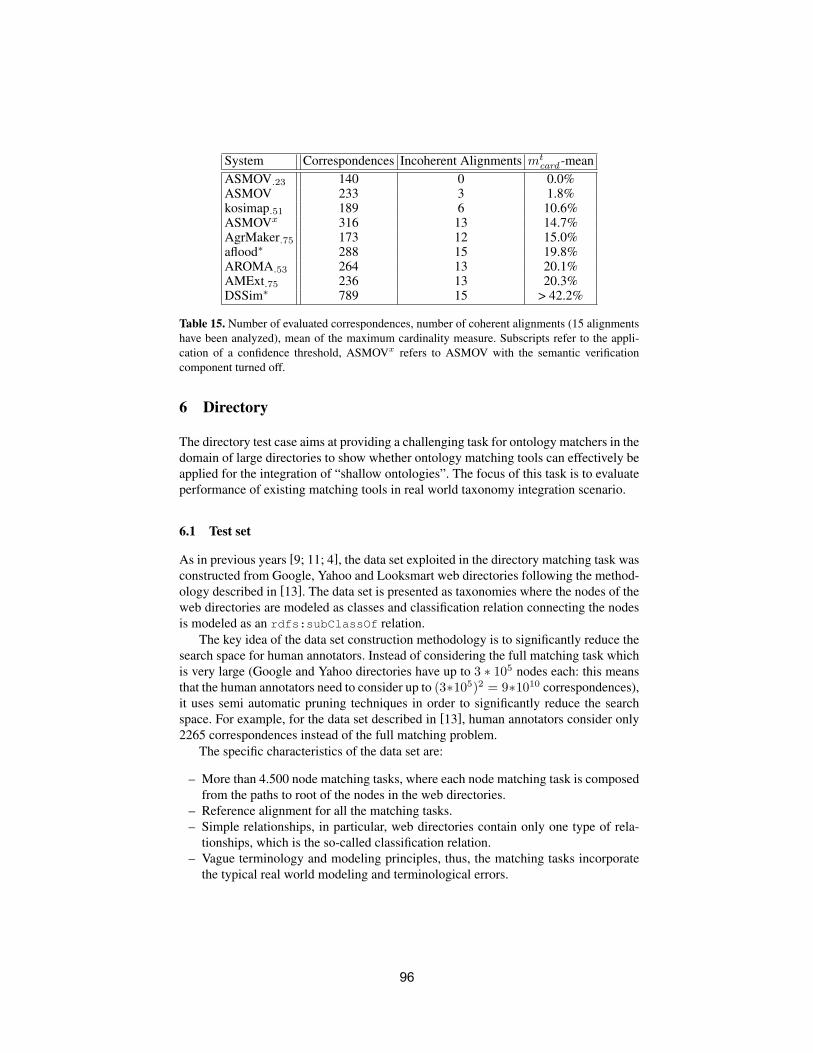
System Correspondences Incoherent Alignments mtcard -mean
ASMOV.23 140 0 0.0%ASMOV 233 3 1.8%kosimap.51 189 6 10.6%ASMOVx 316 13 14.7%AgrMaker.75 173 12 15.0%aflood∗ 288 15 19.8%AROMA.53 264 13 20.1%AMExt.75 236 13 20.3%DSSim∗ 789 15 > 42.2%
Table 15. Number of evaluated correspondences, number of coherent alignments (15 alignmentshave been analyzed), mean of the maximum cardinality measure. Subscripts refer to the appli-cation of a confidence threshold, ASMOVx refers to ASMOV with the semantic verificationcomponent turned off.
6 Directory
The directory test case aims at providing a challenging task for ontology matchers in thedomain of large directories to show whether ontology matching tools can effectively beapplied for the integration of “shallow ontologies”. The focus of this task is to evaluateperformance of existing matching tools in real world taxonomy integration scenario.
6.1 Test set
As in previous years [9; 11; 4], the data set exploited in the directory matching task wasconstructed from Google, Yahoo and Looksmart web directories following the method-ology described in [13]. The data set is presented as taxonomies where the nodes of theweb directories are modeled as classes and classification relation connecting the nodesis modeled as an rdfs:subClassOf relation.
The key idea of the data set construction methodology is to significantly reduce thesearch space for human annotators. Instead of considering the full matching task whichis very large (Google and Yahoo directories have up to 3 ∗ 105 nodes each: this meansthat the human annotators need to consider up to (3∗105)2 = 9∗1010 correspondences),it uses semi automatic pruning techniques in order to significantly reduce the searchspace. For example, for the data set described in [13], human annotators consider only2265 correspondences instead of the full matching problem.
The specific characteristics of the data set are:
– More than 4.500 node matching tasks, where each node matching task is composedfrom the paths to root of the nodes in the web directories.
– Reference alignment for all the matching tasks.– Simple relationships, in particular, web directories contain only one type of rela-
tionships, which is the so-called classification relation.– Vague terminology and modeling principles, thus, the matching tasks incorporate
the typical real world modeling and terminological errors.
96
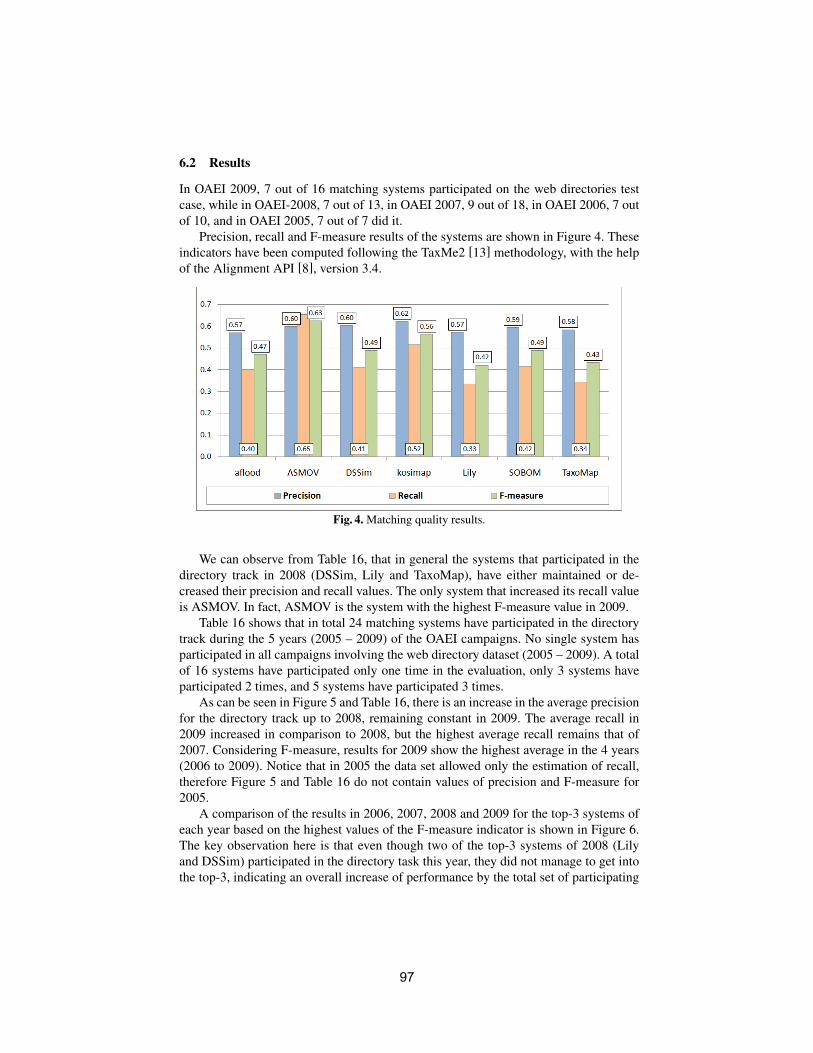
6.2 Results
In OAEI 2009, 7 out of 16 matching systems participated on the web directories testcase, while in OAEI-2008, 7 out of 13, in OAEI 2007, 9 out of 18, in OAEI 2006, 7 outof 10, and in OAEI 2005, 7 out of 7 did it.
Precision, recall and F-measure results of the systems are shown in Figure 4. Theseindicators have been computed following the TaxMe2 [13] methodology, with the helpof the Alignment API [8], version 3.4.
Fig. 4. Matching quality results.
We can observe from Table 16, that in general the systems that participated in thedirectory track in 2008 (DSSim, Lily and TaxoMap), have either maintained or de-creased their precision and recall values. The only system that increased its recall valueis ASMOV. In fact, ASMOV is the system with the highest F-measure value in 2009.
Table 16 shows that in total 24 matching systems have participated in the directorytrack during the 5 years (2005 – 2009) of the OAEI campaigns. No single system hasparticipated in all campaigns involving the web directory dataset (2005 – 2009). A totalof 16 systems have participated only one time in the evaluation, only 3 systems haveparticipated 2 times, and 5 systems have participated 3 times.
As can be seen in Figure 5 and Table 16, there is an increase in the average precisionfor the directory track up to 2008, remaining constant in 2009. The average recall in2009 increased in comparison to 2008, but the highest average recall remains that of2007. Considering F-measure, results for 2009 show the highest average in the 4 years(2006 to 2009). Notice that in 2005 the data set allowed only the estimation of recall,therefore Figure 5 and Table 16 do not contain values of precision and F-measure for2005.
A comparison of the results in 2006, 2007, 2008 and 2009 for the top-3 systems ofeach year based on the highest values of the F-measure indicator is shown in Figure 6.The key observation here is that even though two of the top-3 systems of 2008 (Lilyand DSSim) participated in the directory task this year, they did not manage to get intothe top-3, indicating an overall increase of performance by the total set of participating
97
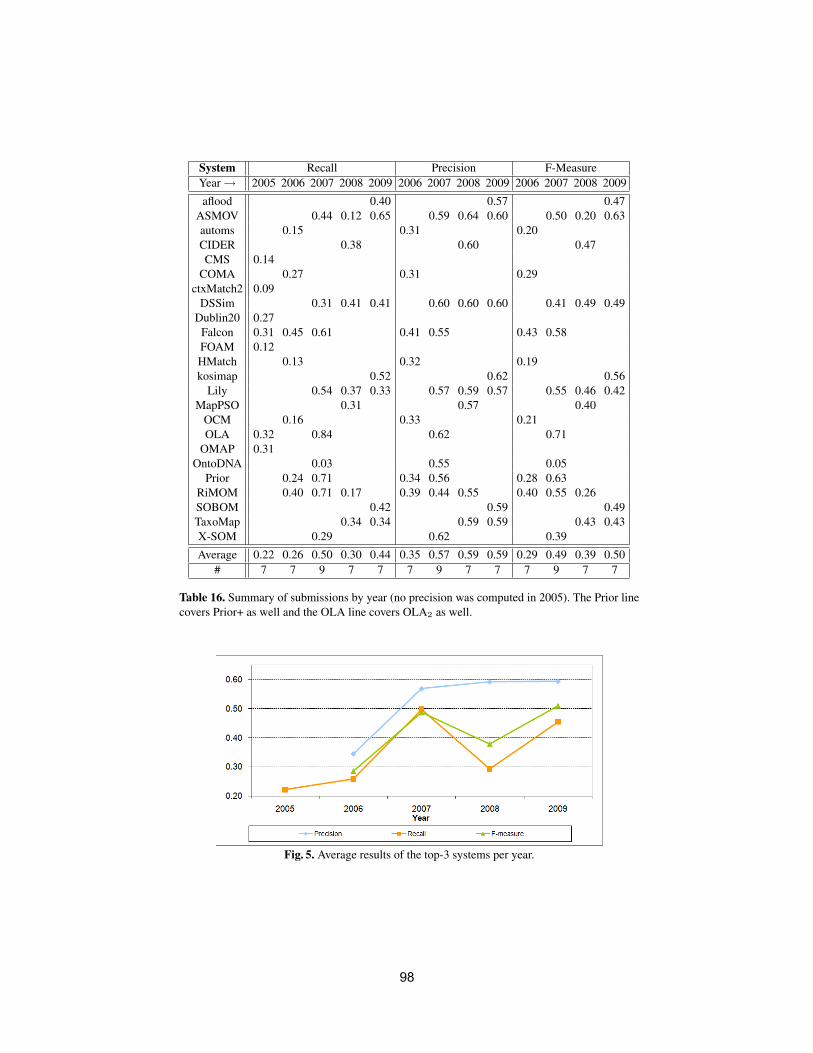
System Recall Precision F-MeasureYear→ 2005 2006 2007 2008 2009 2006 2007 2008 2009 2006 2007 2008 2009
aflood 0.40 0.57 0.47ASMOV 0.44 0.12 0.65 0.59 0.64 0.60 0.50 0.20 0.63automs 0.15 0.31 0.20CIDER 0.38 0.60 0.47CMS 0.14
COMA 0.27 0.31 0.29ctxMatch2 0.09
DSSim 0.31 0.41 0.41 0.60 0.60 0.60 0.41 0.49 0.49Dublin20 0.27
Falcon 0.31 0.45 0.61 0.41 0.55 0.43 0.58FOAM 0.12HMatch 0.13 0.32 0.19kosimap 0.52 0.62 0.56
Lily 0.54 0.37 0.33 0.57 0.59 0.57 0.55 0.46 0.42MapPSO 0.31 0.57 0.40
OCM 0.16 0.33 0.21OLA 0.32 0.84 0.62 0.71
OMAP 0.31OntoDNA 0.03 0.55 0.05
Prior 0.24 0.71 0.34 0.56 0.28 0.63RiMOM 0.40 0.71 0.17 0.39 0.44 0.55 0.40 0.55 0.26SOBOM 0.42 0.59 0.49TaxoMap 0.34 0.34 0.59 0.59 0.43 0.43X-SOM 0.29 0.62 0.39
Average 0.22 0.26 0.50 0.30 0.44 0.35 0.57 0.59 0.59 0.29 0.49 0.39 0.50# 7 7 9 7 7 7 9 7 7 7 9 7 7
Table 16. Summary of submissions by year (no precision was computed in 2005). The Prior linecovers Prior+ as well and the OLA line covers OLA2 as well.
Fig. 5. Average results of the top-3 systems per year.
98
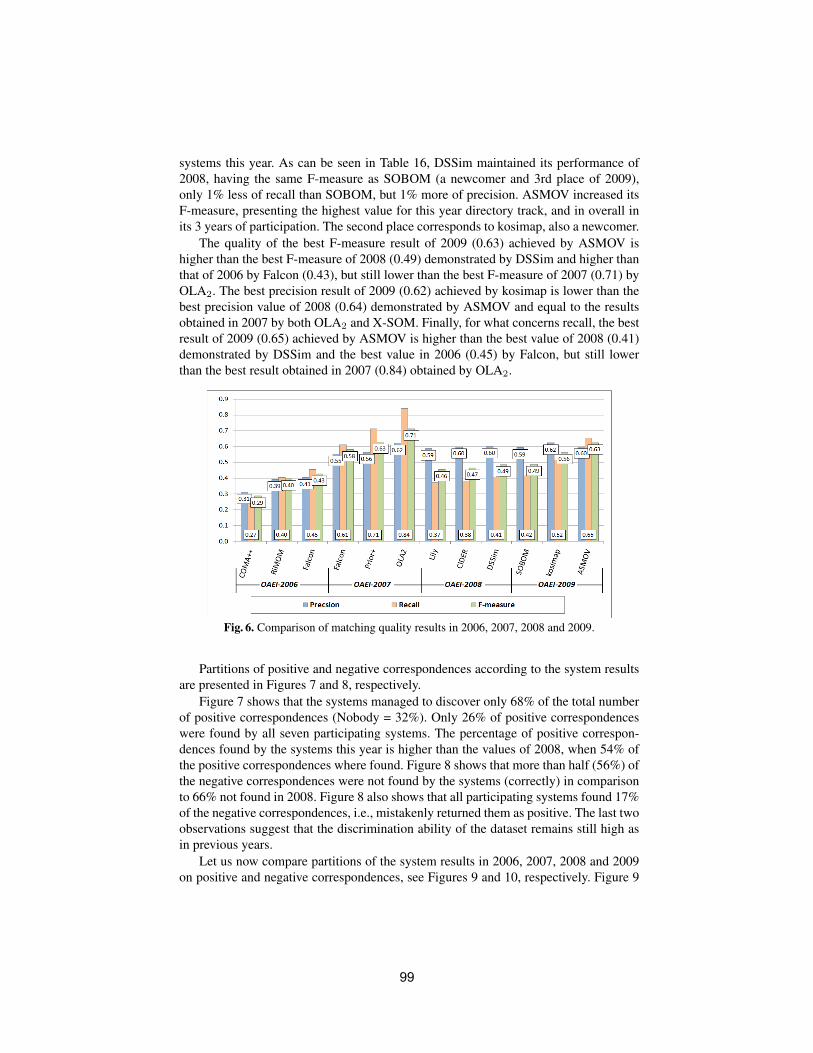
systems this year. As can be seen in Table 16, DSSim maintained its performance of2008, having the same F-measure as SOBOM (a newcomer and 3rd place of 2009),only 1% less of recall than SOBOM, but 1% more of precision. ASMOV increased itsF-measure, presenting the highest value for this year directory track, and in overall inits 3 years of participation. The second place corresponds to kosimap, also a newcomer.
The quality of the best F-measure result of 2009 (0.63) achieved by ASMOV ishigher than the best F-measure of 2008 (0.49) demonstrated by DSSim and higher thanthat of 2006 by Falcon (0.43), but still lower than the best F-measure of 2007 (0.71) byOLA2. The best precision result of 2009 (0.62) achieved by kosimap is lower than thebest precision value of 2008 (0.64) demonstrated by ASMOV and equal to the resultsobtained in 2007 by both OLA2 and X-SOM. Finally, for what concerns recall, the bestresult of 2009 (0.65) achieved by ASMOV is higher than the best value of 2008 (0.41)demonstrated by DSSim and the best value in 2006 (0.45) by Falcon, but still lowerthan the best result obtained in 2007 (0.84) obtained by OLA2.
Fig. 6. Comparison of matching quality results in 2006, 2007, 2008 and 2009.
Partitions of positive and negative correspondences according to the system resultsare presented in Figures 7 and 8, respectively.
Figure 7 shows that the systems managed to discover only 68% of the total numberof positive correspondences (Nobody = 32%). Only 26% of positive correspondenceswere found by all seven participating systems. The percentage of positive correspon-dences found by the systems this year is higher than the values of 2008, when 54% ofthe positive correspondences where found. Figure 8 shows that more than half (56%) ofthe negative correspondences were not found by the systems (correctly) in comparisonto 66% not found in 2008. Figure 8 also shows that all participating systems found 17%of the negative correspondences, i.e., mistakenly returned them as positive. The last twoobservations suggest that the discrimination ability of the dataset remains still high asin previous years.
Let us now compare partitions of the system results in 2006, 2007, 2008 and 2009on positive and negative correspondences, see Figures 9 and 10, respectively. Figure 9
99
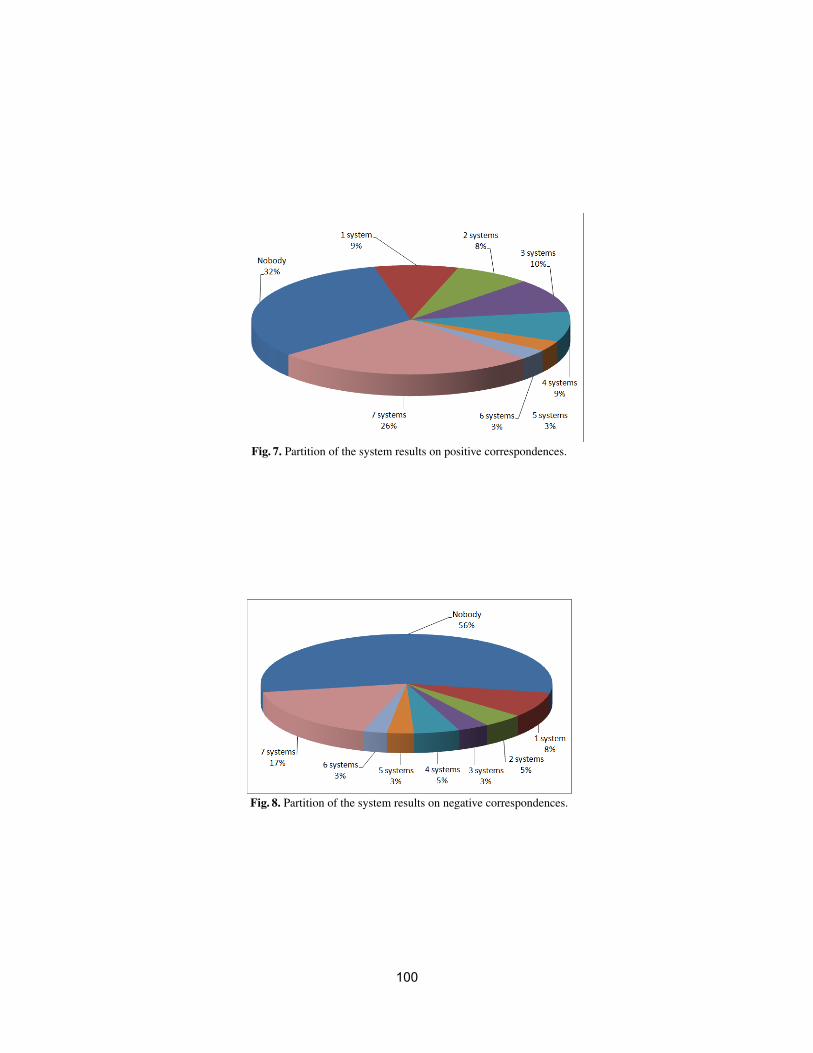
Fig. 7. Partition of the system results on positive correspondences.
Fig. 8. Partition of the system results on negative correspondences.
100
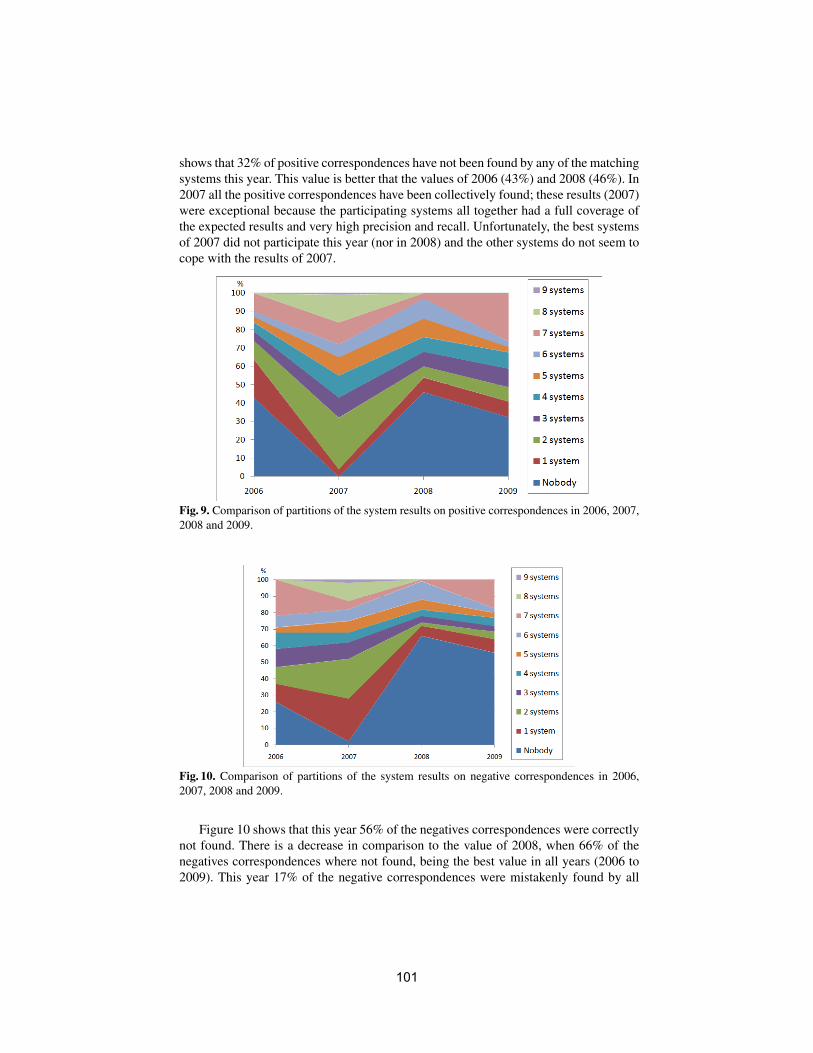
shows that 32% of positive correspondences have not been found by any of the matchingsystems this year. This value is better that the values of 2006 (43%) and 2008 (46%). In2007 all the positive correspondences have been collectively found; these results (2007)were exceptional because the participating systems all together had a full coverage ofthe expected results and very high precision and recall. Unfortunately, the best systemsof 2007 did not participate this year (nor in 2008) and the other systems do not seem tocope with the results of 2007.
Fig. 9. Comparison of partitions of the system results on positive correspondences in 2006, 2007,2008 and 2009.
Fig. 10. Comparison of partitions of the system results on negative correspondences in 2006,2007, 2008 and 2009.
Figure 10 shows that this year 56% of the negatives correspondences were correctlynot found. There is a decrease in comparison to the value of 2008, when 66% of thenegatives correspondences where not found, being the best value in all years (2006 to2009). This year 17% of the negative correspondences were mistakenly found by all
101
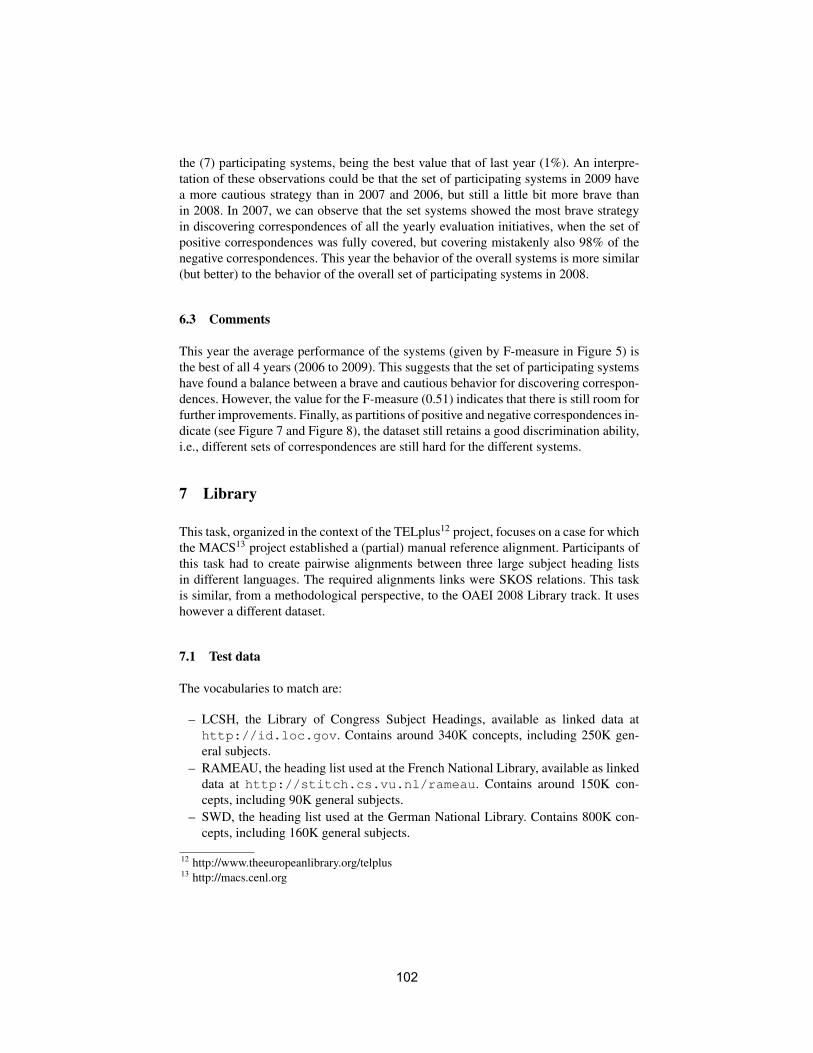
the (7) participating systems, being the best value that of last year (1%). An interpre-tation of these observations could be that the set of participating systems in 2009 havea more cautious strategy than in 2007 and 2006, but still a little bit more brave thanin 2008. In 2007, we can observe that the set systems showed the most brave strategyin discovering correspondences of all the yearly evaluation initiatives, when the set ofpositive correspondences was fully covered, but covering mistakenly also 98% of thenegative correspondences. This year the behavior of the overall systems is more similar(but better) to the behavior of the overall set of participating systems in 2008.
6.3 Comments
This year the average performance of the systems (given by F-measure in Figure 5) isthe best of all 4 years (2006 to 2009). This suggests that the set of participating systemshave found a balance between a brave and cautious behavior for discovering correspon-dences. However, the value for the F-measure (0.51) indicates that there is still room forfurther improvements. Finally, as partitions of positive and negative correspondences in-dicate (see Figure 7 and Figure 8), the dataset still retains a good discrimination ability,i.e., different sets of correspondences are still hard for the different systems.
7 Library
This task, organized in the context of the TELplus12 project, focuses on a case for whichthe MACS13 project established a (partial) manual reference alignment. Participants ofthis task had to create pairwise alignments between three large subject heading listsin different languages. The required alignments links were SKOS relations. This taskis similar, from a methodological perspective, to the OAEI 2008 Library track. It useshowever a different dataset.
7.1 Test data
The vocabularies to match are:
– LCSH, the Library of Congress Subject Headings, available as linked data athttp://id.loc.gov. Contains around 340K concepts, including 250K gen-eral subjects.
– RAMEAU, the heading list used at the French National Library, available as linkeddata at http://stitch.cs.vu.nl/rameau. Contains around 150K con-cepts, including 90K general subjects.
– SWD, the heading list used at the German National Library. Contains 800K con-cepts, including 160K general subjects.
12 http://www.theeuropeanlibrary.org/telplus13 http://macs.cenl.org
102
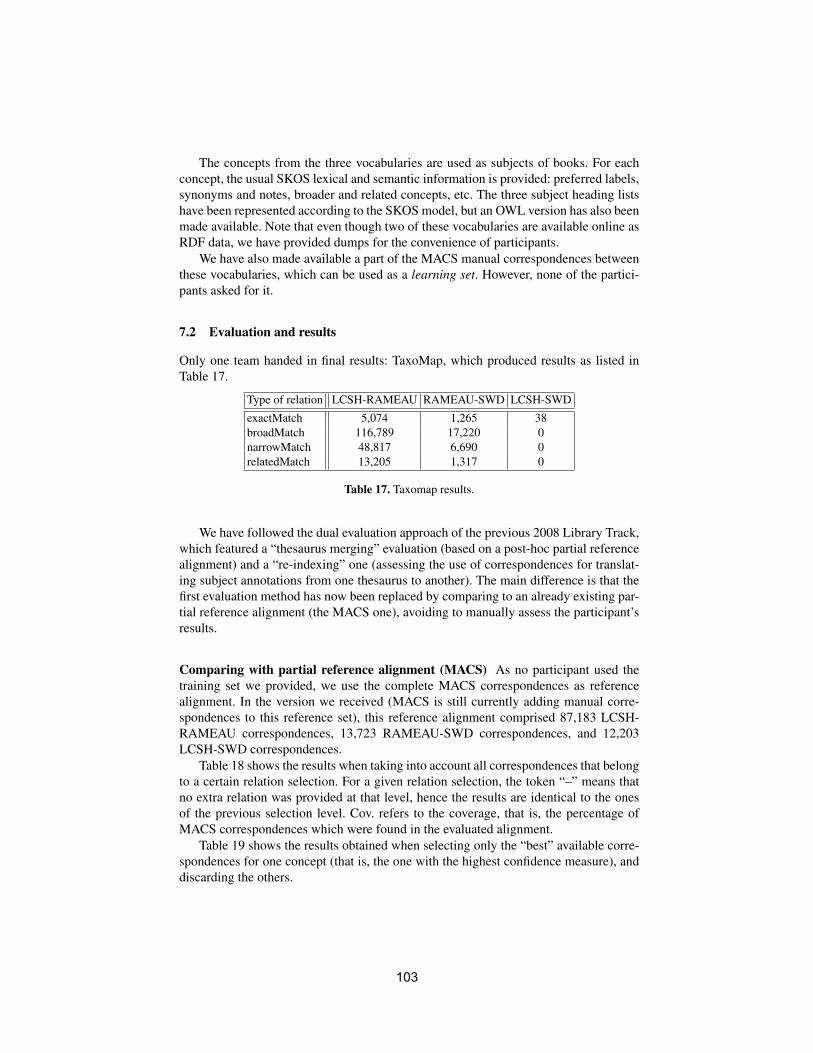
The concepts from the three vocabularies are used as subjects of books. For eachconcept, the usual SKOS lexical and semantic information is provided: preferred labels,synonyms and notes, broader and related concepts, etc. The three subject heading listshave been represented according to the SKOS model, but an OWL version has also beenmade available. Note that even though two of these vocabularies are available online asRDF data, we have provided dumps for the convenience of participants.
We have also made available a part of the MACS manual correspondences betweenthese vocabularies, which can be used as a learning set. However, none of the partici-pants asked for it.
7.2 Evaluation and results
Only one team handed in final results: TaxoMap, which produced results as listed inTable 17.
Type of relation LCSH-RAMEAU RAMEAU-SWD LCSH-SWD
exactMatch 5,074 1,265 38broadMatch 116,789 17,220 0narrowMatch 48,817 6,690 0relatedMatch 13,205 1,317 0
Table 17. Taxomap results.
We have followed the dual evaluation approach of the previous 2008 Library Track,which featured a “thesaurus merging” evaluation (based on a post-hoc partial referencealignment) and a “re-indexing” one (assessing the use of correspondences for translat-ing subject annotations from one thesaurus to another). The main difference is that thefirst evaluation method has now been replaced by comparing to an already existing par-tial reference alignment (the MACS one), avoiding to manually assess the participant’sresults.
Comparing with partial reference alignment (MACS) As no participant used thetraining set we provided, we use the complete MACS correspondences as referencealignment. In the version we received (MACS is still currently adding manual corre-spondences to this reference set), this reference alignment comprised 87,183 LCSH-RAMEAU correspondences, 13,723 RAMEAU-SWD correspondences, and 12,203LCSH-SWD correspondences.
Table 18 shows the results when taking into account all correspondences that belongto a certain relation selection. For a given relation selection, the token “–” means thatno extra relation was provided at that level, hence the results are identical to the onesof the previous selection level. Cov. refers to the coverage, that is, the percentage ofMACS correspondences which were found in the evaluated alignment.
Table 19 shows the results obtained when selecting only the “best” available corre-spondences for one concept (that is, the one with the highest confidence measure), anddiscarding the others.
103
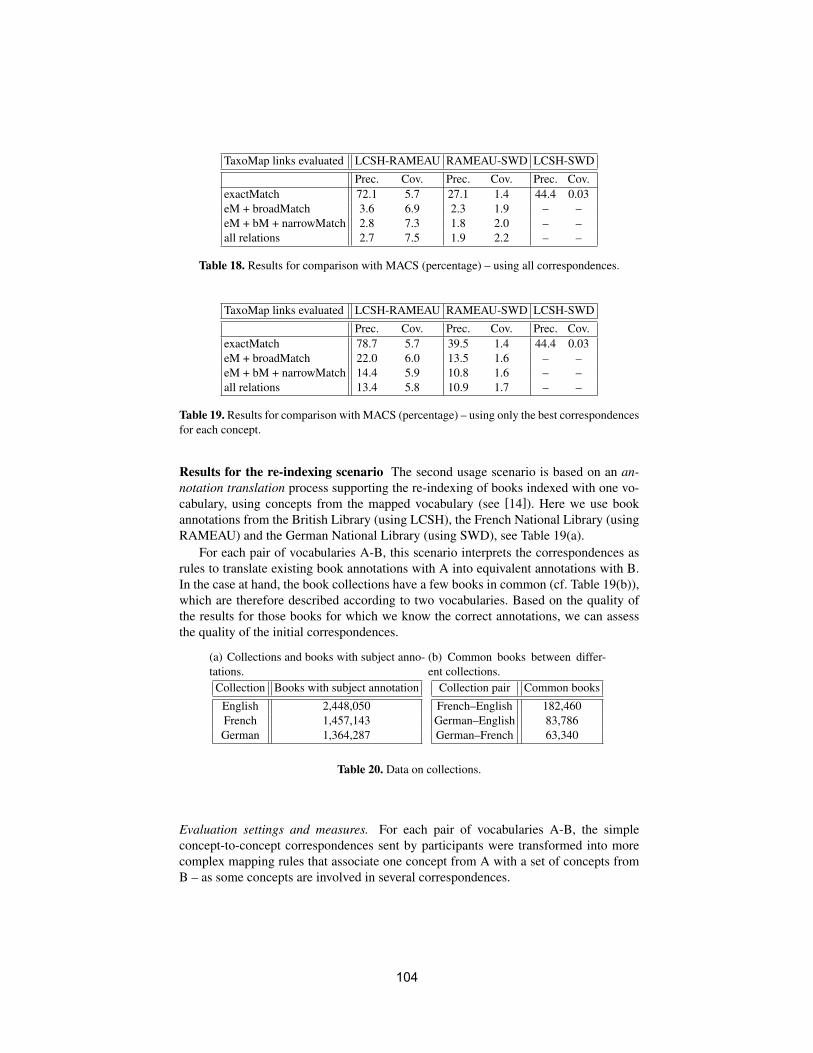
TaxoMap links evaluated LCSH-RAMEAU RAMEAU-SWD LCSH-SWD
Prec. Cov. Prec. Cov. Prec. Cov.exactMatch 72.1 5.7 27.1 1.4 44.4 0.03eM + broadMatch 3.6 6.9 2.3 1.9 – –eM + bM + narrowMatch 2.8 7.3 1.8 2.0 – –all relations 2.7 7.5 1.9 2.2 – –
Table 18. Results for comparison with MACS (percentage) – using all correspondences.
TaxoMap links evaluated LCSH-RAMEAU RAMEAU-SWD LCSH-SWD
Prec. Cov. Prec. Cov. Prec. Cov.exactMatch 78.7 5.7 39.5 1.4 44.4 0.03eM + broadMatch 22.0 6.0 13.5 1.6 – –eM + bM + narrowMatch 14.4 5.9 10.8 1.6 – –all relations 13.4 5.8 10.9 1.7 – –
Table 19. Results for comparison with MACS (percentage) – using only the best correspondencesfor each concept.
Results for the re-indexing scenario The second usage scenario is based on an an-notation translation process supporting the re-indexing of books indexed with one vo-cabulary, using concepts from the mapped vocabulary (see [14]). Here we use bookannotations from the British Library (using LCSH), the French National Library (usingRAMEAU) and the German National Library (using SWD), see Table 19(a).
For each pair of vocabularies A-B, this scenario interprets the correspondences asrules to translate existing book annotations with A into equivalent annotations with B.In the case at hand, the book collections have a few books in common (cf. Table 19(b)),which are therefore described according to two vocabularies. Based on the quality ofthe results for those books for which we know the correct annotations, we can assessthe quality of the initial correspondences.
(a) Collections and books with subject anno-tations.
Collection Books with subject annotation
English 2,448,050French 1,457,143German 1,364,287
(b) Common books between differ-ent collections.
Collection pair Common books
French–English 182,460German–English 83,786German–French 63,340
Table 20. Data on collections.
Evaluation settings and measures. For each pair of vocabularies A-B, the simpleconcept-to-concept correspondences sent by participants were transformed into morecomplex mapping rules that associate one concept from A with a set of concepts fromB – as some concepts are involved in several correspondences.
104
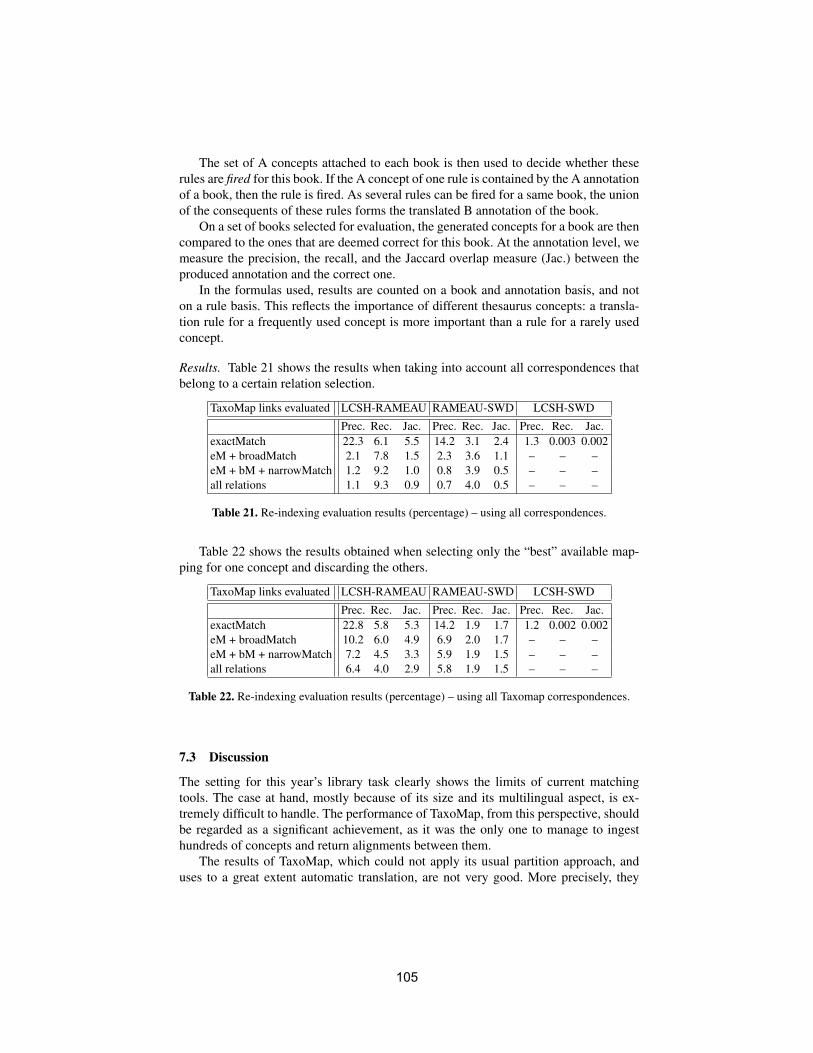
The set of A concepts attached to each book is then used to decide whether theserules are fired for this book. If the A concept of one rule is contained by the A annotationof a book, then the rule is fired. As several rules can be fired for a same book, the unionof the consequents of these rules forms the translated B annotation of the book.
On a set of books selected for evaluation, the generated concepts for a book are thencompared to the ones that are deemed correct for this book. At the annotation level, wemeasure the precision, the recall, and the Jaccard overlap measure (Jac.) between theproduced annotation and the correct one.
In the formulas used, results are counted on a book and annotation basis, and noton a rule basis. This reflects the importance of different thesaurus concepts: a transla-tion rule for a frequently used concept is more important than a rule for a rarely usedconcept.
Results. Table 21 shows the results when taking into account all correspondences thatbelong to a certain relation selection.
TaxoMap links evaluated LCSH-RAMEAU RAMEAU-SWD LCSH-SWD
Prec. Rec. Jac. Prec. Rec. Jac. Prec. Rec. Jac.exactMatch 22.3 6.1 5.5 14.2 3.1 2.4 1.3 0.003 0.002eM + broadMatch 2.1 7.8 1.5 2.3 3.6 1.1 – – –eM + bM + narrowMatch 1.2 9.2 1.0 0.8 3.9 0.5 – – –all relations 1.1 9.3 0.9 0.7 4.0 0.5 – – –
Table 21. Re-indexing evaluation results (percentage) – using all correspondences.
Table 22 shows the results obtained when selecting only the “best” available map-ping for one concept and discarding the others.
TaxoMap links evaluated LCSH-RAMEAU RAMEAU-SWD LCSH-SWD
Prec. Rec. Jac. Prec. Rec. Jac. Prec. Rec. Jac.exactMatch 22.8 5.8 5.3 14.2 1.9 1.7 1.2 0.002 0.002eM + broadMatch 10.2 6.0 4.9 6.9 2.0 1.7 – – –eM + bM + narrowMatch 7.2 4.5 3.3 5.9 1.9 1.5 – – –all relations 6.4 4.0 2.9 5.8 1.9 1.5 – – –
Table 22. Re-indexing evaluation results (percentage) – using all Taxomap correspondences.
7.3 Discussion
The setting for this year’s library task clearly shows the limits of current matchingtools. The case at hand, mostly because of its size and its multilingual aspect, is ex-tremely difficult to handle. The performance of TaxoMap, from this perspective, shouldbe regarded as a significant achievement, as it was the only one to manage to ingesthundreds of concepts and return alignments between them.
The results of TaxoMap, which could not apply its usual partition approach, anduses to a great extent automatic translation, are not very good. More precisely, they
105
are especially weak when relations other than strict equivalence are considered, high-lighting the value of being able to sort mapping results using the type of relationor the strength of the confidence measure granted to correspondences–options whichare both offered by TaxoMap. Both precision and coverage/recall are low for thenon-equivalence correspondences, even though they bring a huge number of potentialmatches. The translation could give better results for the equivalent correspondences, atthe cost of coverage of course.
It is worth mentioning that as last year, the results for the comparison with a ref-erence mapping and the re-indexing evaluation largely differ, showing that correspon-dences have a different relevance depending on the application scenario. correspon-dences based on translation will perform obviously better for scenarios where the in-tension of concepts matters, rather than for cases where their actual usage in book col-lections should be carefully taken into account.
8 Oriented alignment
This year we introduced evaluation of alignments containing other relations that theclassical equivalence between entities, e.g., subsumption relations.
8.1 Test data
The first dataset (dataset 1) has been derived from the benchmark series of the OAEI2006 campaign [9] and was created for the evaluation of the "Classification-BasedLearning of Subsumption Relations" (CSR) method. As a configuration of CSR exploitsthe properties of concepts (for the cases where properties are used as features), we donot include the OAEI 2006 ontologies whose concepts have no properties. Furthermore,we have excluded from the dataset the OAEI ontologies with no defined subsumptionrelations among their concepts. This is done because CSR exploits the subsumptionrelations in the input ontologies to generate training examples. More specifically, allbenchmarks (101-304) except 301 to 304, define the second ontology of each pair as analteration of the same ontology, i.e., the first one, numbered 101.
The second dataset (dataset 2) is composed of 45 pairs of real-world ontologiescoming from the Consensus Workshop track of the OAEI 2006 campaign (all pairwaisecombinations). The domain of the ontologies concerns the organization of conferencesand they have been developed within the OntoFarm project7.
The reference alignment for all datasets has been manually created by knowledgeengineers. The major guidelines that were followed for the location of subsumptionrelations are as follows: (a) use existing equivalences in order to find inferred subsump-tions, and (b) understand the "intended meaning" of the concepts, e.g., by inspectingspecifications and relevant information attached to them. The format of the referencealignment is the Alignment format as used in the benchmark series.
106
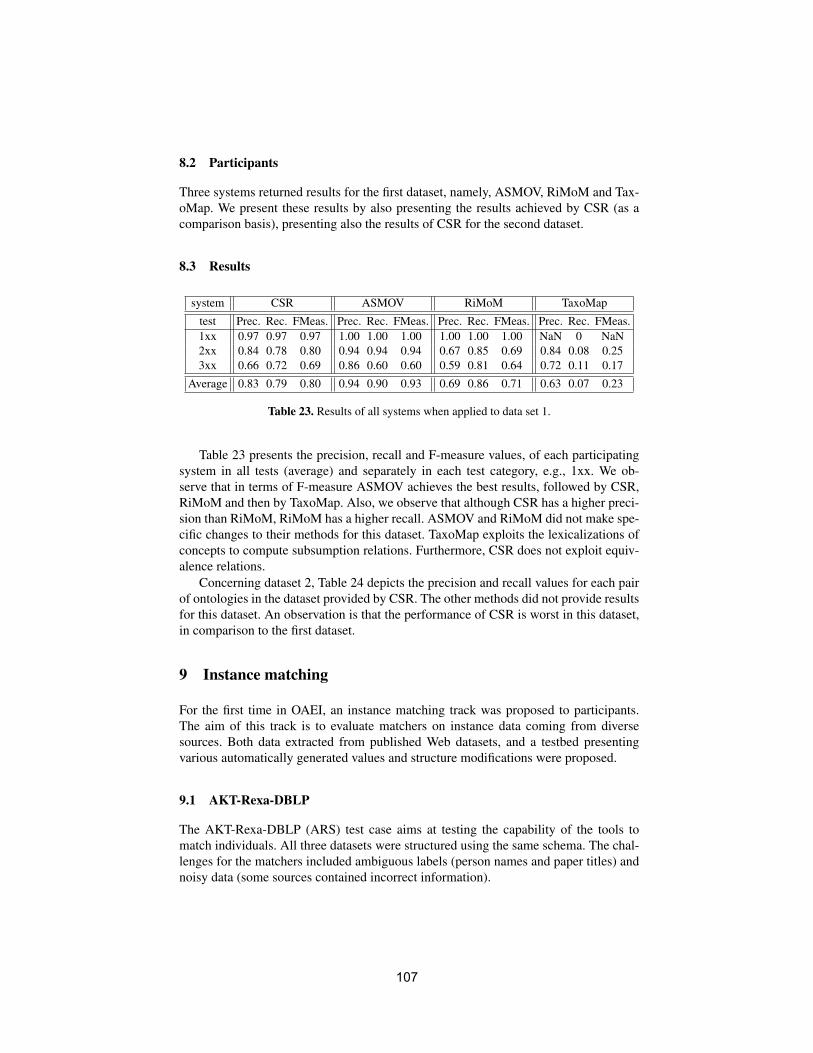
8.2 Participants
Three systems returned results for the first dataset, namely, ASMOV, RiMoM and Tax-oMap. We present these results by also presenting the results achieved by CSR (as acomparison basis), presenting also the results of CSR for the second dataset.
8.3 Results
system CSR ASMOV RiMoM TaxoMap
test Prec. Rec. FMeas. Prec. Rec. FMeas. Prec. Rec. FMeas. Prec. Rec. FMeas.1xx 0.97 0.97 0.97 1.00 1.00 1.00 1.00 1.00 1.00 NaN 0 NaN2xx 0.84 0.78 0.80 0.94 0.94 0.94 0.67 0.85 0.69 0.84 0.08 0.253xx 0.66 0.72 0.69 0.86 0.60 0.60 0.59 0.81 0.64 0.72 0.11 0.17
Average 0.83 0.79 0.80 0.94 0.90 0.93 0.69 0.86 0.71 0.63 0.07 0.23
Table 23. Results of all systems when applied to data set 1.
Table 23 presents the precision, recall and F-measure values, of each participatingsystem in all tests (average) and separately in each test category, e.g., 1xx. We ob-serve that in terms of F-measure ASMOV achieves the best results, followed by CSR,RiMoM and then by TaxoMap. Also, we observe that although CSR has a higher preci-sion than RiMoM, RiMoM has a higher recall. ASMOV and RiMoM did not make spe-cific changes to their methods for this dataset. TaxoMap exploits the lexicalizations ofconcepts to compute subsumption relations. Furthermore, CSR does not exploit equiv-alence relations.
Concerning dataset 2, Table 24 depicts the precision and recall values for each pairof ontologies in the dataset provided by CSR. The other methods did not provide resultsfor this dataset. An observation is that the performance of CSR is worst in this dataset,in comparison to the first dataset.
9 Instance matching
For the first time in OAEI, an instance matching track was proposed to participants.The aim of this track is to evaluate matchers on instance data coming from diversesources. Both data extracted from published Web datasets, and a testbed presentingvarious automatically generated values and structure modifications were proposed.
9.1 AKT-Rexa-DBLP
The AKT-Rexa-DBLP (ARS) test case aims at testing the capability of the tools tomatch individuals. All three datasets were structured using the same schema. The chal-lenges for the matchers included ambiguous labels (person names and paper titles) andnoisy data (some sources contained incorrect information).
107

Ontology pair Prec. Rec. Ontology pair Prec. Rec.
Iasted-Cmt 0.6 0.7 Confious-Sigkdd 0.26 0.51Cmt-confOf 0.76 0.83 crs_dr-Sigkdd 0.09 0.13Cmt-Confious 0.28 0.31 Iasted-Sigkdd 0.17 0.88confOf-Confious 0.14 0.47 OpenConf-Sigkdd 0.22 0.39crs_dr-Confious 0.08 0.11 Pcs-Sigkdd 0.18 0.48Iasted-Confious 0.08 0.25 Cmt-Conference 0.25 0.11OpenConf-Confious 0.22 0.45 confOf-Conference 0.43 0.29Pcs-Confious 0.16 0.43 Confious-Conference 0.15 0.43Cmt-crs_dr 0.54 0.39 crs_dr-Conference 0.58 0.11confOf-crs_dr 0.38 0.38 Iasted-Conference 0.2 0.08confOf-Iasted 0.47 0.38 OpenConf-Conference 0.14 0.15crs_dr-Iasted 0.18 0.38 Pcs-Conference 0.05 0.05OpenConf-Iasted 0.15 0.38 Sigkdd-Conference 0.15 0.19Pcs-Iasted 0.21 0.39 Cmt-ekaw 0.46 0.72Cmt-OpenConf 0.32 0.41 confOf-ekaw 0.51 0.74confOf-OpenConf 0.22 0.39 Confious-ekaw 0.22 0.59crs_dr-OpenConf 0.15 0.32 crs_dr-ekaw 0.21 0.2Cmt-Pcs 0.47 0.77 Iasted-ekaw 0.32 0.33confOf-Pcs 0.24 0.47 OpenConf-ekaw 0.28 0.28crs_dr-Pcs 0.17 0.69 Pcs-ekaw 0.36 0.67OpenConf-Pcs 0.1 0.26 Sigkdd-ekaw 0.64 0.78Cmt-Sigkdd 0.54 0.81 Conference-ekaw 0.58 0.65confOf-Sigkdd 0.29 0.64
Average 0.29 0.43
Table 24. Results of CSR when applied to dataset 2.
Test set The test case included three datasets from the domain of scientific publications:
– AKT EPrints archive14. This dataset contains information about papers producedwithin the AKT research project.
– Rexa dataset15. This dataset was extracted from the Rexa search server, which wasconstructed at the University of Massachusetts using automatic information extrac-tion algorithms.
– SWETO DBLP dataset16. This is a publicly available dataset listing publicationsfrom the computer science domain.
The SWETO-DBLP dataset was originally represented in RDF. Two other datasets(AKT EPrints and Rexa) were extracted from the HTML sources using specially con-structed wrappers and structured according to the SWETO-DBLP ontology17. The on-tology describes information about scientific publications and their authors and extendsthe commonly used FOAF ontology18. Authors are represented as individuals of the14 http://eprints.aktors.org/15 http://www.rexa.info/16 http://lsdis.cs.uga.edu/projects/semdis/swetodblp/17 http://lsdis.cs.uga.edu/projects/semdis/swetodblp/august2007/opus_august2007.rdf18 http://xmlns.com/foaf/spec/
108
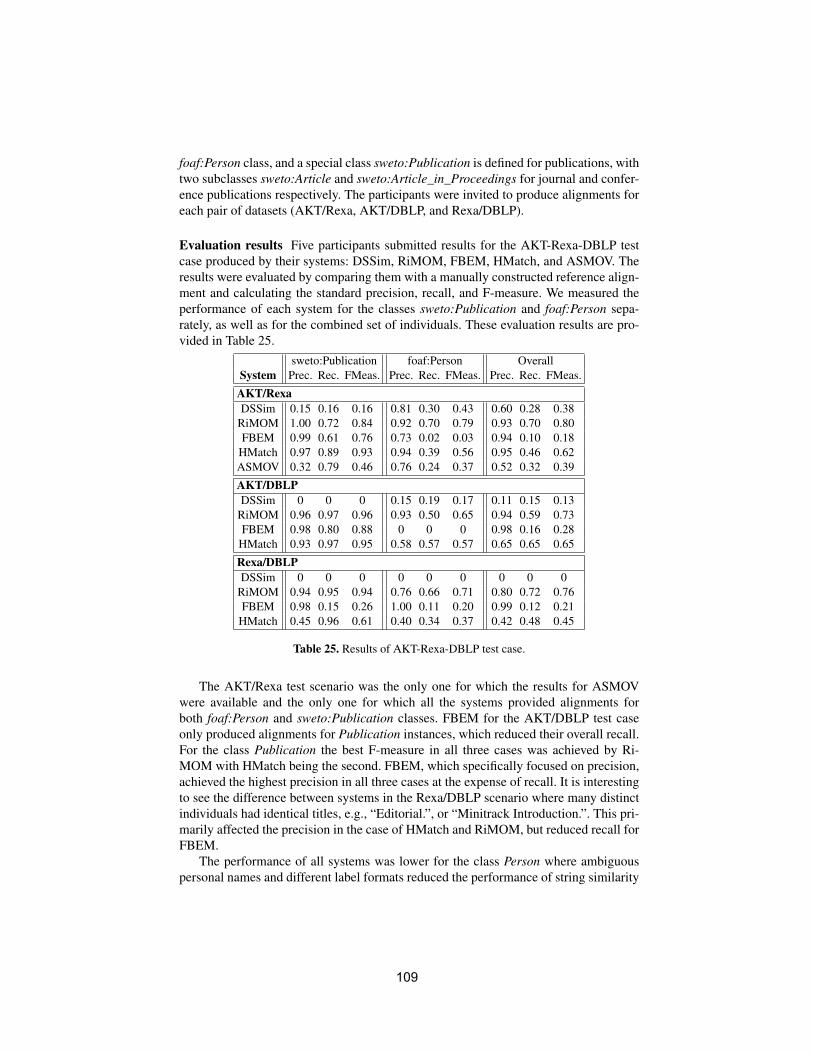
foaf:Person class, and a special class sweto:Publication is defined for publications, withtwo subclasses sweto:Article and sweto:Article_in_Proceedings for journal and confer-ence publications respectively. The participants were invited to produce alignments foreach pair of datasets (AKT/Rexa, AKT/DBLP, and Rexa/DBLP).
Evaluation results Five participants submitted results for the AKT-Rexa-DBLP testcase produced by their systems: DSSim, RiMOM, FBEM, HMatch, and ASMOV. Theresults were evaluated by comparing them with a manually constructed reference align-ment and calculating the standard precision, recall, and F-measure. We measured theperformance of each system for the classes sweto:Publication and foaf:Person sepa-rately, as well as for the combined set of individuals. These evaluation results are pro-vided in Table 25.
sweto:Publication foaf:Person OverallSystem Prec. Rec. FMeas. Prec. Rec. FMeas. Prec. Rec. FMeas.
AKT/RexaDSSim 0.15 0.16 0.16 0.81 0.30 0.43 0.60 0.28 0.38
RiMOM 1.00 0.72 0.84 0.92 0.70 0.79 0.93 0.70 0.80FBEM 0.99 0.61 0.76 0.73 0.02 0.03 0.94 0.10 0.18
HMatch 0.97 0.89 0.93 0.94 0.39 0.56 0.95 0.46 0.62ASMOV 0.32 0.79 0.46 0.76 0.24 0.37 0.52 0.32 0.39
AKT/DBLPDSSim 0 0 0 0.15 0.19 0.17 0.11 0.15 0.13
RiMOM 0.96 0.97 0.96 0.93 0.50 0.65 0.94 0.59 0.73FBEM 0.98 0.80 0.88 0 0 0 0.98 0.16 0.28
HMatch 0.93 0.97 0.95 0.58 0.57 0.57 0.65 0.65 0.65
Rexa/DBLPDSSim 0 0 0 0 0 0 0 0 0
RiMOM 0.94 0.95 0.94 0.76 0.66 0.71 0.80 0.72 0.76FBEM 0.98 0.15 0.26 1.00 0.11 0.20 0.99 0.12 0.21
HMatch 0.45 0.96 0.61 0.40 0.34 0.37 0.42 0.48 0.45
Table 25. Results of AKT-Rexa-DBLP test case.
The AKT/Rexa test scenario was the only one for which the results for ASMOVwere available and the only one for which all the systems provided alignments forboth foaf:Person and sweto:Publication classes. FBEM for the AKT/DBLP test caseonly produced alignments for Publication instances, which reduced their overall recall.For the class Publication the best F-measure in all three cases was achieved by Ri-MOM with HMatch being the second. FBEM, which specifically focused on precision,achieved the highest precision in all three cases at the expense of recall. It is interestingto see the difference between systems in the Rexa/DBLP scenario where many distinctindividuals had identical titles, e.g., “Editorial.”, or “Minitrack Introduction.”. This pri-marily affected the precision in the case of HMatch and RiMOM, but reduced recall forFBEM.
The performance of all systems was lower for the class Person where ambiguouspersonal names and different label formats reduced the performance of string similarity
109
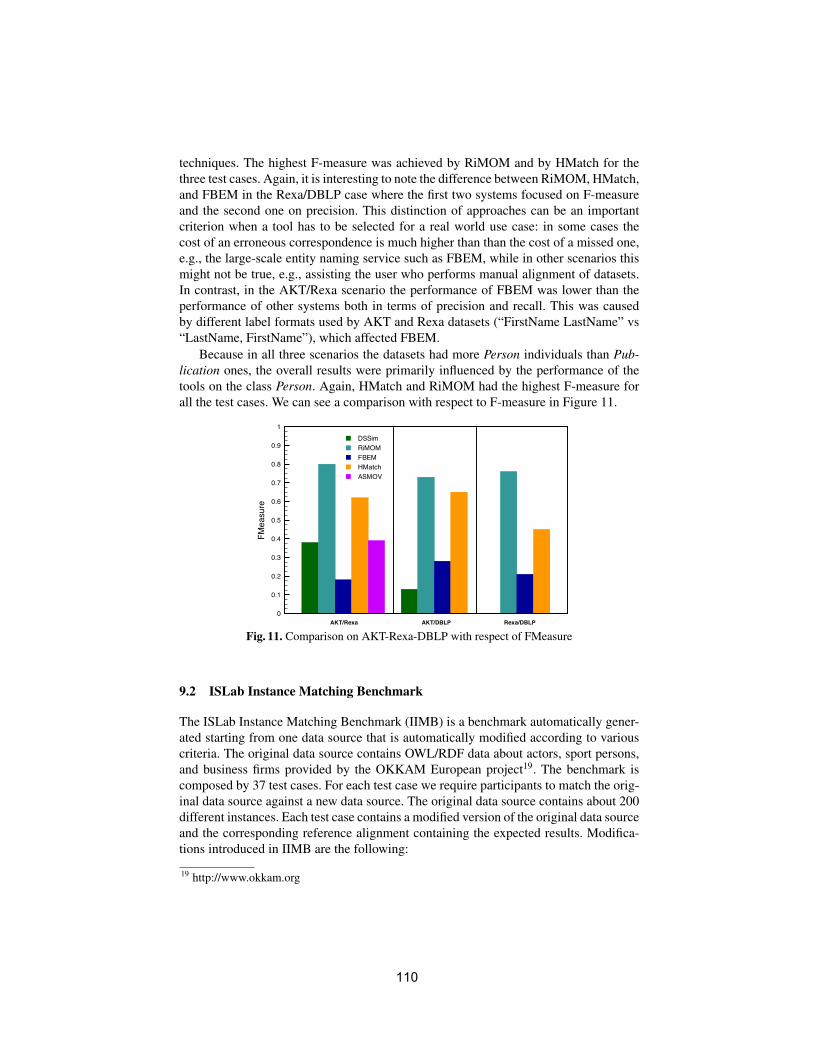
techniques. The highest F-measure was achieved by RiMOM and by HMatch for thethree test cases. Again, it is interesting to note the difference between RiMOM, HMatch,and FBEM in the Rexa/DBLP case where the first two systems focused on F-measureand the second one on precision. This distinction of approaches can be an importantcriterion when a tool has to be selected for a real world use case: in some cases thecost of an erroneous correspondence is much higher than than the cost of a missed one,e.g., the large-scale entity naming service such as FBEM, while in other scenarios thismight not be true, e.g., assisting the user who performs manual alignment of datasets.In contrast, in the AKT/Rexa scenario the performance of FBEM was lower than theperformance of other systems both in terms of precision and recall. This was causedby different label formats used by AKT and Rexa datasets (“FirstName LastName” vs“LastName, FirstName”), which affected FBEM.
Because in all three scenarios the datasets had more Person individuals than Pub-lication ones, the overall results were primarily influenced by the performance of thetools on the class Person. Again, HMatch and RiMOM had the highest F-measure forall the test cases. We can see a comparison with respect to F-measure in Figure 11.
0
0.1
0.2
0.3
0.4
0.5
0.6
0.7
0.8
0.9
1
FMeasure
DSSimRiMOMFBEMHMatchASMOV
AKT/DBLP Rexa/DBLPAKT/Rexa
Fig. 11. Comparison on AKT-Rexa-DBLP with respect of FMeasure
9.2 ISLab Instance Matching Benchmark
The ISLab Instance Matching Benchmark (IIMB) is a benchmark automatically gener-ated starting from one data source that is automatically modified according to variouscriteria. The original data source contains OWL/RDF data about actors, sport persons,and business firms provided by the OKKAM European project19. The benchmark iscomposed by 37 test cases. For each test case we require participants to match the orig-inal data source against a new data source. The original data source contains about 200different instances. Each test case contains a modified version of the original data sourceand the corresponding reference alignment containing the expected results. Modifica-tions introduced in IIMB are the following:
19 http://www.okkam.org
110
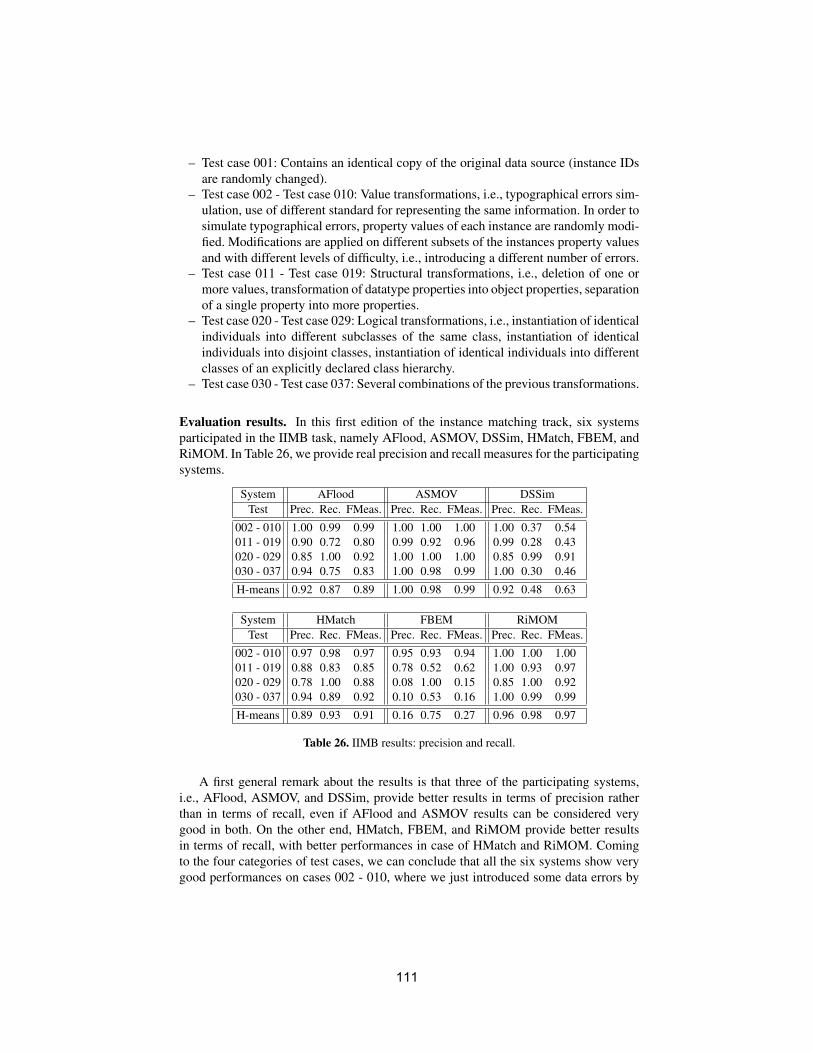
– Test case 001: Contains an identical copy of the original data source (instance IDsare randomly changed).
– Test case 002 - Test case 010: Value transformations, i.e., typographical errors sim-ulation, use of different standard for representing the same information. In order tosimulate typographical errors, property values of each instance are randomly modi-fied. Modifications are applied on different subsets of the instances property valuesand with different levels of difficulty, i.e., introducing a different number of errors.
– Test case 011 - Test case 019: Structural transformations, i.e., deletion of one ormore values, transformation of datatype properties into object properties, separationof a single property into more properties.
– Test case 020 - Test case 029: Logical transformations, i.e., instantiation of identicalindividuals into different subclasses of the same class, instantiation of identicalindividuals into disjoint classes, instantiation of identical individuals into differentclasses of an explicitly declared class hierarchy.
– Test case 030 - Test case 037: Several combinations of the previous transformations.
Evaluation results. In this first edition of the instance matching track, six systemsparticipated in the IIMB task, namely AFlood, ASMOV, DSSim, HMatch, FBEM, andRiMOM. In Table 26, we provide real precision and recall measures for the participatingsystems.
System AFlood ASMOV DSSimTest Prec. Rec. FMeas. Prec. Rec. FMeas. Prec. Rec. FMeas.
002 - 010 1.00 0.99 0.99 1.00 1.00 1.00 1.00 0.37 0.54011 - 019 0.90 0.72 0.80 0.99 0.92 0.96 0.99 0.28 0.43020 - 029 0.85 1.00 0.92 1.00 1.00 1.00 0.85 0.99 0.91030 - 037 0.94 0.75 0.83 1.00 0.98 0.99 1.00 0.30 0.46
H-means 0.92 0.87 0.89 1.00 0.98 0.99 0.92 0.48 0.63
System HMatch FBEM RiMOMTest Prec. Rec. FMeas. Prec. Rec. FMeas. Prec. Rec. FMeas.
002 - 010 0.97 0.98 0.97 0.95 0.93 0.94 1.00 1.00 1.00011 - 019 0.88 0.83 0.85 0.78 0.52 0.62 1.00 0.93 0.97020 - 029 0.78 1.00 0.88 0.08 1.00 0.15 0.85 1.00 0.92030 - 037 0.94 0.89 0.92 0.10 0.53 0.16 1.00 0.99 0.99
H-means 0.89 0.93 0.91 0.16 0.75 0.27 0.96 0.98 0.97
Table 26. IIMB results: precision and recall.
A first general remark about the results is that three of the participating systems,i.e., AFlood, ASMOV, and DSSim, provide better results in terms of precision ratherthan in terms of recall, even if AFlood and ASMOV results can be considered verygood in both. On the other end, HMatch, FBEM, and RiMOM provide better resultsin terms of recall, with better performances in case of HMatch and RiMOM. Comingto the four categories of test cases, we can conclude that all the six systems show verygood performances on cases 002 - 010, where we just introduced some data errors by
111
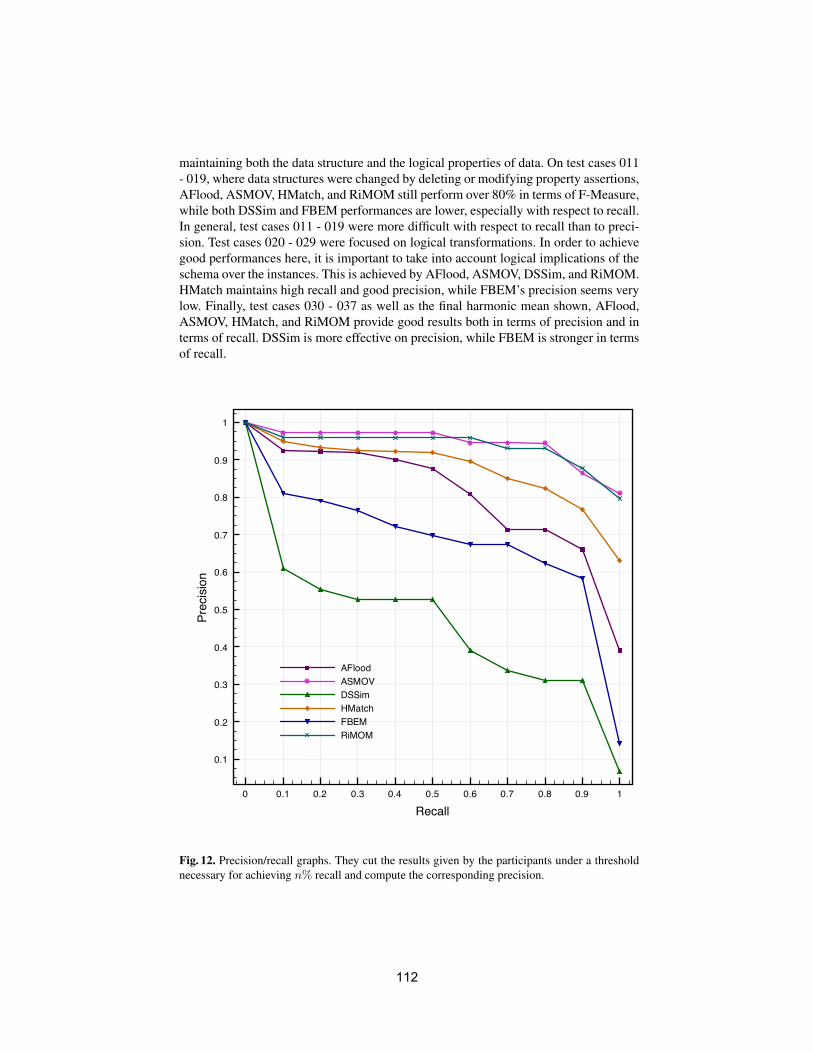
maintaining both the data structure and the logical properties of data. On test cases 011- 019, where data structures were changed by deleting or modifying property assertions,AFlood, ASMOV, HMatch, and RiMOM still perform over 80% in terms of F-Measure,while both DSSim and FBEM performances are lower, especially with respect to recall.In general, test cases 011 - 019 were more difficult with respect to recall than to preci-sion. Test cases 020 - 029 were focused on logical transformations. In order to achievegood performances here, it is important to take into account logical implications of theschema over the instances. This is achieved by AFlood, ASMOV, DSSim, and RiMOM.HMatch maintains high recall and good precision, while FBEM’s precision seems verylow. Finally, test cases 030 - 037 as well as the final harmonic mean shown, AFlood,ASMOV, HMatch, and RiMOM provide good results both in terms of precision and interms of recall. DSSim is more effective on precision, while FBEM is stronger in termsof recall.
0 0.1 0.2 0.3 0.4 0.5 0.6 0.7 0.8 0.9 1
Recall
0.1
0.2
0.3
0.4
0.5
0.6
0.7
0.8
0.9
1
Precision
AFloodASMOVDSSimHMatchFBEMRiMOM
Fig. 12. Precision/recall graphs. They cut the results given by the participants under a thresholdnecessary for achieving n% recall and compute the corresponding precision.
112
All the six systems provided their results with confidence measures. It is thus possi-ble to draw precision/recall graphs in order to compare them (see Figure 12). The graphis computed by averaging the graphs of each of the tests. The precision/recall graphconfirms the comparison done over real precision and recall values, especially in caseof recall values lower than 50%. After that threshold, ASMOV, RiMOM, and HMatchmaintain their performances high, and FBEM performances are stable. Instead, DSSimand AFlood values of precision decrease quite quickly, even if AFlood performancesare still better than FBEM and DSSim.
10 Very Large Crosslingual Resources
The goal of the Very Large Crosslingual Resources challenge is twofold. First, we areinterested in matching vocabularies in different languages. Many collections throughoutEurope are indexed with vocabularies in languages other than English. These collectionswould benefit from an alignment to resources in other languages to broaden the usergroup, and possibly enable integrated access to the different collections. Second, weintend to present a realistic use case in the sense that the resources are large, rich insemantics but weak in formal structure, i.e. realistic on the Web. For collections indexedwith an in-house vocabulary, the link to a widely-used and rich resource can enhancethe structure and increase the scope of the in-house thesaurus. In this task, we aim forskos:exactMatch and skos:closeMatch relations.
10.1 Test data
Three resources are used in this task:
WordNet WordNet is a lexical database of the English language developed at PrincetonUniversity20. Its main building blocks are synsets: groups of words with a synony-mous meaning. In this task, the goal is to match noun-synsets. WordNet contains 7types of relations between noun-synsets, but the main hierarchy in WordNet is builton hyponym relations, which are similar to subclass relations. W3C has translatedWordNet version 2.0 into RDF/OWL.The original WordNet model is a rich and well-designed model. However, sometools may have problems with the fact that the synsets are instances rather thanclasses. Therefore, for the purpose of this OAEI task, we have translated the hy-ponym hierarchy in a skos:broader hierarchy, making the synsets skos:Concepts.
DBpedia DBpedia contains 2.18 million resources or “things”, each tied to an article inthe English language Wikipedia. The “things” are described by titles and abstractsin English and often also in Dutch. DBpedia “things” have numerous properties,such as categories, properties derived from the wikipedia “infoboxes”, links be-tween pages within and outside wikipedia, etc.
GTAA The GTAA is a Dutch thesaurus used by the Netherlands Institute for Soundand Vision to index their collection of TV programs. It is a facetted thesaurus, ofwhich we use the following four facets: (1) Subject: the topic of a TV program,
20 http://wordnet.princeton.edu/
113
≈3800 terms; (2) People: the main people mentioned in a TV program, ≈97.000terms; Names: the main “Named Entities” mentioned in a TV program (Corpo-ration names, music bands, etc.), ≈27.000 terms; Location: the main locationsmentioned in a TV program or the place where it has been created, ≈14.000 terms.
The purpose of this task is to match GTAA concepts to DBpedia “things” and WordNetsynsets.
10.2 Evaluation setup
We evaluate the results of the two alignments (GTAA-WordNet, GTAA-DBpedia) interms of precision and recall. Aside from an overall measure, we also present measuresfor each GTAA facet separately. We introduce an evaluation on a 3-point scale of 0 -0.5 - 1. We assign 1 point when the relation between two concepts is correctly identifiedas a skos:exactMatch or a skos:closeMatch. We assign 0.5 points if the proposed relationis skos:exactMatch while we consider the relation to be skos:closeMatch, or vice versa.Correspondences between concepts that are not related get 0 points. The scores are usedto generate generalized precision and recall figures.
Precision For each participant, we take samples of between 71 and 97 correspondencesper GTAA facet for both the GTAA-DBpedia and the GTAA-WordNet alignments andevaluate their correctness in terms of exact match, close match, or no match.
Recall Due to time constraints, we only determined recall of the GTAA Subject facet.We use a small reference alignment from a random sample of 100 GTAA concepts,which we manually mapped to WordNet and DBpedia for the VLCR evaluation of2008. The result of the GTAA-WordNet and GTAA-DBpedia alignments are comparedto the reference alignments.
Inter-rater agreement A team of 4 raters rated random samples of DSSim’s corre-spondences. A team of 3 raters rated the GG2WW correspondences, where each align-ment was divided over two raters. One rater was a member of both teams.
In order to check the inter-rater agreement, 100 correspondences were rated by tworaters. The agreement was high with a Cohen’s kappa of 0.87. In addition, we comparedthis year’s evaluation samples with those of 2008. 120 correspondences appeared inboth sets, and again the agreement between the scores was high; Cohen’s kappa was0.92.
10.3 Results
Two teams participated to the OAEI VLCR task: DSSim and GG2WW. Table 27 showsthe number of concepts in each resource and the number of correspondences returnedfor each resource pair. Both participants produced only exact matches. After consultingthe participants, we have considered using the confidence measures as an indication of
114
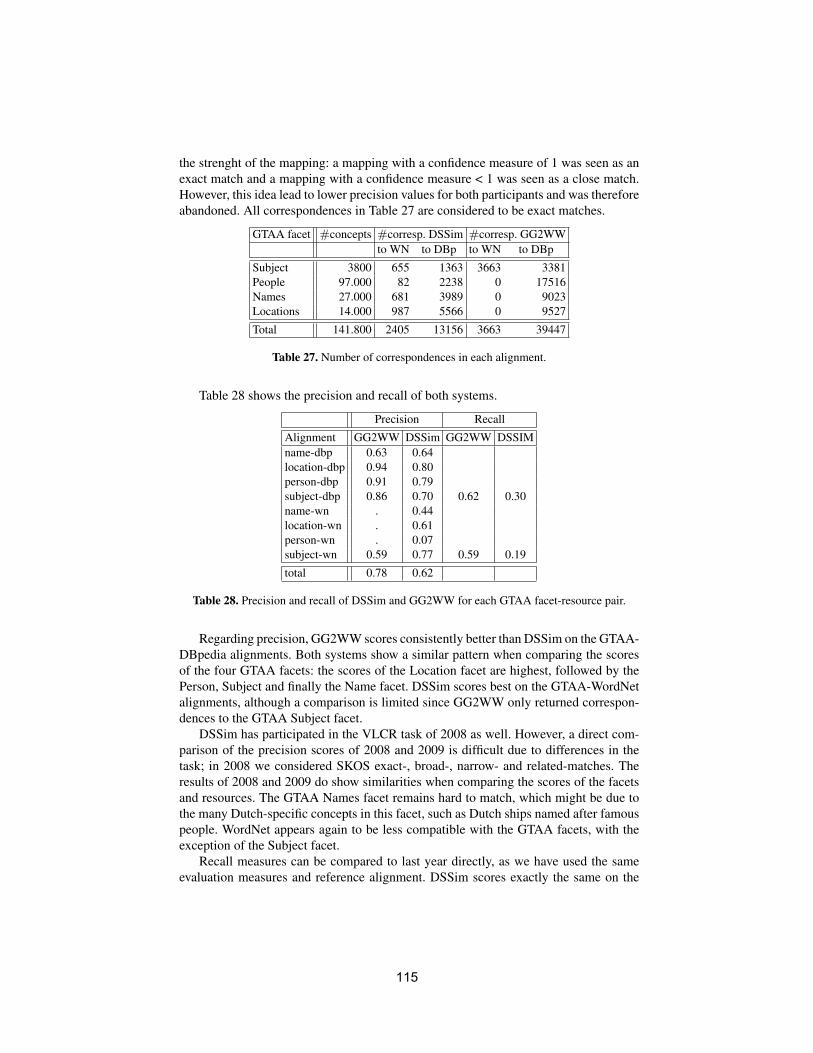
the strenght of the mapping: a mapping with a confidence measure of 1 was seen as anexact match and a mapping with a confidence measure < 1 was seen as a close match.However, this idea lead to lower precision values for both participants and was thereforeabandoned. All correspondences in Table 27 are considered to be exact matches.
GTAA facet #concepts #corresp. DSSim #corresp. GG2WWto WN to DBp to WN to DBp
Subject 3800 655 1363 3663 3381People 97.000 82 2238 0 17516Names 27.000 681 3989 0 9023Locations 14.000 987 5566 0 9527
Total 141.800 2405 13156 3663 39447
Table 27. Number of correspondences in each alignment.
Table 28 shows the precision and recall of both systems.
Precision Recall
Alignment GG2WW DSSim GG2WW DSSIMname-dbp 0.63 0.64location-dbp 0.94 0.80person-dbp 0.91 0.79subject-dbp 0.86 0.70 0.62 0.30name-wn . 0.44location-wn . 0.61person-wn . 0.07subject-wn 0.59 0.77 0.59 0.19
total 0.78 0.62
Table 28. Precision and recall of DSSim and GG2WW for each GTAA facet-resource pair.
Regarding precision, GG2WW scores consistently better than DSSim on the GTAA-DBpedia alignments. Both systems show a similar pattern when comparing the scoresof the four GTAA facets: the scores of the Location facet are highest, followed by thePerson, Subject and finally the Name facet. DSSim scores best on the GTAA-WordNetalignments, although a comparison is limited since GG2WW only returned correspon-dences to the GTAA Subject facet.
DSSim has participated in the VLCR task of 2008 as well. However, a direct com-parison of the precision scores of 2008 and 2009 is difficult due to differences in thetask; in 2008 we considered SKOS exact-, broad-, narrow- and related-matches. Theresults of 2008 and 2009 do show similarities when comparing the scores of the facetsand resources. The GTAA Names facet remains hard to match, which might be due tothe many Dutch-specific concepts in this facet, such as Dutch ships named after famouspeople. WordNet appears again to be less compatible with the GTAA facets, with theexception of the Subject facet.
Recall measures can be compared to last year directly, as we have used the sameevaluation measures and reference alignment. DSSim scores exactly the same on the
115
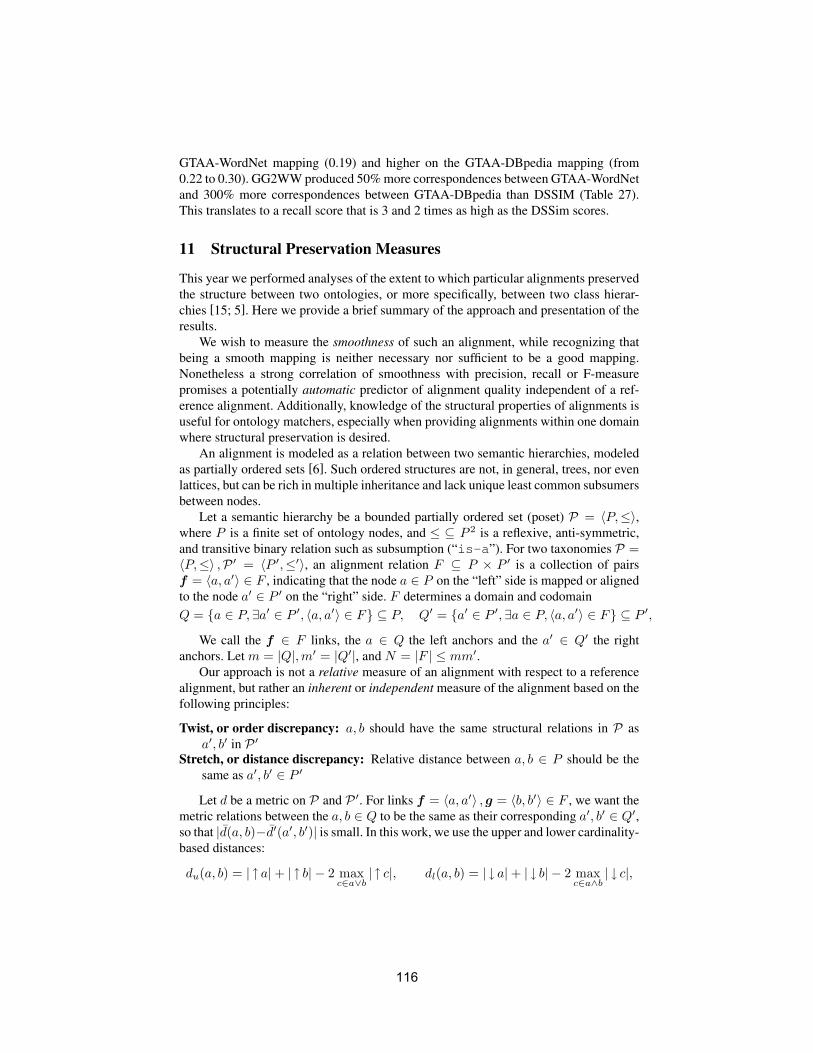
GTAA-WordNet mapping (0.19) and higher on the GTAA-DBpedia mapping (from0.22 to 0.30). GG2WW produced 50% more correspondences between GTAA-WordNetand 300% more correspondences between GTAA-DBpedia than DSSIM (Table 27).This translates to a recall score that is 3 and 2 times as high as the DSSim scores.
11 Structural Preservation Measures
This year we performed analyses of the extent to which particular alignments preservedthe structure between two ontologies, or more specifically, between two class hierar-chies [15; 5]. Here we provide a brief summary of the approach and presentation of theresults.
We wish to measure the smoothness of such an alignment, while recognizing thatbeing a smooth mapping is neither necessary nor sufficient to be a good mapping.Nonetheless a strong correlation of smoothness with precision, recall or F-measurepromises a potentially automatic predictor of alignment quality independent of a ref-erence alignment. Additionally, knowledge of the structural properties of alignments isuseful for ontology matchers, especially when providing alignments within one domainwhere structural preservation is desired.
An alignment is modeled as a relation between two semantic hierarchies, modeledas partially ordered sets [6]. Such ordered structures are not, in general, trees, nor evenlattices, but can be rich in multiple inheritance and lack unique least common subsumersbetween nodes.
Let a semantic hierarchy be a bounded partially ordered set (poset) P = 〈P,≤〉,where P is a finite set of ontology nodes, and ≤ ⊆ P 2 is a reflexive, anti-symmetric,and transitive binary relation such as subsumption (“is-a”). For two taxonomies P =〈P,≤〉 ,P ′ = 〈P ′,≤′〉, an alignment relation F ⊆ P × P ′ is a collection of pairsf = 〈a, a′〉 ∈ F , indicating that the node a ∈ P on the “left” side is mapped or alignedto the node a′ ∈ P ′ on the “right” side. F determines a domain and codomainQ = {a ∈ P,∃a′ ∈ P ′, 〈a, a′〉 ∈ F} ⊆ P, Q′ = {a′ ∈ P ′,∃a ∈ P, 〈a, a′〉 ∈ F} ⊆ P ′,
We call the f ∈ F links, the a ∈ Q the left anchors and the a′ ∈ Q′ the rightanchors. Let m = |Q|,m′ = |Q′|, and N = |F | ≤ mm′.
Our approach is not a relative measure of an alignment with respect to a referencealignment, but rather an inherent or independent measure of the alignment based on thefollowing principles:
Twist, or order discrepancy: a, b should have the same structural relations in P asa′, b′ in P ′
Stretch, or distance discrepancy: Relative distance between a, b ∈ P should be thesame as a′, b′ ∈ P ′
Let d be a metric on P and P ′. For links f = 〈a, a′〉 , g = 〈b, b′〉 ∈ F , we want themetric relations between the a, b ∈ Q to be the same as their corresponding a′, b′ ∈ Q′,so that |d(a, b)−d′(a′, b′)| is small. In this work, we use the upper and lower cardinality-based distances:
du(a, b) = | ↑ a|+ | ↑ b| − 2 maxc∈a∨b
| ↑ c|, dl(a, b) = | ↓ a|+ | ↓ b| − 2 maxc∈a∧b
| ↓ c|,
116
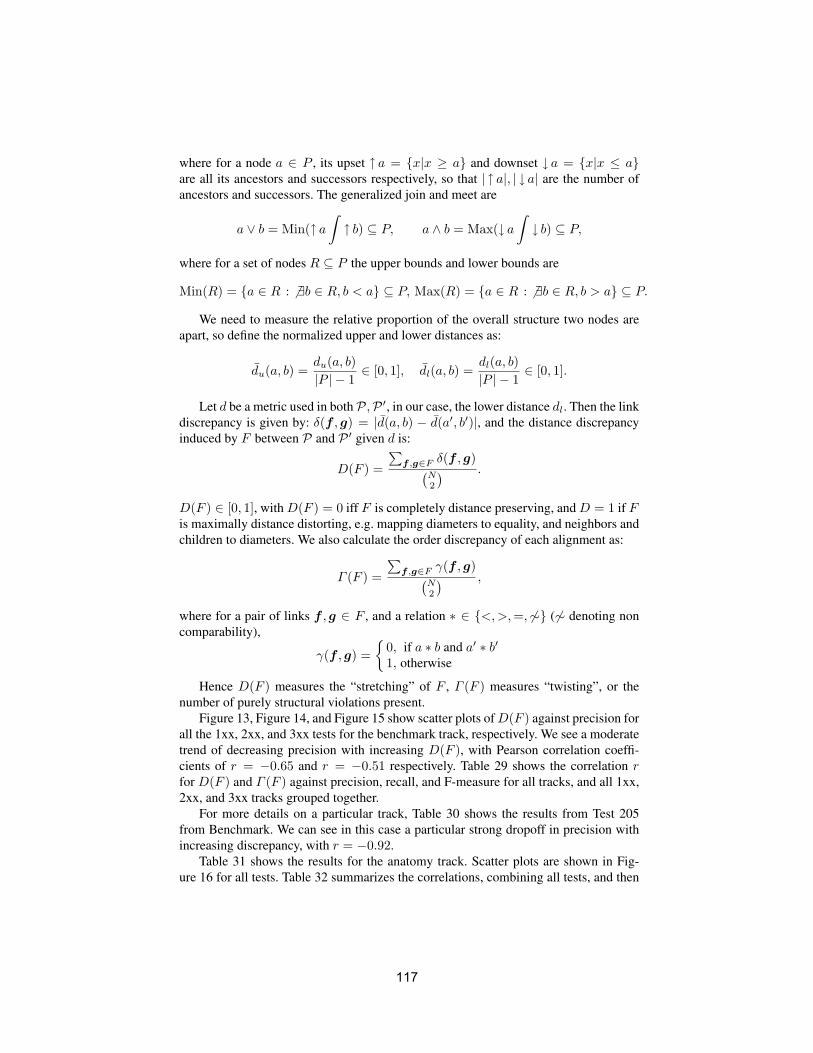
where for a node a ∈ P , its upset ↑ a = {x|x ≥ a} and downset ↓ a = {x|x ≤ a}are all its ancestors and successors respectively, so that | ↑ a|, | ↓ a| are the number ofancestors and successors. The generalized join and meet are
a ∨ b = Min(↑ a∫↑ b) ⊆ P, a ∧ b = Max(↓ a
∫↓ b) ⊆ P,
where for a set of nodes R ⊆ P the upper bounds and lower bounds are
Min(R) = {a ∈ R : 6 ∃b ∈ R, b < a} ⊆ P, Max(R) = {a ∈ R : 6 ∃b ∈ R, b > a} ⊆ P.
We need to measure the relative proportion of the overall structure two nodes areapart, so define the normalized upper and lower distances as:
du(a, b) =du(a, b)|P | − 1
∈ [0, 1], dl(a, b) =dl(a, b)|P | − 1
∈ [0, 1].
Let d be a metric used in bothP,P ′, in our case, the lower distance dl. Then the linkdiscrepancy is given by: δ(f , g) = |d(a, b) − d(a′, b′)|, and the distance discrepancyinduced by F between P and P ′ given d is:
D(F ) =
∑f ,g∈F δ(f , g)(
N2
) .
D(F ) ∈ [0, 1], with D(F ) = 0 iff F is completely distance preserving, and D = 1 if Fis maximally distance distorting, e.g. mapping diameters to equality, and neighbors andchildren to diameters. We also calculate the order discrepancy of each alignment as:
Γ (F ) =
∑f ,g∈F γ(f , g)(
N2
) ,
where for a pair of links f , g ∈ F , and a relation ∗ ∈ {<,>,=, 6∼} (6∼ denoting noncomparability),
γ(f , g) ={
0, if a ∗ b and a′ ∗ b′1, otherwise
Hence D(F ) measures the “stretching” of F , Γ (F ) measures “twisting”, or thenumber of purely structural violations present.
Figure 13, Figure 14, and Figure 15 show scatter plots ofD(F ) against precision forall the 1xx, 2xx, and 3xx tests for the benchmark track, respectively. We see a moderatetrend of decreasing precision with increasing D(F ), with Pearson correlation coeffi-cients of r = −0.65 and r = −0.51 respectively. Table 29 shows the correlation rfor D(F ) and Γ (F ) against precision, recall, and F-measure for all tracks, and all 1xx,2xx, and 3xx tracks grouped together.
For more details on a particular track, Table 30 shows the results from Test 205from Benchmark. We can see in this case a particular strong dropoff in precision withincreasing discrepancy, with r = −0.92.
Table 31 shows the results for the anatomy track. Scatter plots are shown in Fig-ure 16 for all tests. Table 32 summarizes the correlations, combining all tests, and then
117
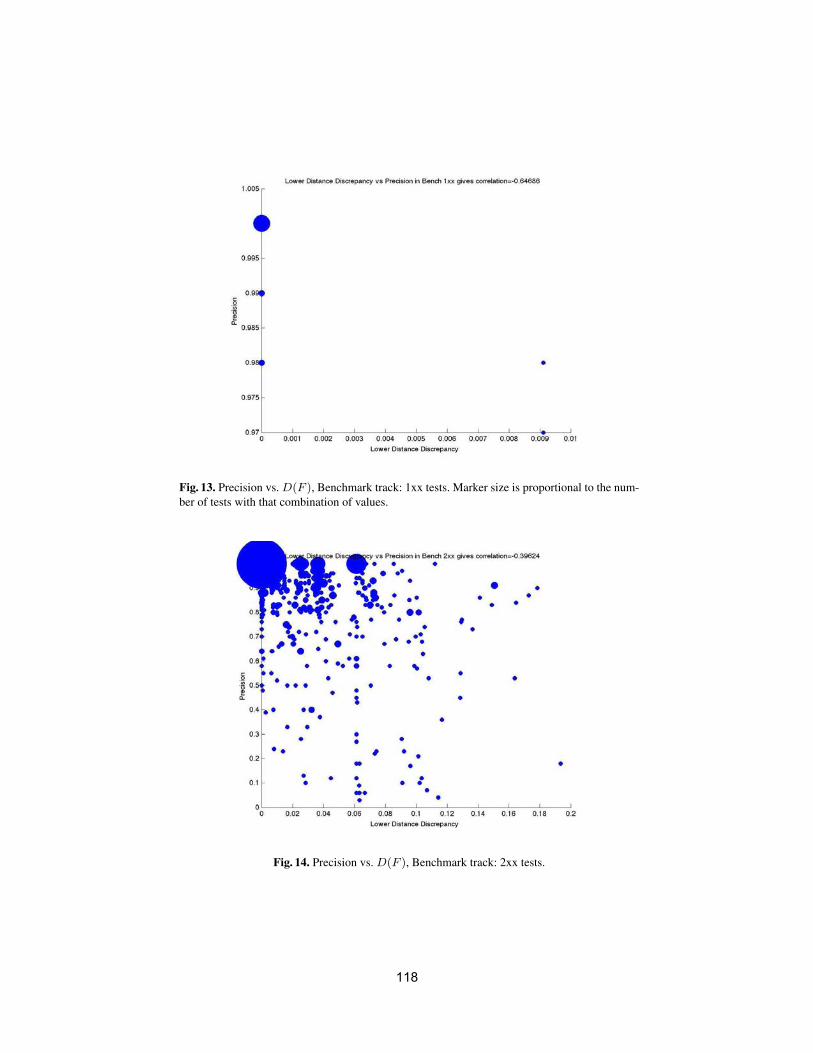
Fig. 13. Precision vs. D(F ), Benchmark track: 1xx tests. Marker size is proportional to the num-ber of tests with that combination of values.
Fig. 14. Precision vs. D(F ), Benchmark track: 2xx tests.
118
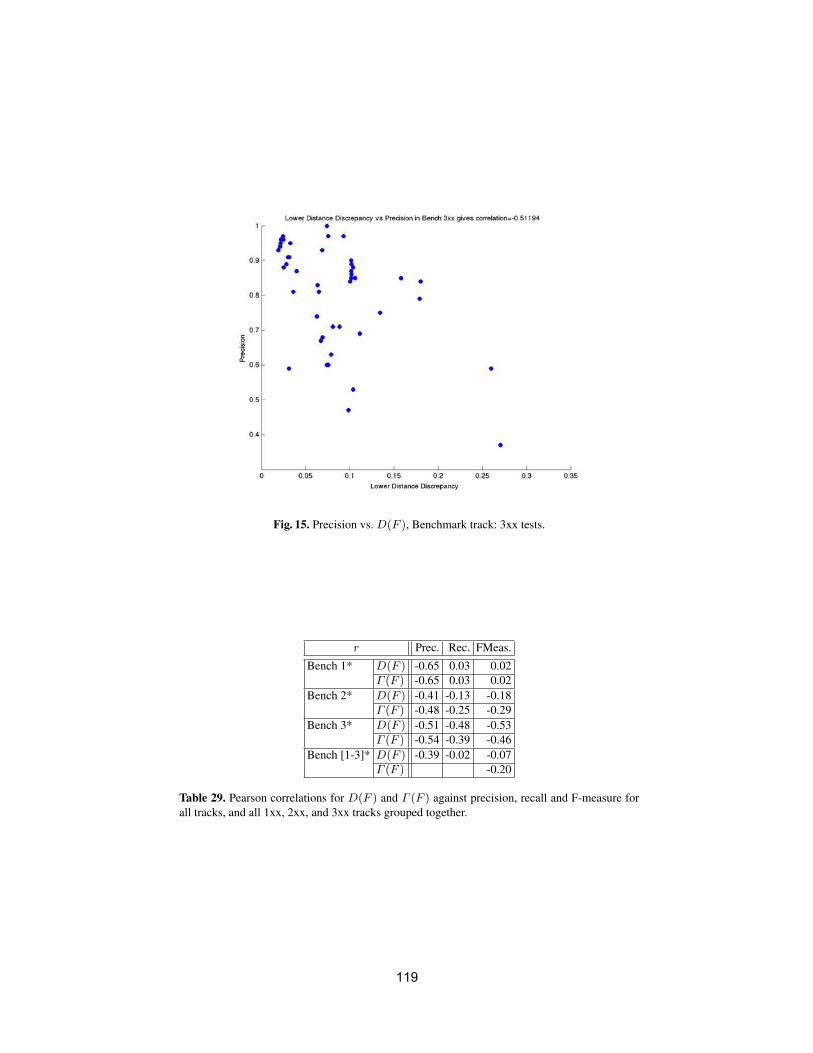
Fig. 15. Precision vs. D(F ), Benchmark track: 3xx tests.
r Prec. Rec. FMeas.
Bench 1* D(F ) -0.65 0.03 0.02Γ (F ) -0.65 0.03 0.02
Bench 2* D(F ) -0.41 -0.13 -0.18Γ (F ) -0.48 -0.25 -0.29
Bench 3* D(F ) -0.51 -0.48 -0.53Γ (F ) -0.54 -0.39 -0.46
Bench [1-3]* D(F ) -0.39 -0.02 -0.07Γ (F ) -0.20
Table 29. Pearson correlations for D(F ) and Γ (F ) against precision, recall and F-measure forall tracks, and all 1xx, 2xx, and 3xx tracks grouped together.
119
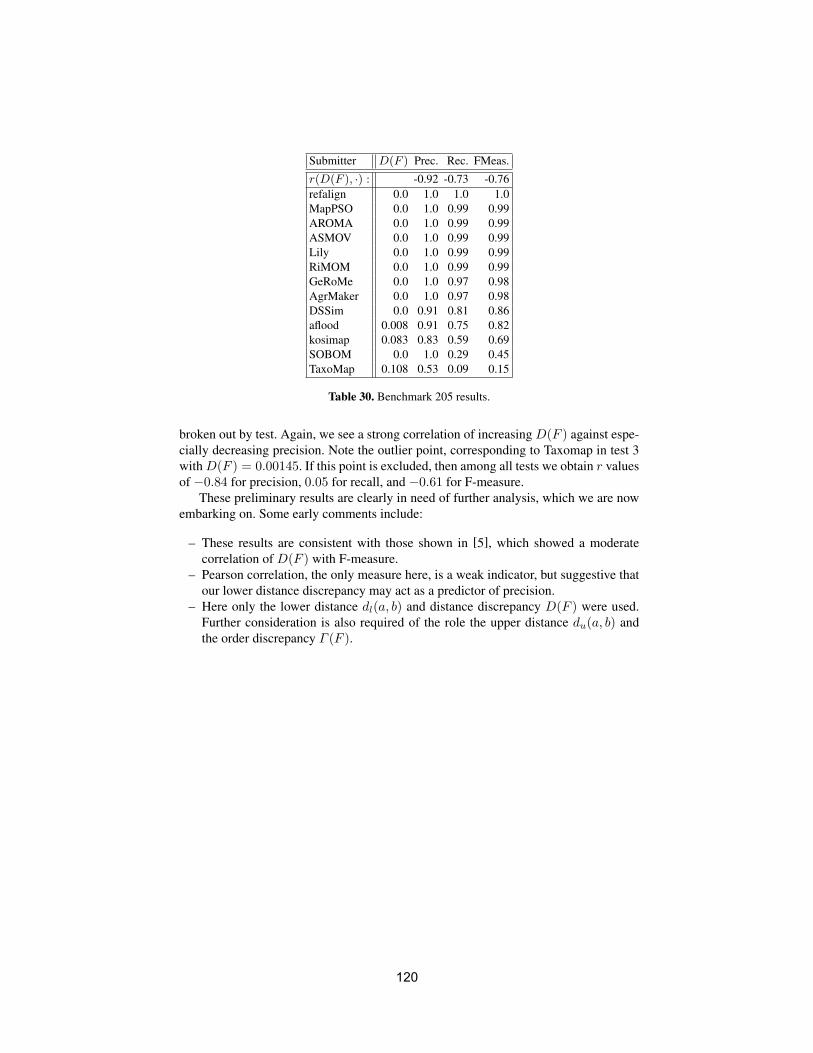
Submitter D(F ) Prec. Rec. FMeas.
r(D(F ), ·) : -0.92 -0.73 -0.76refalign 0.0 1.0 1.0 1.0MapPSO 0.0 1.0 0.99 0.99AROMA 0.0 1.0 0.99 0.99ASMOV 0.0 1.0 0.99 0.99Lily 0.0 1.0 0.99 0.99RiMOM 0.0 1.0 0.99 0.99GeRoMe 0.0 1.0 0.97 0.98AgrMaker 0.0 1.0 0.97 0.98DSSim 0.0 0.91 0.81 0.86aflood 0.008 0.91 0.75 0.82kosimap 0.083 0.83 0.59 0.69SOBOM 0.0 1.0 0.29 0.45TaxoMap 0.108 0.53 0.09 0.15
Table 30. Benchmark 205 results.
broken out by test. Again, we see a strong correlation of increasing D(F ) against espe-cially decreasing precision. Note the outlier point, corresponding to Taxomap in test 3withD(F ) = 0.00145. If this point is excluded, then among all tests we obtain r valuesof −0.84 for precision, 0.05 for recall, and −0.61 for F-measure.
These preliminary results are clearly in need of further analysis, which we are nowembarking on. Some early comments include:
– These results are consistent with those shown in [5], which showed a moderatecorrelation of D(F ) with F-measure.
– Pearson correlation, the only measure here, is a weak indicator, but suggestive thatour lower distance discrepancy may act as a predictor of precision.
– Here only the lower distance dl(a, b) and distance discrepancy D(F ) were used.Further consideration is also required of the role the upper distance du(a, b) andthe order discrepancy Γ (F ).
120
Test Submitter D(F ) Γ (F ) Prec. Rec. FMeas.
1 aflood 0.00133 0.00155 0.873 0.653 0.7471 AgrMaker 0.00127 0.00147 0.865 0.798 0.8311 AROMA 0.00288 0.00298 0.775 0.678 0.7231 ASMOV 0.00314 0.00368 0.746 0.755 0.7511 DSSim 0.00156 0.00233 0.853 0.676 0.7541 kosimap 0.00099 0.00123 0.866 0.619 0.7221 Lily 0.00259 0.00346 0.738 0.739 0.7391 Ref_Full 0.00078 0.00066 1.0 1.0 1.01 SOBOM 0.00088 0.00091 0.952 0.777 0.8551 taxomap 0.00149 0.00225 0.87 0.678 0.7622 aflood 0.00105 0.00098 0.892 0.712 0.7922 AgrMaker 0.00086 0.00081 0.967 0.682 0.82 ASMOV 0.00133 0.00161 0.821 0.736 0.7762 DSSim 0.00113 0.00123 0.973 0.62 0.7572 kosimap 0.0023 0.00443 0.907 0.446 0.5982 Lily 0.00236 0.00341 0.869 0.559 0.6812 taxomap 0.00075 0.00086 0.953 0.609 0.7433 aflood 0.00148 0.0016 0.827 0.763 0.7943 AgrMaker 0.00332 0.00368 0.511 0.815 0.6283 ASMOV 0.00306 0.00386 0.725 0.767 0.7453 kosimap 0.00099 0.00123 0.866 0.619 0.7223 Lily 0.00332 0.00393 0.534 0.774 0.6323 taxomap 0.01486 0.02115 0.458 0.716 0.5594 aflood 0.00145 0.001554 AgrMaker 0.00077 0.000664 ASMOV 0.00373 0.00414 taxomap 0.00474 0.00748
Table 31. Results of anatomy track.
r Prec. Rec. FMeas.
Anatomy 1 D(F ) -0.91 -0.25 -0.55OD -0.94 -0.35 -0.64
Anatomy 2 D(F ) -0.47 -0.71 -0.85OD -0.36 -0.82 -0.94
Anatomy 3 D(F ) -0.68 -0.03 -0.76OD -0.65 -0.07 -0.74
Anatomy [1-3] D(F ) -0.73 0.04 -0.59OD -0.69 -0.03 -0.61
Table 32. Pearson correlation r for D(F ) and Γ (F ) against precision, recall and F-measure forall Anatomy tests.
121
Fig. 16. Anatomy track, all tests, lower distance discrepancy vs. (blue) precision (green) recall(red) F-measure.
122
12 Lesson learned and suggestions
The lessons learned for this year are relatively similar to those of previous years. Thereremain one lesson not really taken into account that we identify with an asterisk (*). Wereiterate those lessons that still apply with new ones:
A) Unfortunately, we have not been able to maintain the better schedule of two yearsago. We hope to be able to improve this through the use of SEALS technology (see§13).
B) The trend that there are more matching systems able to enter such an evaluationseems to slow down. There have been not many new systems this year but on spe-cialised topics. There can be two explanations: the field is shrinking or the entryticket is too high.
C) We still can confirm that systems that enter the campaign for several times tend toimprove over years.
*D) The benchmark test case is not discriminant enough between systems and, as notedlast year, automatic test generation could contribute to improve the situation. Weplan to introduce this in the SEALS platform.
E) Some tracks provide non conclusive results, we should make effort to improve thissituation by knowing, beforehand, what conclusions can be drawn from the evalu-ations.
F) With the increase in the number of data sets, comes less participants. We will haveto set rules for declaring unfruitful, tracks in which there is no minimal independentparticipation.
Of course, these are only suggestions that will be refined during the coming year, see[22] for a detailed discussion on the ontology matching challenges.
13 Future plans
In order to improve the organization of the Ontology Alignment Evaluation Initiative,plans are made for next year that the evaluation campaign be run on a new open platformfor semantic technology evaluation developed by the SEALS project21. The SEALSproject aims at providing support for the evaluation of semantic technologies, includingontology matching.
The project will provide an automated test infrastructure and will organize inte-grated evaluation campaigns. This will allow new features in tests cases like test gen-eration on demand and online evaluation. This will lead to a more automated and in-tegrated way to evaluate systems as well as the opportunity for participants to run theevaluation for themselves.
We plan to run the next OAEI campaign within this framework and to have at leastthree tracks, and if possible more, fully supported by the SEALS platform.
21 http://www.seals-project.eu
123
14 Conclusions
Confirming the trend of last year, the number of systems, and tracks they enter in, seemsto stabilize. As noticed the previous years, systems which do not enter for the firsttime are those which perform better. This shows that, as expected, the field of ontologymatching is getting stronger (and we hope that evaluation has been contributing to thisprogress).
Moreover, we had this year more tracks but participants did not enter more tracksthan previous years: 3.25 against 3.84 in 2008 and 2.94 in 2007. This figure of around3 out of 8 may be the result of either the specialization of systems or the short timeallowed to the campaign.
All participants have provided a description of their systems and their experience inthe evaluation. These OAEI papers, like the present one, have not been peer reviewed.However, they are full contributions to this evaluation exercise and reflect the hard workand clever insight people put in the development of participating systems. Reading thepapers of the participants should help people involved in ontology matching to find whatmakes these algorithms work and what could be improved. Sometimes participants offeralternate evaluation results.
The Ontology Alignment Evaluation Initiative will continue these tests by improv-ing both test cases and testing methodology for being more accurate. Further informa-tion can be found at:
http://oaei.ontologymatching.org.
Acknowledgments
We warmly thank each participant of this campaign. We know that they have workedhard for having their results ready and they provided insightful papers presenting theirexperience. The best way to learn about the results remains to read the following papers.
We thank Paolo Bouquet and the OKKAM European Project for providing the ref-erence alignment for the IIMB benchmark used in the instance matching track.
We thank Patrice Landry, Genevieve Clavel and Jeroen Hoppenbrouwers for theMACS data. For LCSH, RAMEAU and SWD, respectively, The Library of Congress,The French National Library and the German National Library. The collection of theBritish Library was provided by the The European Library Office.
Jérôme Euzenat, Christian Meilicke, Heiner Stuckenschmidt and Cassia Trojahndos Santos have been partially supported by the SEALS (IST-2009-238975) Europeanproject.
We are grateful to Dominique Ritze (University of Mannheim) for participating inextension of reference alignment for the conference track. In addition, Ondrej Šváb-Zamazal and Vojtech Svátek were supported by the IGA VSE grant no.20/08 “Evalua-tion and matching ontologies via patterns”.
We also warmly thanks Claudio Baldassarre for preparing unfruitful test caseswhich were cancelled; we hope to have more success with these in the coming years.
We are grateful to Martin Ringwald and Terry Hayamizu for providing the referencealignment for the anatomy ontologies.
124
We gratefully acknowledge the Dutch Institute for Sound and Vision for allowingus to use the GTAA. We would like to thank Willem van Hage for the use of his toolsfor manual evaluation of correspondences.
We also thank the other members of the Ontology Alignment Evaluation Initia-tive Steering committee: Wayne Bethea (John Hopkins University, USA), Lewis Hart(AT&T, USA), Tadashi Hoshiai (Fujitsu, Japan), Todd Hughes (DARPA, USA), Yan-nis Kalfoglou (Ricoh laboratories, UK), John Li (Teknowledge, USA), Miklos Nagy(The Open University (UK), Natasha Noy (Stanford University, USA), Yuzhong Qu(Southeast University (China), York Sure (Leibniz Gemeinschaft, Germany), Jie Tang(Tsinghua University (China), Raphaël Troncy (Eurecom, France), and Petko Valtchev(Université du Québec Montréal, Canada).
References
1. Zharko Aleksovski, Warner ten Kate, and Frank van Harmelen. Exploiting the structure ofbackground knowledge used in ontology matching. In Proc. 1st International Workshop onOntology Matching (OM-2006), collocated with ISWC-2006, Athens, Georgia (USA), 2006.
2. Ben Ashpole, Marc Ehrig, Jérôme Euzenat, and Heiner Stuckenschmidt, editors. Proceed-ings of the K-Cap Workshop on Integrating Ontologies, Banff (CA), 2005.
3. Oliver Bodenreider, Terry Hayamizu, Martin Ringwald, Sherri De Coronado, and SongmaoZhang. Of mice and men: Aligning mouse and human anatomies. In Proc. American MedicalInformatics Association (AIMA) Annual Symposium, pages 61–65, 2005.
4. Caterina Caracciolo, Jérôme Euzenat, Laura Hollink, Ryutaro Ichise, Antoine Isaac,Véronique Malaisé, Christian Meilicke, Juan Pane, Pavel Shvaiko, Heiner Stuckenschmidt,Ondrej Sváb-Zamazal, and Vojtech Svátek. Results of the ontology alignment evaluationinitiative 2008. In Proc. 3rd International Workshop on Ontology Matching (OM-2008),collocated with ISWC-2008, Karlsruhe (Germany), 2008.
5. Joslyn Cliff, Paulson Patrick, and White Amanda. Measuring the structural preservation ofsemantic hierarchy alignments. In Proc. 4th International Workshop on Ontology Matching(OM-2009), collocated with ISWC-2009, Chantilly (USA), 2009. this volume.
6. Brian Davey and Hilary Priestly. Introduction to lattices and order. Cambridge UniversityPress, Cambridge, 2nd edition, 1990.
7. Marc Ehrig and Jérôme Euzenat. Relaxed precision and recall for ontology matching. InProceedings of the K-Cap Workshop on Integrating Ontologies, pages 25–32, Banff (CA),2005.
8. Jérôme Euzenat. An API for ontology alignment. In Proceedings of the 3rd InternationalSemantic Web Conference (ISWC), pages 698–712, Hiroshima (JP), 2004.
9. Jérôme Euzenat, Malgorzata Mochol, Pavel Shvaiko, Heiner Stuckenschmidt, Ondrej Svab,Vojtech Svatek, Willem Robert van Hage, and Mikalai Yatskevich. Results of the ontol-ogy alignment evaluation initiative 2006. In Proc. 1st International Workshop on OntologyMatching (OM-2006), collocated with ISWC-2006, pages 73–95, Athens, Georgia (USA),2006.
10. Jérôme Euzenat and Pavel Shvaiko. Ontology Matching. Springer, Heidelberg (DE), 2007.11. Jérôme Euzenat, Antoine Isaac, Christian Meilicke, Pavel Shvaiko, Heiner Stuckenschmidt,
Ondrej Svab, Vojtech Svatek, Willem Robert van Hage, and Mikalai Yatskevich. Results ofthe ontology alignment evaluation initiative 2007. In Proc. 2nd International Workshop onOntology Matching (OM-2008), collocated with ISWC-2007, pages 96–132, Busan (Korea),2007.
125
12. Daniel Fleischhacker and Heiner Stuckenschmidt. Implementing semantic precision andrecall. In Proc. 4th International Workshop on Ontology Matching (OM-2009), collocatedwith ISWC-2009, Chantilly (USA), 2009. this volume.
13. Fausto Giunchiglia, Mikalai Yatskevich, Paolo Avesani, and Pavel Shvaiko. A large scaledataset for the evaluation of ontology matching systems. The Knowledge Engineering ReviewJournal, 24(2):137–157, 2009.
14. Antoine Isaac, Henk Matthezing, Lourens van der Meij, Stefan Schlobach, Shenghui Wang,and Claus Zinn. Putting ontology alignment in context: Usage scenarios, deployment andevaluation in a library case. In Proceedings of the 5th European Semantic Web Conference(ESWC), pages 402–417, Tenerife (ES), 2008.
15. Cliff Joslyn, Alex Donaldson, and Patrick Paulson. Evaluating the structural quality of se-mantic hierarchy alignments. In International Semantic Web Conference (Posters & Demos),Karlsruhe (Germany), 2008.
16. Patrick Lambrix and Qiang Liu. Using partial reference alignments to align ontologies.In Proceedings of the 6th European Semantic Web Conference, pages 188–202, Heraklion,Crete (Greece), 2009.
17. Christian Meilicke and Heiner Stuckenschmidt. Incoherence as a basis for measuring thequality of ontology mappings. In Proc. 3rd International Workshop on Ontology Matching(OM-2008), collocated with ISWC-2008, pages 1–12, Karlsruhe (Germany), 2008.
18. Christian Meilicke and Heiner Stuckenschmidt. An efficient method for computing a localoptimal alignment diagnosis. Technical report, University Mannheim, Computer ScienceInstitute, 2009.
19. Vojtech Svátek Ondrej Šváb-Zamazal O. Empirical knowledge discovery over ontologymatching results. In Proc. 1st ESWC International Workshop on Inductive Reasoning andMachine Learning on the Semantic Web, Heraklion (Greece), 2009.
20. Marta Sabou, Mathieu d’Aquin, and Enrico Motta. Using the semantic web as backgroundknowledge for ontology mapping. In Proc. 1st International Workshop on Ontology Match-ing (OM-2006), collocated ISWC-2006, pages 1–12, Athens, Georgia (USA), 2006.
21. Francois Scharffe. Correspondence Patterns Representation. PhD thesis, University of Inns-bruck, 2009.
22. Pavel Shvaiko and Jérôme Euzenat. Ten challenges for ontology matching. In Proceedings ofthe 7th International Conference on Ontologies, DataBases, and Applications of Semantics(ODBASE), pages 1164–1182, Monterrey (MX), 2008.
23. York Sure, Oscar Corcho, Jérôme Euzenat, and Todd Hughes, editors. Proceedings of theISWC Workshop on Evaluation of Ontology-based Tools (EON), Hiroshima (JP), 2004.
24. Willem Robert van Hage, Antoine Isaac, and Zharko Aleksovski. Sample evaluation ofontology-matching systems. In Proc. 5th International Workshop on Evaluation of Ontolo-gies and Ontology-based Tools (EON 2007), collocated with ISWC-2007, pages 41–50, Bu-san (Korea), 2007.
Grenoble, Milano, Amsterdam, Richland, Mannheim, Milton-Keynes, Samos, Trento,Prague, November 2009
126
Anchor-Flood: Results for OAEI 2009
Md. Hanif Seddiqui and Masaki Aono
Toyohashi University of Technology, Japan
[email protected], [email protected]
Abstract. Our ontology schema matching algorithm takes the essence of the locality of reference by considering the neighboring concepts and relations to align the entities of ontologies. It starts off a seed point called an anchor (a pair of “look-alike” concepts across ontologies) and collects two blocks of neighboring concepts across ontologies. The concepts of the pair of blocks are aligned and the process is repeated for newly found aligned pairs. This year, we use a semantically reformed dynamic block of concepts starting from an anchor-concept and produce two blocks from one anchor to get alignment. We improve our memory management. The experimental results show its effectiveness against the benchmark, anatomy track and other datasets. We also extend our algorithm to match instances of IIMB benchmarks and we obtained effective results.
1 Presentation of the system
During OAEI-2008, our ontology alignment system used the locality of reference for collecting neighboring concepts with strong semantic arbitrary depth for aligning concepts across pair of ontologies. This year, we incorporate a process of collecting concepts with strong intrinsic semantic similarity within ontology elements considering intrinsic Information Content (IC) [6] to form a dynamic block. Hence our system forms a pair of dynamic blocks staring off an anchor across ontologies. We improve our memory management to cope large scale ontology alignment effectively. Our algorithm has shorter run time than that of the previous year. It takes less memory and even less time as well to align large ontologies. We participate in the benchmark datasets, all four tasks of anatomy track, conference and directory as well. We also take limited participation in the instance matching track. We participate only in the IIMB benchmark track of instance matching track.
1.1 State, purpose, general statement
The purpose of our Anchor-Flood algorithm [8] is basically ontology matching. However, we use our algorithm in patent mining system to classify a research abstract in terms of International Patent Classification (IPC). Containing mostly general terminologies in an abstract leads classification to a formidable task. Automatic extracted taxonomy of related terms available in an abstract is aligned with the
127
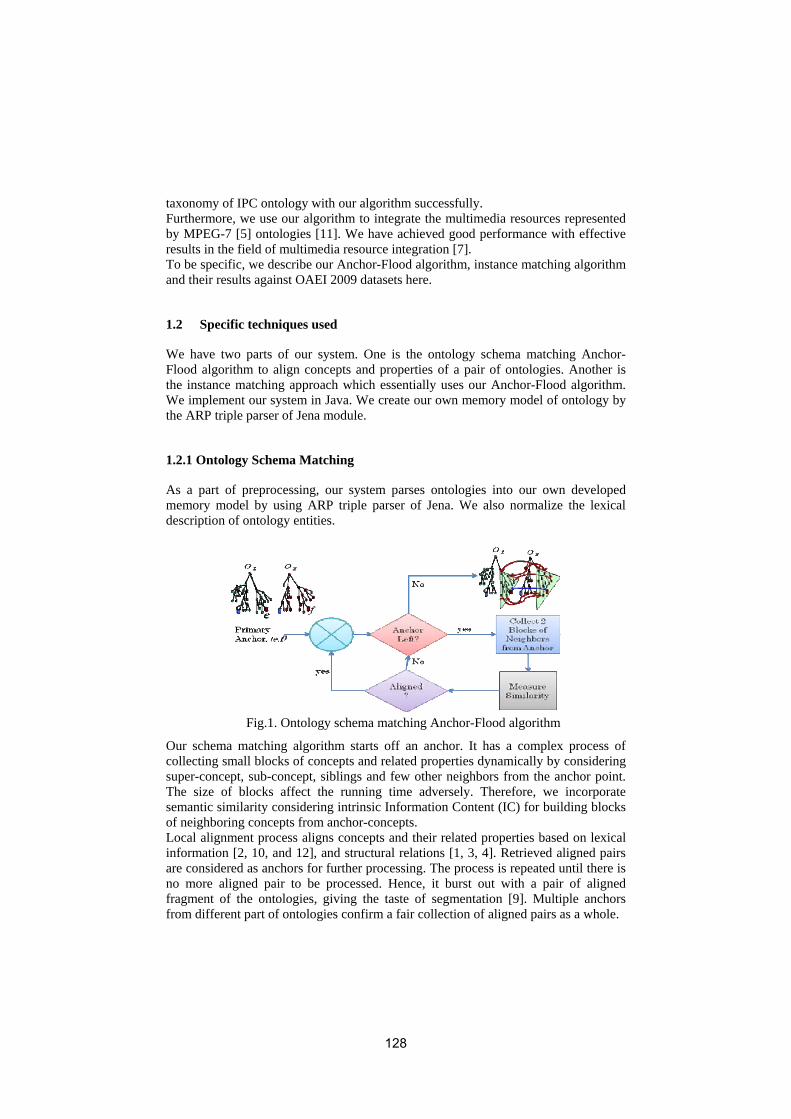
taxonomy of IPC ontology with our algorithm successfully. Furthermore, we use our algorithm to integrate the multimedia resources represented by MPEG-7 [5] ontologies [11]. We have achieved good performance with effective results in the field of multimedia resource integration [7]. To be specific, we describe our Anchor-Flood algorithm, instance matching algorithm and their results against OAEI 2009 datasets here.
1.2 Specific techniques used
We have two parts of our system. One is the ontology schema matching Anchor-Flood algorithm to align concepts and properties of a pair of ontologies. Another is the instance matching approach which essentially uses our Anchor-Flood algorithm. We implement our system in Java. We create our own memory model of ontology by the ARP triple parser of Jena module.
1.2.1 Ontology Schema Matching
As a part of preprocessing, our system parses ontologies into our own developed memory model by using ARP triple parser of Jena. We also normalize the lexical description of ontology entities.
Fig.1. Ontology schema matching Anchor-Flood algorithm
Our schema matching algorithm starts off an anchor. It has a complex process of collecting small blocks of concepts and related properties dynamically by considering super-concept, sub-concept, siblings and few other neighbors from the anchor point. The size of blocks affect the running time adversely. Therefore, we incorporate semantic similarity considering intrinsic Information Content (IC) for building blocks of neighboring concepts from anchor-concepts. Local alignment process aligns concepts and their related properties based on lexical information [2, 10, and 12], and structural relations [1, 3, 4]. Retrieved aligned pairs are considered as anchors for further processing. The process is repeated until there is no more aligned pair to be processed. Hence, it burst out with a pair of aligned fragment of the ontologies, giving the taste of segmentation [9]. Multiple anchors from different part of ontologies confirm a fair collection of aligned pairs as a whole.
128
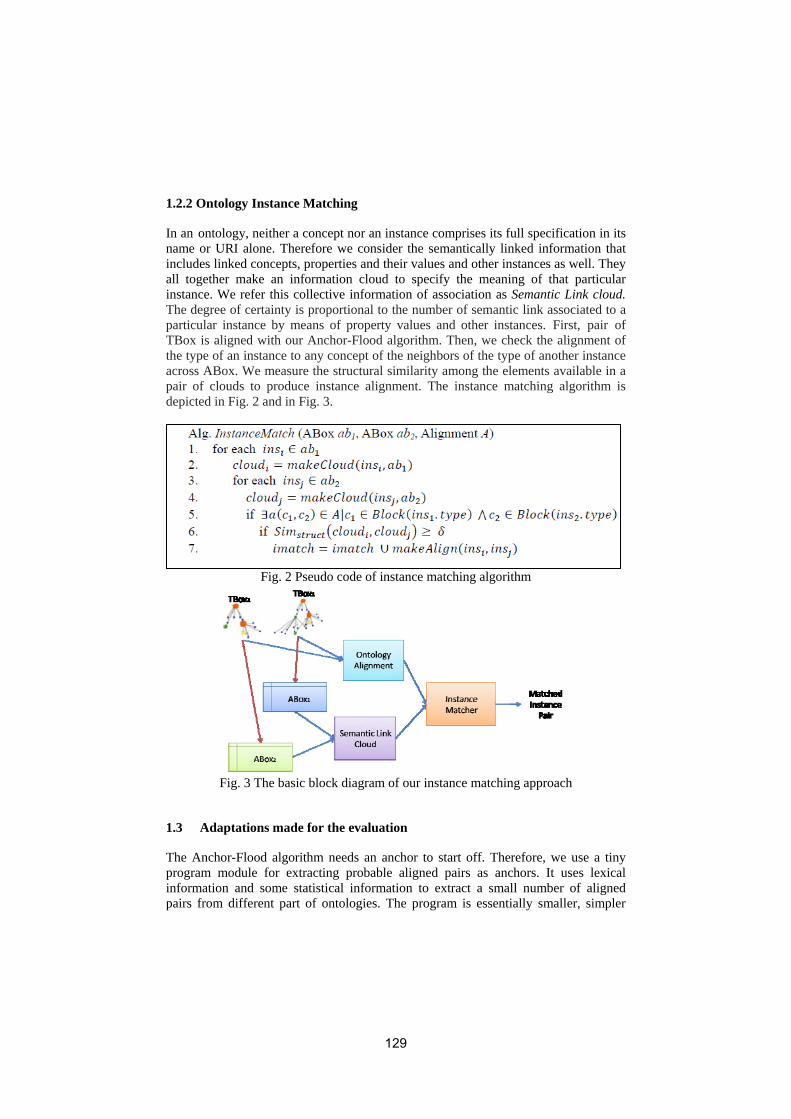
1.2.2 Ontology Instance Matching
In an ontology, neither a concept nor an instance comprises its full specification in its name or URI alone. Therefore we consider the semantically linked information that includes linked concepts, properties and their values and other instances as well. They all together make an information cloud to specify the meaning of that particular instance. We refer this collective information of association as Semantic Link cloud. The degree of certainty is proportional to the number of semantic link associated to a particular instance by means of property values and other instances. First, pair of TBox is aligned with our Anchor-Flood algorithm. Then, we check the alignment of the type of an instance to any concept of the neighbors of the type of another instance across ABox. We measure the structural similarity among the elements available in a pair of clouds to produce instance alignment. The instance matching algorithm is depicted in Fig. 2 and in Fig. 3.
Fig. 2 Pseudo code of instance matching algorithm
Fig. 3 The basic block diagram of our instance matching approach
1.3 Adaptations made for the evaluation
The Anchor-Flood algorithm needs an anchor to start off. Therefore, we use a tiny program module for extracting probable aligned pairs as anchors. It uses lexical information and some statistical information to extract a small number of aligned pairs from different part of ontologies. The program is essentially smaller, simpler
129
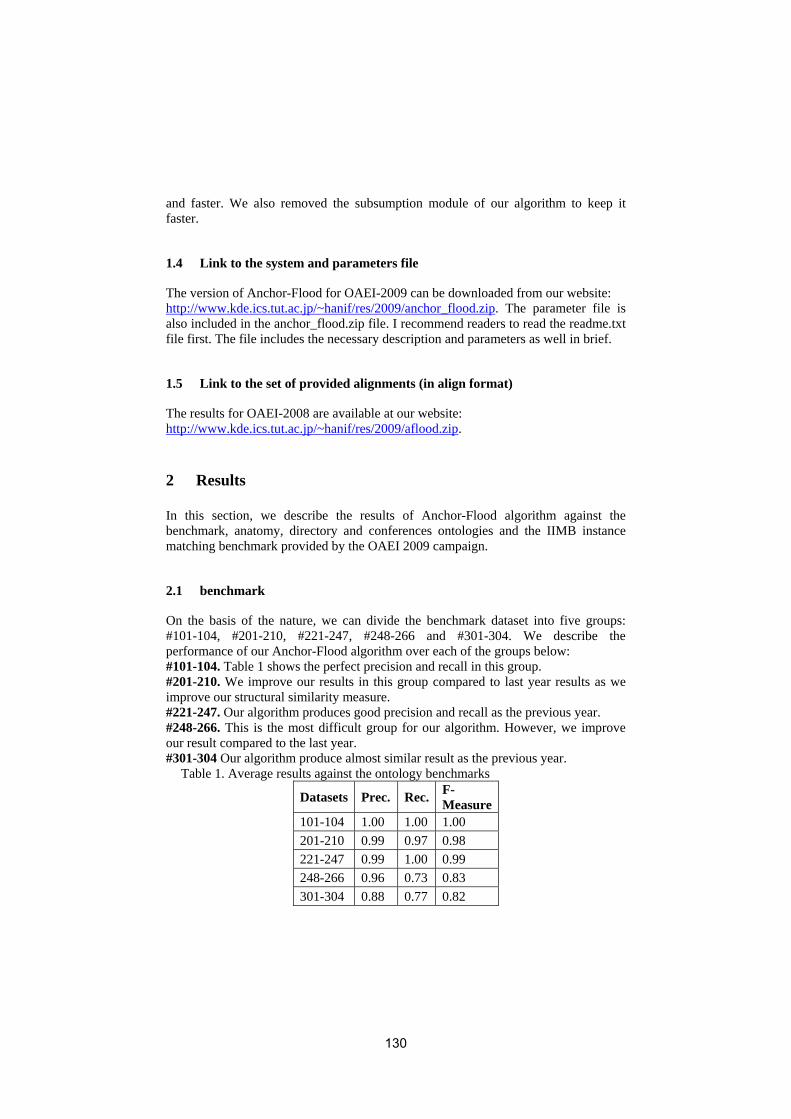
and faster. We also removed the subsumption module of our algorithm to keep it faster.
1.4 Link to the system and parameters file
The version of Anchor-Flood for OAEI-2009 can be downloaded from our website: http://www.kde.ics.tut.ac.jp/~hanif/res/2009/anchor_flood.zip. The parameter file is also included in the anchor_flood.zip file. I recommend readers to read the readme.txt file first. The file includes the necessary description and parameters as well in brief.
1.5 Link to the set of provided alignments (in align format)
The results for OAEI-2008 are available at our website: http://www.kde.ics.tut.ac.jp/~hanif/res/2009/aflood.zip.
2 Results
In this section, we describe the results of Anchor-Flood algorithm against the benchmark, anatomy, directory and conferences ontologies and the IIMB instance matching benchmark provided by the OAEI 2009 campaign.
2.1 benchmark
On the basis of the nature, we can divide the benchmark dataset into five groups: #101-104, #201-210, #221-247, #248-266 and #301-304. We describe the performance of our Anchor-Flood algorithm over each of the groups below: #101-104. Table 1 shows the perfect precision and recall in this group. #201-210. We improve our results in this group compared to last year results as we improve our structural similarity measure. #221-247. Our algorithm produces good precision and recall as the previous year. #248-266. This is the most difficult group for our algorithm. However, we improve our result compared to the last year. #301-304 Our algorithm produce almost similar result as the previous year.
Table 1. Average results against the ontology benchmarks
Datasets Prec. Rec. F-Measure
101-104 1.00 1.00 1.00 201-210 0.99 0.97 0.98 221-247 0.99 1.00 0.99 248-266 0.96 0.73 0.83 301-304 0.88 0.77 0.82
130
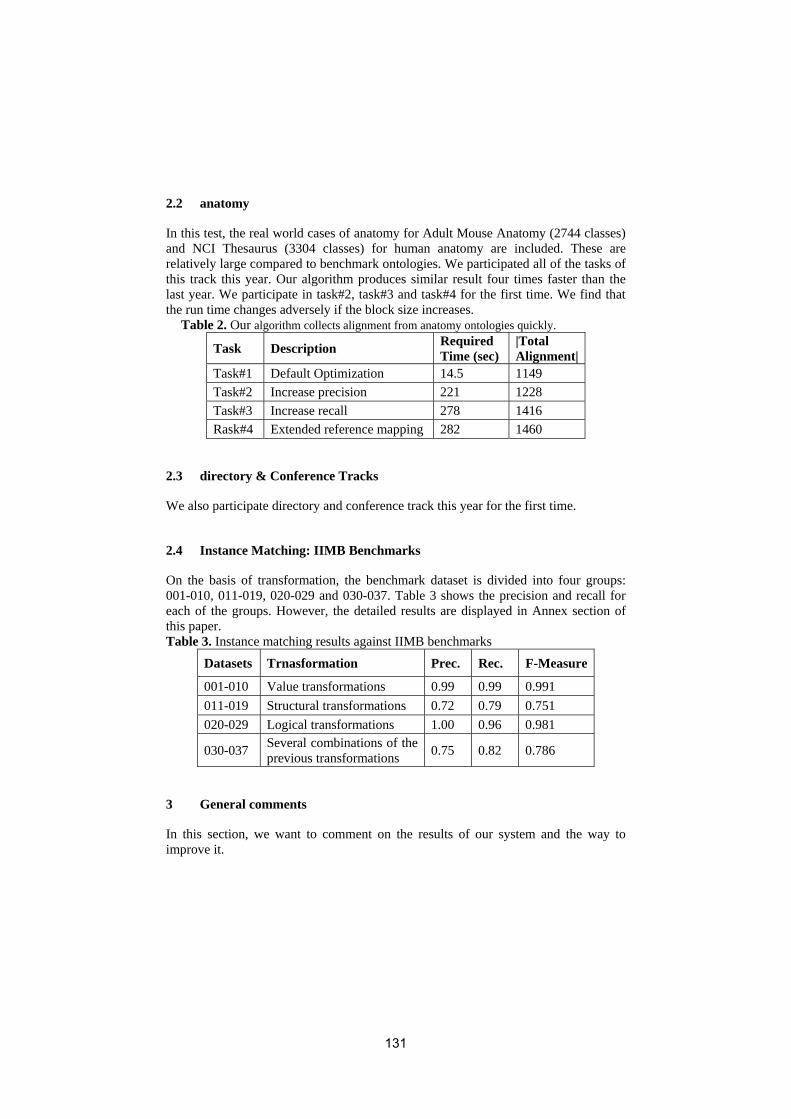
2.2 anatomy
In this test, the real world cases of anatomy for Adult Mouse Anatomy (2744 classes) and NCI Thesaurus (3304 classes) for human anatomy are included. These are relatively large compared to benchmark ontologies. We participated all of the tasks of this track this year. Our algorithm produces similar result four times faster than the last year. We participate in task#2, task#3 and task#4 for the first time. We find that the run time changes adversely if the block size increases.
Table 2. Our algorithm collects alignment from anatomy ontologies quickly.
Task Description Required Time (sec)
|Total Alignment|
Task#1 Default Optimization 14.5 1149 Task#2 Increase precision 221 1228 Task#3 Increase recall 278 1416 Rask#4 Extended reference mapping 282 1460
2.3 directory & Conference Tracks
We also participate directory and conference track this year for the first time.
2.4 Instance Matching: IIMB Benchmarks
On the basis of transformation, the benchmark dataset is divided into four groups: 001-010, 011-019, 020-029 and 030-037. Table 3 shows the precision and recall for each of the groups. However, the detailed results are displayed in Annex section of this paper. Table 3. Instance matching results against IIMB benchmarks
Datasets Trnasformation Prec. Rec. F-Measure
001-010 Value transformations 0.99 0.99 0.991 011-019 Structural transformations 0.72 0.79 0.751 020-029 Logical transformations 1.00 0.96 0.981
030-037 Several combinations of the previous transformations 0.75 0.82 0.786
3 General comments
In this section, we want to comment on the results of our system and the way to improve it.
131
3.1 Comments on the results
The main strength of our schema matching system is the way of minimizing the comparisons between entities, which leads enhancement in running time. In instance matching, our system shows its strength over value and logical transformations. The weak points are: our system ignores some distantly placed aligned pairs in ontology alignment system. In instance matching, we have still rooms to work in structural transformation.
3.2 Discussions on the way to improve the proposed system
It has still rooms of improving alignments strengthening the semantic and structural analysis and adding background knowledge. We also want to incorporate complex alignment like subsumption and 1:n alignments. In instance matching, we want to improve our system against structural transformation.
4 Conclusion
Ontology matching is very important for attaining interoperability as the core of every semantic application is ontology. We implemented faster algorithm to align specific interrelated parts across ontologies, which gives the flavor of segmentation. The anatomical ontology matching shows the effectiveness of our Anchor-Flood algorithm. Our instance matching algorithm also shows its strength in value and logical transformations. In structural transformation our algorithm is also effective in spite of challenging transformation. We improved our previous Anchor-Flood algorithm in several perceptions to retrieve ontology alignment. Furthermore, we improve the versatility of using it in different applications including instance matching, patent classification and multimedia resource integration.
References
1. Bouquet, P., Serafini, L. and Zanobini, S.: Semantic Coordination: A New Approach and an Application. Proceedings of the 2nd International Semantic Web Conference (ISWC2003), Sanibel Island, Florida, USA (2003) pp. 130-145.
2. Euzenat, J. and Valtchev, P.: Similarity-based Ontology Alignment in OWL-Lite. Proceedings of the 16th European Conference on Artificial Intelligence (ECAI2004), Valencia, Spain (2004) pp. 333-337.
3. Giunchiglia, F. and Shaiko, P.: Semantic Matching, The Knowledge Engineering Review, Cambridge Univ Press, Vol. 18(3), 2004, pp. 265-280.
4. Giunchiglia, F., Shvaiko, P. and Yatskevich, M.: S-Match: an Algorithm and an Implementation of Semantic Matching. Proceedings of the 1st European Semantic Web Symposium (ESWS2004), Heraklion, Greece, (2004) pp. 61-75.
5. Nack, F. and Lindsay, A.T.: Everything you wanted to know about MPEG-7 (Part I). IEEE Multimedia, Vol. 6(3), 1999, pp. 65--77.
132
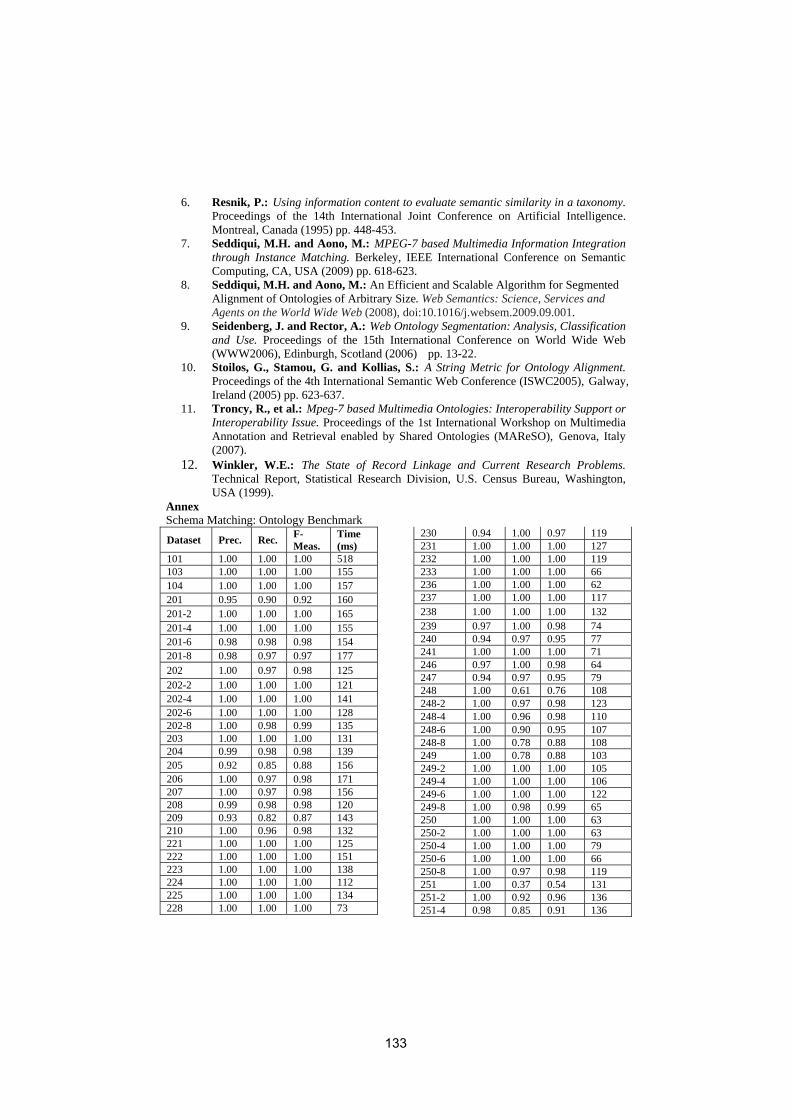
6. Resnik, P.: Using information content to evaluate semantic similarity in a taxonomy. Proceedings of the 14th International Joint Conference on Artificial Intelligence. Montreal, Canada (1995) pp. 448-453.
7. Seddiqui, M.H. and Aono, M.: MPEG-7 based Multimedia Information Integration through Instance Matching. Berkeley, IEEE International Conference on Semantic Computing, CA, USA (2009) pp. 618-623.
8. Seddiqui, M.H. and Aono, M.: An Efficient and Scalable Algorithm for Segmented Alignment of Ontologies of Arbitrary Size. Web Semantics: Science, Services and Agents on the World Wide Web (2008), doi:10.1016/j.websem.2009.09.001.
9. Seidenberg, J. and Rector, A.: Web Ontology Segmentation: Analysis, Classification and Use. Proceedings of the 15th International Conference on World Wide Web (WWW2006), Edinburgh, Scotland (2006) pp. 13-22.
10. Stoilos, G., Stamou, G. and Kollias, S.: A String Metric for Ontology Alignment. Proceedings of the 4th International Semantic Web Conference (ISWC2005), Galway, Ireland (2005) pp. 623-637.
11. Troncy, R., et al.: Mpeg-7 based Multimedia Ontologies: Interoperability Support or Interoperability Issue. Proceedings of the 1st International Workshop on Multimedia Annotation and Retrieval enabled by Shared Ontologies (MAReSO), Genova, Italy (2007).
12. Winkler, W.E.: The State of Record Linkage and Current Research Problems. Technical Report, Statistical Research Division, U.S. Census Bureau, Washington, USA (1999).
Annex Schema Matching: Ontology Benchmark Dataset Prec. Rec. F-
Meas. Time (ms)
101 1.00 1.00 1.00 518 103 1.00 1.00 1.00 155 104 1.00 1.00 1.00 157 201 0.95 0.90 0.92 160 201-2 1.00 1.00 1.00 165 201-4 1.00 1.00 1.00 155 201-6 0.98 0.98 0.98 154 201-8 0.98 0.97 0.97 177 202 1.00 0.97 0.98 125 202-2 1.00 1.00 1.00 121 202-4 1.00 1.00 1.00 141 202-6 1.00 1.00 1.00 128 202-8 1.00 0.98 0.99 135 203 1.00 1.00 1.00 131 204 0.99 0.98 0.98 139 205 0.92 0.85 0.88 156 206 1.00 0.97 0.98 171 207 1.00 0.97 0.98 156 208 0.99 0.98 0.98 120 209 0.93 0.82 0.87 143 210 1.00 0.96 0.98 132 221 1.00 1.00 1.00 125 222 1.00 1.00 1.00 151 223 1.00 1.00 1.00 138 224 1.00 1.00 1.00 112 225 1.00 1.00 1.00 134 228 1.00 1.00 1.00 73
230 0.94 1.00 0.97 119 231 1.00 1.00 1.00 127 232 1.00 1.00 1.00 119 233 1.00 1.00 1.00 66 236 1.00 1.00 1.00 62 237 1.00 1.00 1.00 117 238 1.00 1.00 1.00 132 239 0.97 1.00 0.98 74 240 0.94 0.97 0.95 77 241 1.00 1.00 1.00 71 246 0.97 1.00 0.98 64 247 0.94 0.97 0.95 79 248 1.00 0.61 0.76 108 248-2 1.00 0.97 0.98 123 248-4 1.00 0.96 0.98 110 248-6 1.00 0.90 0.95 107 248-8 1.00 0.78 0.88 108 249 1.00 0.78 0.88 103 249-2 1.00 1.00 1.00 105 249-4 1.00 1.00 1.00 106 249-6 1.00 1.00 1.00 122 249-8 1.00 0.98 0.99 65 250 1.00 1.00 1.00 63 250-2 1.00 1.00 1.00 63 250-4 1.00 1.00 1.00 79 250-6 1.00 1.00 1.00 66 250-8 1.00 0.97 0.98 119 251 1.00 0.37 0.54 131 251-2 1.00 0.92 0.96 136 251-4 0.98 0.85 0.91 136
133
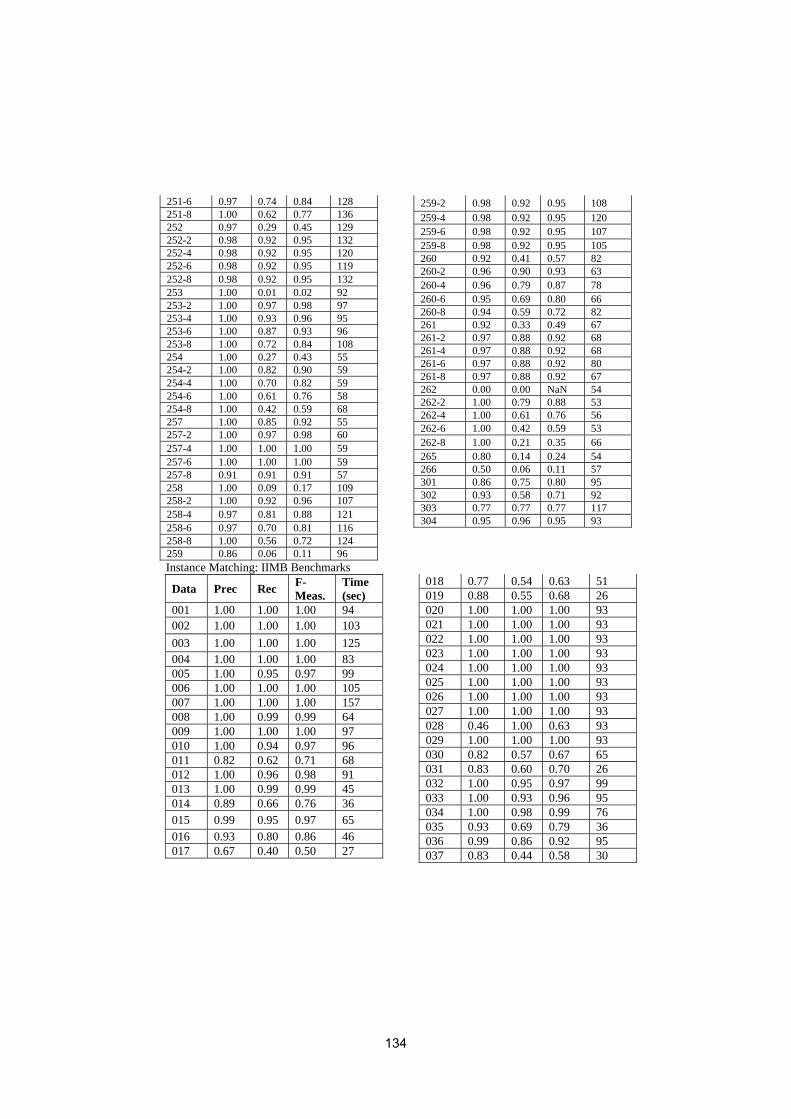
251-6 0.97 0.74 0.84 128 251-8 1.00 0.62 0.77 136 252 0.97 0.29 0.45 129 252-2 0.98 0.92 0.95 132 252-4 0.98 0.92 0.95 120 252-6 0.98 0.92 0.95 119 252-8 0.98 0.92 0.95 132 253 1.00 0.01 0.02 92 253-2 1.00 0.97 0.98 97 253-4 1.00 0.93 0.96 95 253-6 1.00 0.87 0.93 96 253-8 1.00 0.72 0.84 108 254 1.00 0.27 0.43 55 254-2 1.00 0.82 0.90 59 254-4 1.00 0.70 0.82 59 254-6 1.00 0.61 0.76 58 254-8 1.00 0.42 0.59 68 257 1.00 0.85 0.92 55 257-2 1.00 0.97 0.98 60 257-4 1.00 1.00 1.00 59 257-6 1.00 1.00 1.00 59 257-8 0.91 0.91 0.91 57 258 1.00 0.09 0.17 109 258-2 1.00 0.92 0.96 107 258-4 0.97 0.81 0.88 121 258-6 0.97 0.70 0.81 116 258-8 1.00 0.56 0.72 124 259 0.86 0.06 0.11 96
259-2 0.98 0.92 0.95 108 259-4 0.98 0.92 0.95 120 259-6 0.98 0.92 0.95 107 259-8 0.98 0.92 0.95 105 260 0.92 0.41 0.57 82 260-2 0.96 0.90 0.93 63 260-4 0.96 0.79 0.87 78 260-6 0.95 0.69 0.80 66 260-8 0.94 0.59 0.72 82 261 0.92 0.33 0.49 67 261-2 0.97 0.88 0.92 68 261-4 0.97 0.88 0.92 68 261-6 0.97 0.88 0.92 80 261-8 0.97 0.88 0.92 67 262 0.00 0.00 NaN 54 262-2 1.00 0.79 0.88 53 262-4 1.00 0.61 0.76 56 262-6 1.00 0.42 0.59 53 262-8 1.00 0.21 0.35 66 265 0.80 0.14 0.24 54 266 0.50 0.06 0.11 57 301 0.86 0.75 0.80 95 302 0.93 0.58 0.71 92 303 0.77 0.77 0.77 117 304 0.95 0.96 0.95 93
Instance Matching: IIMB Benchmarks
Data Prec Rec F-Meas.
Time (sec)
001 1.00 1.00 1.00 94 002 1.00 1.00 1.00 103 003 1.00 1.00 1.00 125 004 1.00 1.00 1.00 83 005 1.00 0.95 0.97 99 006 1.00 1.00 1.00 105 007 1.00 1.00 1.00 157 008 1.00 0.99 0.99 64 009 1.00 1.00 1.00 97 010 1.00 0.94 0.97 96 011 0.82 0.62 0.71 68 012 1.00 0.96 0.98 91 013 1.00 0.99 0.99 45 014 0.89 0.66 0.76 36 015 0.99 0.95 0.97 65 016 0.93 0.80 0.86 46 017 0.67 0.40 0.50 27
018 0.77 0.54 0.63 51 019 0.88 0.55 0.68 26 020 1.00 1.00 1.00 93 021 1.00 1.00 1.00 93 022 1.00 1.00 1.00 93 023 1.00 1.00 1.00 93 024 1.00 1.00 1.00 93 025 1.00 1.00 1.00 93 026 1.00 1.00 1.00 93 027 1.00 1.00 1.00 93 028 0.46 1.00 0.63 93 029 1.00 1.00 1.00 93 030 0.82 0.57 0.67 65 031 0.83 0.60 0.70 26 032 1.00 0.95 0.97 99 033 1.00 0.93 0.96 95 034 1.00 0.98 0.99 76 035 0.93 0.69 0.79 36 036 0.99 0.86 0.92 95 037 0.83 0.44 0.58 30
134
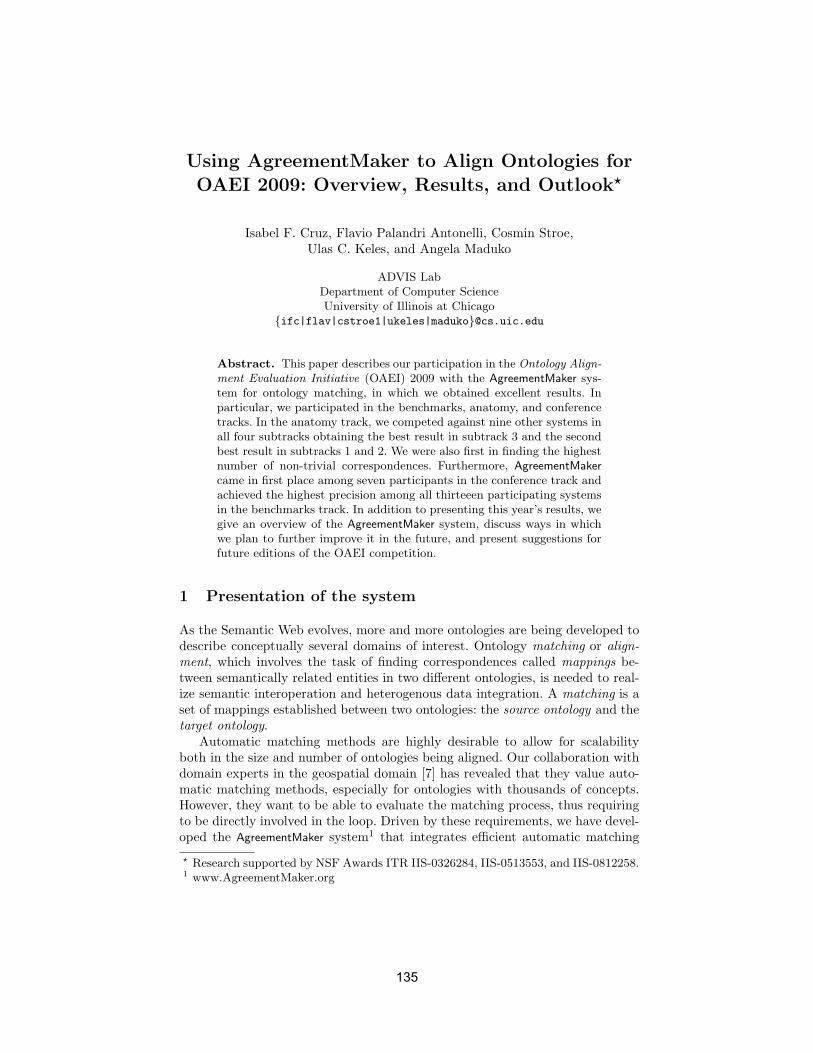
Using AgreementMaker to Align Ontologies forOAEI 2009: Overview, Results, and Outlook?
Isabel F. Cruz, Flavio Palandri Antonelli, Cosmin Stroe,Ulas C. Keles, and Angela Maduko
ADVIS LabDepartment of Computer ScienceUniversity of Illinois at Chicago
{ifc|flav|cstroe1|ukeles|maduko}@cs.uic.edu
Abstract. This paper describes our participation in the Ontology Align-ment Evaluation Initiative (OAEI) 2009 with the AgreementMaker sys-tem for ontology matching, in which we obtained excellent results. Inparticular, we participated in the benchmarks, anatomy, and conferencetracks. In the anatomy track, we competed against nine other systems inall four subtracks obtaining the best result in subtrack 3 and the secondbest result in subtracks 1 and 2. We were also first in finding the highestnumber of non-trivial correspondences. Furthermore, AgreementMakercame in first place among seven participants in the conference track andachieved the highest precision among all thirteeen participating systemsin the benchmarks track. In addition to presenting this year’s results, wegive an overview of the AgreementMaker system, discuss ways in whichwe plan to further improve it in the future, and present suggestions forfuture editions of the OAEI competition.
1 Presentation of the system
As the Semantic Web evolves, more and more ontologies are being developed todescribe conceptually several domains of interest. Ontology matching or align-ment, which involves the task of finding correspondences called mappings be-tween semantically related entities in two different ontologies, is needed to real-ize semantic interoperation and heterogenous data integration. A matching is aset of mappings established between two ontologies: the source ontology and thetarget ontology.
Automatic matching methods are highly desirable to allow for scalabilityboth in the size and number of ontologies being aligned. Our collaboration withdomain experts in the geospatial domain [7] has revealed that they value auto-matic matching methods, especially for ontologies with thousands of concepts.However, they want to be able to evaluate the matching process, thus requiringto be directly involved in the loop. Driven by these requirements, we have devel-oped the AgreementMaker system1 that integrates efficient automatic matching
? Research supported by NSF Awards ITR IIS-0326284, IIS-0513553, and IIS-0812258.1 www.AgreementMaker.org
135
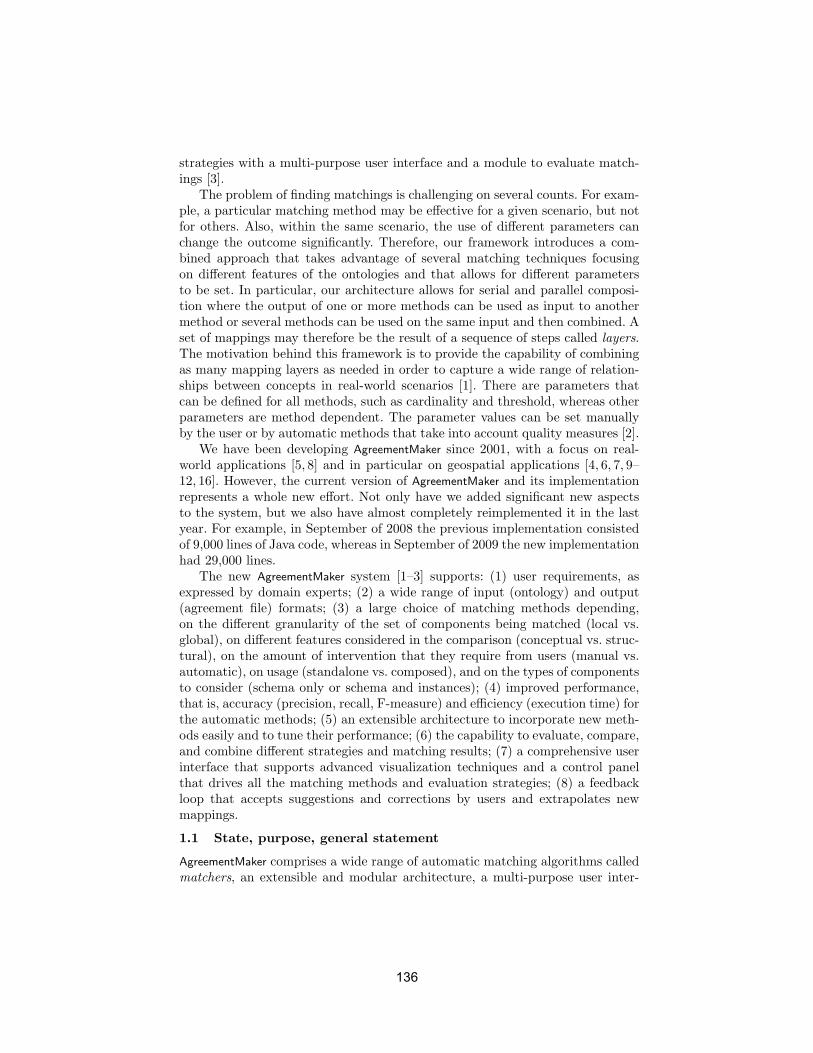
strategies with a multi-purpose user interface and a module to evaluate match-ings [3].
The problem of finding matchings is challenging on several counts. For exam-ple, a particular matching method may be effective for a given scenario, but notfor others. Also, within the same scenario, the use of different parameters canchange the outcome significantly. Therefore, our framework introduces a com-bined approach that takes advantage of several matching techniques focusingon different features of the ontologies and that allows for different parametersto be set. In particular, our architecture allows for serial and parallel composi-tion where the output of one or more methods can be used as input to anothermethod or several methods can be used on the same input and then combined. Aset of mappings may therefore be the result of a sequence of steps called layers.The motivation behind this framework is to provide the capability of combiningas many mapping layers as needed in order to capture a wide range of relation-ships between concepts in real-world scenarios [1]. There are parameters thatcan be defined for all methods, such as cardinality and threshold, whereas otherparameters are method dependent. The parameter values can be set manuallyby the user or by automatic methods that take into account quality measures [2].
We have been developing AgreementMaker since 2001, with a focus on real-world applications [5, 8] and in particular on geospatial applications [4, 6, 7, 9–12, 16]. However, the current version of AgreementMaker and its implementationrepresents a whole new effort. Not only have we added significant new aspectsto the system, but we also have almost completely reimplemented it in the lastyear. For example, in September of 2008 the previous implementation consistedof 9,000 lines of Java code, whereas in September of 2009 the new implementationhad 29,000 lines.
The new AgreementMaker system [1–3] supports: (1) user requirements, asexpressed by domain experts; (2) a wide range of input (ontology) and output(agreement file) formats; (3) a large choice of matching methods depending,on the different granularity of the set of components being matched (local vs.global), on different features considered in the comparison (conceptual vs. struc-tural), on the amount of intervention that they require from users (manual vs.automatic), on usage (standalone vs. composed), and on the types of componentsto consider (schema only or schema and instances); (4) improved performance,that is, accuracy (precision, recall, F-measure) and efficiency (execution time) forthe automatic methods; (5) an extensible architecture to incorporate new meth-ods easily and to tune their performance; (6) the capability to evaluate, compare,and combine different strategies and matching results; (7) a comprehensive userinterface that supports advanced visualization techniques and a control panelthat drives all the matching methods and evaluation strategies; (8) a feedbackloop that accepts suggestions and corrections by users and extrapolates newmappings.
1.1 State, purpose, general statement
AgreementMaker comprises a wide range of automatic matching algorithms calledmatchers, an extensible and modular architecture, a multi-purpose user inter-
136
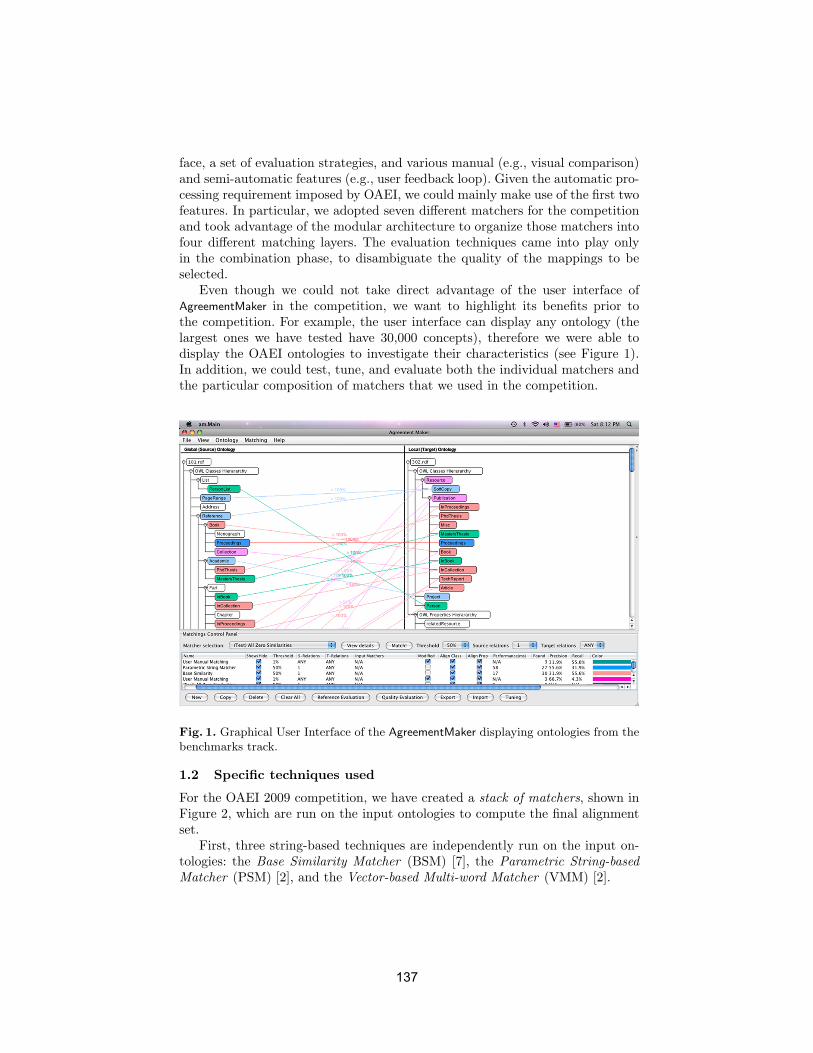
face, a set of evaluation strategies, and various manual (e.g., visual comparison)and semi-automatic features (e.g., user feedback loop). Given the automatic pro-cessing requirement imposed by OAEI, we could mainly make use of the first twofeatures. In particular, we adopted seven different matchers for the competitionand took advantage of the modular architecture to organize those matchers intofour different matching layers. The evaluation techniques came into play onlyin the combination phase, to disambiguate the quality of the mappings to beselected.
Even though we could not take direct advantage of the user interface ofAgreementMaker in the competition, we want to highlight its benefits prior tothe competition. For example, the user interface can display any ontology (thelargest ones we have tested have 30,000 concepts), therefore we were able todisplay the OAEI ontologies to investigate their characteristics (see Figure 1).In addition, we could test, tune, and evaluate both the individual matchers andthe particular composition of matchers that we used in the competition.
Fig. 1. Graphical User Interface of the AgreementMaker displaying ontologies from thebenchmarks track.
1.2 Specific techniques used
For the OAEI 2009 competition, we have created a stack of matchers, shown inFigure 2, which are run on the input ontologies to compute the final alignmentset.
First, three string-based techniques are independently run on the input on-tologies: the Base Similarity Matcher (BSM) [7], the Parametric String-basedMatcher (PSM) [2], and the Vector-based Multi-word Matcher (VMM) [2].
137
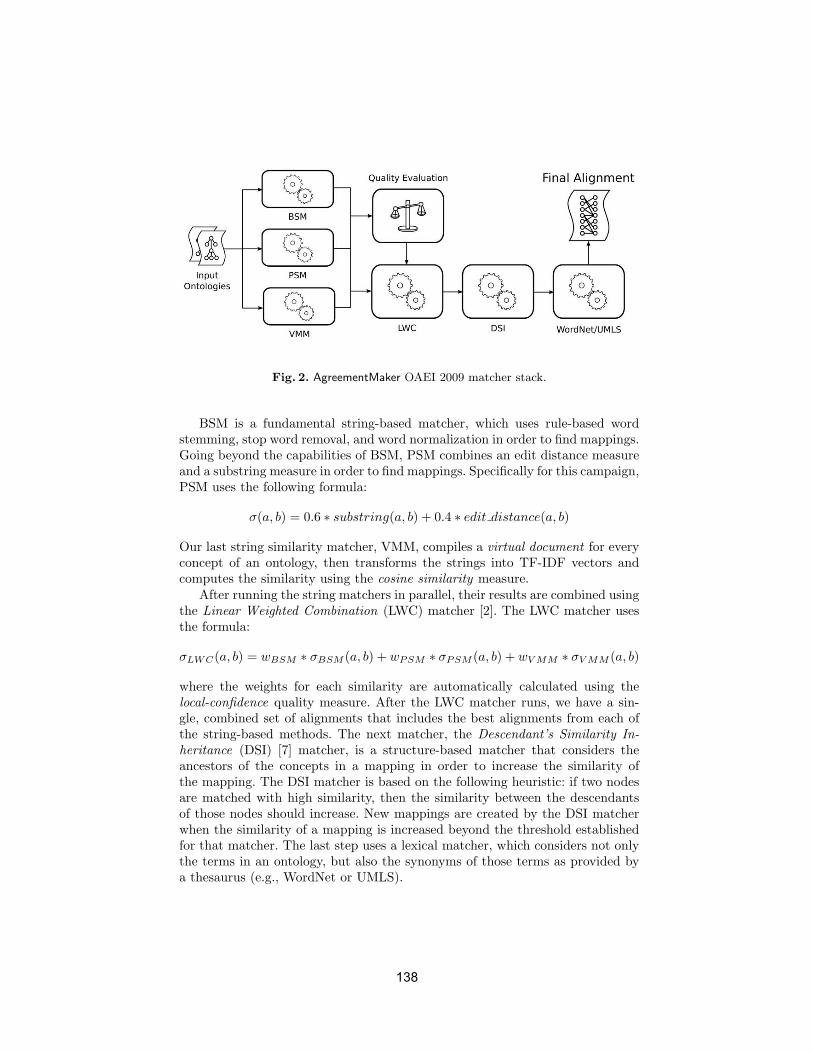
Fig. 2. AgreementMaker OAEI 2009 matcher stack.
BSM is a fundamental string-based matcher, which uses rule-based wordstemming, stop word removal, and word normalization in order to find mappings.Going beyond the capabilities of BSM, PSM combines an edit distance measureand a substring measure in order to find mappings. Specifically for this campaign,PSM uses the following formula:
σ(a, b) = 0.6 ∗ substring(a, b) + 0.4 ∗ edit distance(a, b)
Our last string similarity matcher, VMM, compiles a virtual document for everyconcept of an ontology, then transforms the strings into TF-IDF vectors andcomputes the similarity using the cosine similarity measure.
After running the string matchers in parallel, their results are combined usingthe Linear Weighted Combination (LWC) matcher [2]. The LWC matcher usesthe formula:
σLWC(a, b) = wBSM ∗ σBSM (a, b) + wPSM ∗ σPSM (a, b) + wV MM ∗ σV MM (a, b)
where the weights for each similarity are automatically calculated using thelocal-confidence quality measure. After the LWC matcher runs, we have a sin-gle, combined set of alignments that includes the best alignments from each ofthe string-based methods. The next matcher, the Descendant’s Similarity In-heritance (DSI) [7] matcher, is a structure-based matcher that considers theancestors of the concepts in a mapping in order to increase the similarity ofthe mapping. The DSI matcher is based on the following heuristic: if two nodesare matched with high similarity, then the similarity between the descendantsof those nodes should increase. New mappings are created by the DSI matcherwhen the similarity of a mapping is increased beyond the threshold establishedfor that matcher. The last step uses a lexical matcher, which considers not onlythe terms in an ontology, but also the synonyms of those terms as provided bya thesaurus (e.g., WordNet or UMLS).
138
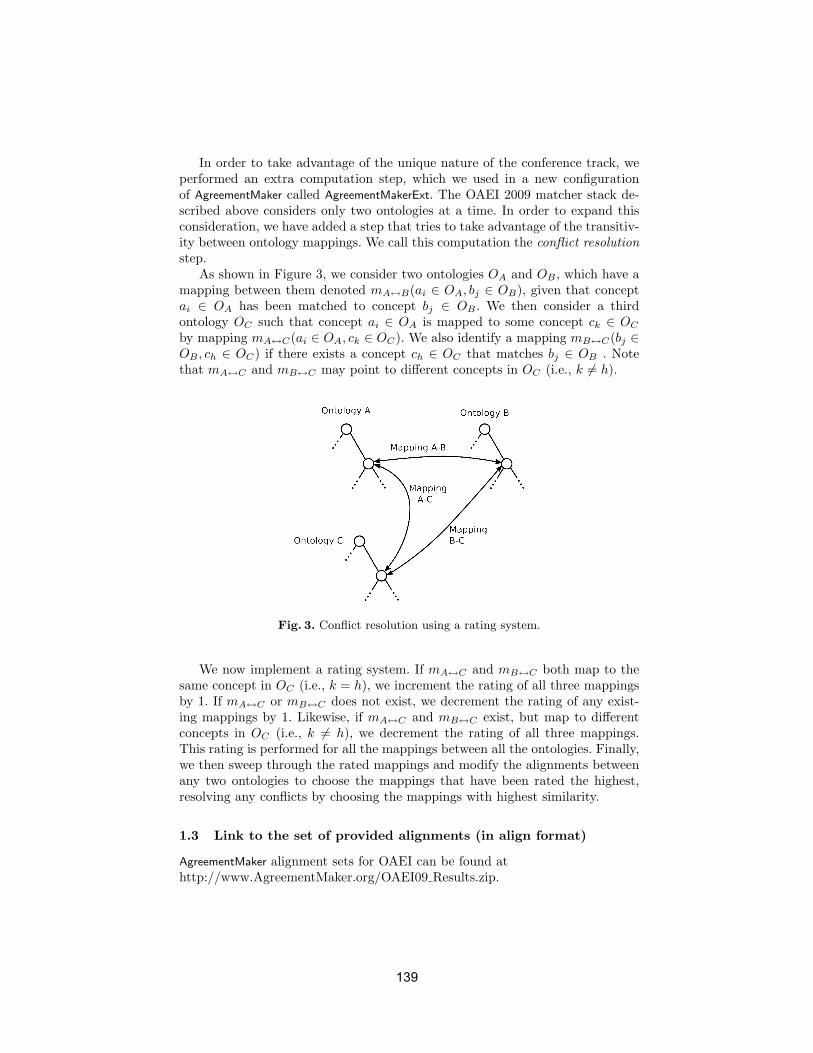
In order to take advantage of the unique nature of the conference track, weperformed an extra computation step, which we used in a new configurationof AgreementMaker called AgreementMakerExt. The OAEI 2009 matcher stack de-scribed above considers only two ontologies at a time. In order to expand thisconsideration, we have added a step that tries to take advantage of the transitiv-ity between ontology mappings. We call this computation the conflict resolutionstep.
As shown in Figure 3, we consider two ontologies OA and OB , which have amapping between them denoted mA↔B(ai ∈ OA, bj ∈ OB), given that conceptai ∈ OA has been matched to concept bj ∈ OB . We then consider a thirdontology OC such that concept ai ∈ OA is mapped to some concept ck ∈ OC
by mapping mA↔C(ai ∈ OA, ck ∈ OC). We also identify a mapping mB↔C(bj ∈OB , ch ∈ OC) if there exists a concept ch ∈ OC that matches bj ∈ OB . Notethat mA↔C and mB↔C may point to different concepts in OC (i.e., k 6= h).
Fig. 3. Conflict resolution using a rating system.
We now implement a rating system. If mA↔C and mB↔C both map to thesame concept in OC (i.e., k = h), we increment the rating of all three mappingsby 1. If mA↔C or mB↔C does not exist, we decrement the rating of any exist-ing mappings by 1. Likewise, if mA↔C and mB↔C exist, but map to differentconcepts in OC (i.e., k 6= h), we decrement the rating of all three mappings.This rating is performed for all the mappings between all the ontologies. Finally,we then sweep through the rated mappings and modify the alignments betweenany two ontologies to choose the mappings that have been rated the highest,resolving any conflicts by choosing the mappings with highest similarity.
1.3 Link to the set of provided alignments (in align format)
AgreementMaker alignment sets for OAEI can be found athttp://www.AgreementMaker.org/OAEI09 Results.zip.
139
2 Results
In this section, we present the results obtained by AgreementMaker in the OAEI2009 competition. AgreementMaker participated in three tracks: benchmarks,anatomy and conference. Tests were carried out on a PC running MicrosoftWindows Vista 64-bit with Intel Core 2 Duo 2.10 GHz processor and 4 GBRAM.
2.1 Benchmarks
In the benchmarks track, AgreementMaker uses the matchers described in Sec-tion 1.2. However, none of the lexical matchers was used in this track. Thesource ontology is compared to 111 ontologies (including the source ontology)in the same domain (bibliographic references). These ontologies can be groupedinto three categories. We describe next the results obtained in each of these threecategories as well as the overall results.
Concept test cases (1xx) There are four test cases in this category.AgreementMaker aligned the concept test cases with precision and recall equalto 98%.
Systematic test cases (2xx) For the systematic test cases, AgreementMaker
achieved an average precision equal to 98% and an average recall equal to60%. The average recall is lowered by the results of test cases in which thelabels are scrambled. This is due to AgreementMaker’s dependence on stringmappings in order to find mappings based on structure. AgreementMaker
achieved a precision in the range 94% to 100% and a recall in the range85% to 100% in the systematic test cases in which labels are not scrambled.
Real ontology test cases (3xx) For the four real ontology test cases,AgreementMaker achieved an average precision equal to 92% and an aver-age recall equal to 79%. Precision varied between 83% and 100% while recallvaried between 60% and 95%.
Overall The overall results for all the categories place AgreementMaker first withprecision equal to 99% and eighth with recall equal to 62% among thirteenparticipants.
2.2 Anatomy
The anatomy track of OAEI 2009 consists of finding alignments between twolarge real-world ontologies that are part of Open Biomedical Ontologies (OBO):the adult mouse anatomy (part of the Mouse Gene Expression Database) with2744 classes and the human anatomy (part of the National Cancer Institutethesaurus) with 3304 classes.
This track consists of four subtracks. AgreementMaker entered all four sub-tracks using the UMLS Metathesaurus as background knowledge as well as theother modules in the OAEI 2009 matcher stack (see Figure 2).
140
The reference alignment contains 1523 mappings. Of these mappings only the988 mappings that form part of the partial reference alignment for subtrack 4 areknown. We note, however, that most of those mappings (934) are the “trivial”mappings that can be found by simple string comparison techniques. Therefore,the most important challenge is in finding the non-trivial mappings. The OAEI2009 competition has released recall values for the non-trivial mappings for sub-tracks 1 and 3, and named this measure recall+. We describe next our results inthe four subtracks.
Subtrack 1 In this subtrack, participants are asked to maximize F-measure.AgreementMaker used a threshold equal to 0.60 and obtained an F-measureequal to 83.1%, ranking second among ten participants and just short of thefirst ranked system (SOBOM) with F-measure equal to 85.5% and witha wider distance to the third ranked system (RiMOM) with F-measureequal to 79.3%. AgreementMaker obtained precision equal to 86.5% and recallequal to 79.8%, which was the highest recall value of all ten participants.AgreementMaker also ranked first in recall+, which was equal to 48.9%. Theruntime was 23 minutes.
Subtrack 2 In this subtrack, participants are asked to maximize precision.AgreementMaker used a threshold equal to 0.75 and obtained precision equalto 96.7%, ranking second among seven participants and just short of the firstranked system (DSSim) with precision equal to 97.3% and with a wider dis-tance to the third ranked system (TaxoMap) with precision equal to 95.3%.The runtime was 25 minutes.
Subtrack 3 In this subtrack, participants are asked to maximize recall.AgreementMaker used a threshold equal to 0.35. This choice of thresholdcombined with the UMLS module that was used to provide backgroundknowledge resulted in our system having the highest recall among seven par-ticipants. AgreementMaker achieved recall equal to 81.5%. The second rankedsystem (Lily) had recall equal to 77.4%. AgreementMaker also ranked first inrecall+, which was equal to 55.3%. The runtime was 17 minutes.
Subtrack 4 In this subtrack, participants are asked to maximize precision, re-call, and F-measure using the mappings in a partial reference alignment,which is provided. AgreementMaker obtained the highest increase in precisionamong the four participants in this subtrack (+12.8%), significantly higherthan that of the second ranked participant (ASMOV, with +3.4%). However,for recall and F-measure it was last (-18.1% and -6.3%, respectively).
2.3 Conference
In this track, participants are asked to find all correct correspondences (equiva-lence and/or subsumption correspondences) in a collection of 15 ontologies thatdescribe a domain associated with the organization of conferences. Participantsneed to compute the set of mappings for each pair of ontologies. We note thatfor two ontologies Oi and Oj , i 6= j, once matching M(Oi, Oj) is computed, the
141
symmetric matching M(Oj , Oi) need not be computed. Therefore, 105 align-ment files need to be computed. In our case, the alignment files contained 2070individual alignments in total.
We entered the competition with two different strategies. In one of themwe used the OAEI 2009 matcher stack (see Figure 2), while in the other one,which we call AgreementMakerExt, we performed an extra computation step, whichwe described in Section 1.2. This step allows for more than two ontologies tobe considered at a time by taking advantage of transitivity among ontologymappings. We call this computation the conflict resolution step.
From the “evaluation based on reference alignment” we see thatAgreementMaker did very well overall. The alignments obtained by AgreementMaker
with a threshold equal to 0.75 were the best among the seven participating sys-tems, with precision equal to 69%, recall equal to 51%, and F-measure equal to57%. The results obtained by AgreementMakerExt were also good, but the conflictresolution step reduced precision (to 54%), which led to a reduction of F-measure(to 51%). Since our system does not produce subsumption relations, it could notbe evaluated on “restricted semantic precision and recall”. Finally, in the “evalu-ation based on manual labeling”, which rates how well the certainty of a systemcorrelates with the correctness of the mappings, 80%± 6% of the mappings thatwere rated by AgreementMaker with a similarity equal to 1.0 were correct.
2.4 Comments on the obtained results
Benchmarks. Although AgreementMaker achieved the highest precision (99%)among all thirteen participating systems, it was less successful in terms of find-ing certain kinds of mappings, thus leading to less good recall (62%). This isbecause our structural techniques depend on lexical mappings that need to befound previously. When there were no lexical similarities, as was the case withsome of the systematic test cases (2xx) where textual information was randomlymodified, structural similarities were not found.
Anatomy. In subtracks 1-3, the most difficult task consists of finding thosemappings that are non-trivial as observed in Section 2.2. Even so, AgreementMaker
did very well in these subtracks having achieved first place in subtrack 3, secondplace in the remaining two, and first place in recall for non-trivial mappings. Thekey to further improvement relies on new techniques for finding other non-trivialcorrespondences.
In subtrack 4, as indicated in the work by Lambrix and Liu [14], partialreference alignments can be used at several points in the alignment process. Weused the partial reference alignment that was provided in two ways:
1. To partition the ontologies into mappable parts so that every concept in thesource ontology is not compared to every concept in the target ontology. Wewere able to reduce the running time of our algorithms by about 75%.
2. To remove mappings that are considered incorrect. Once the mappable partsare created, we assume that given a mappable part in the source ontology
142
and its corresponding mappable part in the target ontology, concepts at thesame depth in the hierarchy match in the two mappable parts. We observethat this is especially true for ontologies that have similar structure.
Finally, partial reference alignments may be used to add undiscovered map-pings to the final alignment results. This third aspect of using the partial refer-ence alignment presents the most difficult challenges. We have not yet been ableto implement a satisfactory method for accomplishing this third task. We hopeto investigate this problem in future work.
Conference. AgreementMaker did very well on the conference track.AgreementMakerExt also did well in spite of the observed decrease in precision.In fact, the conflict resolution step decreased precision, while keeping recall al-most the same. This leads us to infer that the conflict resolution step addedwrong mappings and removed some correct mappings. We note, however, thatthe official results for this track were obtained using a partial reference matchingthat is one fifth the size of the full reference matching. The conflict resolutionstep works globally, that is, it may improve results overall, but not necessarilyfor just a “slice” of the problem; we therefore conjecture that this could providethe justification for the decrease in precision.
As for improving on the obtained results, our system ranked first with pre-cision equal to 69% and recall equal to 51%, considering a threshold equal to0.75. Precision can be further improved by understanding which mappings wereerroneously included in the alignments, thus requiring an investigation of everysingle mapping in the alignment. Unfortunately, without the reference alignmentwe can only make an educated guess about which mappings are correct or in-correct. As far as improving recall, it seems that there is semantic informationthat we are not considering when aligning the ontologies. This may have to dowith the unique nature of the conference track, in that it considers 15 ontologiesmapped against one another instead of the traditional two.
2.5 Proposed new measures
In the anatomy subtracks 2 and 3, the participants are asked to compute analignment that maximizes respectively precision (subtrack 2) and recall (subtrack3). However, results that are based solely on the maximization of precision orrecall may not be conclusive. For instance, a system could easily produce analignment with 100% precision by computing an empty set of mappings, whilean alignment containing all possible correspondences would have a 100% recall.Therefore, we suggest a different ranking system based on the use of a properlyconfigured F-measure. To define our proposal, we first consider the definition ofF-measure.
Given a set of mappings M and a reference matching R, the F-measure of Mwith respect to R is given by the following expression:
F-measure(M,R) =precision(M,R) · recall(M,R)
(1− α) · precision(M,R) + α · recall(M,R)
143
The higher the value of α ∈ [0,1], the more important is precision with respect torecall. Generally, it is set to 0.5 to get the harmonic mean of the two measures.In order to rank the matching results of the anatomy subtracks 2 and 3, wepropose that they should be measured with respect to F-measure (not precisionfor subtrack 2 and recall for subtrack 3). Therefore, α should be greater than 0.5for subtrack 2 and lower than 0.5 for subtrack 3. The value for α could be chosenby considering a ranking among the results obtained for the anatomy subtracks2 and 3 from previous years. Once that ranking is established, then the corre-sponding value of α would be given to the OAEI participants in future editionsof the competition so that they can tune their methods for that particular value.
Finally, we want to point to the fact that AgreementMaker can be used to im-port the OAEI alignments computed by any matching system in order to eval-uate precision, recall, and F-measure thus allowing for their direct comparison.In addition, AgreementMaker can evaluate structural discrepancy measures [13]and the local-confidence quality measure that we defined [2]. We further plan toimplement the incoherence-based quality measure [15].
2.6 Discussions on ways to improve the proposed system
There are several directions that we would like to explore to improveAgreementMaker. For example, we want to add matchers that rely solely on thestructure of the ontologies to find matchings. The DSI (Descendant’s SimilarityInheritance) and SSC (Sibling’s Similarity Contribution) structure-based match-ers exploit the structure of the ontology by respectively considering the conceptsthat have as descendants or siblings the concepts being matched [7, 16]. However,they first rely on similarity values computed by string-based matchers. We hopeto devise “pure” structure-based matchers that would work in the benchmarkstrack cases where AgreementMaker did not produce any mappings, even thoughthe ontologies being matched are very similar structurally.
AgreementMaker was not able to fully exploit the unique nature of the con-ference track. One way to further improve our results in the conference track isto incorporate the capabilty of extending alignments over multiple ontologies,instead of considering only two ontologies at a time.
Finally, we will further explore how to use the provided partial referencealignment in subtrack 4 of the anatomy track. In particular, we encounteredsome false negatives due to the dissimilarity in structure of the two anatomytrack ontologies. We hope to devise other techniques that circumvent this. Inaddition, we would like to use the partial reference alignment to discover non-trivial mappings.
However, we are not only focusing on automatic ontology matching. We be-lieve that involving the user in the matching process is crucial in finding themappings that are not found by automatic methods. By taking advantage ofthe multi-purpose user interface of the AgreementMaker, we have been workingon a semi-automatic matching approach that ranks concepts according to theirrelevance and presents to users the top-k most relevant concepts together with
144
the most likely mappings associated with them. In addition, our solution en-compasses a feedback loop that extrapolates new correspondences and correctswrong mappings.
3 Conclusions
In this paper we gave an overview of the new AgreementMaker system, which wasdeveloped in the last year, presented the results that this system obtained in theOAEI 2009 competition for the benchmarks, anatomy, and conference tracks,and discussed those results. We also proposed new measures for future OAEIcompetitions.
In the benchmarks track, AgreementMaker found alignments (a total of 111)for all cases. All those alignments were computed in less than 3 minutes withan overall precision equal to 99% (highest among 13 competing systems) and anoverall recall equal to 62% (eighth place).
AgreementMaker participated in all four subtracks of the anatomy track, plac-ing second in subtracks 1 and 2 and first in subtrack 3 among ten, seven, andseven participants, respectively. AgreementMaker also found the highest numberof non-trivial correspondences. In the last subtrack, subtrack 4, it achieved thehighest improvement in precision among four participants together with an im-proved execution time.
AgreementMaker was also very successful in the conference track: it achievedthe best results among seven participants, with precision equal to 69% and recallequal to 51% for a threshold equal to 0.75.
Overall, AgreementMaker exhibited an excellent performance in the OAEI 2009competition. However, the competition only tests the component ofAgreementMaker that performs automatic matchings. The automatic matchingcapabilities of AgreementMaker are just a small part of a full framework for on-tology matching, which also supports the visualization of ontologies and theevaluation of their matchings. Those matchings can also be produced manually,semi-automatically, or using an extrapolating mechanism that accepts input fromusers. Several of these components of AgreementMaker, even if not directly testedin the competition, were quite useful for “understanding” the ontologies andfor the tuning and evaluation of the matching strategies. However, we believethat there is still room for improvement and we plan to continue our quest forefficiency and effectiveness in the ontology matching process.
References
1. Isabel F. Cruz, Flavio Palandri Antonelli, and Cosmin Stroe. AgreementMaker:Efficient Matching for Large Real-World Schemas and Ontologies. PVLDB,2(2):1586–1589, 2009.
2. Isabel F. Cruz, Flavio Palandri Antonelli, and Cosmin Stroe. Efficient Selection ofMappings and Automatic Quality-driven Combination of Matching Methods. InISWC International Workshop on Ontology Matching. CEUR-WS, 2009.
145
3. Isabel F. Cruz, Flavio Palandri Antonelli, and Cosmin Stroe. Integrated OntologyMatching and Evaluation. In International Semantic Web Conference (Posters &Demos), 2009.
4. Isabel F. Cruz and Afsheen Rajendran. Exploring a New Approach to the Align-ment of Ontologies. In ISWC Workshop on Semantic Web Technologies for Search-ing and Retrieving Scientific Data, volume 83 of CEUR-WS, pages 7–12, 2003.
5. Isabel F. Cruz and Afsheen Rajendran. Semantic Data Integration in HierarchicalDomains. IEEE Intelligent Systems, March-April:66–73, 2003.
6. Isabel F. Cruz, Afsheen Rajendran, William Sunna, and Nancy Wiegand. HandlingSemantic Heterogeneities Using Declarative Agreements. In ACM InternationalSymposium on Advances in Geographic Information Systems (ACM GIS), pages168–174, 2002.
7. Isabel F. Cruz and William Sunna. Structural Alignment Methods with Appli-cations to Geospatial Ontologies. Transactions in GIS, special issue on SemanticSimilarity Measurement and Geospatial Applications, 12(6):683–711, 2008.
8. Isabel F. Cruz, William Sunna, and Anjli Chaudhry. Ontology Alignment forReal-World Applications. In National Conference on Digital Government Research(dg.o), pages 393–394, 2004.
9. Isabel F. Cruz, William Sunna, and Anjli Chaudhry. Semi-Automatic OntologyAlignment for Geospatial Data Integration. In International Conference on Geo-graphic Information Science (GIScience), volume 3234 of Lecture Notes in Com-puter Science, pages 51–66. Springer, 2004.
10. Isabel F. Cruz, William Sunna, Nalin Makar, and Sujan Bathala. A Visual Toolfor Ontology Alignment to Enable Geospatial Interoperability. Journal of VisualLanguages and Computing, 18(3):230–254, 2007.
11. Isabel F. Cruz, William G. Sunna, and Kalyan Ayloo. Concept Level Matching ofGeospatial Ontologies. In GIS Planet International Conference and Exhibition onGeographic Information, 2005.
12. Isabel F. Cruz and Huiyong Xiao. Data Integration for Querying GeospatialSources. In John Sample, Kevin Shaw, Shengru Tu, and Mahdi Abdelguerfi,editors, Geospatial Services and Applications for the Internet, pages 113–137.Springer, 2008.
13. Cliff Joslyn, Patrick Paulson, and Amanda White. Measuring the StructuralPreservation of Semantic Hierarchy Alignment. In ISWC International Workshopon Ontology Matching. CEUR-WS, 2009.
14. Patrick Lambrix and Qiang Liu. Using Partial Reference Alignments to AlignOntologies. In European Semantic Web Conference, volume 5554 of Lecture Notesin Computer Science, pages 188–202, 2009.
15. Christian Meilicke and Heiner Stuckenschmidt. Incoherence as a Basis for Mea-suring the Quality of Ontology Mappings. In ISWC International Workshop onOntology Matching, volume 431 of CEUR-WS, 2008.
16. William Sunna and Isabel F. Cruz. Structure-Based Methods to Enhance Geospa-tial Ontology Alignment. In International Conference on GeoSpatial Semantics(GeoS), volume 4853 of Lecture Notes in Computer Science, pages 82–97. Springer,2007.
146
AROMA results for OAEI 2009
Jerome David1
Universite Pierre-Mendes-France, GrenobleLaboratoire d’Informatique de Grenoble
INRIA Rhone-Alpes, Montbonnot Saint-Martin,France
Jerome.David-at-inrialpes.fr
Abstract. This paper presents the results obtained by AROMA for its secondparticipation to OAEI. AROMA is an hybrid, extensional and asymmetric on-tology alignment method that makes use of the association paradigm and a sta-tistical interestingness measure, the implication intensity. AROMA performs apost-processing step that includes a terminological matcher. This year we modifythis matcher in order to improve the recall obtained on real-case ontology, i.e.anatomy and 3xx tests.
1 Presentation of AROMA
1.1 State, purpose, general statement
AROMA is an hybrid, extensional and asymmetric matching approach designed to findout relations of equivalence and subsumption between entities, i.e. classes and prop-erties, issued from two textual taxonomies (web directories or OWL ontologies). Ourapproach makes use of the association rule paradigm [Agrawal et al., 1993], and a sta-tistical interestingness measure. AROMA relies on the following assumption: An entityAwill be more specific than or equivalent to an entityB if the vocabulary (i.e. terms andalso data) used to describe A, its descendants, and its instances tends to be included inthat of B.
1.2 Specific techniques used
AROMA is divided into three successive main stages: (1) The pre processing stagerepresents each entity, i.e. classes and properties, by a set of terms, (2) the second stageconsists of the discovery of association rules between entities, and finally (3) the postprocessing stage aims at cleaning and enhancing the resulting alignment.
The first stage constructs a set of relevant terms and/or datavalues for each classand property. To do this, we extract the vocabulary of class and property from theirannotations and individual values with the help of single and binary term extractorapplied to stemmed text. In order to keep a morphism between the partial orders of classand property subsumption hierarchies in one hand and the inclusion of sets of term inthe other hand, the terms associated with a class or a property are also associated withits ancestors.
147
The second stage of AROMA discovers the subsumption relations by using theassociation rule model and the implication intensity measure [Gras et al., 2008]. In thecontext of AROMA, an association rule a → b represents a quasi-implication (i.e. animplication allowing some counter-examples) from the vocabulary of entity a into thevocabulary of the entity b. Such a rule could be interpreted as a subsumption relationfrom the antecedent entity toward the consequent one. For example, the binary rulecar → vehicle means: ”The concept car is more specific than the concept vehicle”.The rule extraction algorithm takes advantage of the partial order structure providedby the subsumption relation, and a property of the implication intensity for pruning thesearch space.
The last stage concerns the post processing of the association rules set. It performsthe following tasks:
– deduction of equivalence relations,– suppression of cycles in the alignment graph,– suppression of redundant correspondences,– selection of the best correspondence for each entity (the alignment is an injective
function),– the enhancement of the alignment by using a string similarity -based matcher and
previously discovered correspondences.
This year, we made some changes on the string similarity -based matcher. Thesechanges are primarily designed to improve the recall on anatomy track. Now AROMAincludes an equality -based matcher: two entities are considered equivalent if they shareat least one annotation. This matcher is only applied on unaligned pairs of entities.
The string similarity based matcher still makes use of Jaro-Winkler similarity butrelies on a different weighting scheme. As an ontology entity is associated to a setof annotations, i.e. local name, labels and comments, we need a collection measurefor aggregating the similarity values between all entity pairs. Last year, we relied onmaximal weight maximal graph matching collection measure, see [David and Euzenat,2008] for details.
In order to favour the measure values of most similar annotations pairs, we chooseto use the following collection measure:
∆mw(e, e′) =
P
a∈T (e) arg maxa′∈T (e′) simjw(a,a′)2Pa∈T (e) arg maxa′∈T (e′) simjw(a,a′) if |T (e)| ≤ |T (e′)|
∆mw(e′, e) otherwise
where T (e) is the set which contains the annotations and the local name of e, and simjw
is the Jaro-Winkler similarity. For all OAEI tracks, we choose a threshold value of 0.8.For more details about AROMA, the reader should refer to [David et al., 2007;
David, 2007].
1.3 Link to the system and parameters file
The version 1.1 of AROMA has been used for OAEI2009. This version can be down-loaded at : http://gforge.inria.fr/frs/download.php/23649/AROMA-1.1.zip.
The command line used for aligning two ontologies is:
148
java -jar aroma.jar onto1.owl onto2.owl [alignfile.rdf]
The resulting alignment is provided in the alignment format.
1.4 Link to the set of provided alignments (in align format)
http://www.inrialpes.fr/exmo/people/jdavid/oaei2009/results_AROMA_oaei2009.zip
2 Results
We participated to the benchmark, anatomy and conference tracks. We used the sameconfiguration of AROMA for all tracks. We did not experience scaling problem. SinceAROMA relies on syntactical data without using any multilingual resources, it is notable to find alignment on the multilingual library track. Finally, we also did not par-ticipate either to the instance matching track since AROMA is not designed for such atask.
2.1 Benchmark
Since AROMA mainly relies on textual information, it obtains bad recall values whenthe alterations affect all text annotations both in the class/property descriptions and intheir individual/property values. AROMA does not seem to be influenced by structuralalterations ( 222-247). On these tests, AROMA favours high precision values in com-parison to recall values.
In comparison with last year, the modification made on AROMA have a limitednegative impact on 2xx tests. By contrast, the results on 3xx tests have been enhanced:from 82% of precision and 71% of recall to respectively 85% and 78%.
2.2 Anatomy
On anatomy test, we do not use any particular knowledge about biomedical domain.AROMA runs quite fast since it takes benefits of the subsumption relation for pruningthe search space. We further optimized the code since last year and now AROMA needsaround 1 min. to compute the alignment. This pruning feature used by AROMA par-tially explained the low recall values obtained last year. For this edition, we enhancedthe recall by using also an string equality based matcher before using the lexical simi-larity based matcher. Since AROMA returns not only equivalence correspondences butalso subsumption correspondences, its precision value is negatively influenced. It couldbe interesting to evaluate results by using semantic precision and recall.
3 General comments
3.1 Comments on the OAEI test cases
In this section, we give some comments on the directory and oriented matching tracksof OAEI.
149
Directory The two large directories, that were given in previous editions of OAEI,are divided into very small sub directories. AROMA cannot align such very small di-rectories because our method is based on a statistical measure and then it needs somelarge amount of textual data. However, AROMA discovers correspondences when it isapplied to the complete directories. It would be interesting to reintroduce these largetaxonomies for the next editions.
Oriented matching We did not participate to this track because we think that it is notwell designed. Indeed, the proposed reference alignments are not complete.
For example in the 303 test, the reference alignment contains:
– 101#MastersThesis ≤ 103#Academic– 103#MastersThesis ≤ 101#Academic
Obviously, no reliable matching algorithm would return these two correspondencesbut rather:
– 101#MastersThesis ≡103#MastersThesis– 101#Academic ≡ 103#Academic
In addition, from these two last correspondences, we could easily deduce the two firstones.
Our suggestion for designing a better oriented matching track would be to removesome classes and properties in the target ontologies so as to obtain complete referencealignments with some subsumption relations. For example, it would be more accurateto remove the concept MasterThesis from the ontology 103 in order to naturally change101#MastersThesis ≡103#MastersThesis by 101#MastersThesis ≤ 103#Academic inthe reference alignment.
4 Conclusion
The version of AROMA includes a new matcher based on annotation equality. Thischange allows better time efficiency because it reduces the number of unaligned enti-ties before the use of a more time consuming terminological matcher. Furthermore, weobtained better results on the 3xx tests of benchmark and tend to enhance the recallobtained on anatomy track.
References
[Agrawal et al., 1993] Rakesh Agrawal, Tomasz Imielinski, and Arun Swami. Mining associa-tion rules between sets of items in large databases. In Proceedings of the 1993 ACM SIGMODInternational Conference on Management of Data, pages 207–216. ACM Press, 1993.
[David and Euzenat, 2008] Jerome David and Jerome Euzenat. Comparison between ontologydistances (preliminary results). In Proceedings of the 7th International Semantic Web Confer-ence, volume 5318 of Lecture Notes in Computer Science, pages 245–260. Springer, 2008.
150

[David et al., 2007] Jerome David, Fabrice Guillet, and Henri Briand. Association rule ontologymatching approach. International Journal on Semantic Web and Information Systems, 3(2):27–49, 2007.
[David, 2007] Jerome David. AROMA : une methode pour la decouverte d’alignements orientesentre ontologies a partir de regles d’association. PhD thesis, Universite de Nantes, 2007.
[Gras et al., 2008] Regis Gras, Einoshin Suzuki, Fabrice Guillet, and Filippo Spagnolo, editors.Statistical Implicative Analysis, Theory and Applications, volume 127 of Studies in Computa-tional Intelligence. Springer, 2008.
151
ASMOV: Results for OAEI 2009
Yves R. Jean-Mary1, E. Patrick Shironoshita1, Mansur R. Kabuka 1,2
1 INFOTECH Soft, 1201 Brickell Ave., Suite 220, Miami, Florida, USA 33131
2 University of Miami, Coral Gables, Florida, USA 33124 {reggie, kabuka}@infotechsoft.com
Abstract. The Automated Semantic Mapping of Ontologies with Validation
(ASMOV) algorithm for ontology alignment was one of the top performing
algorithms in the 2007 and 2008 Ontology Alignment Evaluation Initiative
(OAEI) contests. In this paper, we present a brief overview of the algorithm and
its improvements, followed by an analysis of its results on the 2009 OAEI tests.
1 Presentation of the System
In recent years, ontology alignment has become popular in solving interoperability
issues across heterogonous systems in the semantic web. Though many techniques
have emerged from the literature [1], the distinction between them is accentuated by
the manner in which they exploit the ontology features. ASMOV, an algorithm that
automates the ontology alignment process, uses a weighted average of measurements
of similarity along four different features of ontologies, obtains a pre-alignment based
on these measurements, and then semantically verifies this alignment to ensure that it
does not contain semantic inconsistencies. A more complete description of ASMOV
is presented in [3].
1.1 State, Purpose, General Statement
ASMOV is an automatic ontology matching tool which has been designed in order to
facilitate the integration of heterogeneous data sources modeled as ontologies. The
current ASMOV implementation produces mappings between concepts, properties,
and individuals, including mappings between object and datatype properties.
1.2 Specific Techniques Used
The ASMOV algorithm iteratively calculates the similarity between entities for a pair
of ontologies by analyzing four features: lexical elements (id, label, and comments),
relational structure (ancestor-descendant hierarchy), internal structure (property
restrictions for concepts; types, domains, and ranges for properties; data values for
individuals), and extension (instances of classes and property values). The measures
obtained by comparing these four features are combined into a single value using a
152
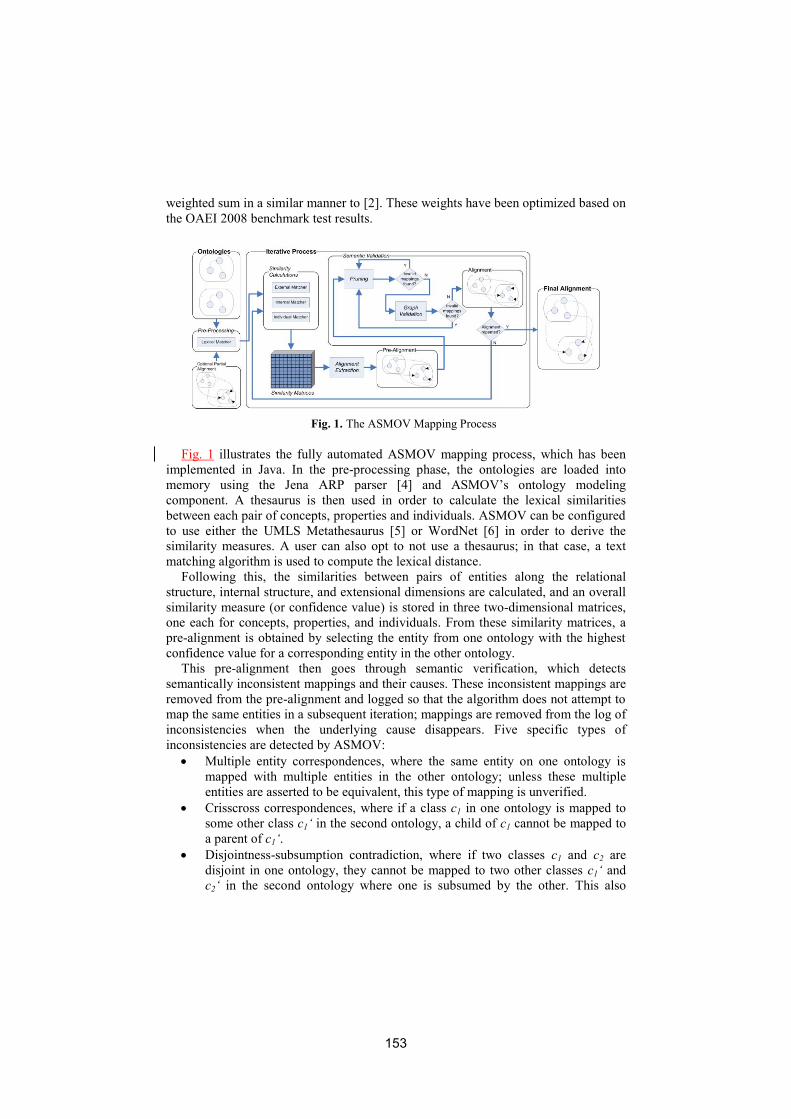
weighted sum in a similar manner to [2]. These weights have been optimized based on
the OAEI 2008 benchmark test results.
Fig. 1. The ASMOV Mapping Process
Fig. 1 illustrates the fully automated ASMOV mapping process, which has been
implemented in Java. In the pre-processing phase, the ontologies are loaded into
memory using the Jena ARP parser [4] and ASMOV’s ontology modeling
component. A thesaurus is then used in order to calculate the lexical similarities
between each pair of concepts, properties and individuals. ASMOV can be configured
to use either the UMLS Metathesaurus [5] or WordNet [6] in order to derive the
similarity measures. A user can also opt to not use a thesaurus; in that case, a text
matching algorithm is used to compute the lexical distance.
Following this, the similarities between pairs of entities along the relational
structure, internal structure, and extensional dimensions are calculated, and an overall
similarity measure (or confidence value) is stored in three two-dimensional matrices,
one each for concepts, properties, and individuals. From these similarity matrices, a
pre-alignment is obtained by selecting the entity from one ontology with the highest
confidence value for a corresponding entity in the other ontology.
This pre-alignment then goes through semantic verification, which detects
semantically inconsistent mappings and their causes. These inconsistent mappings are
removed from the pre-alignment and logged so that the algorithm does not attempt to
map the same entities in a subsequent iteration; mappings are removed from the log of
inconsistencies when the underlying cause disappears. Five specific types of
inconsistencies are detected by ASMOV:
Multiple entity correspondences, where the same entity on one ontology is
mapped with multiple entities in the other ontology; unless these multiple
entities are asserted to be equivalent, this type of mapping is unverified.
Crisscross correspondences, where if a class c1 in one ontology is mapped to
some other class c1‘ in the second ontology, a child of c1 cannot be mapped to
a parent of c1‘.
Disjointness-subsumption contradiction, where if two classes c1 and c2 are
disjoint in one ontology, they cannot be mapped to two other classes c1‘ and
c2‘ in the second ontology where one is subsumed by the other. This also
153
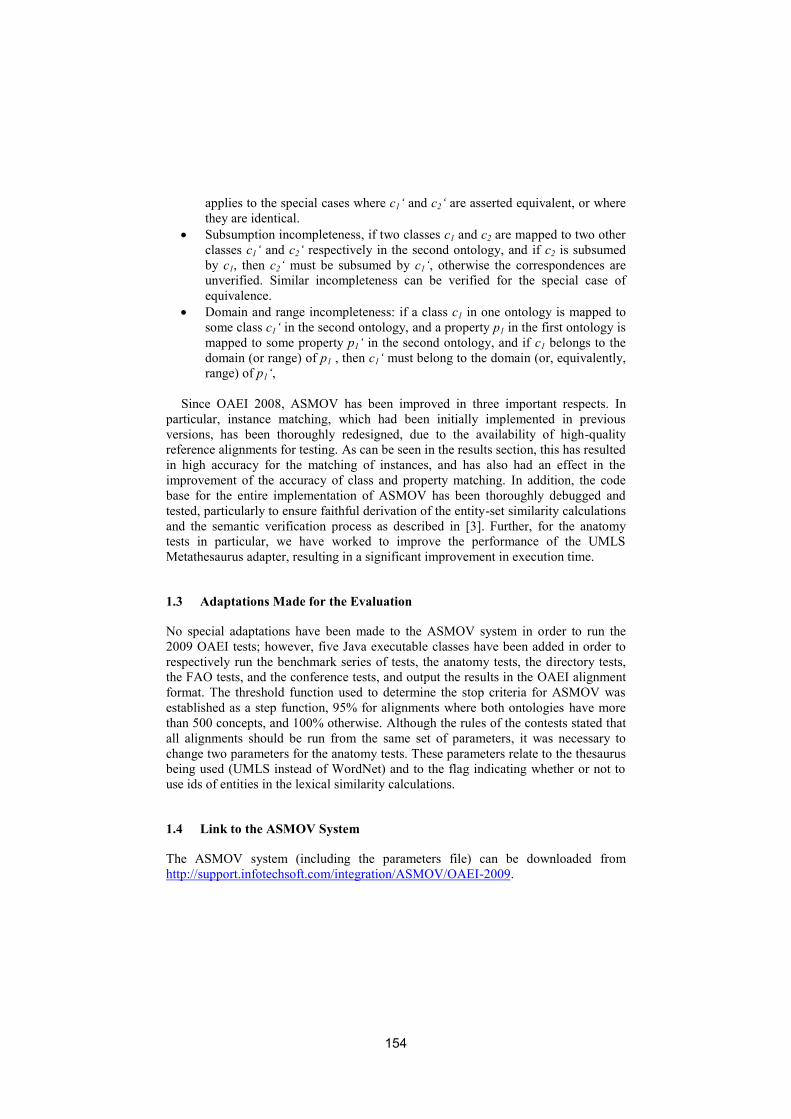
applies to the special cases where c1‘ and c2‘ are asserted equivalent, or where
they are identical.
Subsumption incompleteness, if two classes c1 and c2 are mapped to two other
classes c1‘ and c2‘ respectively in the second ontology, and if c2 is subsumed
by c1, then c2‘ must be subsumed by c1‘, otherwise the correspondences are
unverified. Similar incompleteness can be verified for the special case of
equivalence.
Domain and range incompleteness: if a class c1 in one ontology is mapped to
some class c1‘ in the second ontology, and a property p1 in the first ontology is
mapped to some property p1‘ in the second ontology, and if c1 belongs to the
domain (or range) of p1 , then c1‘ must belong to the domain (or, equivalently,
range) of p1‘,
Since OAEI 2008, ASMOV has been improved in three important respects. In
particular, instance matching, which had been initially implemented in previous
versions, has been thoroughly redesigned, due to the availability of high-quality
reference alignments for testing. As can be seen in the results section, this has resulted
in high accuracy for the matching of instances, and has also had an effect in the
improvement of the accuracy of class and property matching. In addition, the code
base for the entire implementation of ASMOV has been thoroughly debugged and
tested, particularly to ensure faithful derivation of the entity-set similarity calculations
and the semantic verification process as described in [3]. Further, for the anatomy
tests in particular, we have worked to improve the performance of the UMLS
Metathesaurus adapter, resulting in a significant improvement in execution time.
1.3 Adaptations Made for the Evaluation
No special adaptations have been made to the ASMOV system in order to run the
2009 OAEI tests; however, five Java executable classes have been added in order to
respectively run the benchmark series of tests, the anatomy tests, the directory tests,
the FAO tests, and the conference tests, and output the results in the OAEI alignment
format. The threshold function used to determine the stop criteria for ASMOV was
established as a step function, 95% for alignments where both ontologies have more
than 500 concepts, and 100% otherwise. Although the rules of the contests stated that
all alignments should be run from the same set of parameters, it was necessary to
change two parameters for the anatomy tests. These parameters relate to the thesaurus
being used (UMLS instead of WordNet) and to the flag indicating whether or not to
use ids of entities in the lexical similarity calculations.
1.4 Link to the ASMOV System
The ASMOV system (including the parameters file) can be downloaded from
http://support.infotechsoft.com/integration/ASMOV/OAEI-2009.
154
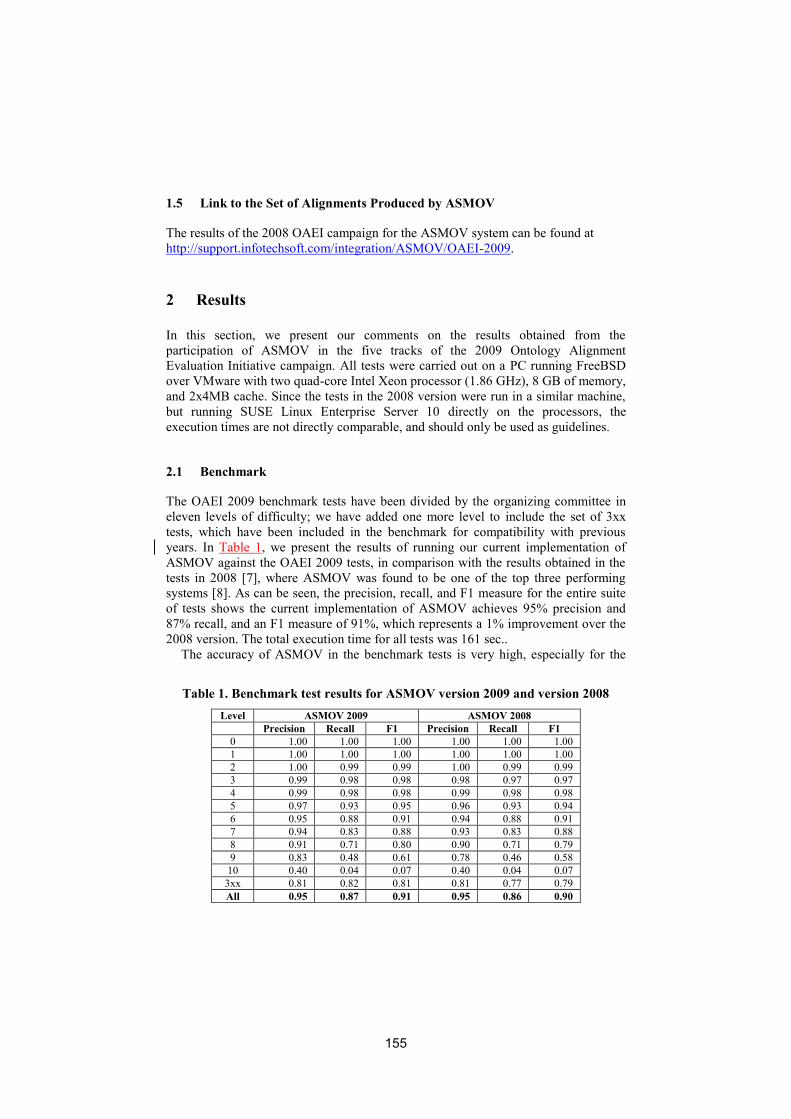
1.5 Link to the Set of Alignments Produced by ASMOV
The results of the 2008 OAEI campaign for the ASMOV system can be found at
http://support.infotechsoft.com/integration/ASMOV/OAEI-2009.
2 Results
In this section, we present our comments on the results obtained from the
participation of ASMOV in the five tracks of the 2009 Ontology Alignment
Evaluation Initiative campaign. All tests were carried out on a PC running FreeBSD
over VMware with two quad-core Intel Xeon processor (1.86 GHz), 8 GB of memory,
and 2x4MB cache. Since the tests in the 2008 version were run in a similar machine,
but running SUSE Linux Enterprise Server 10 directly on the processors, the
execution times are not directly comparable, and should only be used as guidelines.
2.1 Benchmark
The OAEI 2009 benchmark tests have been divided by the organizing committee in
eleven levels of difficulty; we have added one more level to include the set of 3xx
tests, which have been included in the benchmark for compatibility with previous
years. In Table 1, we present the results of running our current implementation of
ASMOV against the OAEI 2009 tests, in comparison with the results obtained in the
tests in 2008 [7], where ASMOV was found to be one of the top three performing
systems [8]. As can be seen, the precision, recall, and F1 measure for the entire suite
of tests shows the current implementation of ASMOV achieves 95% precision and
87% recall, and an F1 measure of 91%, which represents a 1% improvement over the
2008 version. The total execution time for all tests was 161 sec..
The accuracy of ASMOV in the benchmark tests is very high, especially for the
Table 1. Benchmark test results for ASMOV version 2009 and version 2008
Level ASMOV 2009 ASMOV 2008
Precision Recall F1 Precision Recall F1
0 1.00 1.00 1.00 1.00 1.00 1.00
1 1.00 1.00 1.00 1.00 1.00 1.00
2 1.00 0.99 0.99 1.00 0.99 0.99
3 0.99 0.98 0.98 0.98 0.97 0.97
4 0.99 0.98 0.98 0.99 0.98 0.98
5 0.97 0.93 0.95 0.96 0.93 0.94
6 0.95 0.88 0.91 0.94 0.88 0.91
7 0.94 0.83 0.88 0.93 0.83 0.88
8 0.91 0.71 0.80 0.90 0.71 0.79
9 0.83 0.48 0.61 0.78 0.46 0.58
10 0.40 0.04 0.07 0.40 0.04 0.07
3xx 0.81 0.82 0.81 0.81 0.77 0.79
All 0.95 0.87 0.91 0.95 0.86 0.90
155
lowest levels of difficulty. It is particularly noteworthy that improvements in both
precision and recall were obtained especially at higher levels, with the largest
improvement within level 9, the second most difficult. We attribute these
improvements mostly to the standardization of the entity-set similarity calculation, as
well as to the correction of some coding errors. There is also significant improvement,
especially in recall, in testing with the real-world ontologies.
2.2 Anatomy
For the anatomy track, ASMOV uses the UMLS Metathesaurus [5] instead of
WordNet in order to more accurately compute the lexical distance between medical
concepts. Importantly, improvement in execution time of more than one order of
magnitude, for all tests, was achieved by pre-indexing the UMLS Metathesaurus. In
addition, the lexical similarity calculation between concept names (ids) is ignored as
instructed by the track organizers. ASMOV produces an alignment for all four
subtasks of this track:
1. Optimal solution: The optimal solution alignment is obtained by using the default
parameter settings of ASMOV. It finds 1235 correct and 49 incorrect mappings
from the partial alignment, Its total execution time was 4.1 minutes, an order of
magnitude improvement over 2008, when it took almost 4 hours.
2. Optimal precision: The alignment with optimal precision is obtained by changing
the threshold for valid mappings from 0% to 30%. This means that only
mappings with confidences greater or equal to 0.3 make it to the alignment. This
finds 1,187 correct and only 30 incorrect mappings.from the partial alignment
The time cost for the generation of this alignment was 2.7 minutes, compared to 3
hours and 50 minutes in 2008.
3. Optimal recall: The alignment with optimal recall is generated by using a
threshold of 0% and turning off the semantic verification process, to allow more
mappings to form part of the final alignment. Under this setup, 1278 correct
mappings and 55 incorrect mappings from the partial alignment are found. it took
4.4 minutes to execute, as opposed the 2008 execution time of 5 hours and 54
minutes.
4. Extended solution: The alignment, using the same setup as the optimal solution
but with the partial alignment given as input, was obtained in 2.51 min.
2.3 Conference
This collection of tests dealing with conference organization contains 15 ontologies.
ASMOV is able to generate all 105 potential alignments from those ontologies, as
opposed to 2008 when only 75 alignments were processed. The overall time required
to process all 105 correspondences was 187 seconds.
156
2.4 Directory
The directory tests were completed in 2.75 minutes for all 4639 tasks involved; this is
in the same order of magnitude as the 2008 version. A manual analysis of a small
sample of the correspondences found in these tests shows that a number of possibly
erroneous correspondences found by ASMOV have a very low, but non-zero,
confidence value. We therefore expect that the reported accuracy of ASMOV will
suffer as a result. Note that the tests were run without setting a confidence value
threshold, in compliance with the indication that all tracks be run with the same set of
parameters; the use of a threshold would eliminate many of these potentially
erroneous correspondences.
2.5 Oriented matching
We have performed gold-standard based evaluation on the Artificial Ontologies
Corpus, derived from the benchmark series corpus of 2006 (a subset of the current
benchmark series); due to time constraints, it was not possible to obtain results for the
Real World Ontologies Corpus, In the Artificial Ontologies Corpus, ASMOV obtains
an overall accuracy of 90% precision and 89% recall; in several of the simpler tests,
ASMOV finds 100% precision and recall; some reduction in accuracy is observed for
the more difficult tests. The execution time for these tests was 75.7 sec.
2.6 Instance Matching
Previous versions of ASMOV contained mechanisms for instance matching based on
the same principles as for class and property matching, as outlined in [3]. However,
the lack of a gold standard had precluded us from performing rigorous testing on
these procedures. With the availability of the instance matching track in OAEI 2009,
we have been able to test and improve our algorithms.
The performance of ASMOV in the set of IIMB instance matching tests is quite
good, achieving an overall precision very close to 100% and overall recall of 98%.
Perfect results are obtained for all the value transformation tests (002-010), as well as
for the logical transformation tests (020-029). For the structural transformation tests,
slight reductions in accuracy, especially in recall, are found for tests 015, 016, 017,
and 019. This slight decrease results from conditions where the best match for an
instance in one ontology cannot be chosen from among two or more alternatives in
the other ontology; in these cases, ASMOV prefers to not make a selection. The same
condition affects the result of test 031.The execution time for all 37 tests was 28 min.
15 sec.; the comparatively longer time is due to the large number of entities in each
Abox.
Of the remainder of the instance matching tests, memory consumption issues
prevented us from running most of the tests. The only test that could be run was to
align the ePrints and Rexa ontologies; this test took 5.7 secs., to execute. The results
from this test, and a manual analysis of some results, show that it is necessary to
157
improve some aspects of instance matching, such as the matching of names where
either the first or last name is inserted first in the label of an instance. This also shows
that it is necessary to improve the scalability of ASMOV when very large ontologies
are being aligned.
3 General Comments
3.1 Comments on the Results
The current version of ASMOV has shown improvement overall in recall and F1
measure with respect to the results obtained last year. This is significant since the
results in 2008 were already very high. Particularly important is the fact that the
improvements have been obtained within some of the most difficult tests, showing the
versatility of ASMOV in finding alignments under various conditions. The high
accuracy results from the IIMB instance matching tests also show the capability of
ASMOV in these tasks. In the anatomy tests, an improvement in execution time of
more than one order of magnitude was obtained, and we also expect that the accuracy
of the results should have increased with respect to 2008.
3.2 Discussions on the Way to Improve ASMOV
ASMOV still needs to improve its ability to work with very large ontologies and
resources. The current implementation of the algorithm utilizes a memory-based
approach, where the entire contents of the ontologies are loaded in memory prior to
performing the matching process. This process needs to be modified to use permanent
storage in order to enable the alignment of very large ontologies. Also, we have
started to work on parallelization of the algorithm, by creating separate threads of
execution; however, this was still not fully implemented by the time of participation
in this contest. In addition, we are also working in the improvement of the general
scalability of the ASMOV algorithm for the processing of ontologies with a large
number of entities.
3.3 Comments on the OAEI 2009 Test Cases
The new tests added to the OAEI 2009 contests provide important and welcome tools
for the improvement of ontology matching systems. Most importantly, with the
availability of the instance matching tests and gold standards, and particularly the
IIMB benchmarks, we have been able to redesign and thoroughly test the procedures
and algorithms coded for the matching of individuals. This has resulted in a much
improved version of instance matching for ASMOV. Similarly, the availability of
subsumption benchmarks have also allowed us to test the corresponding algorithms.
On the other hand, the continuity in the benchmark, anatomy, and conference tracks
158
allows us to evaluate the improvement of our algorithm and implementation as we
proceed through its development.
We think it would be advantageous to count with additional gold standards for
other alignments, so that the algorithms may be tested, debugged, and improved for a
wider variety of conditions. Particularly, we would suggest that subsets of the mouse
anatomy and NCI Thesaurus ontologies could be derived and a reference alignment
provided for these subsets.
4 Conclusion
We have presented a brief description of an automated alignment tool named
ASMOV, analyzed its performance at the 2009 Ontology Alignment Evaluation
Initiative campaign, and compared it with its 2008 version. The test results show that
ASMOV is effective in the ontology alignment realm, and because of its versatility, it
performs well in multiple ontology domains such as bibliographic references
(benchmark tests) and the biomedical domain (anatomy test). The tests results also
showed that ASMOV is a practical tool for real-world applications that require on-
the-fly alignments of ontologies.
Acknowledgments. This work is funded by the National Institutes of Health (NIH)
under grant R43RR018667. The authors also wish to acknowledge the contribution of
Michael Ryan, Ray Bradley, and Thomas Taylor of INFOTECH Soft, Inc.
References
1. Euzenat J and Shvaiko P. Ontology Matching. Springer-Verlag, Berlin Heidelberg, 2007.
2. Euzenat J. and Valtchev P. Similarity-based ontology alignment in OWL-lite. In Proc. 15th
ECAI, Valencia (ES), 2004, 333-337.
3. Jean-Mary Y., Shironoshita E.P., Kabuka, M. Ontology Matching with Semantic
Verification. Web Semantics: Science, Services and Agents on the World Wide Web.
http://dx.doi.org/10.1016/j.websem.2009.04.001.
4. Jena from HP Labs http://www.hpl.hp.com/semweb/
5. Unified Medical Language System (UMLS) http://umlsks.nlm.nih.gov/
6. WordNet http://wordnet.princeton.edu/
7. Jean-Mary Y, Kabuka M. ASMOV: Results for OAEI 2008.
http://www.dit.unitn.it/~p2p/OM-2008/oaei08_paper3.pdf. Accessed 28 Sept 2009.
8. Euzenat J, et.al. Results of the Ontology Alignment Evaluation Initiative 2007.
http://www.dit.unitn.it/~p2p/OM-2007/0-o-oaei2007.pdf. Accessed 24 Sept 2008.
9. Mike Dean and Guus Schreiber, Editors, W3C Recommendation, 10 February 2004,
http://www.w3.org/TR/owl-ref/
159
DSSim Results for OAEI 2009
Miklos Nagy1, Maria Vargas-Vera1, and Piotr Stolarski2
1 The Open UniversityWalton Hall, Milton Keynes, MK7 6AA, United Kingdom
[email protected];[email protected] Poznan University of Economics
al. Niepodleglosci 10, 60-967 Poznan, [email protected]
Abstract. The growing importance of ontology mapping on the Semantic Webhas highlighted the need to manage the uncertain nature of interpreting semanticmeta data represented by heterogeneous ontologies. Considering this uncertaintyone can potentially improve the ontology mapping precision, which can lead tobetter acceptance of systems that operate in this environment. Further the ap-plication of different techniques like computational linguistics or belief conflictresolution that can contribute the development of better mapping algorithms arerequired in order to process the incomplete and inconsistent information used andproduced during any mapping algorithm. In this paper we introduce our systemcalled “DSSim” and describe the improvements that we have made compared toOAEI 2006, OAEI 2007 and OAEI 2008.
1 Presentation of the system
1.1 State, purpose, general statement
Ontology mapping systems need to interpret heterogeneous data in order to simulate“machine intelligence”, which is a driving force behind theSemantic Web. This impliesthat computer programs can achieve a certain degree of understanding of such data anduse it to reason about a user specific task like question answering or data integration.In practice there are several roadblocks[1] that hamper thedevelopment of mappingsolutions that perform equally well for different domains.Additionally the differentcombination of these challenges needs to be addressed in order to design systems thatprovides good quality results. Since DSSim has been originally designed in 2005 it hasprogressively evolved in order to address the combination of the 5 following challenges:
– Representation and interpretation problems: Ontology designers have a wide vari-ety of languages and language variants to choose from in order to represent theirdomain knowledge. From the logical representation point ofview each representa-tions are valid separately and no logical reasoner would findinconsistency in themindividually. However the problem occurs once we need to compare ontologies withdifferent representations in order to determine the similarities between classes andindividuals. Consider for example one ontology where the labels are described withstandard classrdfs:label tag and an another ontology where the same is described
160
ashasNameScientificdata property. As a result of these representation differencesontology mapping systems will always need to consider the uncertain aspects ofhow the semantic web data can be interpreted.
– Quality of the Semantic Web data: For every organisation or individual the contextof the data, which is published can be slightly different depending on how theywant to use their data. Therefore from the exchange point of view incompletenessof a particular data is quite common. The problem is that fragmented data envi-ronments like the Semantic Web inevitably lead to data and information qualityproblems causing the applications that process this data deal with ill-defined inac-curate or inconsistent information on the domain. The incomplete data can meandifferent things to data consumer and data producer in a given application scenario.Therefore applications itself need to have built in mechanisms to decide and reasonabout whether the data is accurate, usable and useful in essence, whether it willdeliver good information and function well for the requiredpurpose.
– Efficient mapping with large scale ontologies: Ontologies can get quite complexand very large, causing difficulties in using them for any application. This is es-pecially true for ontology mapping where overcoming scalability issues becomesone of the decisive factors for determining the usefulness of a system. Nowadayswith the rapid development of ontology applications, domain ontologies can be-came very large in scale. This can partly be contributed to the fact that a numberof general knowledge bases or lexical databases have been and will be transformedinto ontologies in order to support more applications on theSemantic Web. As aconsequence applications need to scale well in case huge ontologies need to beprocessed.
– Task specific vs. generic systems: Existing mapping systemscan clearly be classi-fied into two categories. First group includes domain specific systems, which arebuild around well defined domains e.g. medical, scientific etc. These systems usespecific rules, heuristics or background knowledge. As a consequence domain spe-cific systems perform well on their own domain but their performance deteriorateacross different domains. As a result the practical applicability of these systems onthe Semantic Web can easily be questioned. The second group includes systemsthat aims to perform equally well across different domains.These systems utilisegeneric methods e.g. uncertain reasoning, machine learning, similarity combinationetc. These systems has the potential to support a wide variety of applications on theSemantic Web in the future.Based on this classification it is clear that the building generic systems that performequally well on different domains and provide acceptable results is a considerablechallenge for the future research.
– Incorporating intelligence: To date the quality of the ontology mapping was consid-ered to be an important factor for systems that need to produce mappings betweendifferent ontologies. However competitions organised on ontology mapping hasdemonstrated that even if systems use a wide variety techniques, it is difficult topush the mapping quality beyond certain limits. It has also been recognised [2] thatin order to gain better user acceptance, systems need to introduce cognitive supportfor the users i.e. reduce the difficulty of understanding thepresented mappings.There are different aspects of this cognitive support i.e. how to present the end
161
results, how to explain the reasoning behind the mapping, etc. Ongoing researchfocuses on how the end results can be represented in a way thatend users can under-stand better the complex relations of large-scale ontologies. Consider for examplea mapping representation between two ontologies with over 10.000 concepts each.The result file can contain thousands of mappings. To visualise this mapping ex-isting interfaces will most likely present an unrecognizable web of connections be-tween these properties. Even though this complex representation can be presentedin a way that users could better understand the problem stillarises once the usersneed to understand why actually these mappings have been selected. This aspect sofar has totally been hidden from the end users and has formed an internal and un-expoitable part of mapping systems itself. Nevertheless inorder to further improvethe quality of the mapping systems these intermediary details need to be exposedto the users who can actually judge if the certain reasoning process is flawed or not.This important feedback or the ability to introspect can then be exploited by thesystem designers or ultimately the system itself through improving the reasoningprocesses, which is carried out behind the scenes in order toproduce the end results.This ability to introspect the internal reasoning steps is afundamental componentof how human beings reason, learn and adapt. However, many existing ontologymapping systems that use different forms of reasoning exclude the possibility ofintrospection because their design does not allow a representation of their own rea-soning procedures as data. Using a model of reasoning based on observable effectit is possible to test the ability of any given data structureto represent reasoning.Through such a model we present a minimal data structure[3] necessary to recorda computable reasoning process and define the operations that can be performedon this representation to facilitate computer reasoning. This model facilitates theintroduction and development of basic operations, which perform reasoning tasksusing data recorded in this format. It is necessary that we define a formal descrip-tion of the structures and operations to facilitate reasoning on the application ofstored reasoning procedures. By the help of such framework provable assertionsabout the nature and the limits of numerical reasoning can bemade.
As a result from the mapping point of view ontologies will always contain incon-sistencies, missing or overlapping elements and differentconceptualisation of the sameterms, which introduces a considerable amount of uncertainty into the mapping pro-cess. In order to represent and reason with this uncertaintyauthors (Vargas-Vera andNagy) have proposed a multi agent ontology mapping framework [4], which uses theDempster-Shafer [5] theory in the context of Question Answering. Since our first propo-sition[6] of such solution in 2005 we have gradually developed and investigated mul-tiple components of such system and participated in the OAEIin order to validate thefeasibility of our proposed solution. Fortunately during the recent years our originalconcept has received attention from other researchers [7, 8], which helps to broaden thegeneral knowledge on this area. We have investigated different aspects of our originalidea namely the feasibility of belief combination[9] and the resolution of conflicting be-liefs [10] over the belief in the correctness of similarities using the fuzzy voting model.A comprehensive description of the Fuzzy voting model can befound [10]. For thiscontest (OAEI 2009) the benchmarks, anatomy, directory, iimb, vlcr , Eprints-Rexa-
162
Sweto/DBLP benchmark and conference tracks had been testedwith this new versionof DSSim (v0.4).
1.2 Specific techniques used
This year within the tasks preparing the results for conference track we focused mainlyon improvements and fine-tuning the algorithms for obtaining better effects in termsof both precision and recall. Moreover in order to conform tothe extended terms ofthe track - we additionally implemented a simple enhancement for supplying subsump-tion correspondences as the DSSim system allowed only detection of equivalence be-tween ontological entities. Below we will cover both types of changes more thoroughly.The first type of mentioned changes concentrates on improvements made to the com-pound nouns comparison method introduced in the last year’sversion of the system.The presented compound nouns comparison method deals with interpretation of com-pound nouns based on earlier works done in - among others - language understanding aswell as question-answering and machine translation. The essence of the method focuseson establishing the semantic relations between items of compound nouns. During thedevelopment we reviewed some of the most interesting approaches [11] [12] [13]. Al-though all of them should be regarded as partial solutions, they manifest a good startingpoint for our experiments. Most of the cases uses either manually created rules [11] ormachine learning techniques [12] in order to automaticallybuild classification rules thatwill enable to rate any given compound noun phrase into one ofa set of pre-selected se-mantic relations which best reflects the sense and nature of that phrase. We extended theinitial set of simple rules by additional ones. We also made the rule engine more flexi-ble so as it the semantic relation categories can now be assessed not only on the basisof comments or labels but also their id names. This last option is useful in some casesidentified earlier in the analysis stage of the last year’s results. Finally we extended alsothe set of semantic relation categories itself by another few categories. The compoundnouns semantic relation detection algorithm is used in DSSim system as a determiner ofsuch relations within ontology entities’ identifiers, labels or comments. After the rela-tion r1,n has been classified independently for entities in the first ofaligned ontologiesO1 andr2,m separately for entities form the other ontologyO2, the alignments maybe produced between the entities fromO1 andO2 on the basis of similarity betweenthe relationsr1,n andr2,m itself. In order to eliminate the drawbacks of this approachthe algorithm is viewed as a helper rather than independent factor of alignment estab-lishment process. Nevertheless, because of the superb, multi-criterion architecture ofthe DSSim [14] such approach to the algorithm fits especiallywell allowing easy inte-gration. As the number of elements in the set of isolated semantic relations is usuallylimited only to very general ones, the probability of detecting the same or similar re-lations is subjectively high, therefore the method itself is rather sensitive to the sizeof the set. Thus this year innovations concentrated on extending the rules and supply-ing another important categories. Moving on to another typeof changes, we called thesubsumption detection facility a simple one as it in fact does not alter the DSSim sys-tem algorithms to cover other types of correspondences. On the contrast the facility inthis year’s shape uses the results of the algorithm itself topost-produce the possibleweaker (non-equivalent) correspondences basing on the algorithm result set. In order
163
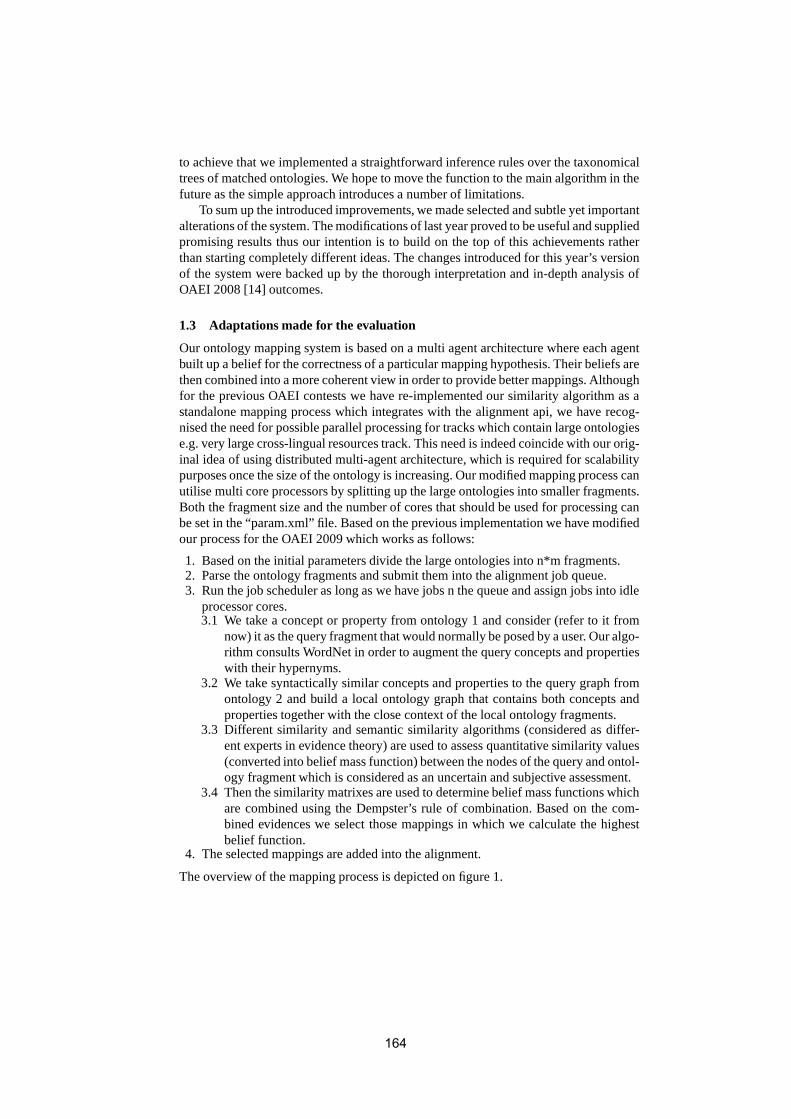
to achieve that we implemented a straightforward inferencerules over the taxonomicaltrees of matched ontologies. We hope to move the function to the main algorithm in thefuture as the simple approach introduces a number of limitations.
To sum up the introduced improvements, we made selected and subtle yet importantalterations of the system. The modifications of last year proved to be useful and suppliedpromising results thus our intention is to build on the top ofthis achievements ratherthan starting completely different ideas. The changes introduced for this year’s versionof the system were backed up by the thorough interpretation and in-depth analysis ofOAEI 2008 [14] outcomes.
1.3 Adaptations made for the evaluation
Our ontology mapping system is based on a multi agent architecture where each agentbuilt up a belief for the correctness of a particular mappinghypothesis. Their beliefs arethen combined into a more coherent view in order to provide better mappings. Althoughfor the previous OAEI contests we have re-implemented our similarity algorithm as astandalone mapping process which integrates with the alignment api, we have recog-nised the need for possible parallel processing for tracks which contain large ontologiese.g. very large cross-lingual resources track. This need isindeed coincide with our orig-inal idea of using distributed multi-agent architecture, which is required for scalabilitypurposes once the size of the ontology is increasing. Our modified mapping process canutilise multi core processors by splitting up the large ontologies into smaller fragments.Both the fragment size and the number of cores that should be used for processing canbe set in the “param.xml” file. Based on the previous implementation we have modifiedour process for the OAEI 2009 which works as follows:
1. Based on the initial parameters divide the large ontologies into n*m fragments.2. Parse the ontology fragments and submit them into the alignment job queue.3. Run the job scheduler as long as we have jobs n the queue and assign jobs into idle
processor cores.3.1 We take a concept or property from ontology 1 and consider(refer to it from
now) it as the query fragment that would normally be posed by auser. Our algo-rithm consults WordNet in order to augment the query concepts and propertieswith their hypernyms.
3.2 We take syntactically similar concepts and properties to the query graph fromontology 2 and build a local ontology graph that contains both concepts andproperties together with the close context of the local ontology fragments.
3.3 Different similarity and semantic similarity algorithms (considered as differ-ent experts in evidence theory) are used to assess quantitative similarity values(converted into belief mass function) between the nodes of the query and ontol-ogy fragment which is considered as an uncertain and subjective assessment.
3.4 Then the similarity matrixes are used to determine belief mass functions whichare combined using the Dempster’s rule of combination. Based on the com-bined evidences we select those mappings in which we calculate the highestbelief function.
4. The selected mappings are added into the alignment.
The overview of the mapping process is depicted on figure 1.
164
Fig. 1. The mapping process on a dual-core processor
1.4 Link to the system and parameters file
http://kmi.open.ac.uk/people/miklos/OAEI2009/tools/DSSim.zip
1.5 Link to the set of provided alignments (in align format)
http://kmi.open.ac.uk/people/miklos/OAEI2009/results/DSSim.zip
2 Results
2.1 benchmark
Our algorithm has produced the same results as last year. Theweakness of our systemto provide good mappings when only semantic similarity can be exploited is the directconsequence of our mapping architecture. At the moment we are using four mappingagents where 3 carries our syntactic similarity comparisons and only 1 is specialised insemantics. However it is worth to note that our approach seems to be stable comparedto our last years performance, as our precision recall values were similar in spite ofthe fact that more and more difficult tests have been introduced in this year. As ourarchitecture is easily expandable with adding more mappingagents it is possible toenhance our semantic mapping performance in the future. Theoverall conclusion isthat our system produces stable quality mappings, which is good however we still see
165
room for improvements. Based on the 2009 results the averageprecision(0.97) cannotbe improved significantly however considerable improvements can be made from therecall(0.66) point of view. According to the benchmarks tests our system need to beimproved for cases, which contain systematic: scrambled labels + no comments + nohierarchy and systematic: scrambled labels + no comments + expanded hierarchy + noinstance.
2.2 anatomy
The anatomy track contains two reasonable sized real world ontologies. Both the AdultMouse Anatomy (2.744 classes) and the NCI Thesaurus (3.304 classes) describes anatom-ical concepts. The classes are represented with standard owl:Class tags with properrdfs:label tags. Our mapping algorithm has used the labels to establish syntactic simi-larity and has used the rdfs:subClassOf tags to establish semantic similarities betweenclass hierarchies. We could not make use of the owl:Restriction and oboInOwl: has-RelatedSynonym tags as this would require ontology specificadditions. The anatomytrack represented a number of challenges for our system. Firstly the real word medicalontologies contain classes like “outer renal medulla peritubular capillary”, which can-not be easily interpreted without domain specific background knowledge. Secondly oneontology describes humans and the second describes mice. Tofind semantically cor-rect mappings between them requires deep understanding of the domain. The run timeper test was around 10 min, which is an improvement compared to last year. Further wehave realised significant improvement both in terms of precision and recall compared tothe last year’s results. Our system ranks in the middle positions out of 10 participatingsystems.
2.3 Eprints-Rexa-Sweto/DBLP benchmark
This track has posed serious challenge for our system. SwetoDblp is a large-size on-tology containing bibliography data of Computer Science publications where the maindata source is DBLP. It contains around 1.5 million terms including 560.792 persons,561.895 Articles in Proceedings. The eprints and rexa ontologies were large but man-ageable from our system’s perspective. Based on the preliminary results our system didnot perform well in terms of precision and recall. The reasons needs to be investigatedfurther. The run time including the SweetoDblp ontology wasover 1 week. In spite ofthe fact that it was a new and difficult track this year we were disappointed with ouroverall results. The performance can be due to the fact that our system was originallyconceived as mapping system that does not use extensively instances for establishingthe mapping. As a result where only instances are present outsystem does not performas well as in the other tracks.
2.4 directory
The directory test as well has been manageable in terms of execution time. In generalthe large number of small-scale ontologies made it possibleto verify some mappings for
166
some cases. The tests contain only classes without any labels but in some cases differentclasses have been combined into one class e.g. “NewsandMedia” that introduces cer-tain level of complexity for determining synonyms using anybackground knowledge.To address these difficulties we have used a compound noun algorithms described insection 1.2. The execution time was around 15 minutes. In this track our performancewas stable compared to the results in 2008. In terms of precision our system compareswell to the other participating systems however improvements can be made from therecall point of view.
2.5 IIMB
This track contains generated benchmarks constituted using one dataset and modifyingit according to various criterias. The main directory contains 37 classes and about 200different instances. Each class contains a modified sub directory and the correspond-ing mapping with the instances. The different modificationsintroduced to the originalontology included identical copy of the original sub classes where the instance IDs arerandomly changed, value transformations, structural transformations, logical transfor-mations and several combinations of the previous transformations. The IIMB track waswell manageable in terms of run time as it took under 10 minutes to run the 37 differ-ent tests. Similarly to the the task (on instance matching) described in section 2.3 oursystem under performed on the IIMB track. The reason for thiscan be attributed to thesame reasons described in the E-prints-Rexa-Sweto/DBLP section.
2.6 vlcr
This vlcr track contains 3 large ontologies. The GTAA thesaurus is a Dutch publicaudiovisual broadcasts archive, for indexing their documents, contains around 3.800subject keywords, 97.000 persons, 27.000 names and 14.000 locations. The DBPediais an extremely rich dataset. It contains 2.18 million resources or ”things”, each tied toan article in the English language Wikipedia. The ”things” are described by titles andabstracts in English and often also in Dutch. We have converted the original format intostandard SKOS in order to use it in our system. However we haveconverted only thelabels in English and in Dutch whenever it was available. Thethird resource was theWordNet 2.0 in SKOS format where the synsets are instances rather than classes. In oursystem the WordNet 3.0 is included into as background knowledge therefore we haveconverted the original noun-synsets into a standard SKOS format and used our WordNet3.0 as background knowledge. The run time of the track was over 1 week. Fortunatelythis year an other system also participated in this track therefore we can establish aqualitative comparison. In terms of precision our system performs well (name-dblp,subject-wn, location-wn, name-wn) however in certain tasks like location-dblp, person-dblp our system performs slightly worst compared to the other participating system. Interms of recall our system does not perform as well as we have expected, therefore thisshould be improved for the following years.
167
2.7 conferences
This test set is made up of collection of 15 real-case ontologies dealing with the do-main of conference organization. Although all the ontologies are well embedded in thedescribed field, nevertheless they are heterogeneous in their nature. This heterogeneitycomes mainly from: designed ontology application type, ontology expressivity in termsof formalism, and robustness. Out of given 15 ontologies theproduction of alignmentsshould result in 210 possible combinations (we treat the equivalent alignment as sym-metric). However, we obtained 91 non-empty alignment files in the generation. Fromthe performance point of view the alignments took about 1 hour 20 minutes on a dualcore computer3.
3 General comments
3.1 Discussions on the way to improve the proposed system
This year some tracks proved really difficult to work with. The new library track con-tains ontologies in different languages and due to its size first or during the mapping atranslation needs to be carried out. This can be a challenge itself due to the number ofconcepts involved. Therefore from the background knowledge point of view we haveconcluded that based on the latest results that the additional multi lingual and domainsspecific background knowledge could provide added value forimproving both recalland precision of the system.
3.2 Comments on the OAEI 2009 procedure
The OAEI procedure and the provided alignment api works verywell out of the boxfor the benchmarks, IIMB, anatomy, directory and conference tracks. However for theEprints-Rexa-Sweto/DBLP benchmark and vlcr and track we had to develop an SKOSparser, which can be integrated into the alignment api. Our SKOS parser convert SKOSfile to OWL, which is then processed using the alignment api. Additionally we havedeveloped a multi threaded chunk SKOS parser which can process SKOS file iterativelyin chunks avoiding memory problems. For both Eprints-Rexa-Sweto/DBLP benchmarkand vlcr tracks we had to develop several conversion and merging utility as the originalfile formats were not easily processable.
3.3 Comments on the OAEI 2009 test cases
We have found that most of the benchmark tests can be used effectively to test variousaspects of an ontology mapping system since it provides bothreal word and gener-ated/modified ontologies. The ontologies in the benchmark are conceived in a way thatallows anyone to clearly identify system strengths and weaknesses which is an impor-tant advantage when future improvements have to be identified. The anatomy, librarytests are perfect to verify the additional domain specific ormulti-lingual domain knowl-edge. Unfortunately this year we could not integrate our system with such backgroundknowledge so the results are not as good as we expected.
3 Intel dual Core 3,0GHz, 512MB
168
4 Conclusion
Based on the experience gained during OAEI 2006, 2007, 2008 and 2009 we had apossibility to realise a measurable evolution in our ontology mapping algorithm andtest it with 7 different mapping tracks. Our main objective is to improve the mappingprecision with managing the inherent uncertainty of any mapping process and informa-tion in the different ontologies. The different formalismsof the ontologies suggest thaton the Semantic Web there is a need to qualitatively compare and evaluate the differentmapping algorithms. Participating in the Ontology Alignment Evaluation Initiative is anexcellent opportunity to test and compare our system with other solutions and helped agreat deal identifying the future possibilities that needsto be investigated further.
References
1. Shvaiko, P., Euzenat, J.: Ten challenges for ontology matching. Technical Report DISI-08-042, University of Trento (2008)
2. Falconer, S.M., Storey, M.A.D.: A cognitive support framework for ontology mapping. In:Proceedings of 6th International Semantic Web Conference (ISWC2007). (2007) 114–127
3. Nagy, M., Vargas-Vera, M.: Reasoning representation andvisualisation framework for on-tology mapping using 3d modelling. In: In Proceedings of the4th edition of the Interdisci-plinary in Engineering International Conference (Inter-Eng 2009). (2009)
4. Nagy, M., Vargas-Vera, M., Motta, E.: Dssim - managing uncertainty on the semantic web.In: Proceedings of the 2nd International Workshop on Ontology Matching. (2007)
5. Shafer, G.: A Mathematical Theory of Evidence. (1976)6. Nagy, M., Vargas-Vera, M., Motta, E.: Multi agent ontology mapping framework in the aqua
question answering system. In: International Mexican Conference on Artificial Intelligence(MICAI-2005). (2005)
7. Besana, P.: A framework for combining ontology and schemamatchers with dempster-shafer(poster). In: Proceedings of the International Workshop onOntology Matching. (2006)
8. Yaghlane, B.B., Laamari, N.: Owl-cm: Owl combining matcher based on belief functionstheory. In: Proceedings of the 2nd International Workshop on Ontology Matching. (2007)
9. Nagy, M., Vargas-Vera, M., Motta, E.: Feasible uncertainreasoning for multi agent ontologymapping. In: IADIS International Conference-Informatics2008. (2008)
10. Nagy, M., Vargas-Vera, M., Motta, E.: Managing conflicting beliefs with fuzzy trust onthe semantic web. In: The 7th Mexican International Conference on Artificial Intelligence(MICAI 2008). (2008)
11. Turney, P.D.: Similarity of semantic relations. Computational Linguistics32(3) (2006) 379–416
12. Kim, S.N., Baldwin, T.: Interpreting semantic relations in noun compounds via verb se-mantics. In: Proceedings of the COLING/ACL on Main conference poster sessions. (2006)491–498
13. Banerjee, S., Pedersen, T.: Extended gloss overlaps as ameasure of semantic relatedness.In: Proceedings of the Eighteenth International Joint Conference on Artificial Intelligence.(2003) 805–810
14. Nagy, M., Vargas-Vera, M., Stolarski, P.: Dssim resultsfor oaei 2008. In: Proceedings of the3rd International Workshop on Ontology Matching. (2008)
169
Results of GeRoMeSuite for OAEI 2009
Christoph Quix, Sandra Geisler, David Kensche, Xiang Li
Informatik 5 (Information Systems)RWTH Aachen University, Germany
http://www.dbis.rwth-aachen.de
Abstract. GeRoMeSuite is a generic model management system which providesseveral functions for managing complex data models, such as schema integration,definition and execution of schema mappings, model transformation, and match-ing. The system uses the generic metamodel GeRoMe for representing models,and because of this, it is able to deal with models in various modeling languagessuch as XML Schema, OWL, ER, and relational schemas.A component for schema matching and ontology alignment is also part of thesystem. After the first participation in OAEI last year, and having established thebasic infrastructure for the evaluation, we could focus this year on the improve-ment of the matching system. Among others, we implemented several new matchstrategies, such as an instance matcher and a validation method for alignments.
1 Presentation of the system
Manipulation of models and mappings is a common task in the design and develop-ment of information systems. Research in Model Management aims at supporting thesetasks by providing a set of operators to manipulate models and mappings. As a frame-work, GeRoMeSuite [6] provides an environment to simplify the implementation ofmodel management operators. GeRoMeSuite is based on the generic role based meta-model GeRoMe [5], which represents models from different modeling languages (suchas XML Schema, OWL, SQL) in a generic way. Thereby, the management of modelsin a polymorphic fashion is enabled, i.e. the same operator implementations are usedregardless of the original modeling language of the schemas. In addition to providinga framework for model management, GeRoMeSuite implements several fundamentaloperators such as Match [11], Merge [10], and Compose [8].
The matching component of GeRoMeSuite has been described in more detail in[11], where we present and discuss in particular the results for heterogeneous matchingtasks (e.g. matching XML Schema and OWL ontologies). An overview of the completeGeRoMeSuite system is given in [6].
1.1 State, purpose, general statement
As a generic model management tool, GeRoMeSuite provides several matchers whichcan be used for matching models in general, i.e. our tool is not restricted to a partic-ular domain or modeling language. Therefore, the tool provides several well known
170
matching strategies, such as string matchers, Similarity Flooding [9], children and par-ent matchers, matchers using WordNet, etc. In order to enable the flexible combinationof these basic matching technologies, matching strategies combining several matcherscan be configured in a graphical user interface.
Because of its generic approach, GeRoMeSuite is well suited for matching tasksacross heterogeneous modeling languages, such as matching XML Schema with OWL.We discussed in [11] that the use of a generic metamodel, which represents the seman-tics of the models to be matched in detail, is more advantageous for such heterogeneousmatching tasks than a simple graph representation.
Furthermore, GeRoMeSuite is a holistic model management and not limited to schemamatching or ontology alignment. It supports also other model management tasks such asschema integration [10], model transformation [4], mapping execution and composition[7, 8].
1.2 Specific techniques used
The basis of GeRoMeSuite is the representation of models (including ontologies) in thegeneric metamodel GeRoMe. Any kind of model is transformed first into the genericrepresentation, then the model management operators can be applied to the genericrepresentation. The main advantage of this approach is that operators have to be im-plemented only once for the generic representation. In contrast to other (matching) ap-proaches which use a graph representation without detailed semantics, our approach isbased on the semantically rich metamodel GeRoMe which is able to represent modelingfeatures in detail.
For the OAEI campaign, we focused on improving our matchers for the specialcase of ontology alignment, e.g. we added some features which are useful for match-ing ontologies. For example, the generic representation of models allows the traversalof models in several different ways. During the tests with the OAEI tasks, we realizedthat, in contrast to other modeling languages, traversing the ontologies using anotherstructure than class hierarchy is not beneficial. Therefore, we configured most of ourmatchers that take the model structure into account just to work with the class hierar-chy. Furthermore, we implemented so called ‘children’ and ‘parent’ matchers, whichpropagate the similarity of elements up and down in the class hierarchy.
For OAEI 2009, we added also an Instance Matcher, which uses instances to de-termine the similarity of classes and properties. Due to the flexibility and extensibilityof our matching framework, the implementation of an additional matcher can be donewith only a few lines of code. Basically, we just need to choose a traversal strategywhich includes instances, apply one of the existing string matchers, and then choose anappropriate structural matcher to propagate the similarity of the instances to classes andproperties.
In addition to last year, we also experimented with another string matcher whichbased on the SecondString library (http://secondstring.sourceforge.net/,[1]). The library provides several different string distance metrics which can be com-bined in various ways. The combination of ‘soft’ tokenization, TF-IDF based weightingof tokens, and the classical Jaro/Winkler string metric (called Soft-TFIDF) has showngood results in string matching tasks [1]. However, for the benchmarks track, we did
171
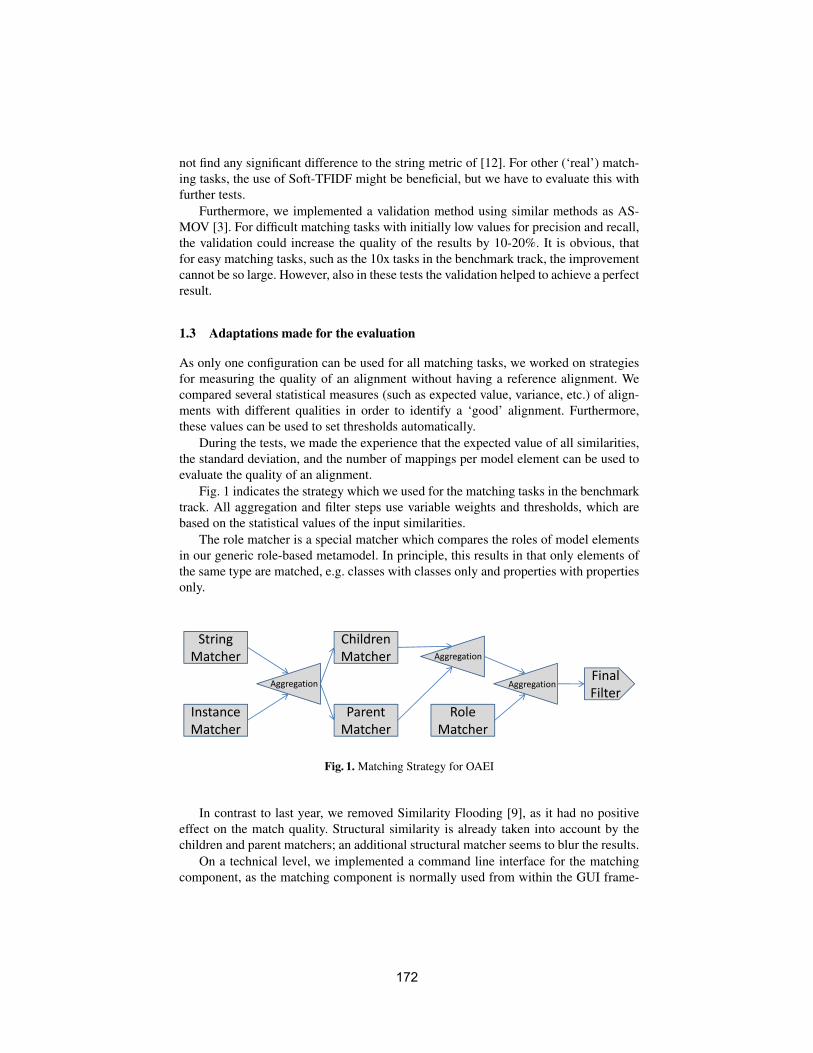
not find any significant difference to the string metric of [12]. For other (‘real’) match-ing tasks, the use of Soft-TFIDF might be beneficial, but we have to evaluate this withfurther tests.
Furthermore, we implemented a validation method using similar methods as AS-MOV [3]. For difficult matching tasks with initially low values for precision and recall,the validation could increase the quality of the results by 10-20%. It is obvious, thatfor easy matching tasks, such as the 10x tasks in the benchmark track, the improvementcannot be so large. However, also in these tests the validation helped to achieve a perfectresult.
1.3 Adaptations made for the evaluation
As only one configuration can be used for all matching tasks, we worked on strategiesfor measuring the quality of an alignment without having a reference alignment. Wecompared several statistical measures (such as expected value, variance, etc.) of align-ments with different qualities in order to identify a ‘good’ alignment. Furthermore,these values can be used to set thresholds automatically.
During the tests, we made the experience that the expected value of all similarities,the standard deviation, and the number of mappings per model element can be used toevaluate the quality of an alignment.
Fig. 1 indicates the strategy which we used for the matching tasks in the benchmarktrack. All aggregation and filter steps use variable weights and thresholds, which arebased on the statistical values of the input similarities.
The role matcher is a special matcher which compares the roles of model elementsin our generic role-based metamodel. In principle, this results in that only elements ofthe same type are matched, e.g. classes with classes only and properties with propertiesonly.
String ChildrengMatcher Matcher Aggregation
AggregationFinalFilter
Aggregation
ParentMatcher
RoleMatcher
InstanceMatcher
Fig. 1. Matching Strategy for OAEI
In contrast to last year, we removed Similarity Flooding [9], as it had no positiveeffect on the match quality. Structural similarity is already taken into account by thechildren and parent matchers; an additional structural matcher seems to blur the results.
On a technical level, we implemented a command line interface for the matchingcomponent, as the matching component is normally used from within the GUI frame-
172
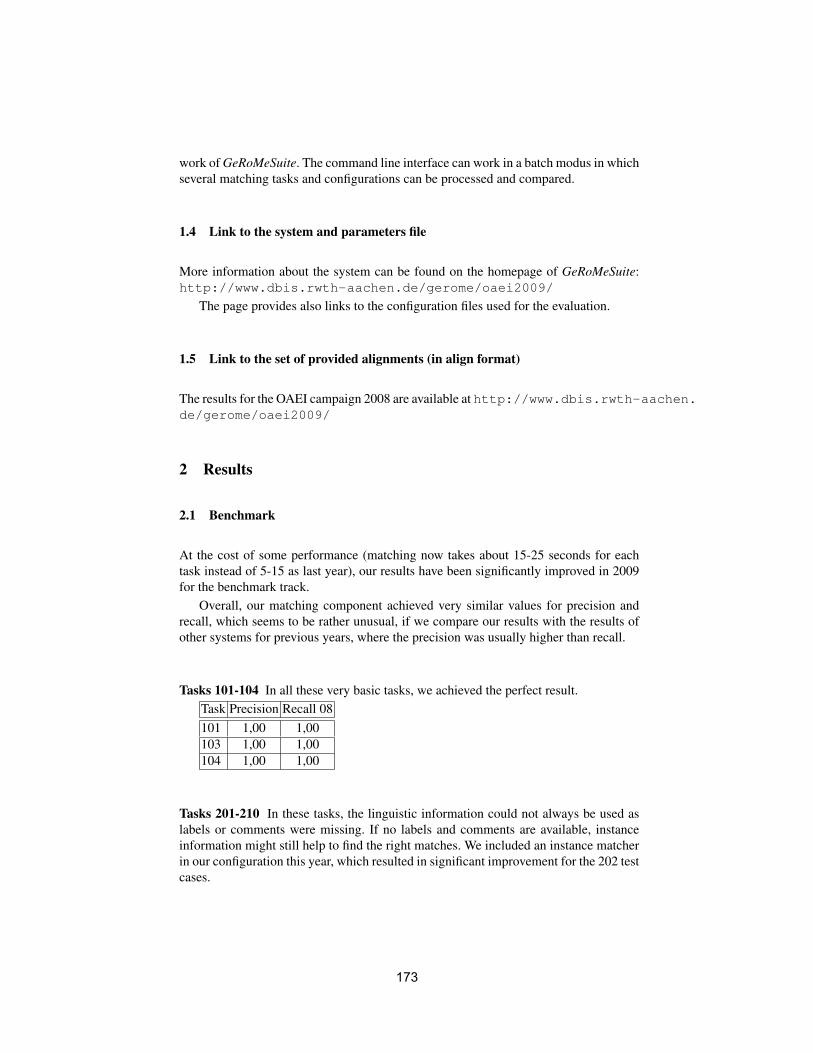
work of GeRoMeSuite. The command line interface can work in a batch modus in whichseveral matching tasks and configurations can be processed and compared.
1.4 Link to the system and parameters file
More information about the system can be found on the homepage of GeRoMeSuite:http://www.dbis.rwth-aachen.de/gerome/oaei2009/
The page provides also links to the configuration files used for the evaluation.
1.5 Link to the set of provided alignments (in align format)
The results for the OAEI campaign 2008 are available at http://www.dbis.rwth-aachen.de/gerome/oaei2009/
2 Results
2.1 Benchmark
At the cost of some performance (matching now takes about 15-25 seconds for eachtask instead of 5-15 as last year), our results have been significantly improved in 2009for the benchmark track.
Overall, our matching component achieved very similar values for precision andrecall, which seems to be rather unusual, if we compare our results with the results ofother systems for previous years, where the precision was usually higher than recall.
Tasks 101-104 In all these very basic tasks, we achieved the perfect result.Task Precision Recall 08101 1,00 1,00103 1,00 1,00104 1,00 1,00
Tasks 201-210 In these tasks, the linguistic information could not always be used aslabels or comments were missing. If no labels and comments are available, instanceinformation might still help to find the right matches. We included an instance matcherin our configuration this year, which resulted in significant improvement for the 202 testcases.
173
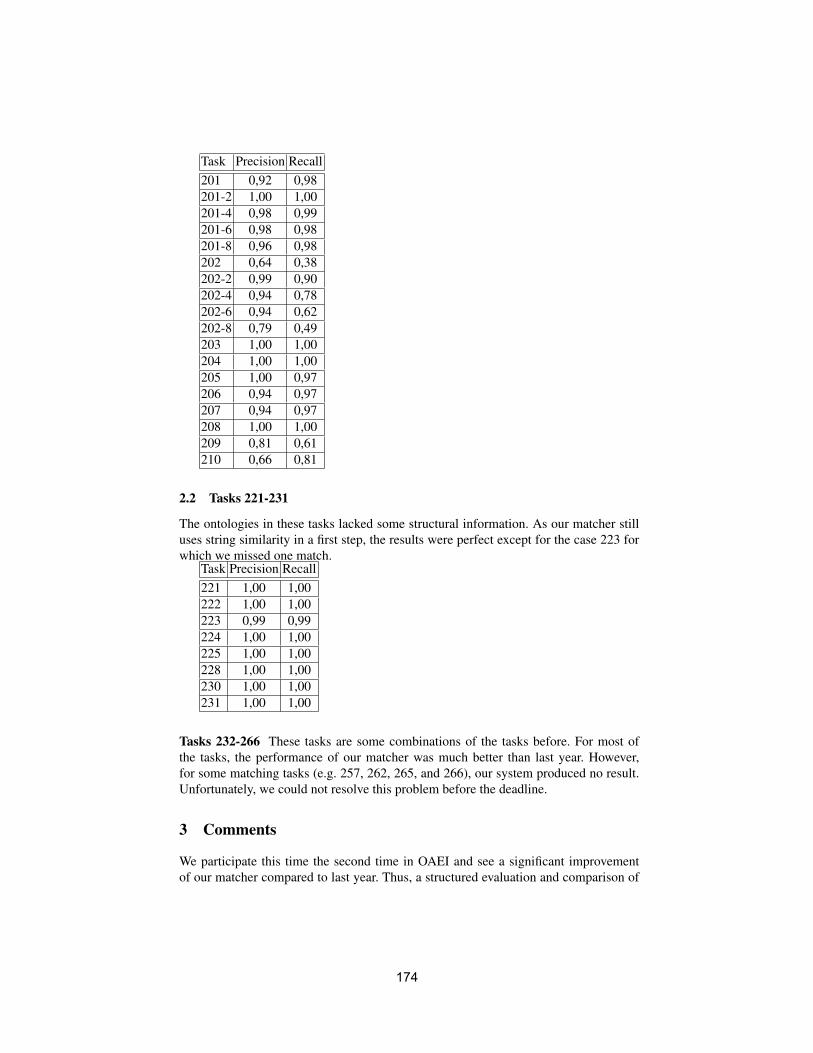
Task Precision Recall201 0,92 0,98201-2 1,00 1,00201-4 0,98 0,99201-6 0,98 0,98201-8 0,96 0,98202 0,64 0,38202-2 0,99 0,90202-4 0,94 0,78202-6 0,94 0,62202-8 0,79 0,49203 1,00 1,00204 1,00 1,00205 1,00 0,97206 0,94 0,97207 0,94 0,97208 1,00 1,00209 0,81 0,61210 0,66 0,81
2.2 Tasks 221-231
The ontologies in these tasks lacked some structural information. As our matcher stilluses string similarity in a first step, the results were perfect except for the case 223 forwhich we missed one match.
Task Precision Recall221 1,00 1,00222 1,00 1,00223 0,99 0,99224 1,00 1,00225 1,00 1,00228 1,00 1,00230 1,00 1,00231 1,00 1,00
Tasks 232-266 These tasks are some combinations of the tasks before. For most ofthe tasks, the performance of our matcher was much better than last year. However,for some matching tasks (e.g. 257, 262, 265, and 266), our system produced no result.Unfortunately, we could not resolve this problem before the deadline.
3 Comments
We participate this time the second time in OAEI and see a significant improvementof our matcher compared to last year. Thus, a structured evaluation and comparison of
174
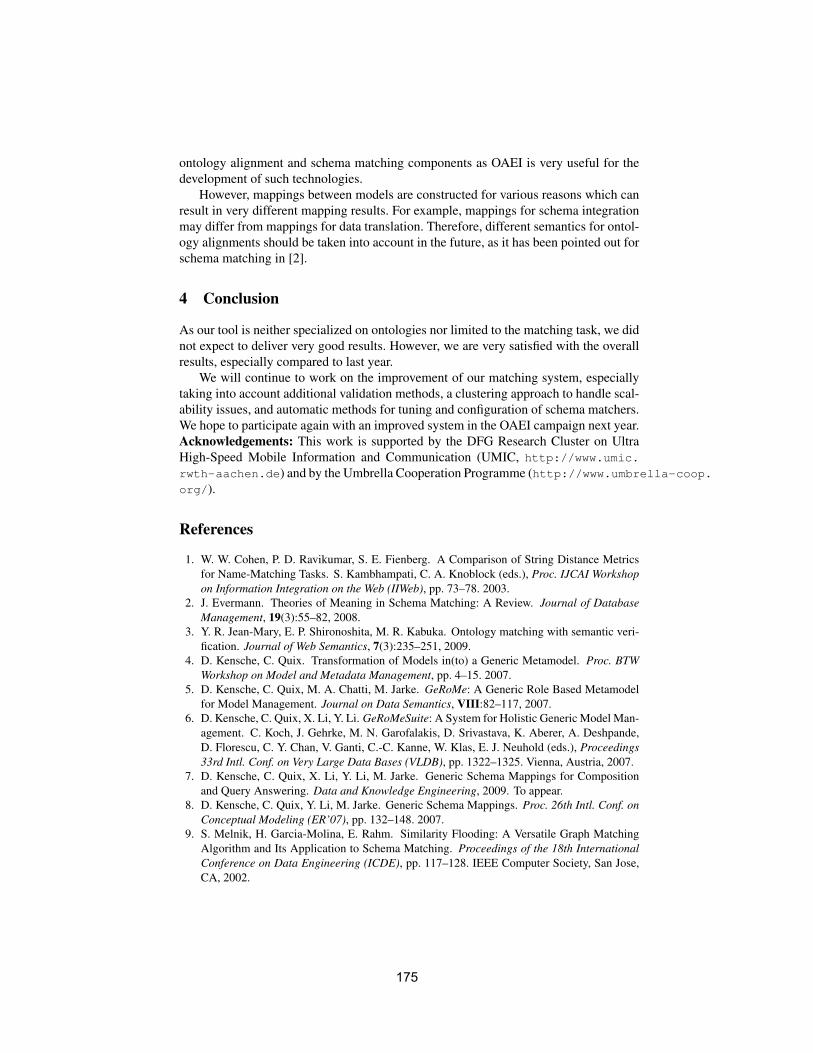
ontology alignment and schema matching components as OAEI is very useful for thedevelopment of such technologies.
However, mappings between models are constructed for various reasons which canresult in very different mapping results. For example, mappings for schema integrationmay differ from mappings for data translation. Therefore, different semantics for ontol-ogy alignments should be taken into account in the future, as it has been pointed out forschema matching in [2].
4 Conclusion
As our tool is neither specialized on ontologies nor limited to the matching task, we didnot expect to deliver very good results. However, we are very satisfied with the overallresults, especially compared to last year.
We will continue to work on the improvement of our matching system, especiallytaking into account additional validation methods, a clustering approach to handle scal-ability issues, and automatic methods for tuning and configuration of schema matchers.We hope to participate again with an improved system in the OAEI campaign next year.Acknowledgements: This work is supported by the DFG Research Cluster on UltraHigh-Speed Mobile Information and Communication (UMIC, http://www.umic.rwth-aachen.de) and by the Umbrella Cooperation Programme (http://www.umbrella-coop.org/).
References
1. W. W. Cohen, P. D. Ravikumar, S. E. Fienberg. A Comparison of String Distance Metricsfor Name-Matching Tasks. S. Kambhampati, C. A. Knoblock (eds.), Proc. IJCAI Workshopon Information Integration on the Web (IIWeb), pp. 73–78. 2003.
2. J. Evermann. Theories of Meaning in Schema Matching: A Review. Journal of DatabaseManagement, 19(3):55–82, 2008.
3. Y. R. Jean-Mary, E. P. Shironoshita, M. R. Kabuka. Ontology matching with semantic veri-fication. Journal of Web Semantics, 7(3):235–251, 2009.
4. D. Kensche, C. Quix. Transformation of Models in(to) a Generic Metamodel. Proc. BTWWorkshop on Model and Metadata Management, pp. 4–15. 2007.
5. D. Kensche, C. Quix, M. A. Chatti, M. Jarke. GeRoMe: A Generic Role Based Metamodelfor Model Management. Journal on Data Semantics, VIII:82–117, 2007.
6. D. Kensche, C. Quix, X. Li, Y. Li. GeRoMeSuite: A System for Holistic Generic Model Man-agement. C. Koch, J. Gehrke, M. N. Garofalakis, D. Srivastava, K. Aberer, A. Deshpande,D. Florescu, C. Y. Chan, V. Ganti, C.-C. Kanne, W. Klas, E. J. Neuhold (eds.), Proceedings33rd Intl. Conf. on Very Large Data Bases (VLDB), pp. 1322–1325. Vienna, Austria, 2007.
7. D. Kensche, C. Quix, X. Li, Y. Li, M. Jarke. Generic Schema Mappings for Compositionand Query Answering. Data and Knowledge Engineering, 2009. To appear.
8. D. Kensche, C. Quix, Y. Li, M. Jarke. Generic Schema Mappings. Proc. 26th Intl. Conf. onConceptual Modeling (ER’07), pp. 132–148. 2007.
9. S. Melnik, H. Garcia-Molina, E. Rahm. Similarity Flooding: A Versatile Graph MatchingAlgorithm and Its Application to Schema Matching. Proceedings of the 18th InternationalConference on Data Engineering (ICDE), pp. 117–128. IEEE Computer Society, San Jose,CA, 2002.
175
10. C. Quix, D. Kensche, X. Li. Generic Schema Merging. J. Krogstie, A. Opdahl, G. Sindre(eds.), Proc. 19th Intl. Conf. on Advanced Information Systems Engineering (CAiSE’07),LNCS, pp. 127–141. Springer-Verlag, 2007.
11. C. Quix, D. Kensche, X. Li. Matching of Ontologies with XML Schemas using a GenericMetamodel. Proc. Intl. Conf. Ontologies, DataBases, and Applications of Semantics(ODBASE), pp. 1081–1098. 2007.
12. G. Stoilos, G. B. Stamou, S. D. Kollias. A String Metric for Ontology Alignment. Y. Gil,E. Motta, V. R. Benjamins, M. A. Musen (eds.), Proc. 4th International Semantic Web Con-ference (ISWC), Lecture Notes in Computer Science, vol. 3729, pp. 624–637. Springer, 2005.
176
KOSIMap: Ontology alignments results for
OAEI 2009
Quentin Reul1 and Jeff Z. Pan2
1 VUB STARLab, Vrije Universiteit Brussel, Pleinlaan 2, 1050 Brussels, Belgium2 University of Aberdeen, Aberdeen AB24 3FX, [email protected]; [email protected]
Abstract. Ontology mapping has been recognised as an important ap-proach to identifying similar information in heterogeneous ontologies.The Knowledge Organisation System Implicit Mapping (KOSIMap) ap-proach relies on DL reasoning (i) to extract background knowledge aboutevery entity, and (ii) to remove inappropriate correspondences from analignment. The main assumption is that the use of this backgroundknowledge reduces erroneous mappings, thus increasing coverage. In thispaper, we provide an overview of KOSIMap, and present the result of oursystem for its first participation to the Ontology Alignment EvaluationInitiative (OAEI).
1 Presentation of KOSIMap
Ontology mapping has been recognised as an important means to identify sim-ilar information in different ontologies, thus achieving semantic interoperabilityon the Web. Given two ontologies O1 and O2, the task of mapping one ontol-ogy to another is that of finding an entity in O1 that matches an entity in O2
based on their intended meaning. Many approaches to schema/ontology match-ing have been proposed over the years [5, 7, 10]. Furthermore, surveys reviewingthese approaches, techniques and tools have been provided [4, 1]. The KnowledgeOrganisation System Implicit Mapping (KOSIMap) approach differs from exist-ing approaches by relying on DL reasoning (i) to extract background knowledgeabout every entity, and (ii) to remove inappropriate correspondences from analignment.
1.1 State, Purpose, General Statement
KOSIMap is an extensional and asymmetric matching approach implementedin Java. Given two consistent ontologies, KOSIMap aligns entities in the sourceontology to entities in the target ontology by extracting background knowledgeabout entities based on DL reasoning. More specifically, a DL reasoner (e.g.FaCT++ [12], Pellet [9]) deduces logical consequences about an entity based onthe asserted axioms defined in an ontology. Moreover, we investigate the use ofDL reasoning to remove inappropriate correspondences from an alignment. The
177
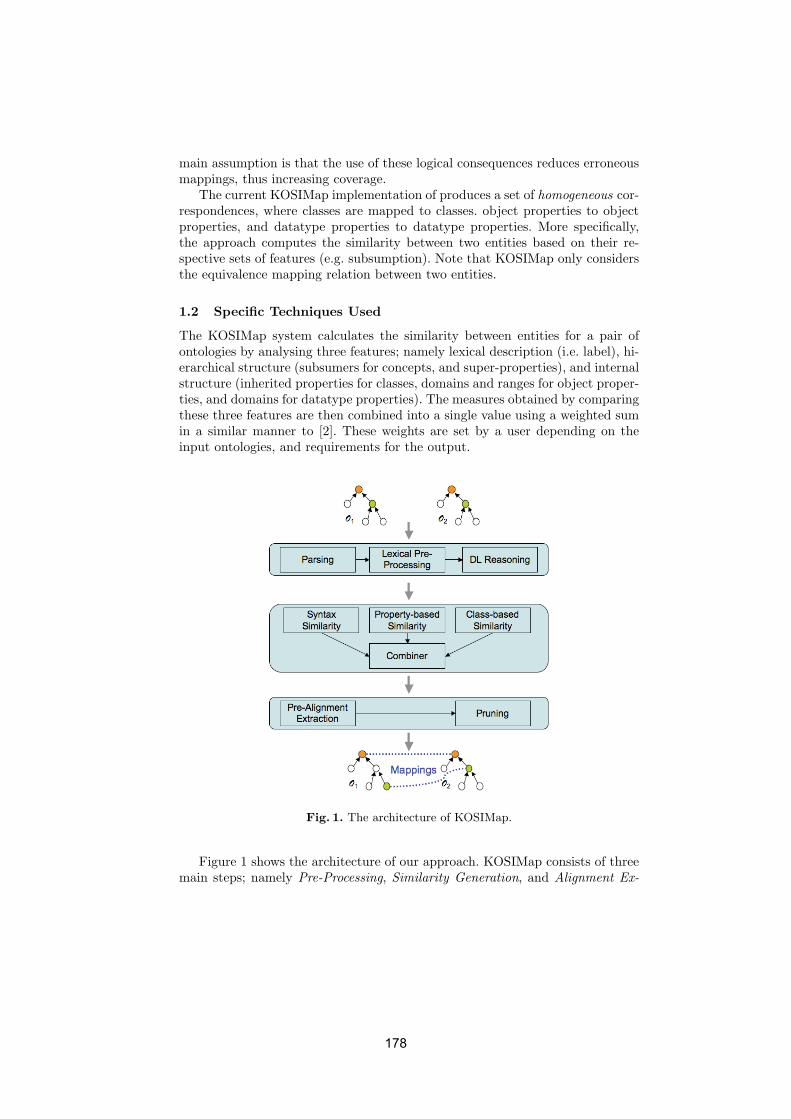
main assumption is that the use of these logical consequences reduces erroneousmappings, thus increasing coverage.
The current KOSIMap implementation of produces a set of homogeneous cor-respondences, where classes are mapped to classes. object properties to objectproperties, and datatype properties to datatype properties. More specifically,the approach computes the similarity between two entities based on their re-spective sets of features (e.g. subsumption). Note that KOSIMap only considersthe equivalence mapping relation between two entities.
1.2 Specific Techniques Used
The KOSIMap system calculates the similarity between entities for a pair ofontologies by analysing three features; namely lexical description (i.e. label), hi-erarchical structure (subsumers for concepts, and super-properties), and internalstructure (inherited properties for classes, domains and ranges for object proper-ties, and domains for datatype properties). The measures obtained by comparingthese three features are then combined into a single value using a weighted sumin a similar manner to [2]. These weights are set by a user depending on theinput ontologies, and requirements for the output.
Fig. 1. The architecture of KOSIMap.
Figure 1 shows the architecture of our approach. KOSIMap consists of threemain steps; namely Pre-Processing, Similarity Generation, and Alignment Ex-
178
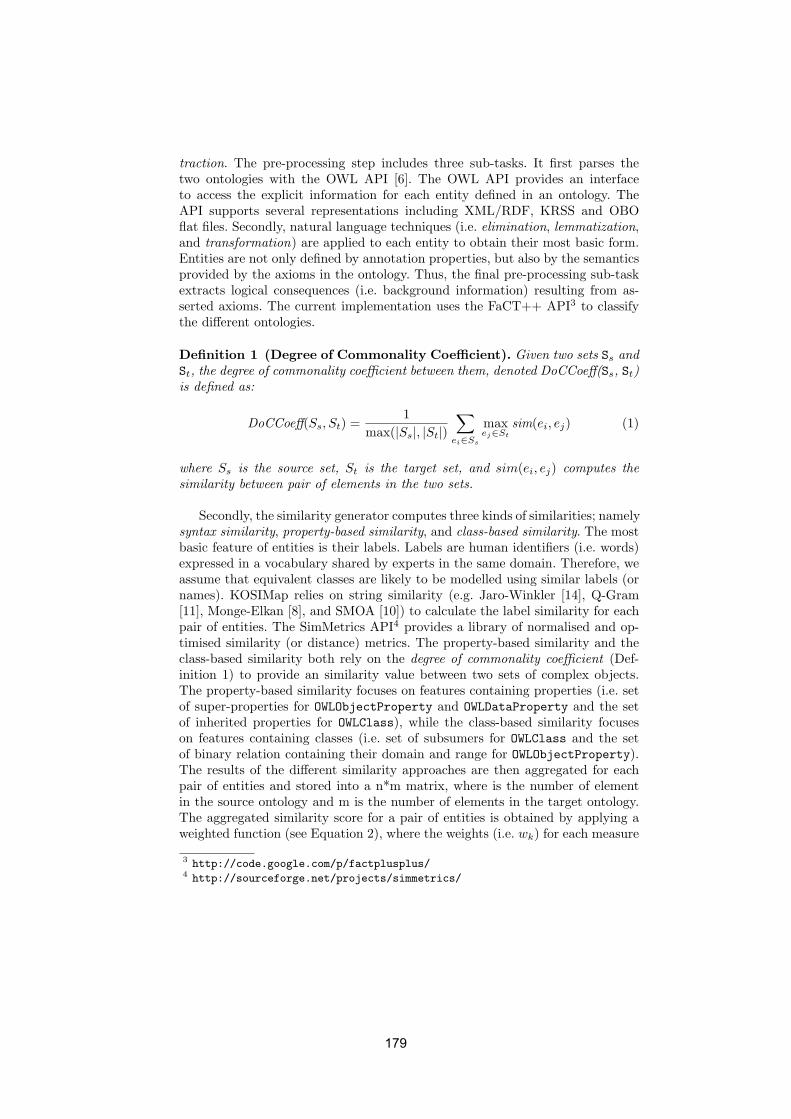
traction. The pre-processing step includes three sub-tasks. It first parses thetwo ontologies with the OWL API [6]. The OWL API provides an interfaceto access the explicit information for each entity defined in an ontology. TheAPI supports several representations including XML/RDF, KRSS and OBOflat files. Secondly, natural language techniques (i.e. elimination, lemmatization,and transformation) are applied to each entity to obtain their most basic form.Entities are not only defined by annotation properties, but also by the semanticsprovided by the axioms in the ontology. Thus, the final pre-processing sub-taskextracts logical consequences (i.e. background information) resulting from as-serted axioms. The current implementation uses the FaCT++ API3 to classifythe different ontologies.
Definition 1 (Degree of Commonality Coefficient). Given two sets Ss andSt, the degree of commonality coefficient between them, denoted DoCCoeff(Ss, St)is defined as:
DoCCoeff(Ss, St) =1
max(|Ss|, |St|)∑
ei∈Ss
maxej∈St
sim(ei, ej) (1)
where Ss is the source set, St is the target set, and sim(ei, ej) computes thesimilarity between pair of elements in the two sets.
Secondly, the similarity generator computes three kinds of similarities; namelysyntax similarity, property-based similarity, and class-based similarity. The mostbasic feature of entities is their labels. Labels are human identifiers (i.e. words)expressed in a vocabulary shared by experts in the same domain. Therefore, weassume that equivalent classes are likely to be modelled using similar labels (ornames). KOSIMap relies on string similarity (e.g. Jaro-Winkler [14], Q-Gram[11], Monge-Elkan [8], and SMOA [10]) to calculate the label similarity for eachpair of entities. The SimMetrics API4 provides a library of normalised and op-timised similarity (or distance) metrics. The property-based similarity and theclass-based similarity both rely on the degree of commonality coefficient (Def-inition 1) to provide an similarity value between two sets of complex objects.The property-based similarity focuses on features containing properties (i.e. setof super-properties for OWLObjectProperty and OWLDataProperty and the setof inherited properties for OWLClass), while the class-based similarity focuseson features containing classes (i.e. set of subsumers for OWLClass and the setof binary relation containing their domain and range for OWLObjectProperty).The results of the different similarity approaches are then aggregated for eachpair of entities and stored into a n*m matrix, where is the number of elementin the source ontology and m is the number of elements in the target ontology.The aggregated similarity score for a pair of entities is obtained by applying aweighted function (see Equation 2), where the weights (i.e. wk) for each measure
3http://code.google.com/p/factplusplus/
4http://sourceforge.net/projects/simmetrics/
179
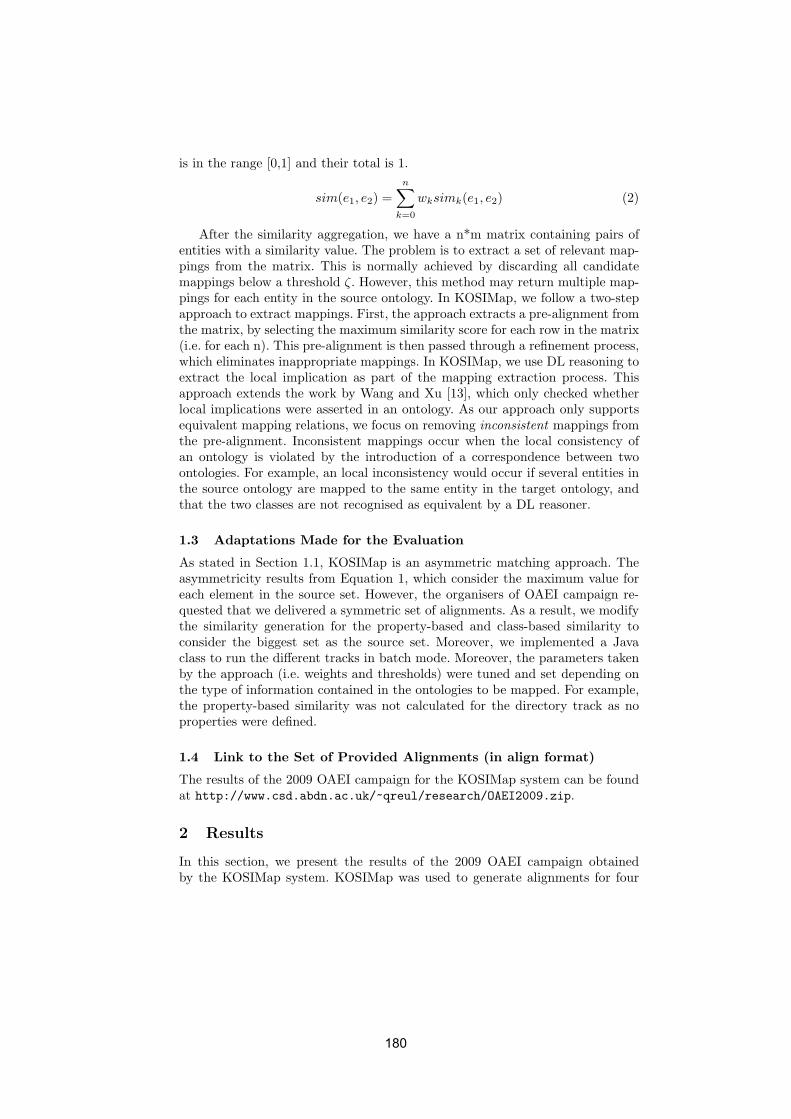
is in the range [0,1] and their total is 1.
sim(e1, e2) =n∑
k=0
wksimk(e1, e2) (2)
After the similarity aggregation, we have a n*m matrix containing pairs ofentities with a similarity value. The problem is to extract a set of relevant map-pings from the matrix. This is normally achieved by discarding all candidatemappings below a threshold ζ. However, this method may return multiple map-pings for each entity in the source ontology. In KOSIMap, we follow a two-stepapproach to extract mappings. First, the approach extracts a pre-alignment fromthe matrix, by selecting the maximum similarity score for each row in the matrix(i.e. for each n). This pre-alignment is then passed through a refinement process,which eliminates inappropriate mappings. In KOSIMap, we use DL reasoning toextract the local implication as part of the mapping extraction process. Thisapproach extends the work by Wang and Xu [13], which only checked whetherlocal implications were asserted in an ontology. As our approach only supportsequivalent mapping relations, we focus on removing inconsistent mappings fromthe pre-alignment. Inconsistent mappings occur when the local consistency ofan ontology is violated by the introduction of a correspondence between twoontologies. For example, an local inconsistency would occur if several entities inthe source ontology are mapped to the same entity in the target ontology, andthat the two classes are not recognised as equivalent by a DL reasoner.
1.3 Adaptations Made for the Evaluation
As stated in Section 1.1, KOSIMap is an asymmetric matching approach. Theasymmetricity results from Equation 1, which consider the maximum value foreach element in the source set. However, the organisers of OAEI campaign re-quested that we delivered a symmetric set of alignments. As a result, we modifythe similarity generation for the property-based and class-based similarity toconsider the biggest set as the source set. Moreover, we implemented a Javaclass to run the different tracks in batch mode. Moreover, the parameters takenby the approach (i.e. weights and thresholds) were tuned and set depending onthe type of information contained in the ontologies to be mapped. For example,the property-based similarity was not calculated for the directory track as noproperties were defined.
1.4 Link to the Set of Provided Alignments (in align format)
The results of the 2009 OAEI campaign for the KOSIMap system can be foundat http://www.csd.abdn.ac.uk/~qreul/research/OAEI2009.zip.
2 Results
In this section, we present the results of the 2009 OAEI campaign obtainedby the KOSIMap system. KOSIMap was used to generate alignments for four
180
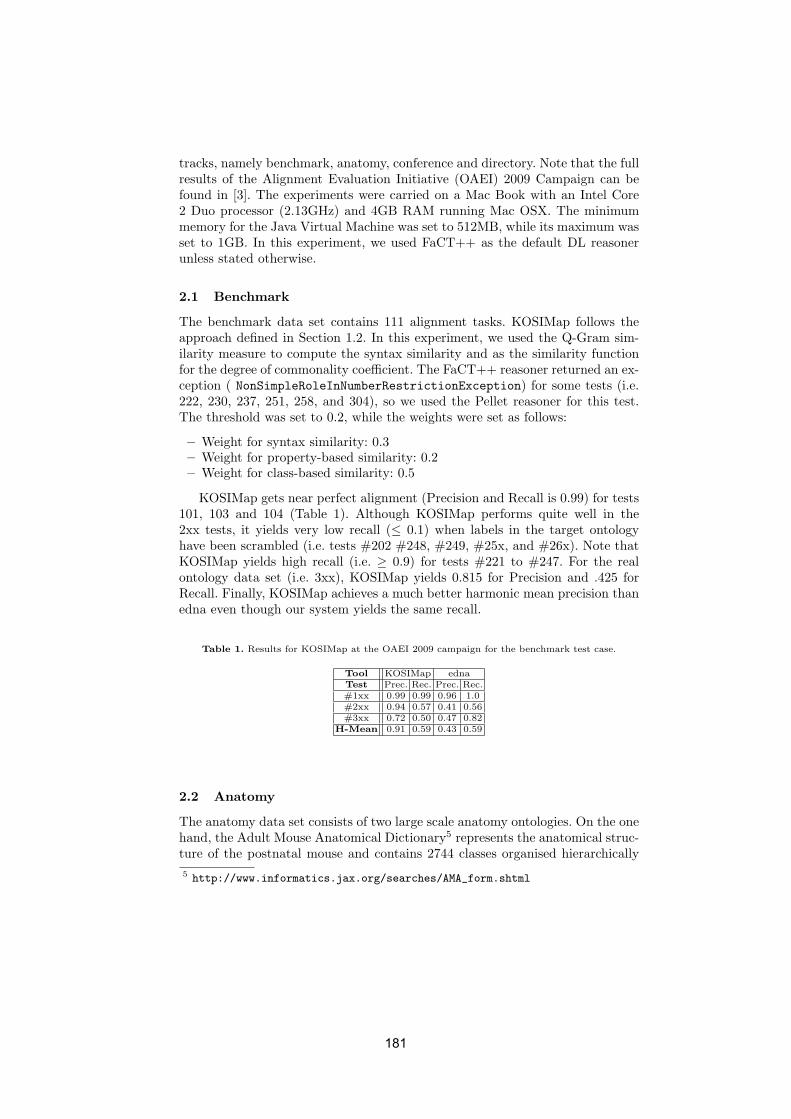
tracks, namely benchmark, anatomy, conference and directory. Note that the fullresults of the Alignment Evaluation Initiative (OAEI) 2009 Campaign can befound in [3]. The experiments were carried on a Mac Book with an Intel Core2 Duo processor (2.13GHz) and 4GB RAM running Mac OSX. The minimummemory for the Java Virtual Machine was set to 512MB, while its maximum wasset to 1GB. In this experiment, we used FaCT++ as the default DL reasonerunless stated otherwise.
2.1 Benchmark
The benchmark data set contains 111 alignment tasks. KOSIMap follows theapproach defined in Section 1.2. In this experiment, we used the Q-Gram sim-ilarity measure to compute the syntax similarity and as the similarity functionfor the degree of commonality coefficient. The FaCT++ reasoner returned an ex-ception ( NonSimpleRoleInNumberRestrictionException) for some tests (i.e.222, 230, 237, 251, 258, and 304), so we used the Pellet reasoner for this test.The threshold was set to 0.2, while the weights were set as follows:
– Weight for syntax similarity: 0.3– Weight for property-based similarity: 0.2– Weight for class-based similarity: 0.5
KOSIMap gets near perfect alignment (Precision and Recall is 0.99) for tests101, 103 and 104 (Table 1). Although KOSIMap performs quite well in the2xx tests, it yields very low recall (≤ 0.1) when labels in the target ontologyhave been scrambled (i.e. tests #202 #248, #249, #25x, and #26x). Note thatKOSIMap yields high recall (i.e. ≥ 0.9) for tests #221 to #247. For the realontology data set (i.e. 3xx), KOSIMap yields 0.815 for Precision and .425 forRecall. Finally, KOSIMap achieves a much better harmonic mean precision thanedna even though our system yields the same recall.
Table 1. Results for KOSIMap at the OAEI 2009 campaign for the benchmark test case.
Tool KOSIMap edna
Test Prec. Rec. Prec. Rec.
#1xx 0.99 0.99 0.96 1.0
#2xx 0.94 0.57 0.41 0.56
#3xx 0.72 0.50 0.47 0.82
H-Mean 0.91 0.59 0.43 0.59
2.2 Anatomy
The anatomy data set consists of two large scale anatomy ontologies. On the onehand, the Adult Mouse Anatomical Dictionary5 represents the anatomical struc-ture of the postnatal mouse and contains 2744 classes organised hierarchically
5http://www.informatics.jax.org/searches/AMA_form.shtml
181
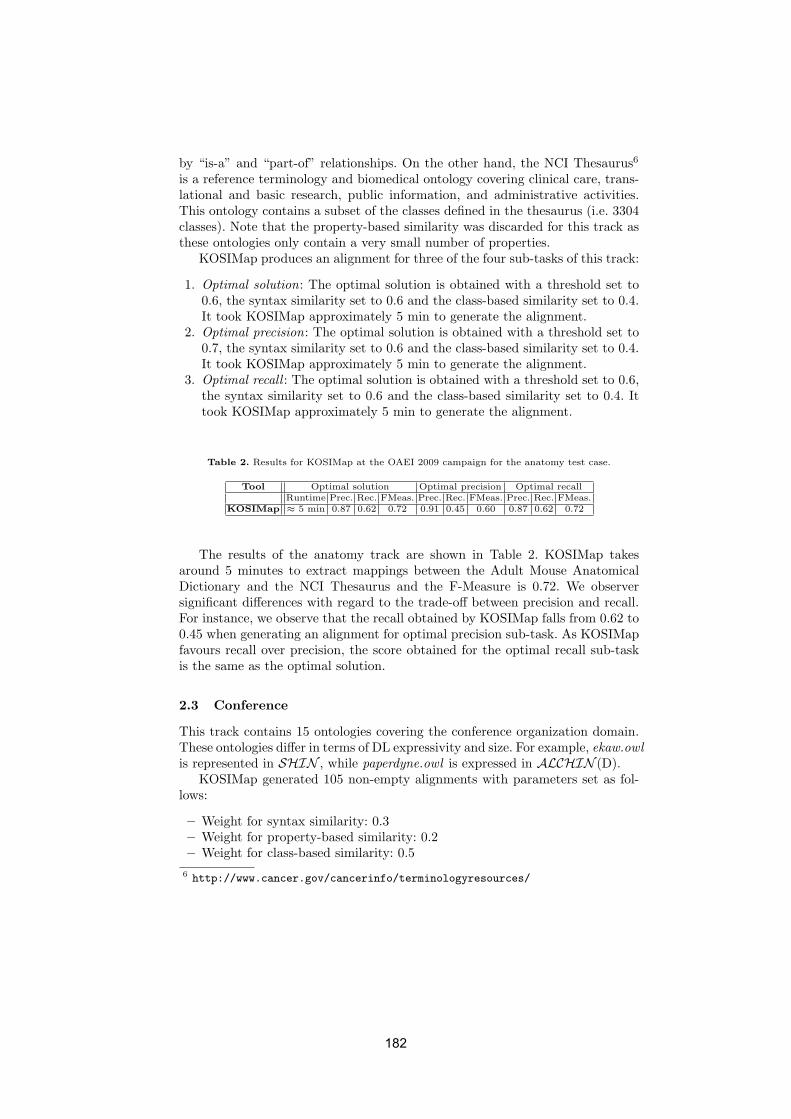
by “is-a” and “part-of” relationships. On the other hand, the NCI Thesaurus6
is a reference terminology and biomedical ontology covering clinical care, trans-lational and basic research, public information, and administrative activities.This ontology contains a subset of the classes defined in the thesaurus (i.e. 3304classes). Note that the property-based similarity was discarded for this track asthese ontologies only contain a very small number of properties.
KOSIMap produces an alignment for three of the four sub-tasks of this track:
1. Optimal solution: The optimal solution is obtained with a threshold set to0.6, the syntax similarity set to 0.6 and the class-based similarity set to 0.4.It took KOSIMap approximately 5 min to generate the alignment.
2. Optimal precision: The optimal solution is obtained with a threshold set to0.7, the syntax similarity set to 0.6 and the class-based similarity set to 0.4.It took KOSIMap approximately 5 min to generate the alignment.
3. Optimal recall : The optimal solution is obtained with a threshold set to 0.6,the syntax similarity set to 0.6 and the class-based similarity set to 0.4. Ittook KOSIMap approximately 5 min to generate the alignment.
Table 2. Results for KOSIMap at the OAEI 2009 campaign for the anatomy test case.
Tool Optimal solution Optimal precision Optimal recall
Runtime Prec. Rec. FMeas. Prec. Rec. FMeas. Prec. Rec. FMeas.
KOSIMap ≈ 5 min 0.87 0.62 0.72 0.91 0.45 0.60 0.87 0.62 0.72
The results of the anatomy track are shown in Table 2. KOSIMap takesaround 5 minutes to extract mappings between the Adult Mouse AnatomicalDictionary and the NCI Thesaurus and the F-Measure is 0.72. We observersignificant differences with regard to the trade-off between precision and recall.For instance, we observe that the recall obtained by KOSIMap falls from 0.62 to0.45 when generating an alignment for optimal precision sub-task. As KOSIMapfavours recall over precision, the score obtained for the optimal recall sub-taskis the same as the optimal solution.
2.3 Conference
This track contains 15 ontologies covering the conference organization domain.These ontologies differ in terms of DL expressivity and size. For example, ekaw.owlis represented in SHIN , while paperdyne.owl is expressed in ALCHIN (D).
KOSIMap generated 105 non-empty alignments with parameters set as fol-lows:
– Weight for syntax similarity: 0.3– Weight for property-based similarity: 0.2– Weight for class-based similarity: 0.5
6http://www.cancer.gov/cancerinfo/terminologyresources/
182
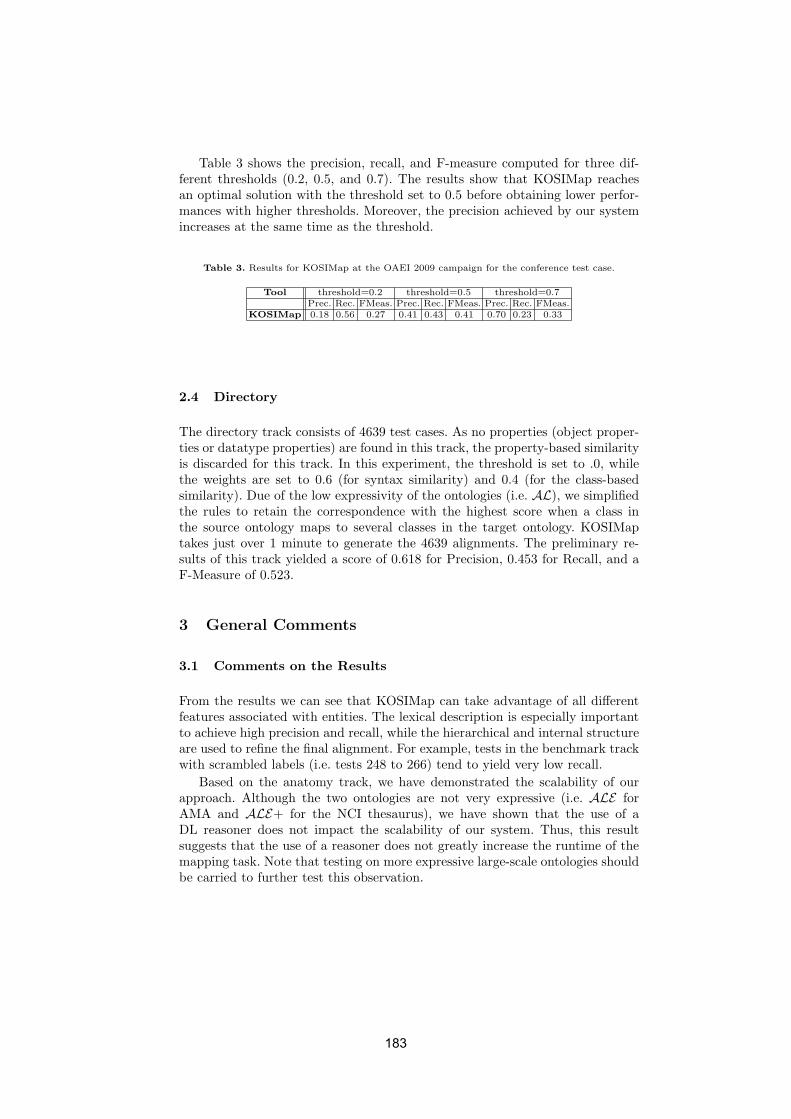
Table 3 shows the precision, recall, and F-measure computed for three dif-ferent thresholds (0.2, 0.5, and 0.7). The results show that KOSIMap reachesan optimal solution with the threshold set to 0.5 before obtaining lower perfor-mances with higher thresholds. Moreover, the precision achieved by our systemincreases at the same time as the threshold.
Table 3. Results for KOSIMap at the OAEI 2009 campaign for the conference test case.
Tool threshold=0.2 threshold=0.5 threshold=0.7
Prec. Rec. FMeas. Prec. Rec. FMeas. Prec. Rec. FMeas.
KOSIMap 0.18 0.56 0.27 0.41 0.43 0.41 0.70 0.23 0.33
2.4 Directory
The directory track consists of 4639 test cases. As no properties (object proper-ties or datatype properties) are found in this track, the property-based similarityis discarded for this track. In this experiment, the threshold is set to .0, whilethe weights are set to 0.6 (for syntax similarity) and 0.4 (for the class-basedsimilarity). Due of the low expressivity of the ontologies (i.e. AL), we simplifiedthe rules to retain the correspondence with the highest score when a class inthe source ontology maps to several classes in the target ontology. KOSIMaptakes just over 1 minute to generate the 4639 alignments. The preliminary re-sults of this track yielded a score of 0.618 for Precision, 0.453 for Recall, and aF-Measure of 0.523.
3 General Comments
3.1 Comments on the Results
From the results we can see that KOSIMap can take advantage of all differentfeatures associated with entities. The lexical description is especially importantto achieve high precision and recall, while the hierarchical and internal structureare used to refine the final alignment. For example, tests in the benchmark trackwith scrambled labels (i.e. tests 248 to 266) tend to yield very low recall.
Based on the anatomy track, we have demonstrated the scalability of ourapproach. Although the two ontologies are not very expressive (i.e. ALE forAMA and ALE+ for the NCI thesaurus), we have shown that the use of aDL reasoner does not impact the scalability of our system. Thus, this resultsuggests that the use of a reasoner does not greatly increase the runtime of themapping task. Note that testing on more expressive large-scale ontologies shouldbe carried to further test this observation.
183
3.2 Discussions on the Way to Improve KOSIMap
KOSIMap uses different strategies to extract correspondences between two on-tologies. Based on the test library, we have seen that some strategies (e.g.property-based similarity) were not always useful to extract alignments. Onepossible way to improve the current system would be to include a strategy se-lection module. With strategy selection, KOSIMap could avoid some some noiseproduced by some strategies when the information these strategies rely on is notadequate. For example, when no properties are defined in the ontology.
Another improvement to the system would be to include a module to fine-tuneweights when combining the different similarity measure. The current approachrelies on the user to analyse the information contained in the ontologies. It isimportant to note that this is process is both time-consuming and error prone.A solution to this problem would be to consider the DL expressivity of bothontologies to analyse the impact of each measure on the global similarity value.
3.3 Comments on the OAEI 2009 Test Cases
The advantage of the OAEI test library is that it provides a wide range of testscovering real word and modied ontologies. For example, the benchmark trackallows anyone to clearly identify the strengths and weaknesses of their systems.The library also includes test cases for comparing large scale ontologies. However,the ontologies provided in the anatomy track are not very expressive. As a result,it is difficult to address the impact of using DL reasoners on large scale ontologies.
4 Conclusion
In this paper, we present the KOSIMap system, which aligns entities from twoontologies. This system relies on DL reasoning to (i) extract background knowl-edge about every entity, and (ii) to remove inappropriate correspondences froman alignment. KOSIMap consists of three main steps; namely Pre-Processing,Similarity Generation, and Alignment Extraction. It first parses the two on-tologies, extracts the implicit structure of both ontologies using an OWL DLreasoner, and applies natural language techniques to lexical descriptions (i.e.labels). Next, it computes three different types of similarities for every pair ofentities. These similarity values are then combined and stored in a n*m ma-trix from which a pre-alignment is extracted. This pre-alignment is then passedthrough a refinement process, which eliminates inconsistent mappings.
Secondly, we report the results obtained by KOSIMap for its first partic-ipation to the Ontology Alignment Evaluation Initiative. From the results ofthe benchmark test case, we can see that our system can take advantage ofall different features associated with entities during the ontology mapping task.We have also shown that KOSIMap remains scalable despite using DL reasoningthroughout the mapping process. However, testing on more expressive large-scaleontologies should be carried to further test this observation.
184
5 Acknowledgements
The IPAS project is co-funded by the Technology Strategy Board’s CollaborativeResearch and Development programme (www.innovateuk.org) and Rolls-Royce(project No. TP/2/IC/6/I/10292).
References
1. S. Castano, A. Ferrara, S. Montanelli, G. N. Hess, and S. Bruno. State of the arton ontology coordination and matching. Report FP6-027538, BOEMIE, March2007.
2. M. Ehrig and Y. Sure. Ontology mapping - an integrated approach. In Proceedingsof the 1st European Semantic Web Symposium (ESWS 04), pages 76–91, 2004.
3. J. Euzenat, A. Ferrara, L. Hollink, V. Malaise, C. Meilicke, A. Nikolov, J. Pane,F. Scharffe, P. Shvaiko, V. Spiliopoulos, H. Stuckenschmidt, O. Svab-Zamazal,V. Svatek, C. T. dos Santos, and G. Vouros. Preliminary results of the ontol-ogy alignment evaluation initiative 2009. In Proceedings of the 4th InternationalWorkshop on Ontology Matching (OM-2009), 2009.
4. J. Euzenat and P. Shvaiko. Ontology Matching. Springer-Verlag, Berlin, 2007.5. J. Euzenat and P. Valtchev. An integrative proximity measure for ontology align-
ment. In Proceedings of ISWC-2003 Workshop on Semantic Information Integra-tion, page 3338, 2003.
6. M. Horridge, S. Bechhofer, and O. Noppens. Igniting the OWL 1.1 touch pa-per: The OWL API. In Proceedings of the 3rd OWL Experienced and DirectionsWorkshop (OWLED 2007), Innsbruck, Austria, 2007.
7. A. Maedche and S. Staab. Measuring similarity between ontologies. In Proceedingsof the 13th International Conference on Knowledge Engineering and KnowledgeManagement (EKAW 2002), pages 251–263, Siguenza, Spain, 2002.
8. A. E. Monge and C. Elkan. The field matching problem: Algorithms and applica-tions. In Proceedings of the 2nd International Conference on Knowledge Discoveryand Data Mining, 1996.
9. E. Sirin, B. Parsia, B. C. Grau, A. Kalyanpur, and Y. Katz. Pellet: A practicalOWL-DL reasoner. Web Semantics: Science, Services and Agents on the WorldWide Web, 5(2):51–53, June 2007.
10. G. Stoilos, G. Stamou, and S. Kollias. A string metric for ontology alignment. InProceeding of the 4th International Semantic Web Conference (ISWC 2005), 2005.
11. E. Sutinen and J. Tarhio. On using Q-Gram locations in approximate string match-ing. In Proceedings of the 3rd Annual European Symposium on Algorithms (ESA95), page 327340, 1995.
12. D. Tsarkov and I. Horrocks. FaCT++ description logic reasoner: System descrip-tion. In Proceedings of the 3rd International Joint Conference on Automated Rea-soning (IJCAR 2006), pages 292–297, Seattle, USA, August 2006.
13. P. Wang and B. Xu. Debugging ontology mappings: A static approach. Computingand Informatics, 22:1001–1015, 2003.
14. W. E. Winkler. String comparator metrics and enhanced decision rules in theFellegi-Sunter Model of record linkage. In Proceedings of the Section on SurveyResearch Methods, pages 354–359. American Statistical Association, 1990.
185
Lily: Ontology Alignment Results for OAEI 2009
Peng Wang1, Baowen Xu2,3
1College of Software Engineering, Southeast University, China
2State Key Laboratory for Novel Software Technology, Nanjing University, China 3Department of Computer Science and Technology, Nanjing University, China
[email protected], [email protected]
Abstract. This paper presents the alignment results of Lily for the ontology alignment contest OAEI 2009. Lily is an ontology mapping system, and it has four functions: generic ontology matching, large scale ontology matching, semantic ontology matching and mapping debugging. In OAEI 2009, Lily submited the results for four alignment tasks: benchmark, anatomy, directory and conference.
1 Presentation of the system
Lily is an ontology mapping system for solving the key issues related to heterogeneous ontologies, and it uses hybrid matching strategies to execute the ontology matching task. Lily can be used to discovery the mapping for both normal ontologies and large scale ontologies. In the past year, we did not improve Lily significantly but revised some bugs according to the reports from some users.
1.1 State, purpose, general statement
In order to obtain good alignments, the core principle of the matching strategy in Lily is utilizing the useful information effectively and rightly. Lily combines several novel and efficient matching techniques to find alignments. Currently, Lily realized four main functions: (1) Generic Ontology Matching method (GOM) is used for common matching tasks with small size ontologies. (2) Large scale Ontology Matching method (LOM) is used for the matching tasks with large size ontologies. (3) Semantic Ontology Matching method (SOM) is used for discovering the semantic relations between ontologies. Lily uses the web knowledge to recognize the semantic relations through the search engine. (4) Ontology mapping debugging is used to improve the alignment results.
The matching process mainly contains three steps: (1) In preprocess, Lily parses ontologies and prepares the necessary data for the subsequent steps. (2) In computing step, Lily uses suitable methods to calculate the similarity between elements from different ontologies. (3)In post-process, the alignments are extracted and then refined by mapping debugging. The architecture of Lily is shown in Fig. 1.
186
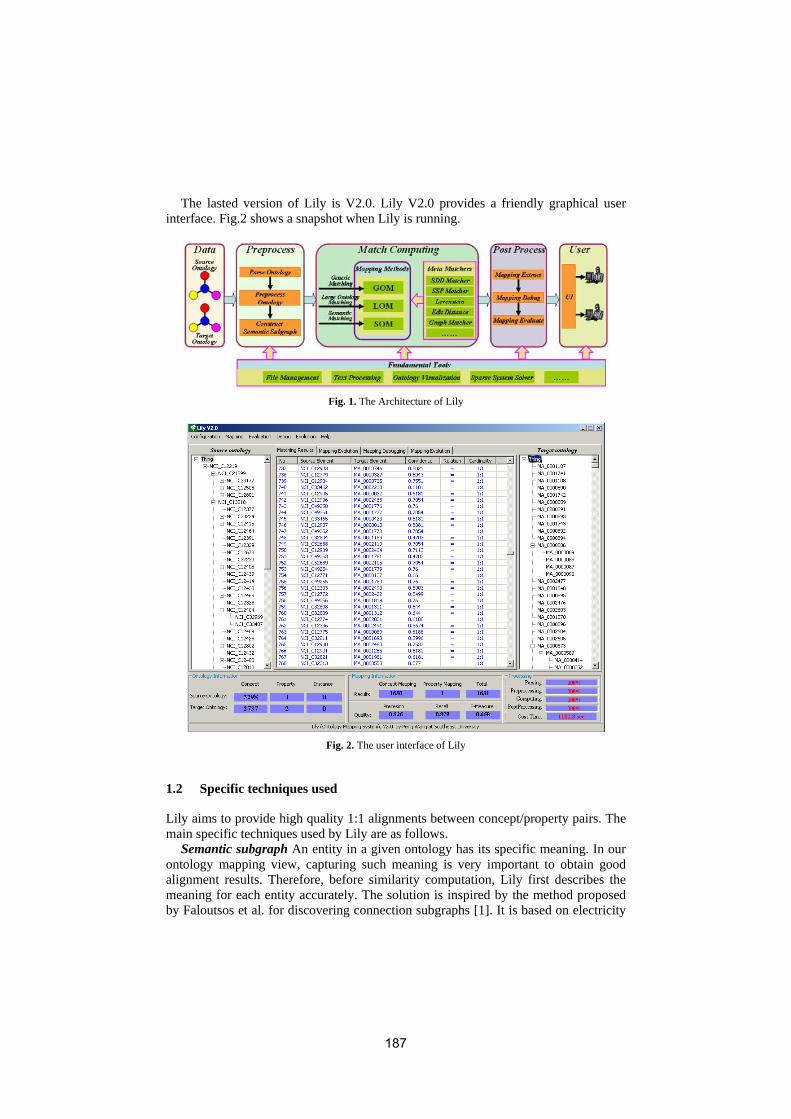
The lasted version of Lily is V2.0. Lily V2.0 provides a friendly graphical user interface. Fig.2 shows a snapshot when Lily is running.
Fig. 1. The Architecture of Lily
Fig. 2. The user interface of Lily
1.2 Specific techniques used
Lily aims to provide high quality 1:1 alignments between concept/property pairs. The main specific techniques used by Lily are as follows.
Semantic subgraph An entity in a given ontology has its specific meaning. In our ontology mapping view, capturing such meaning is very important to obtain good alignment results. Therefore, before similarity computation, Lily first describes the meaning for each entity accurately. The solution is inspired by the method proposed by Faloutsos et al. for discovering connection subgraphs [1]. It is based on electricity
187
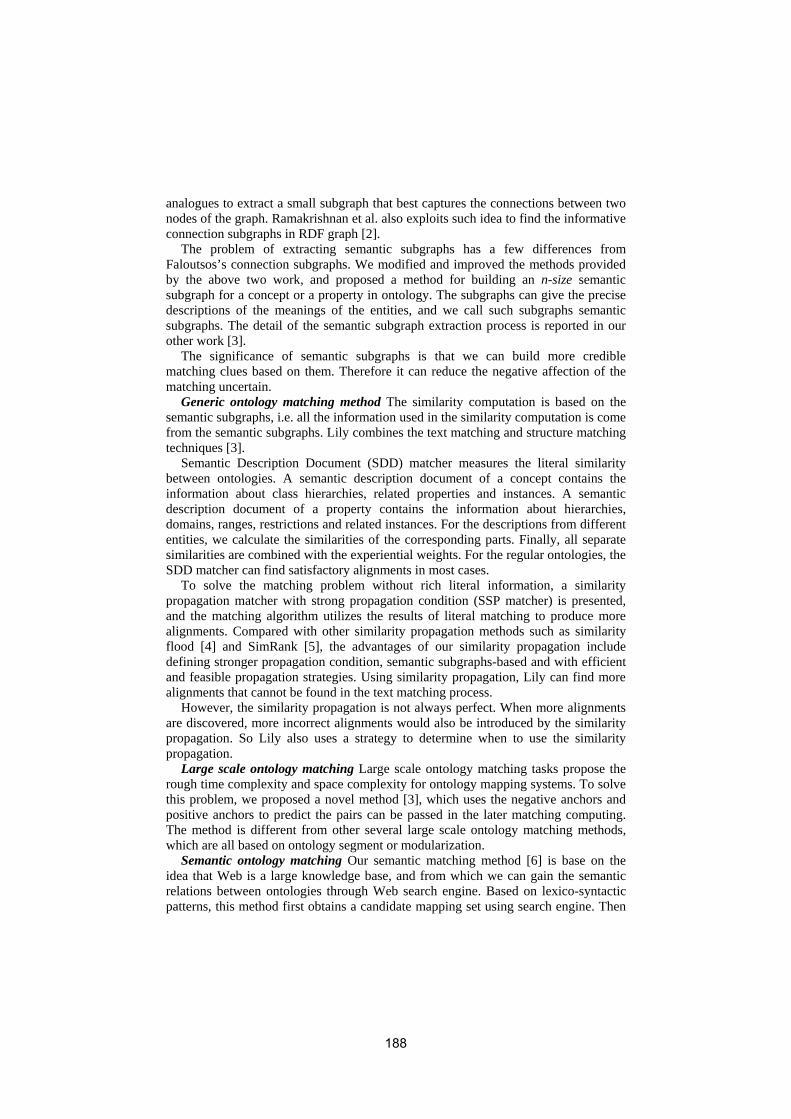
analogues to extract a small subgraph that best captures the connections between two nodes of the graph. Ramakrishnan et al. also exploits such idea to find the informative connection subgraphs in RDF graph [2].
The problem of extracting semantic subgraphs has a few differences from Faloutsos’s connection subgraphs. We modified and improved the methods provided by the above two work, and proposed a method for building an n-size semantic subgraph for a concept or a property in ontology. The subgraphs can give the precise descriptions of the meanings of the entities, and we call such subgraphs semantic subgraphs. The detail of the semantic subgraph extraction process is reported in our other work [3].
The significance of semantic subgraphs is that we can build more credible matching clues based on them. Therefore it can reduce the negative affection of the matching uncertain.
Generic ontology matching method The similarity computation is based on the semantic subgraphs, i.e. all the information used in the similarity computation is come from the semantic subgraphs. Lily combines the text matching and structure matching techniques [3].
Semantic Description Document (SDD) matcher measures the literal similarity between ontologies. A semantic description document of a concept contains the information about class hierarchies, related properties and instances. A semantic description document of a property contains the information about hierarchies, domains, ranges, restrictions and related instances. For the descriptions from different entities, we calculate the similarities of the corresponding parts. Finally, all separate similarities are combined with the experiential weights. For the regular ontologies, the SDD matcher can find satisfactory alignments in most cases.
To solve the matching problem without rich literal information, a similarity propagation matcher with strong propagation condition (SSP matcher) is presented, and the matching algorithm utilizes the results of literal matching to produce more alignments. Compared with other similarity propagation methods such as similarity flood [4] and SimRank [5], the advantages of our similarity propagation include defining stronger propagation condition, semantic subgraphs-based and with efficient and feasible propagation strategies. Using similarity propagation, Lily can find more alignments that cannot be found in the text matching process.
However, the similarity propagation is not always perfect. When more alignments are discovered, more incorrect alignments would also be introduced by the similarity propagation. So Lily also uses a strategy to determine when to use the similarity propagation.
Large scale ontology matching Large scale ontology matching tasks propose the rough time complexity and space complexity for ontology mapping systems. To solve this problem, we proposed a novel method [3], which uses the negative anchors and positive anchors to predict the pairs can be passed in the later matching computing. The method is different from other several large scale ontology matching methods, which are all based on ontology segment or modularization.
Semantic ontology matching Our semantic matching method [6] is base on the idea that Web is a large knowledge base, and from which we can gain the semantic relations between ontologies through Web search engine. Based on lexico-syntactic patterns, this method first obtains a candidate mapping set using search engine. Then
188
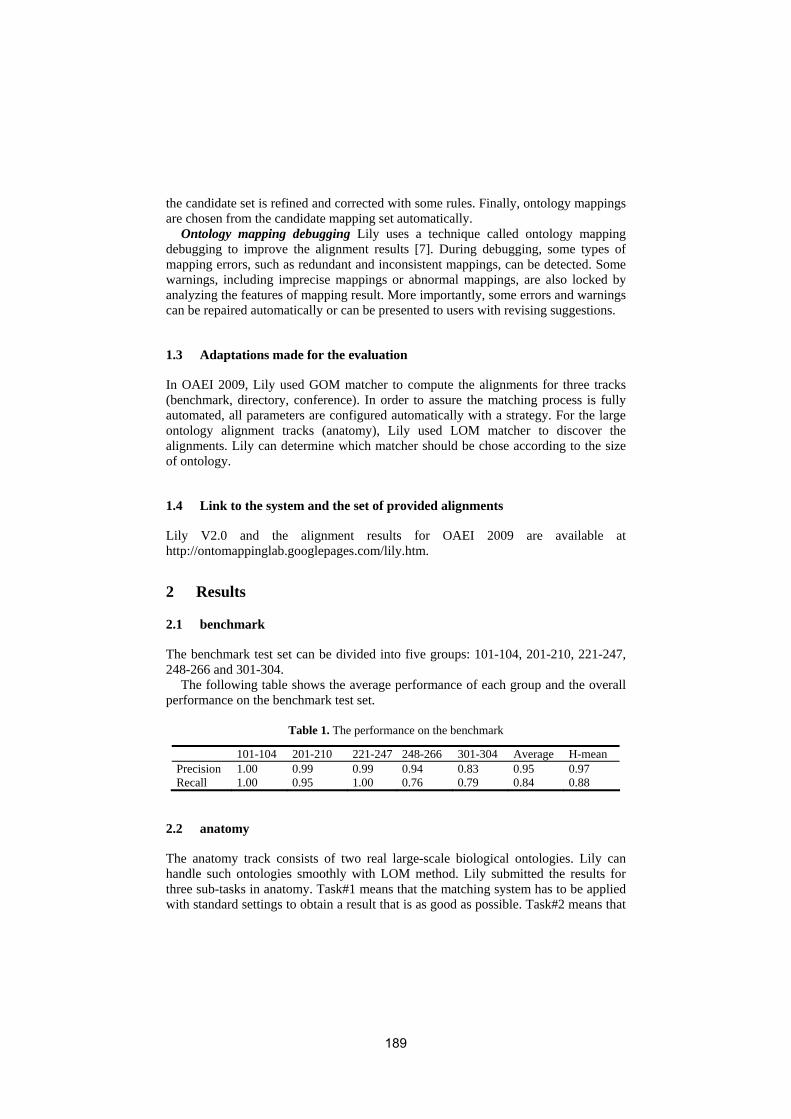
the candidate set is refined and corrected with some rules. Finally, ontology mappings are chosen from the candidate mapping set automatically.
Ontology mapping debugging Lily uses a technique called ontology mapping debugging to improve the alignment results [7]. During debugging, some types of mapping errors, such as redundant and inconsistent mappings, can be detected. Some warnings, including imprecise mappings or abnormal mappings, are also locked by analyzing the features of mapping result. More importantly, some errors and warnings can be repaired automatically or can be presented to users with revising suggestions.
1.3 Adaptations made for the evaluation
In OAEI 2009, Lily used GOM matcher to compute the alignments for three tracks (benchmark, directory, conference). In order to assure the matching process is fully automated, all parameters are configured automatically with a strategy. For the large ontology alignment tracks (anatomy), Lily used LOM matcher to discover the alignments. Lily can determine which matcher should be chose according to the size of ontology.
1.4 Link to the system and the set of provided alignments
Lily V2.0 and the alignment results for OAEI 2009 are available at http://ontomappinglab.googlepages.com/lily.htm.
2 Results
2.1 benchmark
The benchmark test set can be divided into five groups: 101-104, 201-210, 221-247, 248-266 and 301-304.
The following table shows the average performance of each group and the overall performance on the benchmark test set.
Table 1. The performance on the benchmark
101-104 201-210 221-247 248-266 301-304 Average H-mean Precision 1.00 0.99 0.99 0.94 0.83 0.95 0.97 Recall 1.00 0.95 1.00 0.76 0.79 0.84 0.88
2.2 anatomy
The anatomy track consists of two real large-scale biological ontologies. Lily can handle such ontologies smoothly with LOM method. Lily submitted the results for three sub-tasks in anatomy. Task#1 means that the matching system has to be applied with standard settings to obtain a result that is as good as possible. Task#2 means that
189
the system generates the results with high precision. Task#3 means that the system generates the alignment with high recall.
2.3 directory
The directory track requires matching two taxonomies describing the web directories. Except the class hierarchy, there is no other information in the ontologies. Therefore, besides the literal information, Lily also utilizes the hierarchy information to decide the alignments.
2.4 conference
This task contains 15 real-case ontologies about conference. For a given ontology, we compute the alignments with itself, as well as with other ontologies. For we treat the equivalent alignment is symmetric, we get 105 alignment files totally. The heterogeneous character in this track is various. It is a challenge to generate good results for all ontology pairs in this test set.
3 General comments
Strengths For normal size ontologies, if they have regular literals or similar structures, Lily can achieve satisfactory alignments.
Weaknesses Lily needs to extract semantic subgraphs for all concepts and properties. It is a time-consuming process. Even though we have improved the efficiency of the extracting algorithm, it still is the bottleneck for the performance of the system.
4 Conclusion We briefly introduce our ontology matching tool Lily. The matching process and the special techniques used by Lily are presented. The preliminary alignment results are carefully analyzed. Finally, we summarized the strengths and the weaknesses of Lily.
References 1. Faloutsos, C., McCurley, K. S., Tomkins, A.: Fast Discovery of Connection Subgraphs. In
the 10th ACM SIGKDD International Conference on Knowledge Discovery and Data Mining, Seattle, Washington (2004).
2. Ramakrishnan, C., Milnor, W. H., Perry, M., Sheth, A. P.: Discovering Informative Connection Subgraphs in Multirelational Graphs. ACM SIGKDD Explorations, Vol. 7(2), (2005)56-63.
3. Wang, P.: Research on the Key Issues in Ontology Mapping (In Chinese). PhD Thesis, Southeast University, Nanjing, 2009.
4. Melnik, S., Garcia-Molina, H., Rahm, E.: Similarity Flooding: A Versatile Graph Matching Algorithm and its Application to Schema Matching. In the 18th International Conference on Data Engineering (ICDE), San Jose CA (2002).
190
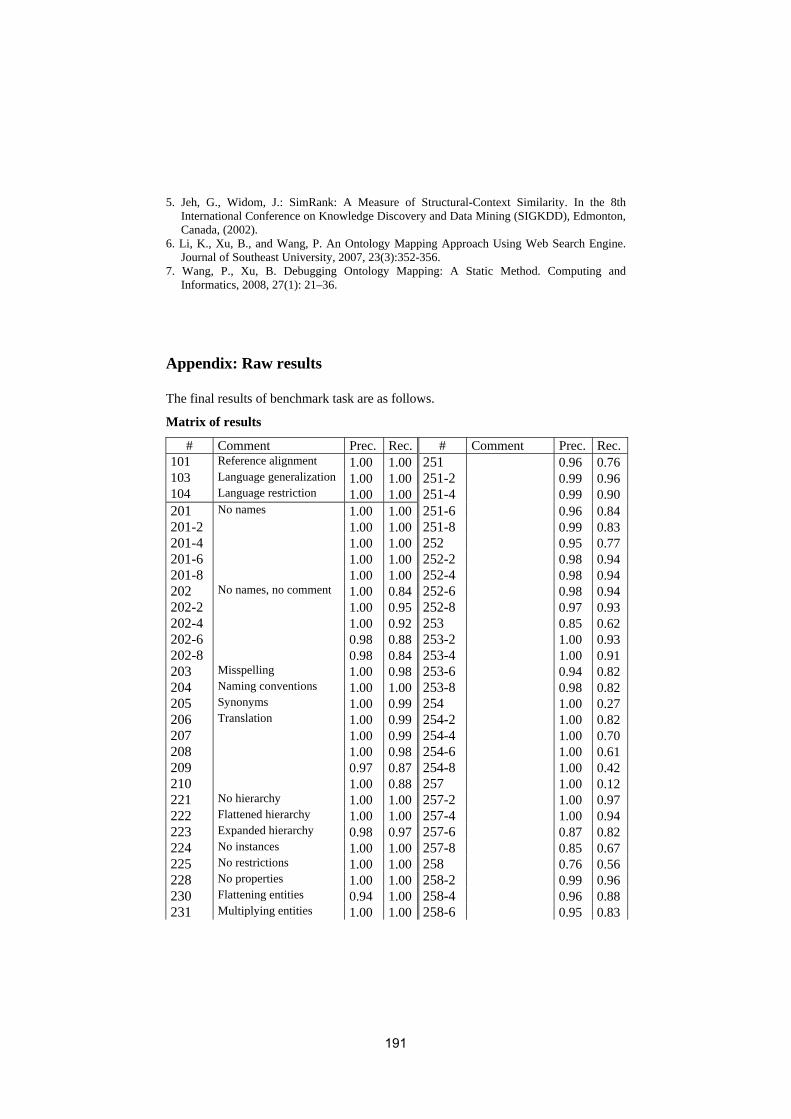
5. Jeh, G., Widom, J.: SimRank: A Measure of Structural-Context Similarity. In the 8th International Conference on Knowledge Discovery and Data Mining (SIGKDD), Edmonton, Canada, (2002).
6. Li, K., Xu, B., and Wang, P. An Ontology Mapping Approach Using Web Search Engine. Journal of Southeast University, 2007, 23(3):352-356.
7. Wang, P., Xu, B. Debugging Ontology Mapping: A Static Method. Computing and Informatics, 2008, 27(1): 21–36.
Appendix: Raw results
The final results of benchmark task are as follows.
Matrix of results
# Comment Prec. Rec. # Comment Prec. Rec. 101 Reference alignment 1.00 1.00 251 0.96 0.76 103 Language generalization 1.00 1.00 251-2 0.99 0.96 104 Language restriction 1.00 1.00 251-4 0.99 0.90 201 No names 1.00 1.00 251-6 0.96 0.84 201-2 1.00 1.00 251-8 0.99 0.83 201-4 1.00 1.00 252 0.95 0.77 201-6 1.00 1.00 252-2 0.98 0.94 201-8 1.00 1.00 252-4 0.98 0.94 202 No names, no comment 1.00 0.84 252-6 0.98 0.94 202-2 1.00 0.95 252-8 0.97 0.93 202-4 1.00 0.92 253 0.85 0.62 202-6 0.98 0.88 253-2 1.00 0.93 202-8 0.98 0.84 253-4 1.00 0.91 203 Misspelling 1.00 0.98 253-6 0.94 0.82 204 Naming conventions 1.00 1.00 253-8 0.98 0.82 205 Synonyms 1.00 0.99 254 1.00 0.27 206 Translation 1.00 0.99 254-2 1.00 0.82 207 1.00 0.99 254-4 1.00 0.70 208 1.00 0.98 254-6 1.00 0.61 209 0.97 0.87 254-8 1.00 0.42 210 1.00 0.88 257 1.00 0.12 221 No hierarchy 1.00 1.00 257-2 1.00 0.97 222 Flattened hierarchy 1.00 1.00 257-4 1.00 0.94 223 Expanded hierarchy 0.98 0.97 257-6 0.87 0.82 224 No instances 1.00 1.00 257-8 0.85 0.67 225 No restrictions 1.00 1.00 258 0.76 0.56 228 No properties 1.00 1.00 258-2 0.99 0.96 230 Flattening entities 0.94 1.00 258-4 0.96 0.88 231 Multiplying entities 1.00 1.00 258-6 0.95 0.83
191
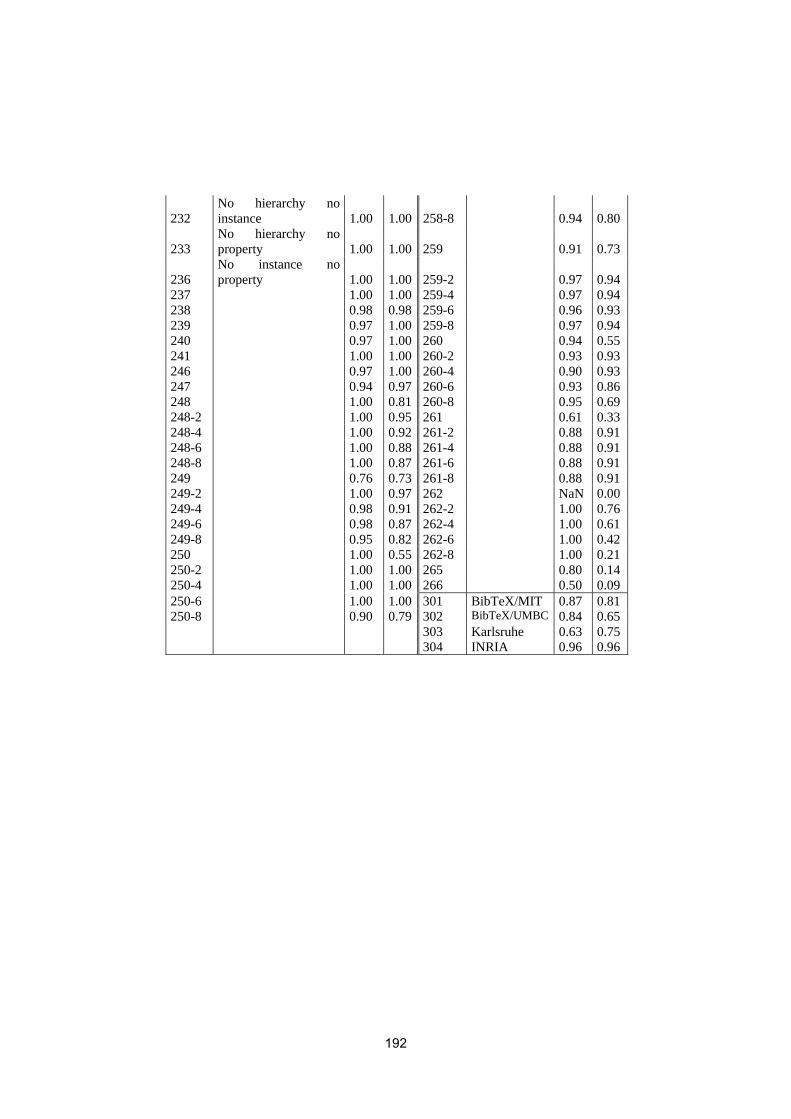
232 No hierarchy no instance 1.00 1.00 258-8
0.94 0.80
233 No hierarchy no property 1.00 1.00 259
0.91 0.73
236 No instance no property 1.00 1.00 259-2
0.97 0.94
237 1.00 1.00 259-4 0.97 0.94 238 0.98 0.98 259-6 0.96 0.93 239 0.97 1.00 259-8 0.97 0.94 240 0.97 1.00 260 0.94 0.55 241 1.00 1.00 260-2 0.93 0.93 246 0.97 1.00 260-4 0.90 0.93 247 0.94 0.97 260-6 0.93 0.86 248 1.00 0.81 260-8 0.95 0.69 248-2 1.00 0.95 261 0.61 0.33 248-4 1.00 0.92 261-2 0.88 0.91 248-6 1.00 0.88 261-4 0.88 0.91 248-8 1.00 0.87 261-6 0.88 0.91 249 0.76 0.73 261-8 0.88 0.91 249-2 1.00 0.97 262 NaN 0.00 249-4 0.98 0.91 262-2 1.00 0.76 249-6 0.98 0.87 262-4 1.00 0.61 249-8 0.95 0.82 262-6 1.00 0.42 250 1.00 0.55 262-8 1.00 0.21 250-2 1.00 1.00 265 0.80 0.14 250-4 1.00 1.00 266 0.50 0.09 250-6 1.00 1.00 301 BibTeX/MIT 0.87 0.81 250-8 0.90 0.79 302 BibTeX/UMBC 0.84 0.65 303 Karlsruhe 0.63 0.75 304 INRIA 0.96 0.96
192
MapPSO Results for OAEI 2009
Jurgen Bock1, Peng Liu1, and Jan Hettenhausen2
1 FZI Forschungszentrum Informatik an der Universitat Karlsruhe, Germany{bock, pengliu}@fzi.de
2 Griffith University, Institute for Integrated and Intelligent Systems, Brisbane, [email protected]
Abstract. This paper presents and discusses the results of the latest develop-ments of the MapPSO system, which is an ontology alignment approach that isbased on discrete particle swarm optimisation. Firstly it is recalled, how the al-gorithm approaches the ontology matching task as an optimisation problem, andhow the specific technique of particle swarm optimisation isapplied. Secondly,the results are discussed, which were achieved for the Benchmark data set of the2009 Ontology Alignment Evaluation Initiative.
1 Presentation of the system
With last year’s OAEI campaign the MapPSO system (OntologyMapping byParticleSwarmOptimisation) has been introduced [1] as a novel research prototype, which isexpected to become a highly scalable, massively parallel tool for ontology alignment.In the following subsection the basic idea of this approach will be sketched.
1.1 State, purpose, general statement
The MapPSO algorithm is being developed for the purpose of aligning large ontologies.It is motivated by the observation that ontologies and schema information such as the-sauri or dictionaries are not only getting numerous on the web, but also are becomingincreasingly large in terms of the number of classes/concepts and properties/relations.This development raises the need for highly scalable tools to provide interoperabilityand integration of various heterogeneous sources. On the other hand the emergence ofparallel architectures provide the basis for highly parallel and thus scalable algorithmswhich need to be adapted to these architectures.
The presented MapPSO method regards the ontology alignmentproblem as an opti-misation problem which allows for the adaptation of a discrete variant of particle swarmoptimisation [2, 3], a population based optimisation paradigm inspired by social inter-action between swarming animals. Particularly the population based structure of thismethod provides high scalability on parallel systems. Particle swarm optimisation fur-thermore belongs to the group of anytime algorithms, which allow for interruption atany time and will provide the best answer being available at that time. Particularly thisproperty might be interesting when an alignment problem is subject to certain timeconstraints.
193
Compared to the first version of the system that participatedin last year’s OAEIcampaign, some adaptation have been made with particular respect to the base match-ers used. More precisely, the existing base matchers have been improved, and new basematchers have been applied, in order to improve the quality of the alignments discov-ered by MapPSO. Section 2 shows the improvements compared toOAEI 2008.
1.2 Specific techniques used
MapPSO utilises a discrete particle swarm optimisation (DPSO) algorithm, based inparts on the DPSO developed by Correaet al. [2, 3], to tackle the ontology matchingproblem as an optimisation problem. The core element of thisoptimisation problemis the objective function which supplies a fitness value for each candidate alignment.To find solutions for the optimisation problem, MapPSO simulates a set of particleswhereby each particle is a candidate alignment comprising aset of initially randommappings. (Currently only 1:1 alignments are supported.) Each of these particles main-tains a memory of previously found good mappings (personal best) and the swarmmaintains a collective memory of the best known alignment sofar (global best). In eachiteration, particles are updated by changing their sets of correspondences in a guidedrandom manner. Correspondences which are also present in the global best set and per-sonal best set are more likely to be kept, as are those with a very good evaluation. WorstCorrespondences are more likely to be removed and replaced with other correspon-dences which are random recommended from best alignment(personal best andglobalbest) and random created according to left available entities. Each candidate alignmentof two ontologies is scored based on the sum of quality measures of the single corre-spondences. The currently best alignment is the one with thebest known fitness ratingaccording to these criteria. According to this revisit of the ontology matching problem,a particle swarm can be applied to search for the optimal alignment.
For each correspondence the quality score is calculated based on an aggregation ofscores from a configurable set of base matchers. Each base matcher provides a distancemeasure for each correspondence. Currently the following base matchers are used:
– SMOA string distance [4] for entity names– SMOA string distance for entity labels– WordNet distance for entity names– WordNet distance for entity labels– Vector space similarity [5] for entity comments– Hierarchy distance to propagate similarity of super/subclasses and super/subproperties– Structural similarity of classes derived from properties that have them as domain or
range classes– Structural similarity of properties derived from their domain and range classes– Similarity of classes derived from individuals that are instances of them– Similarity of properties derived from individuals that aresubjects or objects of them– Similarity of individuals derived from property assertions, in particular the follow-
ing:• values of data properties, the resp. individual is assertedto
194
• object (individuals) of object properties, the resp. individual is asserted to assubject
• subject (individuals) of object properties, the resp. individual is asserted to asobject
For each correspondence the available base distances are aggregated by applyinga weighted average operator. Hereby a fixed weight is assigned to each base distance.However, the weight configuration is automatically adjusted before the alignment pro-cess, according to the ontology characteristics. By this analysis those characteristicsare determined that are most promising for detecting similarities. The evaluation of theoverall alignment of each particle is computed by aggregating all its correspondencedistances. In the current implementation each particle runs in a separate thread and allfitness calculations and particle updates are performed in parallel. The only sequentialportion on the algorithm is the synchronisation after each iteration to acquire the fitnessvalue from each particle and determine the currently globalbest alignment.
1.3 Adaptations made for the evaluation
Since MapPSO is an early prototype, the OAEI Benchmark test data is used during thedevelopment process. No specific adaptations have been made.
1.4 Link to the system and parameters file
The release of MapPSO (MapPSO.jar) and the parameter fileparams.xml used forOAEI 2009 are located athttps://sourceforge.net/projects/mappso/files/ in the folderoaei2009.
1.5 Link to the set of provided alignments (in align format)
The alignments of the OAEI 2009 benchmark data set as provided by MapPSO are lo-cated in the filealignments.zip athttps://sourceforge.net/projects/mappso/files/.
2 Results
The MapPSO system participated only in the benchmarks trackthis year.The algorithm is highly adjustable via its parameter file andcan be tuned to perform
well on specific problems, as well as to perform well for precision or recall. To obtainthe results presented in Tab. 1 a compromised parameter configuration was used.
2.1 benchmark
The Benchmark test case is designed to provide a number of data sets systematicallyrevealing strengths and weaknesses of the matching algorithm. In the case of MapPSOthe experiences were as follows.
195
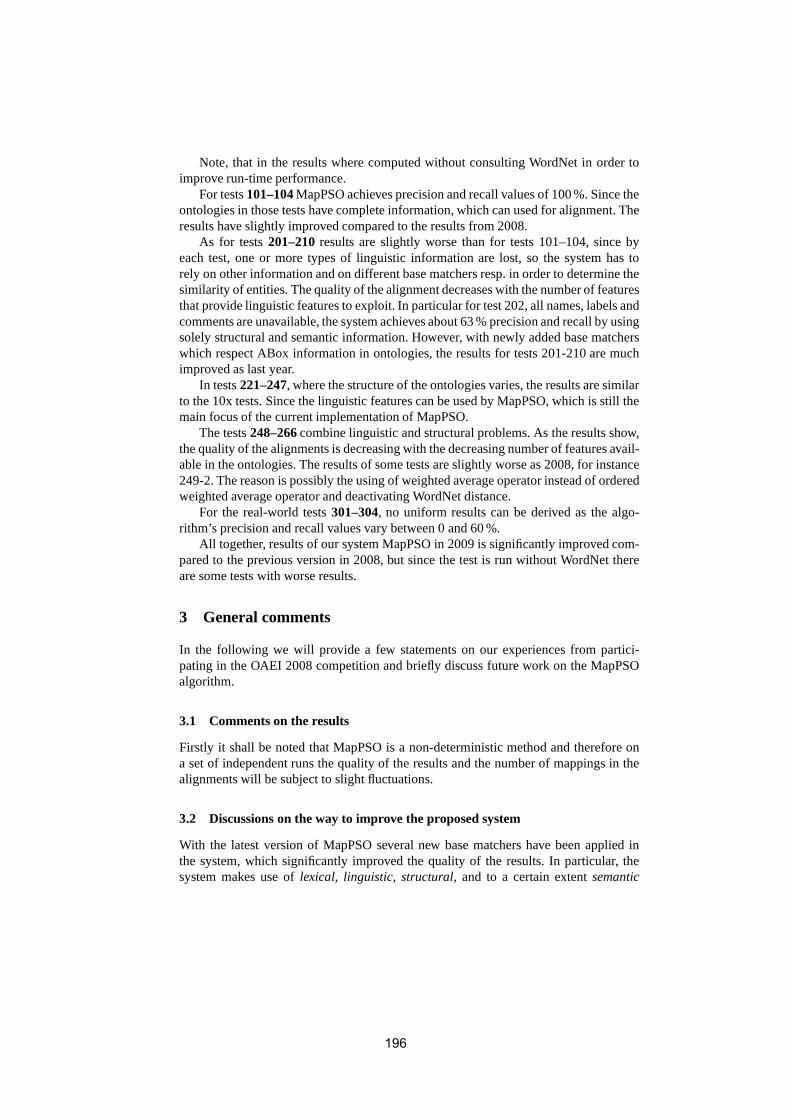
Note, that in the results where computed without consultingWordNet in order toimprove run-time performance.
For tests101–104MapPSO achieves precision and recall values of 100 %. Since theontologies in those tests have complete information, whichcan used for alignment. Theresults have slightly improved compared to the results from2008.
As for tests201–210results are slightly worse than for tests 101–104, since byeach test, one or more types of linguistic information are lost, so the system has torely on other information and on different base matchers resp. in order to determine thesimilarity of entities. The quality of the alignment decreases with the number of featuresthat provide linguistic features to exploit. In particularfor test 202, all names, labels andcomments are unavailable, the system achieves about 63 % precision and recall by usingsolely structural and semantic information. However, withnewly added base matcherswhich respect ABox information in ontologies, the results for tests 201-210 are muchimproved as last year.
In tests221–247, where the structure of the ontologies varies, the results are similarto the 10x tests. Since the linguistic features can be used byMapPSO, which is still themain focus of the current implementation of MapPSO.
The tests248–266combine linguistic and structural problems. As the resultsshow,the quality of the alignments is decreasing with the decreasing number of features avail-able in the ontologies. The results of some tests are slightly worse as 2008, for instance249-2. The reason is possibly the using of weighted average operator instead of orderedweighted average operator and deactivating WordNet distance.
For the real-world tests301–304, no uniform results can be derived as the algo-rithm’s precision and recall values vary between 0 and 60 %.
All together, results of our system MapPSO in 2009 is significantly improved com-pared to the previous version in 2008, but since the test is run without WordNet thereare some tests with worse results.
3 General comments
In the following we will provide a few statements on our experiences from partici-pating in the OAEI 2008 competition and briefly discuss future work on the MapPSOalgorithm.
3.1 Comments on the results
Firstly it shall be noted that MapPSO is a non-deterministicmethod and therefore ona set of independent runs the quality of the results and the number of mappings in thealignments will be subject to slight fluctuations.
3.2 Discussions on the way to improve the proposed system
With the latest version of MapPSO several new base matchers have been applied inthe system, which significantly improved the quality of the results. In particular, thesystem makes use oflexical, linguistic, structural, and to a certain extentsemantic
196
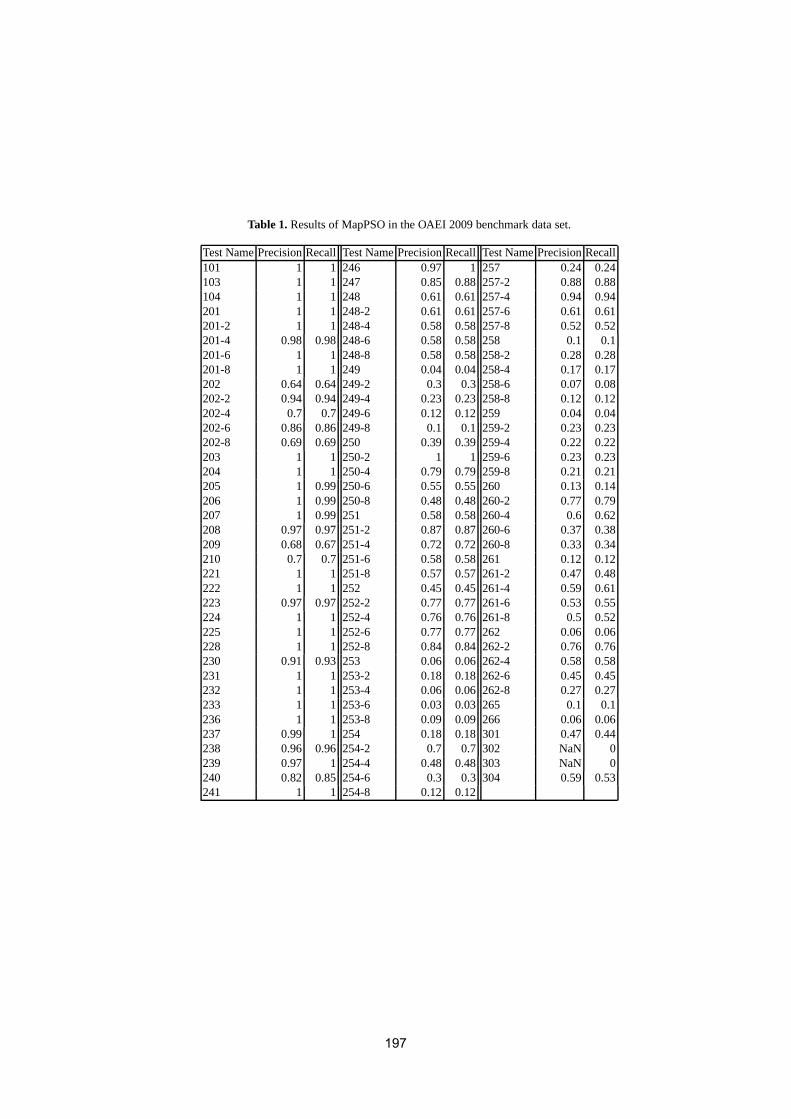
Table 1.Results of MapPSO in the OAEI 2009 benchmark data set.
Test NamePrecisionRecall Test NamePrecisionRecall Test NamePrecisionRecall101 1 1 246 0.97 1 257 0.24 0.24103 1 1 247 0.85 0.88 257-2 0.88 0.88104 1 1 248 0.61 0.61 257-4 0.94 0.94201 1 1 248-2 0.61 0.61 257-6 0.61 0.61201-2 1 1 248-4 0.58 0.58 257-8 0.52 0.52201-4 0.98 0.98 248-6 0.58 0.58 258 0.1 0.1201-6 1 1 248-8 0.58 0.58 258-2 0.28 0.28201-8 1 1 249 0.04 0.04 258-4 0.17 0.17202 0.64 0.64 249-2 0.3 0.3 258-6 0.07 0.08202-2 0.94 0.94 249-4 0.23 0.23 258-8 0.12 0.12202-4 0.7 0.7 249-6 0.12 0.12 259 0.04 0.04202-6 0.86 0.86 249-8 0.1 0.1 259-2 0.23 0.23202-8 0.69 0.69 250 0.39 0.39 259-4 0.22 0.22203 1 1 250-2 1 1 259-6 0.23 0.23204 1 1 250-4 0.79 0.79 259-8 0.21 0.21205 1 0.99 250-6 0.55 0.55 260 0.13 0.14206 1 0.99 250-8 0.48 0.48 260-2 0.77 0.79207 1 0.99 251 0.58 0.58 260-4 0.6 0.62208 0.97 0.97 251-2 0.87 0.87 260-6 0.37 0.38209 0.68 0.67 251-4 0.72 0.72 260-8 0.33 0.34210 0.7 0.7 251-6 0.58 0.58 261 0.12 0.12221 1 1 251-8 0.57 0.57 261-2 0.47 0.48222 1 1 252 0.45 0.45 261-4 0.59 0.61223 0.97 0.97 252-2 0.77 0.77 261-6 0.53 0.55224 1 1 252-4 0.76 0.76 261-8 0.5 0.52225 1 1 252-6 0.77 0.77 262 0.06 0.06228 1 1 252-8 0.84 0.84 262-2 0.76 0.76230 0.91 0.93 253 0.06 0.06 262-4 0.58 0.58231 1 1 253-2 0.18 0.18 262-6 0.45 0.45232 1 1 253-4 0.06 0.06 262-8 0.27 0.27233 1 1 253-6 0.03 0.03 265 0.1 0.1236 1 1 253-8 0.09 0.09 266 0.06 0.06237 0.99 1 254 0.18 0.18 301 0.47 0.44238 0.96 0.96 254-2 0.7 0.7 302 NaN 0239 0.97 1 254-4 0.48 0.48 303 NaN 0240 0.82 0.85 254-6 0.3 0.3 304 0.59 0.53241 1 1 254-8 0.12 0.12
197

0
0.2
0.4
0.6
0.8 1
101
103
104
201
201-2
201-4
201-6
201-8
202
202-2
202-4
202-6
202-8
203
204
205
206
207
208
209
210
221
222
223
224
225
228
230
231
232
233
236
237
238
239
240
241
246
247
248
248-2
248-4
248-6
248-8
249
249-2
249-4
249-6
249-8
250
250-2
250-4
250-6
250-8
251
251-2
251-4
251-6
251-8
252
252-2
252-4
252-6
252-8
253
253-2
253-4
253-6
253-8
254
254-2
254-4
254-6
254-8
257
257-2
257-4
257-6
257-8
258
258-2
258-4
258-6
258-8
259
259-2
259-4
259-6
259-8
260
260-2
260-4
260-6
260-8
261
261-2
261-4
261-6
261-8
262
262-2
262-4
262-6
262-8
265
266
301
302
303
304
Precision
Recall
Fig. 1. Results of MapPSO in the OAEI 2009 benchmark data set.
198
information present in the ontologies. With respect to the quality improvement, it isplanned to further investigate in the detailed implementation of these base matchers. Inparticular, there are plans to incorporate implicit knowledge inferred by a reasoner, aswell as more sophisticated graph similarity measures. It isalso necessary to review thesimilarity aggregation for each correspondence in order tobetter respect the differentcharacteristics of different ontologies by weighting themdifferently.
There are further plans to deploy the system on a larger computing platform, suchas a cloud infrastructure in order to utilise the full potential of the parallel nature of thesystem. This will be a small step with large impact, as it enables the tool to processlarge ontologies in reasonable time.
4 Conclusion
The results of the MapPSO system in the benchmark dataset of the OAEI 2009 havebeen presented. Compared to last year, the system has been extended mainly in termsof additional and refined base matchers, as proposed in the future plans section of lastyear’s contribution [1]. This development resulted in a significant improvement of thealignment results. Future developments will focus on the scalability of the system byenabling the full potential of the parallel nature of the algorithm.
References
1. Bock, J., Hettenhausen, J.: MapPSO Results for OAEI 2008.In Shvaiko, P., Euzenat, J.,Giunchiglia, F., Stuckenschmidt, H., eds.: Proceedings ofthe 3rd International Workshopon Ontology Matching (OM-2008). Volume 431 of CEUR WorkshopSeries., CEUR-WS.org(November 2008)
2. Correa, E.S., Freitas, A.A., Johnson, C.G.: A New Discrete Particle Swarm Algorithm Appliedto Attribute Selection in a Bioinformatics Data Set. In: Proceedings of the 8th Genetic andEvolutionary Computation Conference (GECCO-2006), New York, NY, USA, ACM (2006)35–42
3. Correa, E.S., Freitas, A.A., Johnson, C.G.: Particle Swarm and Bayesian Networks Appliedto Attribute Selection for Protein Functional Classification. In: Proceedings of the 9th Ge-netic and Evolutionary Computation Conference (GECCO-2007), New York, NY, USA, ACM(2007) 2651–2658
4. Stoilos, G., Stamou, G., Kollias, S.: A String Metric For Ontology Alignment. In Gil, Y.,Motta, E., Benjamins, V.R., Musen, M.A., eds.: Proceedingsof the 4rd International SemanticWeb Conference (ISWC). Volume 3729 of LNCS., Berlin, Springer (November 2005) 624–637
5. Salton, G., Wong, A., Yang, C.S.: A Vector Space Model for Automatic Indexing. Commu-nications of the ACM18(11) (1975) 613–620
199
Results of OKKAM Feature Based Entity MatchingAlgorithm for Instance Matching Contest of OAEI 2009
Heiko Stoermer, Nataliya Rassadko
name.surname-at-unitn.itThe University of Trento
via Sommarive, 14 Povo 38123 Italy
Abstract. To investigate the problem of entity recognition, we deal with thecreation of the so-called Entity Name System (ENS) which is an open, publicback-bone infrastructure for the (Semantic) Web that enables the creation andsystematic re-use of unique identifiers for entities. The ENS can be seen as avery large, distributed “phonebook for everything”, and ENS identifiers might beconsidered as a “phone number” of entities. Entity descriptions are based on free-form key/value “tagging” rather than on some precise formalism. However, sucha genericity has its shortcomings: the ENS can never know what type of entity itis dealing with. We tackle this problem in a novel approach for entity matchingthat is called Feature Based Entity Matching (FBEM). In the current paper, wereport an evaluation of FBEM on datasets provided by the OAEI committee forthe instance matching contest.
1 Presentation of the system
With the growth and development of Semantic Web, the latter became like a collectionof “information islands” which are poorly integrated to each other. The problem ofinformation integration in Semantic Web is two-fold:
1. heterogeneity of vocabulary: the same concept can be referred via different URIs,and therefore may be considered to be as different concepts in different vocabular-ies;
2. entity recognition: the same real word object can be referred via different URIs indifferent repositories, and therefore may not be recognized as the same object.
While the first issue is widely recognized and investigated [4], the second one waslargely neglected, although it received a lot of attention under the heading of recordlinkage, data deduplication, entity resolution, etc [1].
To investigate the problem of entity recognition, EU-funded OKKAM project1
deals with the creation of the so-called Entity Name System (ENS) [3].
1 http://www.okkam.org
200
1.1 State, purpose, general statement
In this section, we introduce the ENS and describe our interest in instance matchingpart of OAEI 2009.
Entity Name System (ENS) [3] is an open, public back-bone infrastructure for the(Semantic) Web that enables the creation and systematic re-use of unique identifiersfor entities. It is implemented as a large-scale infrastructural component with a set ofservices needed for describing entities, and assigning identifiers to them.
Figuratively, the ENS can be seen as a very large, distributed “phonebook for ev-erything”, and ENS identifiers might be considered as a “phone number” of entities.This leads to a more efficient information integration, and thus a real global knowledgespace, without the need for ex-post deduplication or entity consolidation.
In the ENS, we do not impose or enforce the usage of any kind of schema or strongtyping for the description of different types of entities. Instead, entity descriptions arefree-form and are based on key/value “tagging”. In such a way, we support a completegenericity, without the need for any formalism or any abstract top-level categorizations.Taking into account the aforementioned peculiarities of the ENS, our restriction to theinstance matching part of OAEI 2009 becomes evident.
Obviously, our model of such a generic entity description has its shortcomings:the ENS can never know what type of entity it is dealing with, and how the entityis described, due to an absence of a formal model. This becomes very relevant whensearching for an entity, a process that we call entity matching. To address this problem,we rely on recent work [2] that has been performed with the goal to find out in anexperimental setting how people actually describe (identify) entities. Based on thesefindings, we propose a novel approach for entity matching.
The approach takes into account not only the similarity of entity features (keysand values), but also the circumstance that certain features are more meaningful foridentifying an entity than others. We call this approach as Feature Based Entity Model(FBEM) and we explain it in the next section.
1.2 Specific techniques used
We consider both a reference (matching) entityQ and candidate (matched) entityE asa setF of featuresf :
F = {f}; f =< n, v >;
where each featuref is a pair of namen and valuev. We do not require neither namenor value to share a vocabulary or schema, or even a natural language, i.e., they areindependent in content and size.
We enumerate all features of any particular entity with integer values and denote asfQ
i , fEj theith andjth features of entitiesQ andE respectively.
We define the following functions:
n(fi): returns thenamepart of a feature of an entity;v(fi): returns thevaluepart.
201
Now, we definefi,jsim(fQ, fE), a function that computes the similarity of twofeaturesfQ
i , fEj as follows:
fi,jsim(fQ, fE) =def
sim�fQ
i , fEj
�∗
8>>>>>><>>>>>>:
2 ∗ λ ∗ µ, for name(n(fQi )), name(n(fE
j )), id(fQi , fE
j );
2 ∗ µ, for name(n(fQi )), name(n(fE
j ));
λ ∗ µ, for name(n(fEj )), id(fQ
i , fEj );
µ, for name(n(fEj ));
1, otherwise.
(1)
Equation 1 relies on the following functions and parameters:
sim(x, y) : a suitable string similarity measure betweenx andy.name(x) : a boolean function indicating whether the featurex denotes one of the pos-
sible names of the entity;id(x, y) : the identity function, returning true if value parts ofx andy are identical;µ : the factor to which a name feature is considered more important than a non-name
feature;λ : the extra-factor attributed to the the presence of the value identityid(x, y).
In our implementation, we selected Levenstein metric as a similarity measure (sim-function), and bothλ andµ equal to 2. The latter can be interpreted as “the occurrenceof a fact is as twice as important than its absence”.
We have also implemented a vocabulary, small enough to be maintained in a run-time memory, that is used to detect the cases where entity feature name is actually a“name” of the entity, e.g., “name”, “label”, “title”, “denomination”, “moniker”.
At this point, we are able to establish the similarity between individual features. Tocompute the complete feature-based entity similarity, which finally expresses to whichextendE is similar toQ, we proceed as follows.
Letmaxv(V ) be a function that computes the maximum value in a vector2. We thenspan the matrix M of feature similarities between Q and E, defined as
M := (fsim (Q,E))|Q|×|E| → Q ≥ 0
with fsim as defined above, and|Q|, |E| being the number of elements of the vectorsQ and E, respectively.
The feature-based entity similarity scorefs is defined as the sum of all themaximumsimilar feature combinations betweenQ andE:
fs (Q,E) =|Q|∑
i=1
maxv(Mi) (2)
2 Trivially defined asmaxv (V ) = max|V |i=1 (Vi), with |V | being the number of elements ofV .
202
So far, we provided a method to calculatefs-similarity that may belong to a widerange of values from zero to infinity [5]. This complicates an evaluation of actual sim-ilarity of entities. For example, iffs = 7 it might stand for identical entities in onedataset and completely different entities in the other one.
To resolve this problem, we normalizefs values as follows. Taking into accountthat Mi is a weighted value, we use a dot-notation to denote its weightw asMi.w.Then the final formula ofnormalizedsimilarity has the following form:
esim(Q,E) =fs(Q,E)∑|Q|
i=1 maxv(Mi).w(3)
In the last formula, we simply divided a sum of weighted values on a sum of cor-responding weights. This allows us to normalize similarity score within the range of[sim(x, y)min, sim(x, y)max], e.g.,[0, 1] if similarity metric return the values in thisrange, which is true for Levenstein similarity.
1.3 Adaptations made for the evaluation
We parsed all provided rdf-files into a Jena-model3 stored as a persistent SDB4 withan underlying MySQL database5. To adapt our FBEM-model to the required outputin the alignment format6, we wrote a simple iterator over SDB-instances related toreference entitiesQ and to candidate entitiesE, i.e., we matched eachQ against eachE, where bothQ andE were preliminarily converted to the ENS entity format.
For the reason of a better time-performance, we implemented a “typed” matching,i.e., Q and E should have been of the same entity type (e.g., people were matchedagainst people, documents against documents). The types were easy to extract from theattribute “type” available in most benchmarks. We also implemented a “brute-force”matching, i.e. any-to-any, which did not consider any type features, to match thosebenchmarks where typing was not provided or was difficult to reason.
For eachQ, we maintained a vector ofE ranked w.r.t. a similarity valueesim(Q, E).The length of vector was limited to 50 elements due to time- and memory- performancereasons.
In the alignment file, we output only those elements of vector ofEs that had a simi-larity value greater than or equal to a certain threshold. The threshold was selected em-pirically for each particular benchmark. More precisely, we run experiments for thresh-olds from the set{0.60, 0.65, 0.70, 0.75, 0.80, 0.85, 0.90, 0.95} and then selected thatthresholds that gave us the most acceptable values of precision/recall from the view-point of the ENS methodology. Namely, we were eager to maintain as high precision aspossible with any non-zero recall.
The reason for selecting precision of the ENS performance was the following: weassume that the ENS user, while querying the ENS repository, expects few answers in
3 http://jena.sourceforge.net/4 http://jena.sourceforge.net/SDB/5 http://mysql.com6 http://alignapi.gforge.inria.fr/format.html
203
the result set. However, these answers should be the most relevant to the user query. Inother words, for the ENS it’s better to answer with some highly precise entities ratherthan with a lot of somehow likely similar entities.
Precise threshold values we used to run FBEM-matching over each particular bench-mark will be indicated in Sec. 2.
1.4 Link to the system and parameters file
http://www.dit.unitn.it/˜rassadko/OAEI2009/okkamsystem.zip
1.5 Link to the set of provided alignments (in align format)
http://www.dit.unitn.it/˜rassadko/OAEI2009/okkamalignment.zip
2 Results
Due to peculiarities of the ENS described in Sec. 1.1, we have restricted ourselves onlyto instance matching benchmarks.
2.1 A-R-S
The benchmark contains includes three datasets describimg instances from the domainof scientific publications:
– eprints - this dataset contains papers produced within the AKT research project andextracted using an HTML-wrapper from the source web-site;
– rexa - this dataset was extracted from the search results of the search server;– SWETO-DBLP - a version of the DBLP dataset.
For A-R-S benchmark we applied a “typed” version (see Sec. 1.3) of FBEM-matchingbecause all three datasets contained information about authors (typed withfoaf names-pace7) and their scientific publication (typed withopusnamespace8).
We run our experiment with threshold 0.80. The result of our experiments are pre-sented in Table 1.
In Sec. 1.3, we explained that we are interested in high precision with any non-zero recall. As Table 1 shows, we gained our objective. With a less tight threshold, it ispossible to slightly sacrifice a precision for a better recall.
2.2 T-S-D
For this dataset we do not have results. First of all, typing of each particular data sourcewas different from the others. This required reasoning over ontologies which were pro-vided with datasets. Since our system does not support any kind of ontology reasoning,one might have made an attempt to run a “brute-force” matching, i.e., any-to-any. Un-fortunately, due to a large size of data, we were unable to finish the match run timely.
7 http://xmlns.com/foaf/0.1/8 http://lsdis.cs.uga.edu/projects/semdis/opus
204
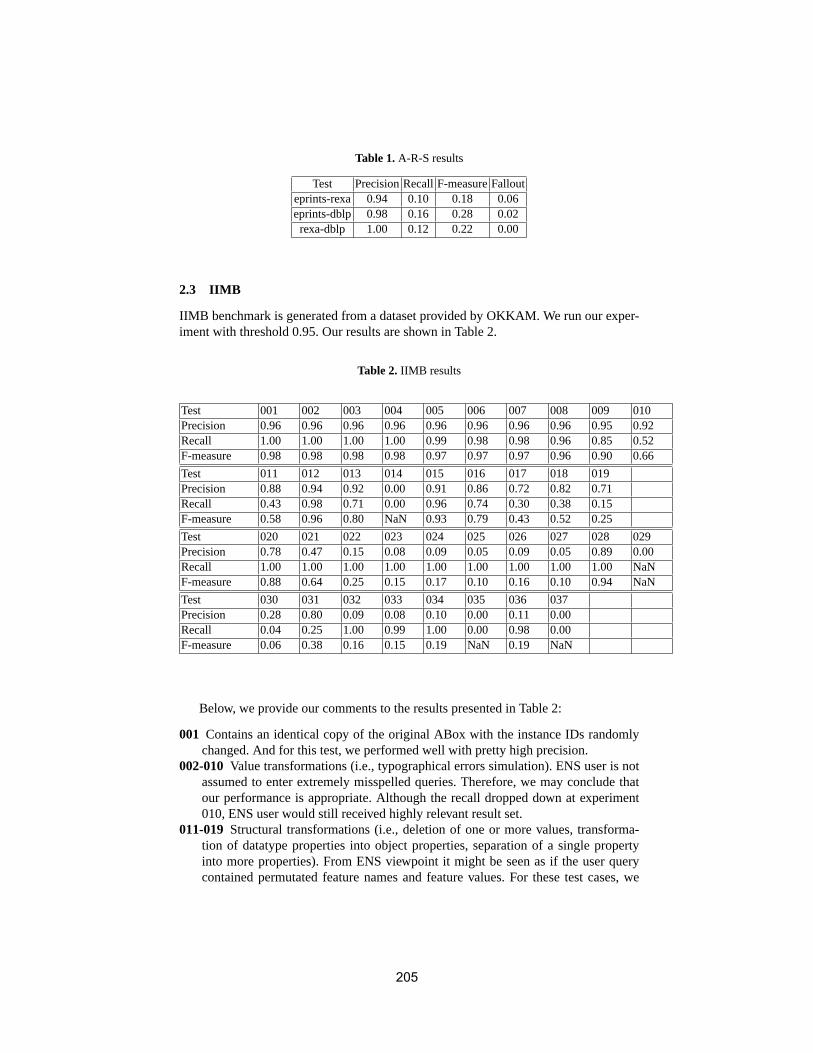
Table 1.A-R-S results
Test PrecisionRecallF-measureFallouteprints-rexa 0.94 0.10 0.18 0.06eprints-dblp 0.98 0.16 0.28 0.02rexa-dblp 1.00 0.12 0.22 0.00
2.3 IIMB
IIMB benchmark is generated from a dataset provided by OKKAM. We run our exper-iment with threshold 0.95. Our results are shown in Table 2.
Table 2. IIMB results
Test 001 002 003 004 005 006 007 008 009 010Precision 0.96 0.96 0.96 0.96 0.96 0.96 0.96 0.96 0.95 0.92Recall 1.00 1.00 1.00 1.00 0.99 0.98 0.98 0.96 0.85 0.52F-measure 0.98 0.98 0.98 0.98 0.97 0.97 0.97 0.96 0.90 0.66
Test 011 012 013 014 015 016 017 018 019Precision 0.88 0.94 0.92 0.00 0.91 0.86 0.72 0.82 0.71Recall 0.43 0.98 0.71 0.00 0.96 0.74 0.30 0.38 0.15F-measure 0.58 0.96 0.80 NaN 0.93 0.79 0.43 0.52 0.25
Test 020 021 022 023 024 025 026 027 028 029Precision 0.78 0.47 0.15 0.08 0.09 0.05 0.09 0.05 0.89 0.00Recall 1.00 1.00 1.00 1.00 1.00 1.00 1.00 1.00 1.00 NaNF-measure 0.88 0.64 0.25 0.15 0.17 0.10 0.16 0.10 0.94 NaN
Test 030 031 032 033 034 035 036 037Precision 0.28 0.80 0.09 0.08 0.10 0.00 0.11 0.00Recall 0.04 0.25 1.00 0.99 1.00 0.00 0.98 0.00F-measure 0.06 0.38 0.16 0.15 0.19 NaN 0.19 NaN
Below, we provide our comments to the results presented in Table 2:
001 Contains an identical copy of the original ABox with the instance IDs randomlychanged. And for this test, we performed well with pretty high precision.
002-010 Value transformations (i.e., typographical errors simulation). ENS user is notassumed to enter extremely misspelled queries. Therefore, we may conclude thatour performance is appropriate. Although the recall dropped down at experiment010, ENS user would still received highly relevant result set.
011-019 Structural transformations (i.e., deletion of one or more values, transforma-tion of datatype properties into object properties, separation of a single propertyinto more properties). From ENS viewpoint it might be seen as if the user querycontained permutated feature names and feature values. For these test cases, we
205
have medium performance: with the precision around 0.70-0.90, the recall variesfrom 0.15 to 0.98. We believe, that these results are still acceptable for the ENSuser.
020-029 Logical transformations (i.e., instantiation of identical individuals into differ-ent subclasses of the same class, instantiation of identical individuals into disjointclasses, instantiation of identical individuals into different classes of an explicitlydeclared class hierarchy). These cases are impossible for ENS because ENS doesnot have any schema or ontology. Yet having conducted a “brute-force” (non-typed)matching of each entityQ against each entityE, we could still provide the ENSuser with some information.
030-037 Several combinations of the previous transformations. For these test cases, wehave an uneven performance which is expected.
3 General comments
3.1 Comments on the results
We mainly commented our results in Sec. 2. In general, we believe that FBEM performswell for the purposes of the ENS. Namely, we are able to answer user queries with ahigh precision. And this is a strength of our approach. As the weakness, we have toadmit that recall values are not so much satisfactory. And in the next section, we willdiscuss the ways to deal with this problem.
3.2 Discussions on the way to improve the proposed system
We need to experiment with other similarity metricssim(x, y) since Levenstein metricsdeals badly with the permutated words, e.g., “Stephen Potter” and “Potter, Stephen”.This can lead to a low recall as in our results for A-R-S benchmark.
Basic structural analysis is also planned to be introduced. For example, one entityQ may have attributes “first name” and “given name” while entityE can contain only“name” (i.e. both first and give name together). We believe that elements of structuralanalysis will help us improve both precision and recall for the cases like in tests 20-29for IIMB benchmark.
We are currently working on a more extended version of FBEM-model which con-centrates not only on names of entities, but also on other features that might identifyentity. For example, a feature “isbn” uniquely identifies book, “e-mail” likely identifiesa person etc. We will rely on the empirical study [2] which we mentioned above.
Finally, we did not expect the datasets larger than 1Gb. However, this forced us toinclude in our future research also a loaded bulk-matching, e.g., 1Gb dataset against1Gb dataset.
3.3 Comments on the OAEI 2009 procedure
We are satisfied with the OAEI 2009 procedure.
206
3.4 Comments on the OAEI 2009 test cases
As we said above, the test cases turned to be unfeasible for our matching procedure.
3.5 Comments on the OAEI 2009 measures
We are satisfied with the OAEI 2009 measures.
3.6 Proposed new measures
No proposals.
4 Conclusion
In the current paper, we proposed an evaluation of a novel approach for entity matchingthat is called Feature Based Entity Matching (FBEM) over datasets provided by theOAEI committee for the instance matching contest.
Since FBEM could be a candidate to a set of matching modules of the ENS, we wereeager to maintain as high precision as possible with any non-zero recall. In general, wegained our objective. Namely, we perform well in the cases where there is no need inontology reasoning or structural analysis.
We are satisfied with our results. However, there are several directions (see Sec. 3.2)to improve the performance of FBEM from the viewpoint of both precision and recallvalues.
Acknowledgments.This paper has been supported by the FP7 EU Large-scale Inte-grating Project OKKAM “Enabling a Web of Entities” (contract no. ICT-215032). Formore details, visithttp://fp7.okkam.org .
References
1. Duplicate record detection: A survey.IEEE Trans. on Knowl. and Data Eng., 19(1):1–16,2007. Senior Member-Elmagarmid, Ahmed K. and Member-Ipeirotis, Panagiotis G. andMember-Verykios, Vassilios S.
2. B. Bazzanella, P. Bouquet, and H. Stoermer. A Cognitive Contribution to Entity Representa-tion and Matching. Technical Report DISI-09-004, Ingegneria e Scienza dell’Informazione,University of Trento., 2009. http://eprints.biblio.unitn.it/archive/00001540/ .
3. P. Bouquet, H. Stoermer, C. Niederee, and A. Mana. Entity Name System: The Backbone ofan Open and Scalable Web of Data. InProceedings of the IEEE International Conference onSemantic Computing, ICSC 2008, CSS-ICSC, pages 554–561. IEEE Computer Society, 2008.
4. J. Euzenat and P. Shvaiko.Ontology matching. Springer-Verlag, Heidelberg (DE), 2007.5. H. Stoermer and P. Bouquet. A Novel Approach for Entity Linkage. InProceedings of IRI
2009, the 10th IEEE Internationational Conference on Information Reuse and Integration,August 10-12, 2009, Las Vegas, USA, volume 10 ofIRI, pages 151–156. IEEE Systems, Manand Cybernetics Society, August 2009.
207
RiMOM Results for OAEI 2009
Xiao Zhang, Qian Zhong, Feng Shi, Juanzi Li and Jie Tang
Department of Computer Science and Technology, Tsinghua University, Beijing, Chinazhangxiao,zhongqian,shifeng,ljz,[email protected]
Abstract. In this report, we give a brief explanation of how RiMOM obtains theresults at OAEI 2009 Campaign, especially in the new Instance Matching track.At first, we show the basic alignment process of RiMOM and different alignmentstrategies in RiMOM. Then we give new features in instance matching comparedwith traditional ontology matching (schema matching) and introduce the specifictechniques we used for the 3 different subtracks of Instance Matching Track. Atlast we give some comments on our results and discuss some future work aboutRiMOM.
1 Presentation of the system
Ontology matching is the key technology to reach interoperability over ontologies. Inrecent years, much research work has been conducted for finding the alignment of on-tologies[1]. Many automatic matching algorithms achieves good results in real worlddata. With the development of Linked Data[2], huge amount of semantic data are avail-able through the web. Thus instance matching, a special branch of ontology matching,draws lots of research interest recent years.
RiMOM is a multiple strategy dynamic ontology matching system implemented inJava [3]. In RiMOM, we implement several different matching strategies. Each strategyis defined based on one kind of ontological information. Moreover, we investigate thedifferences between the strategies and compare the performances of different strategieson different matching tasks. We propose a mechanism in RiMOM to choose appropriatestrategies (or strategy combination) according to the features and the information of theontologies. RiMOM can deal with unbalanced ontology matching [4]. We also try tobring user interaction into RIMOM [5]. This year We modified the RiMOM system tomake it with better support for instance matching.
1.1 State, purpose, general statement
RiMOM is a framework for ontology matching. Different kinds of alignment strategiescan be added into RiMOM. Based on the features of the input ontology and the de-fined rules, appropriate strategies are chosen to apply for the matching task. The basicmatching process of RiMOM is shown in figure 1.
There are six major steps in a general alignment process of RiMOM.
– Ontology Preprocessing and Feature Factors Estimation. The input ontologies areloaded into the memory and the ontology graph is constructed. Some redundant oruseless information are removed. Then the three ontology feature factors used instrategy selection are estimated.
208
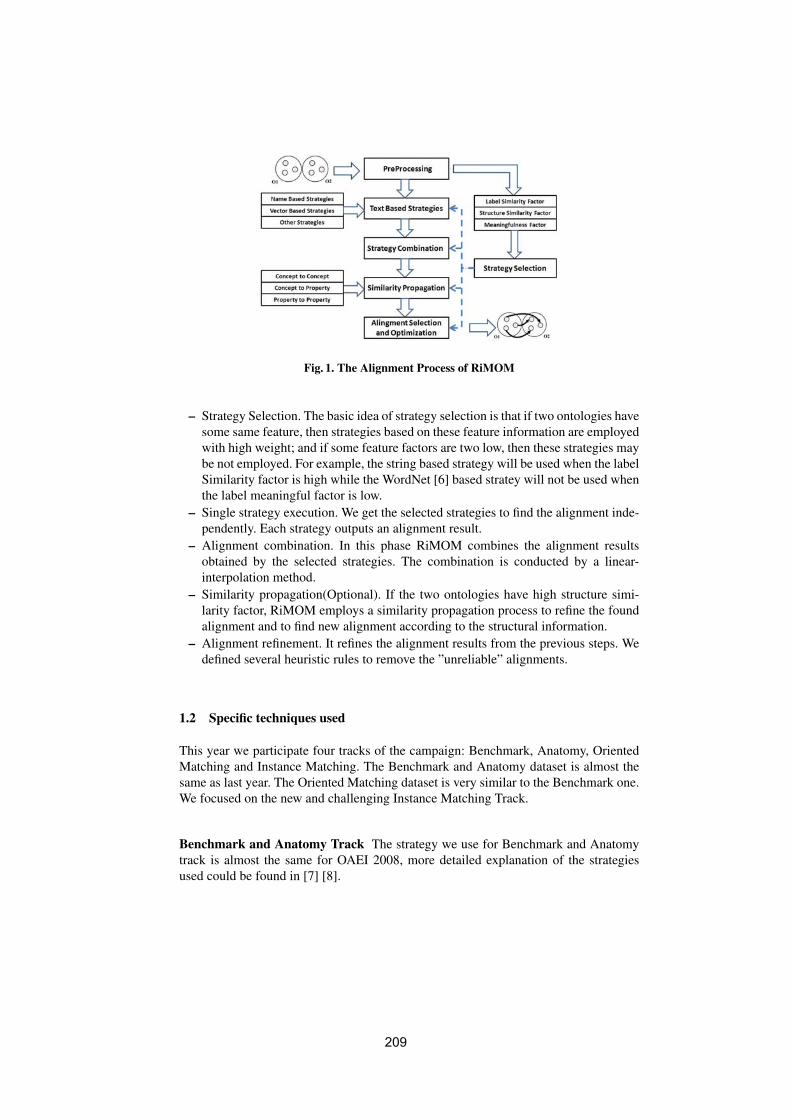
Fig. 1. The Alignment Process of RiMOM
– Strategy Selection. The basic idea of strategy selection is that if two ontologies havesome same feature, then strategies based on these feature information are employedwith high weight; and if some feature factors are two low, then these strategies maybe not employed. For example, the string based strategy will be used when the labelSimilarity factor is high while the WordNet [6] based stratey will not be used whenthe label meaningful factor is low.
– Single strategy execution. We get the selected strategies to find the alignment inde-pendently. Each strategy outputs an alignment result.
– Alignment combination. In this phase RiMOM combines the alignment resultsobtained by the selected strategies. The combination is conducted by a linear-interpolation method.
– Similarity propagation(Optional). If the two ontologies have high structure simi-larity factor, RiMOM employs a similarity propagation process to refine the foundalignment and to find new alignment according to the structural information.
– Alignment refinement. It refines the alignment results from the previous steps. Wedefined several heuristic rules to remove the ”unreliable” alignments.
1.2 Specific techniques used
This year we participate four tracks of the campaign: Benchmark, Anatomy, OrientedMatching and Instance Matching. The Benchmark and Anatomy dataset is almost thesame as last year. The Oriented Matching dataset is very similar to the Benchmark one.We focused on the new and challenging Instance Matching Track.
Benchmark and Anatomy Track The strategy we use for Benchmark and Anatomytrack is almost the same for OAEI 2008, more detailed explanation of the strategiesused could be found in [7] [8].
209
Oriented Matching Track The dataset of oriented matching track is derived fromthe benchmark dataset. Naturally, we combined the methods we use in the benchmarktrack and the sub relation in the ontology graph. Since RiMOM’s performance for theBenchmark Track is fairly good, the result shows that the combination also works forthe Oriented Matching Track. This technique is also applied for the schema matchingphase of the Instance Matching Track.
Instance Matching Track The Instance Matching Track is introduced into the cam-paign this year. The traditional ontology matching focus on the schema matching andthe ontology may contain no individual. If there are small amount of individuals, thealignment of individuals are usually used to enhance the alignment of concepts andproperties. Previous OAEI campaigns also evaluated the performance of Matching Sys-tems according to the schema matching results. By analyzing the datasets, we foundsome differences between the traditional ontology matching and instance matching. Wesummarize the differences as following:
– Ontology is used as a formal, explicit specification of a shared conceptualization[9].It defines the concepts of the domain and the relation between the concepts. Thatis to say, it describe the domain in the concept layer. However, the instance is theinstantiation of the ontology, it is composed of concrete values of the domain, andhas rich practical semantic information. As we observe, some attribute values mayclearly different from others. How to find the key attributes and key values of in-stances to facilitate the process of ontology matching is a very challenging issue.
– The ontology can be viewed as a whole ontology graph and some graph based al-gorithms are employed in ontology matching. However, a concept may have lots ofinstances and all the instances are with almost the same structure. The graph algo-rithm with the whole ontology graph is not suitable for the instance matching task.For a given instance, some other instances related to it may contain informationabout it through object properties. Moreover, the information in the instance maybe not symmetric as in the ontology. For instance, an instance A of the “Author”concept is “list author in” an instance B of the “Scientific Publication” concept.However, the statement is only written in B’s description. How to find the completeinformation of a given instance is also very important.
– The scale of instance matching is usually much more larger than ontology match-ing. The sweto data and the dbpedia data file both contain more than 800,000 in-stances which seems impossible in ontology matching. As a result, the efficiencyof the instance matching strategies becomes a major concern. Some complicatealgorithm can not be employed.
– The schema ontology for most instance files are available. So the result of ontologymatching is a very good background knowledge for instance matching. Instinc-tively, the instance pair of not matched concept pair have no chance to be matched.So with the ontology alignment, the number of instance matching candidates canbe pruned greatly. However, sometimes the ontology itself is not very well defined.For example, The DBpedia ontology does not cover all the instances in the instancefile, so the ontology itself should be enriched with instance type information.
210
With regard to the different characteristics of the three different subtracks of In-stance Matching (We do not take part in the vlcr subtrack), we employ some differentstrategies to solve the three tasks.
The A-R-S benchmark includes three datasets containing instances from the domainof scientific publications. The three data file are quite different in size, especially theDBLP file is really large. So we use some light-weight method in this subtrack. On theother hand, all the three data files are mainly in the scientific publication domain. Atfirst, we choose some data-type properties as the key attributes carefully. These proper-ties are of two types. The first type is the “sufficient” property group: if the values of theproperties between two instances are matched respectively, the two instances are con-sidered as matched. The second type is the “necessary” property group: if two instancesare marked as matched, the corresponding values should be matched. The “sufficeint”properties, such as ffoaf:nameg are employed in a edit-distance strategy to find the ini-tial alignment. The “necessary” properties, such as the opus:year, are employed to refinethe initial alignment. In the second step, a structure based matching method is used topropagate the similarities among the instances according to the object properties. Forexample, we can refine the “person” matches with the “document” alignments in termsof the fopus:authorg property.
Compared with the A-R-S benchmark which is restricted to the scientific publica-tion domain, the T-S-D benchmark covers much more wider domains. The DBpediadata is encyclopedia-like knowledge base. This makes it difficult to find particular at-tributes and values, so we take another strategy. First of all, we compute the schemamatching results with RiMOM, check the incorrect alignments and add the missingones carefully. Then for every instance, we generate a vector to describe the informationcontained in the instance. The vector contains labels of the instance, data-type propertyvalues of the instance, labels and property values of the instances related to the un-derlying one through object-type properties. Then the similarity of the instance pair ofmatched concept pair is calculated by a vector based algorithm. The weight of respec-tive element of the vector is designated by heuristic rules defined based on the structureof the instance. The instance pairs of non-matched concept pairs are discarded directly.In the DBpedia data file, there are some instances missing the rdf:type information. Wetry to match these instances with all source instances in the reference file.
The IIMB benchmark, on the other hand, is systematically generated. The dataset isconstituted using one data file by modifying it according to various criteria. The varia-tion can be sorted into three types: value transformation, structural transformation andlogical transformation. The purpose of value transformation is to simulate typographi-cal errors, so edit-distance strategy employed on the relevant property values betweeninstances is effective enough. In structural transformation, some data-type propertiesmay transformed in the form of object-type property. We design an property value pass-ing approach to cope with this kind of modification. The data-type property value of theinstance are passed to the instances connected with it through a object-type property.We also consider structural information when matching instances. If two instances havemore property values on the same properties, they will be considered more similar. Inlogical transformation, the TBox is modified, so we matching the TBox first to findthe find the relations between concepts in the TBoxes, then we try to match instances
211
according to the type information. In addition, some instance pairs with very similarproperty values but with non-matched concepts are checked. If they can match eachother, then we consider their concepts are matched to enhance the TBox alignment.When the two-direction matching process convergence to a stable matching result, wetake it as the final output.
1.3 Adaptations made for the evaluation
To reduce the number of matching candidate in T-S-D benchmark subtrack of InstanceMatching Track, the schema matching alignments is refined manually by correctingsome incorrect alignments and adding missing ones.
1.4 Link to the system and parameters file
The RiMOM System can be found at http://keg.cs.tsinghua.edu.cn/project/RiMOM/
1.5 Link to the set of provided alignments (in align format)
The results for OAEI 2009 Campaign are available at http://keg.cs.tsinghua.edu.cn/project/RiMOM/OAEI2009/
2 Results
As mentioned above, RiMOM takes part in four tracks of campaign in OAEI 2009.Normally RiMOM uses OWL-API[10] to parse RDF and OWL Files. RiMOM also usesJena API[11] to convert N3 format files into RDF files and to deal with some large scaleinstance files. The Benchmark, Oriented Matching and IIMB matching tasks are carriedout on a PC running Window XP with AMD Athlon 64 X2 4200+ processor(2.19GHz)and 2GB memory. To run the large scale matching tasks, Anatomy, A-R-S benchmarkand T-S-D benchmark, the experiments are carried out on a server running UbuntuServer 8.10 with two 4-core Intel Xeon E5440 processors(2.83GHz) and 32GB mem-ory.
2.1 Benchmark
There are in total 111 alignment tasks defined on the benchmark data set. RiMOM takesexactly the general process of matching. However, on the tasks where the labels are ab-solutely random strings, the WordNet based strategy and edit-distance based strategyare not used. The vector-similarity based strategy is always employed. RiMOM main-tains the high performance on benchmark as previous years.
212
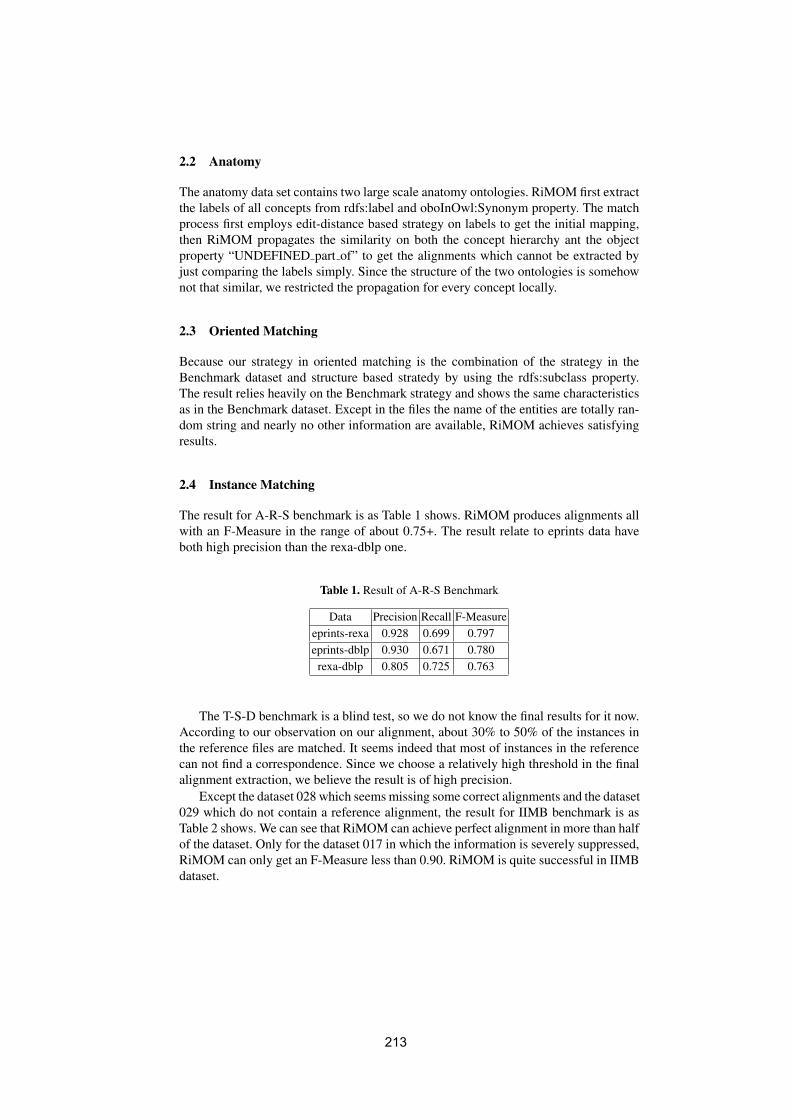
2.2 Anatomy
The anatomy data set contains two large scale anatomy ontologies. RiMOM first extractthe labels of all concepts from rdfs:label and oboInOwl:Synonym property. The matchprocess first employs edit-distance based strategy on labels to get the initial mapping,then RiMOM propagates the similarity on both the concept hierarchy ant the objectproperty “UNDEFINED part of” to get the alignments which cannot be extracted byjust comparing the labels simply. Since the structure of the two ontologies is somehownot that similar, we restricted the propagation for every concept locally.
2.3 Oriented Matching
Because our strategy in oriented matching is the combination of the strategy in theBenchmark dataset and structure based stratedy by using the rdfs:subclass property.The result relies heavily on the Benchmark strategy and shows the same characteristicsas in the Benchmark dataset. Except in the files the name of the entities are totally ran-dom string and nearly no other information are available, RiMOM achieves satisfyingresults.
2.4 Instance Matching
The result for A-R-S benchmark is as Table 1 shows. RiMOM produces alignments allwith an F-Measure in the range of about 0.75+. The result relate to eprints data haveboth high precision than the rexa-dblp one.
Table 1. Result of A-R-S Benchmark
Data Precision Recall F-Measureeprints-rexa 0.928 0.699 0.797eprints-dblp 0.930 0.671 0.780
rexa-dblp 0.805 0.725 0.763
The T-S-D benchmark is a blind test, so we do not know the final results for it now.According to our observation on our alignment, about 30% to 50% of the instances inthe reference files are matched. It seems indeed that most of instances in the referencecan not find a correspondence. Since we choose a relatively high threshold in the finalalignment extraction, we believe the result is of high precision.
Except the dataset 028 which seems missing some correct alignments and the dataset029 which do not contain a reference alignment, the result for IIMB benchmark is asTable 2 shows. We can see that RiMOM can achieve perfect alignment in more than halfof the dataset. Only for the dataset 017 in which the information is severely suppressed,RiMOM can only get an F-Measure less than 0.90. RiMOM is quite successful in IIMBdataset.
213
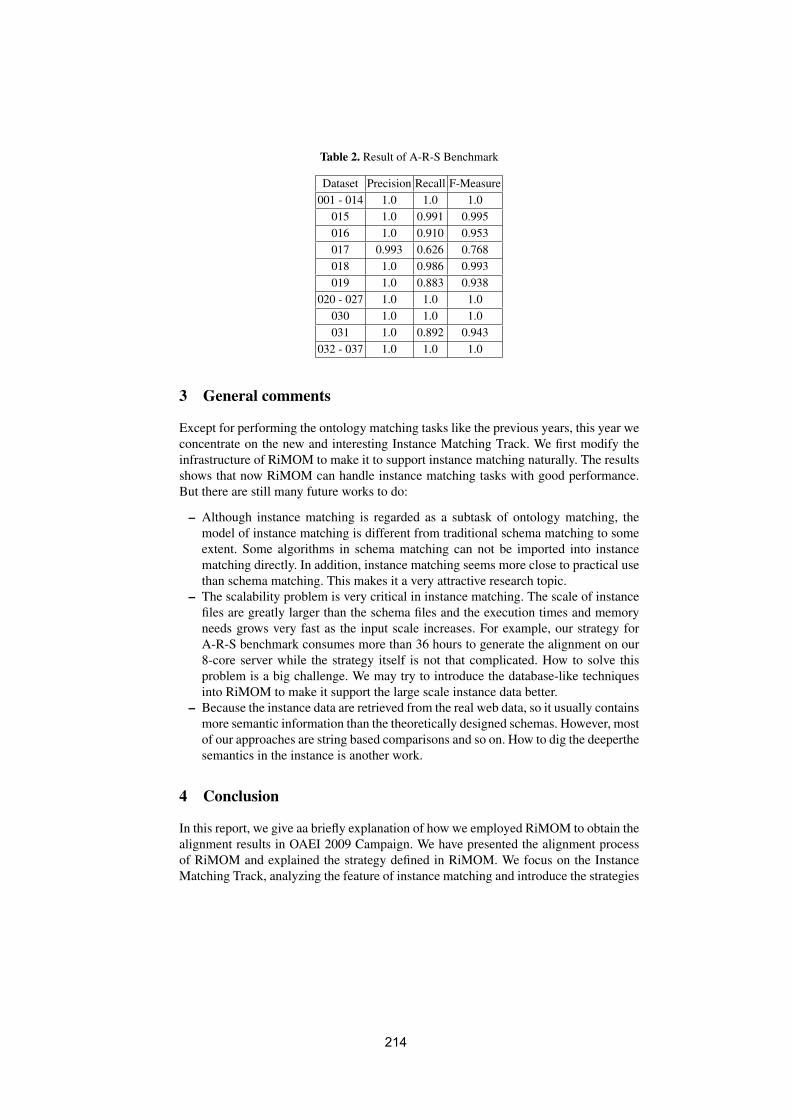
Table 2. Result of A-R-S Benchmark
Dataset Precision Recall F-Measure001 - 014 1.0 1.0 1.0
015 1.0 0.991 0.995016 1.0 0.910 0.953017 0.993 0.626 0.768018 1.0 0.986 0.993019 1.0 0.883 0.938
020 - 027 1.0 1.0 1.0030 1.0 1.0 1.0031 1.0 0.892 0.943
032 - 037 1.0 1.0 1.0
3 General comments
Except for performing the ontology matching tasks like the previous years, this year weconcentrate on the new and interesting Instance Matching Track. We first modify theinfrastructure of RiMOM to make it to support instance matching naturally. The resultsshows that now RiMOM can handle instance matching tasks with good performance.But there are still many future works to do:
– Although instance matching is regarded as a subtask of ontology matching, themodel of instance matching is different from traditional schema matching to someextent. Some algorithms in schema matching can not be imported into instancematching directly. In addition, instance matching seems more close to practical usethan schema matching. This makes it a very attractive research topic.
– The scalability problem is very critical in instance matching. The scale of instancefiles are greatly larger than the schema files and the execution times and memoryneeds grows very fast as the input scale increases. For example, our strategy forA-R-S benchmark consumes more than 36 hours to generate the alignment on our8-core server while the strategy itself is not that complicated. How to solve thisproblem is a big challenge. We may try to introduce the database-like techniquesinto RiMOM to make it support the large scale instance data better.
– Because the instance data are retrieved from the real web data, so it usually containsmore semantic information than the theoretically designed schemas. However, mostof our approaches are string based comparisons and so on. How to dig the deeperthesemantics in the instance is another work.
4 Conclusion
In this report, we give aa briefly explanation of how we employed RiMOM to obtain thealignment results in OAEI 2009 Campaign. We have presented the alignment processof RiMOM and explained the strategy defined in RiMOM. We focus on the InstanceMatching Track, analyzing the feature of instance matching and introduce the strategies
214
we use in this track. The experiments illustrates that our system RiMOM can achievegood results in both schema matching and instance matching tracks. We also discussthe future work we will do to improve our system.
Acknowledgement
The work is supported by the National Natural Science Foundation of China (No.60973102 and No. 60703059), the National Basic Research Program of China (973 Pro-gram) (No. 2007CB310803), the National High-tech R&D Program (No. 2009AA01Z138),and the Chinese Young Faculty Research Fund (No. 20070003093).It is also supportedby IBM SUR joint project.
References
1. J. Euzenat and P. Shivako. Ontology Matching. Springer-Verlag, Berlin Heidelberg (DE),2007.
2. http://linkeddata.org/.3. J. Li, J. Tang, Y. Li, and Q. Luo. RiMOM: A dynamic multi-strategy ontology alignment
framework. IEEE Transaction on Knowledge and Data Engineering, 21(8):1218–1232, Aug2009.
4. Q. Zhong, H. Li, J. Li, G. Xie, and J. Tang. A Gauss Function based approach for unbal-anced ontology matching. In Proc. of the 2009 ACM SIGMOD international conference onManagement of data (SIGMOD’2009), Jul 2009.
5. F. Shi, J. Li, and J. Tang. Actively learning ontology matching via user interaction. In Proc.of the 8th International Conference of Semantic Web (ISWC’2009), Oct 2009.
6. http://wordnet.princeton.edu/.7. Y. Li, J. Li, D. Zhang, and J. Tang. Results of ontology alignment with RiMOM. In Proc. of
the Second International Workshop on Ontology Matching (OM’07), Nov 2007.8. X. Zhang, Q. Zhong, J. Li, J. Tang, G. Xie, and H. Li. RiMOM results for OAEI 2008. In
Proc. of the Third International Workshop on Ontology Matching (OM’08), 2008.9. T. R. Grubber. A translation approach to portable ontology specification. Knowledge Acqui-
sition, 5:199–200, 1993.10. http://owlapi.sourceforge.net/.11. http://jena.sourceforge.net/.
215
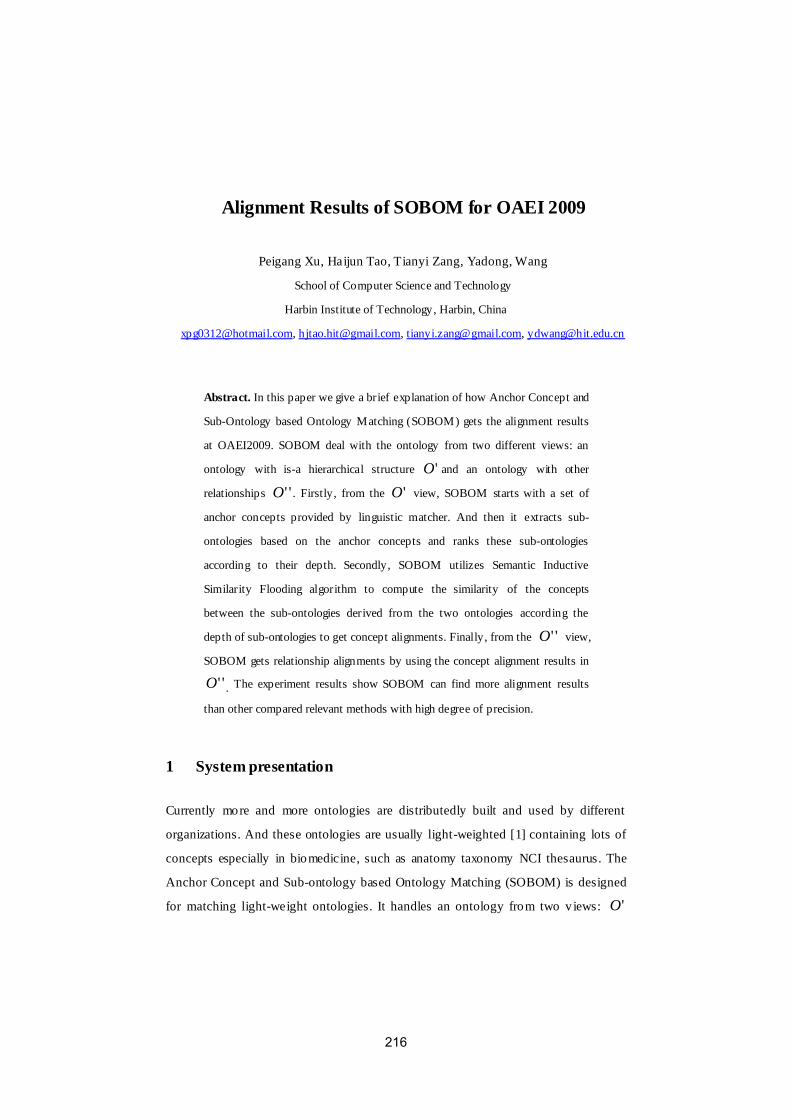
Alignment Results of SOBOM for OAEI 2009
Peigang Xu, Haijun Tao, Tianyi Zang, Yadong, Wang
School of Computer Science and Technology
Harbin Institute of Technology, Harbin, China
[email protected], [email protected], [email protected], [email protected]
Abstract. In this paper we give a brief explanation of how Anchor Concept and
Sub-Ontology based Ontology Matching (SOBOM) gets the alignment results
at OAEI2009. SOBOM deal with the ontology from two different views: an
ontology with is-a hierarchical structure 'O and an ontology with other
relationships ''O . Firstly, from the 'O view, SOBOM starts with a set of
anchor concepts provided by linguistic matcher. And then it extracts sub-
ontologies based on the anchor concepts and ranks these sub-ontologies
according to their depth. Secondly, SOBOM utilizes Semantic Inductive
Similarity Flooding algorithm to compute the similarity of the concepts
between the sub-ontologies derived from the two ontologies according the
depth of sub-ontologies to get concept alignments. Finally, from the ''O view,
SOBOM gets relationship alignments by using the concept alignment results in
''O . The experiment results show SOBOM can find more alignment results
than other compared relevant methods with high degree of precision.
1 System presentation
Currently more and more ontologies are distributedly built and used by different
organizations. And these ontologies are usually light-weighted [1] containing lots of
concepts especially in biomedicine, such as anatomy taxonomy NCI thesaurus. The
Anchor Concept and Sub-ontology based Ontology Matching (SOBOM) is designed
for matching light-weight ontologies. It handles an ontology from two v iews: 'O
216
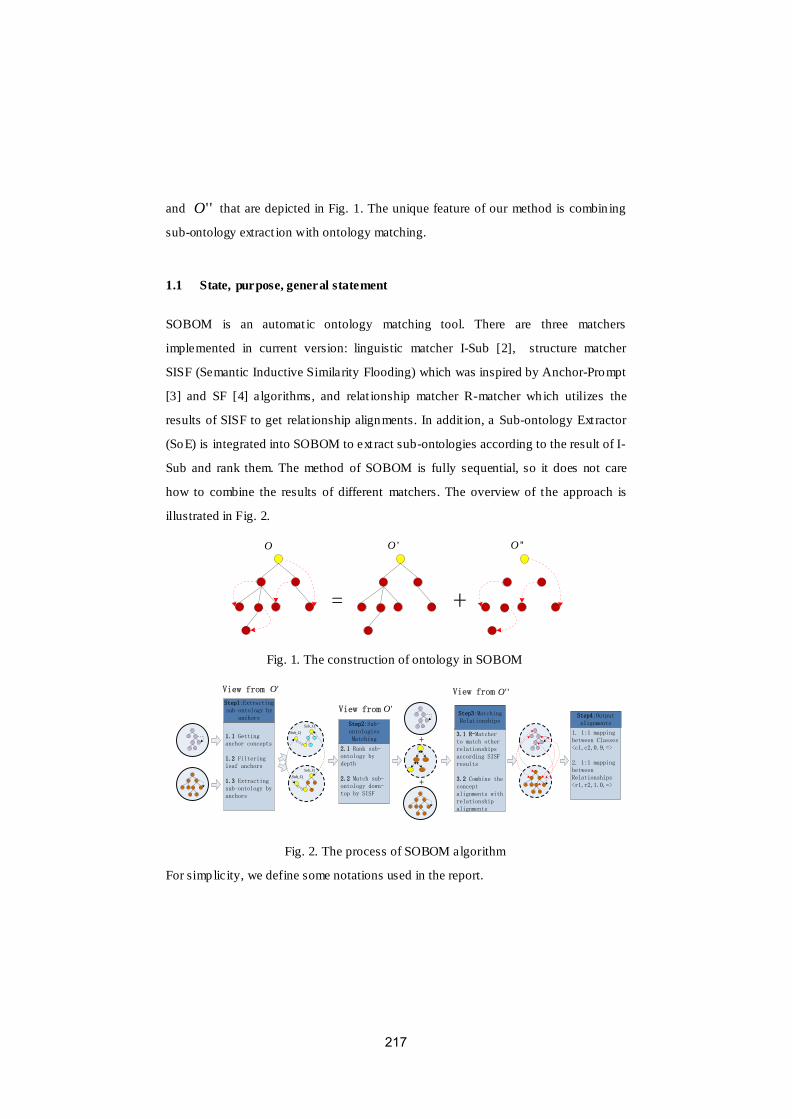
and ''O that are depicted in Fig. 1. The unique feature of our method is combin ing
sub-ontology extract ion with ontology matching.
1.1 State, purpose, general statement
SOBOM is an automat ic ontology matching tool. There are three matchers
implemented in current version: linguistic matcher I-Sub [2], structure matcher
SISF (Semantic Inductive Similarity Flooding) which was inspired by Anchor-Prompt
[3] and SF [4] algorithms, and relat ionship matcher R-matcher which utilizes the
results of SISF to get relat ionship alignments. In addit ion, a Sub-ontology Extractor
(SoE) is integrated into SOBOM to ext ract sub-ontologies according to the result of I-
Sub and rank them. The method of SOBOM is fully sequential, so it does not care
how to combine the results of different matchers. The overview of the approach is
illustrated in Fig. 2.
+
O 'O ''O
=
Fig. 1. The construction of ontology in SOBOM
2.1 Rank sub-ontology by depth
2.2 Match sub-ontology down-top by SISF
1.1 Getting anchor concepts
1.2 Filtering leaf anchors
1.3 Extracting sub-ontology by anchors
Step1:Extracting sub-ontology by
anchors
3.1 R-Matcher to match other relationships according SISF results
3.2 Combine the concept alignments with relationship alignments
Step3:Matching Relationships
Step2:Sub-ontologies Matching
Step4:Output alignments
1. 1:1 mapping between Classes<c1,c2,0.9,=>
2. 1:1 mapping between Relationships <r1,r2,1.0,=>
+
+
View from 'O
View from 'O
View from ''O
2_OSub
2_OSub
1_OSub
1_OSub
Fig. 2. The process of SOBOM algorithm
For simplicity, we define some notations used in the report.
217
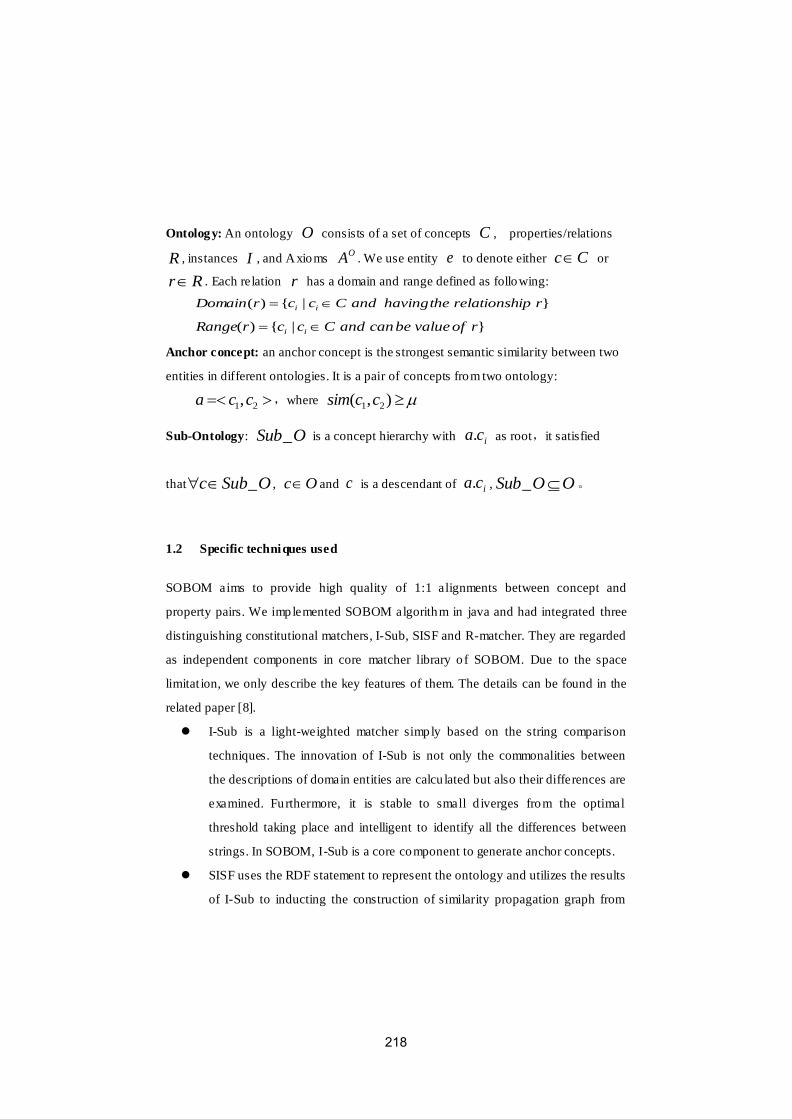
Ontology: An ontology O consists of a set of concepts C , properties/relations
R , instances I , and Axioms OA . We use entity e to denote either Cc or
Rr . Each relation r has a domain and range defined as following:
}|{)( riprelationshthehavingandCccrDomain ii
}|{)( rofvaluebecanandCccrRange ii
Anchor concept: an anchor concept is the strongest semantic similarity between two
entities in different ontologies. It is a pair of concepts from two ontology:
21,cca ,where ),( 21 ccsim
Sub-Ontology: OSub_ is a concept hierarchy with ica. as root,it satisfied
that OSubc _ , Oc and c is a descendant of ica. , OOSub _ 。
1.2 Specific techniques used
SOBOM aims to provide high quality of 1:1 alignments between concept and
property pairs. We implemented SOBOM algorithm in java and had integrated three
distinguishing constitutional matchers, I-Sub, SISF and R-matcher. They are regarded
as independent components in core matcher library o f SOBOM. Due to the space
limitat ion, we only describe the key features of them. The details can be found in the
related paper [8].
I-Sub is a light-weighted matcher simply based on the string comparison
techniques. The innovation of I-Sub is not only the commonalities between
the descriptions of domain entities are calcu lated but also their differences are
examined. Furthermore, it is stable to small d iverges from the optimal
threshold taking place and intelligent to identify all the differences between
strings. In SOBOM, I-Sub is a core component to generate anchor concepts.
SISF uses the RDF statement to represent the ontology and utilizes the results
of I-Sub to inducting the construction of similarity propagation graph from
218
sub-ontologies. SISF and I-Sub handle the ontology from the v iew 'O and
only generate concept-concept alignment.
R-matcher is a relationship matcher base on the definition of the ontology. It
combines the linguistic and semantic in formation of a relation. From the ''O
view, it utilizes the is-a hierarchy to extend the domain and range of a
relationship and uses the result of SISF to generate the alignment between
relationships.
More importantly, SoE is integrated into the SOBOM and extract sub-ontologies
according to the anchor concept [5, 6]. SoE ranks ext racted sub-ontologies from the
'O view according to their depth. As for ontology matching, the ru les of extracting
sub-ontology in SoE are as following:
Rule 1: Upwards traversal of the hierarchy: Oc ' , if 'c is an ancestor
of ica. , then OSubc _' .
Rule 2: Siblings classes of anchor concepts: Oc ', if
'c is a sibling
concept of ica. , then OSubc _' .
Rule 3: Downwards traversal of the hierarchy: Oc ' , if 'c is
descendant concepts of ica. , OSubc _'
Rule 4: Other relat ionships of the anchor concepts: Or , if r is a
relationship in O and aisr _ , then OSubr _
Rule 5: Leaf Concept Nodes: if 11. Oca ,
22. Oca and 1.ca ,
2.ca are leaf nodes respectively in 21,OO , then don’t extract Sub-Ontology.
After ext racting sub-ontologies, SOBOM will match these sub-ontologies according
to their depth in original ontology. We first match the sub-ontologies with larger
depth value. By using SoE, SOBOM can reduce the scale of ontology and make it
easy to operate sub-ontologies in SISF.
219
1.3 Adaptations made for the evaluation
We don’t make any specific adaptation for the tests in the OAEI 2009 campaign. A ll
the alignments outputted by SOBOM are based on the same set of parameters.
1.4 Link to the system and set of provided alignments (in align format)
The current version of SOBOM and the alignment results for OAEI 2009 are
available at http://mlg.hit.edu.cn:8080/Ontology/Download.jsp, and the parameters
setting is illustrated in the reading me file.
2 Results
In this section, we describe the results of SOBOM algorithm against the benchmark,
directory and anatomy ontologies provided by the OAEI 2009 campaign. We use
Jena-API to parse the RDF and OWL files. The experiments were carried out on a PC
running Windows vista ultimate (32 bit) with Core 2 Duo processors (2.66 GHz) and
4-gigabyte memory.
2.1 Benchmark
On the basis of the nature, we can div ide the benchmark dataset into five groups:
#101-104, #201-210, #221-247, #248-266 and #301-304. We described the
performance of our SOBOM algorithm over each group and overall performance on
the benchmark test set in Table 1.
#101-104 SOBOM plays well for these test cases.
#201-210 In this group, some linguistic features of candidate ontologies are
discarded or modified. SOBOM is a sequential matcher, if the linguistic matcher get
no mappings, then the SISF will produce no mapping too. So in these test, the result is
in high precision but low recall.
220
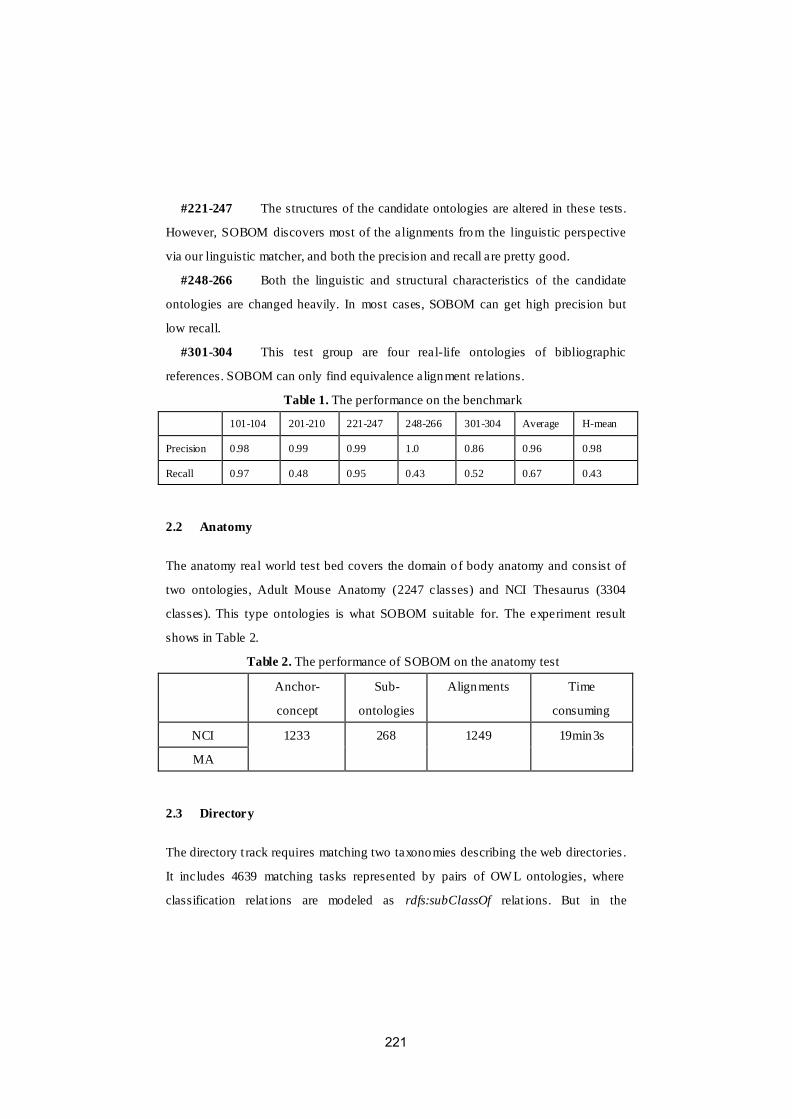
#221-247 The structures of the candidate ontologies are altered in these tests.
However, SOBOM discovers most of the alignments from the linguistic perspective
via our linguistic matcher, and both the precision and recall are pretty good.
#248-266 Both the linguistic and structural characteristics of the candidate
ontologies are changed heavily. In most cases, SOBOM can get high precision but
low recall.
#301-304 This test group are four real-life ontologies of bibliographic
references. SOBOM can only find equivalence alignment relations.
Table 1. The performance on the benchmark
101-104 201-210 221-247 248-266 301-304 Average H-mean
Precision 0.98 0.99 0.99 1.0 0.86 0.96 0.98
Recall 0.97 0.48 0.95 0.43 0.52 0.67 0.43
2.2 Anatomy
The anatomy real world test bed covers the domain o f body anatomy and consist of
two ontologies, Adult Mouse Anatomy (2247 classes) and NCI Thesaurus (3304
classes). This type ontologies is what SOBOM suitable for. The experiment result
shows in Table 2.
Table 2. The performance of SOBOM on the anatomy test
Anchor-
concept
Sub-
ontologies
Alignments Time
consuming
NCI 1233 268 1249 19min3s
MA
2.3 Directory
The directory t rack requires matching two taxonomies describing the web directories .
It includes 4639 matching tasks represented by pairs of OW L ontologies, where
classification relat ions are modeled as rdfs:subClassOf relat ions. But in the
221
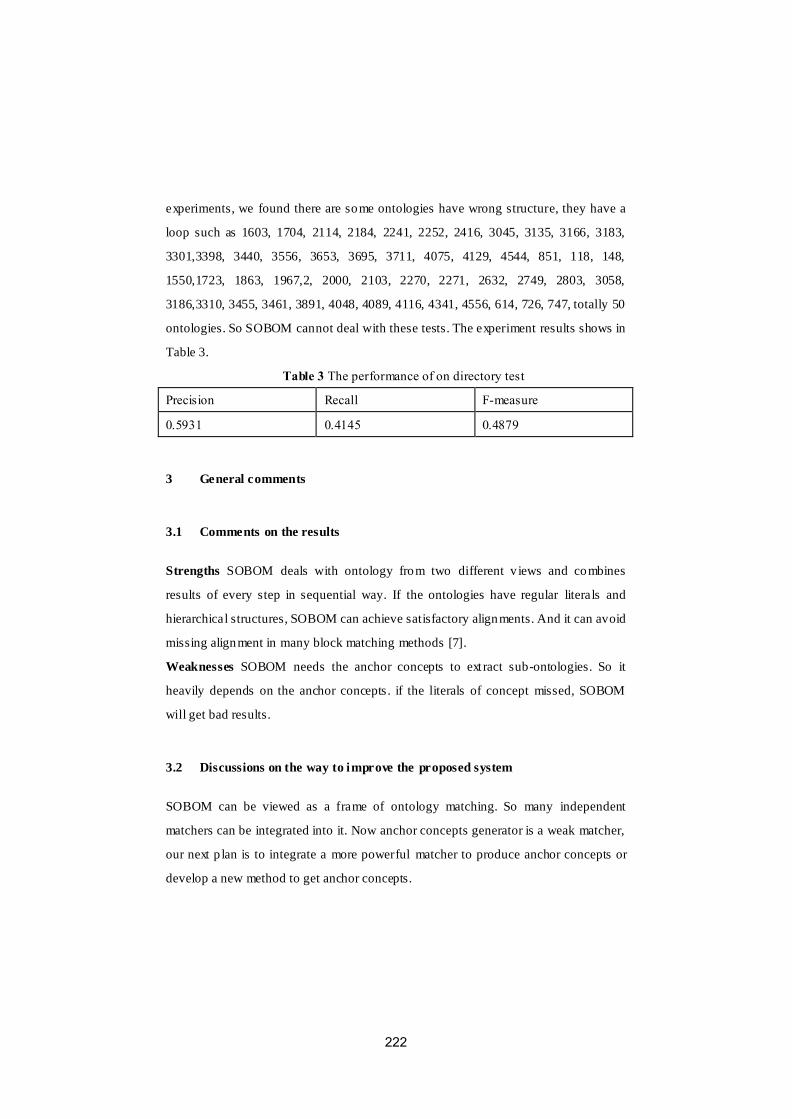
experiments, we found there are some ontologies have wrong structure, they have a
loop such as 1603, 1704, 2114, 2184, 2241, 2252, 2416, 3045, 3135, 3166, 3183,
3301,3398, 3440, 3556, 3653, 3695, 3711, 4075, 4129, 4544, 851, 118, 148,
1550,1723, 1863, 1967,2, 2000, 2103, 2270, 2271, 2632, 2749, 2803, 3058,
3186,3310, 3455, 3461, 3891, 4048, 4089, 4116, 4341, 4556, 614, 726, 747, totally 50
ontologies. So SOBOM cannot deal with these tests. The experiment results shows in
Table 3.
Table 3 The performance of on directory test
Precision Recall F-measure
0.5931 0.4145 0.4879
3 General comments
3.1 Comments on the results
Strengths SOBOM deals with ontology from two different v iews and combines
results of every step in sequential way. If the ontologies have regular literals and
hierarchical structures, SOBOM can achieve satisfactory alignments. And it can avoid
missing alignment in many block matching methods [7].
Weaknesses SOBOM needs the anchor concepts to ext ract sub-ontologies. So it
heavily depends on the anchor concepts . if the literals of concept missed, SOBOM
will get bad results.
3.2 Discussions on the way to improve the proposed system
SOBOM can be viewed as a frame of ontology matching. So many independent
matchers can be integrated into it. Now anchor concepts generator is a weak matcher,
our next p lan is to integrate a more powerful matcher to produce anchor concepts or
develop a new method to get anchor concepts.
222
4 Conclusion
This paper reports our first participation in OAEI campaign. We present the alignment
process of SOBOM and describe the specific techniques for ontology matching. We
also show the performance in different alignment tasks. The strengths and the
weaknesses of our proposed approach are summarized and the possible improvement
will be made for the system in the future. We propose a brand new algorithm to match
ontologies.
References
1. Fausto Giunchiglia and Ilya Aihrayeu : Lightweight Ontologies. Technical Report. (2007)
DIT-07-071.
2. G.Stoilos, G. Stamou, S. Kollias: A string metric for ontology alignment, In Proc. Of the 4th
International Semantic Web Conference(ISWC’05). (2005) 623-637.
3. N.F. Noy, M.A. Musen: Anchor-PROMPT: using non-local context for semantic matching,
In Proc. Of IJCAI2001 Workshop on Ontology and Information Sharing, ( 2001) 63-70.
4. S. Melnik, H.G. Molina and E. Rahm: Similarity Flooding: A Versatile Graph Matching
Algorithm, In Proc 18th Int’l Conf. Data Eng. (ECDE’02) (2002) 117-128.
5. Julian Seidenberg and Alan Rector: Web Ontology Segmentation: Analysis, Classification
and Use, WWW2006, (2006).
6. H. Stuckenschmidt and M. Klein: Structure-Based Partitioning of Large Class Hierarchies. In
Proc of the 3rd International Semantic Web Conference (2004).
7. W. Hu, Y. Qu: Block matching for ontologies, In Proc of the 5th International Semantic Web
Conference, LNCS, vol. 4273, Springer (2006) 300-313.
8. P.G. Xu, H.J. Tao: SOBOM: An Anchor Concept and Sub-ontology based Ontology
Matching Approach. To be appear.
223
Cross-lingual Dutch to English alignment usingEuroWordNet and Dutch Wikipedia
Gosse Bouma
Information Science, University of Groningen, [email protected]
Abstract. This paper describes a system for linking the thesaurus of the Nether-lands Institute for Sound and Vision to English WordNet and dbpedia. We usedEuroWordNet, a multilingual wordnet, and Dutch Wikipedia as intermediariesfor the two alignments. EuroWordNet covers most of the subject terms in thethesaurus, but the organization of the cross-lingual links makes selection of themost appropriate English target term almost impossible. Using page titles, redi-rects, disambiguation pages, and anchor text harvested from Dutch Wikipediagives reasonable performance on subject terms and geographical terms. Manyperson and organization names in the thesaurus could not be located in (Dutch orEnglish) Wikipedia.
1 Presentation of the system
This paper describes our system for the very large cross-lingual resources (vlcr) task,which asked for an alignment between the thesaurus of the Netherlands Institute forSound and Vision and English WordNet and (English) dbpedia, a database extractedfrom Wikipedia.
We used an ad-hoc system to achieve the alignment. For the mapping to EnglishWordNet, we used EuroWordNet, a multilingual resource which contains a Dutch word-net, as well as mappings from Dutch to English WordNet. For the mapping to dbpedia,we used page titles, redirects, and anchor texts harvested from Dutch Wikipedia, andmapped Dutch pages to English pages using cross-language links. Most XML prepro-cessing was done using XQuery. The alignment itself was done using (Sicstus) Prolog.
1.1 Background
For our work on open domain question answering, information extraction, and corefer-ence resolution, we are interested in creating general, informal, taxonomies of entitiesencountered in Dutch texts.1 As part of this work, we created a Dutch counterpart ofthe Yago system [4], in which Wikipedia categories are aligned with a Dutch wordnet[1]. We expected that the techniques we used there (especially stemming and parsing oflabels, and using predominant word senses for sense disambiguation) could be appliedto the present task as well.
1 Some results can be found on www.let.rug.nl/gosse/Ontology
224
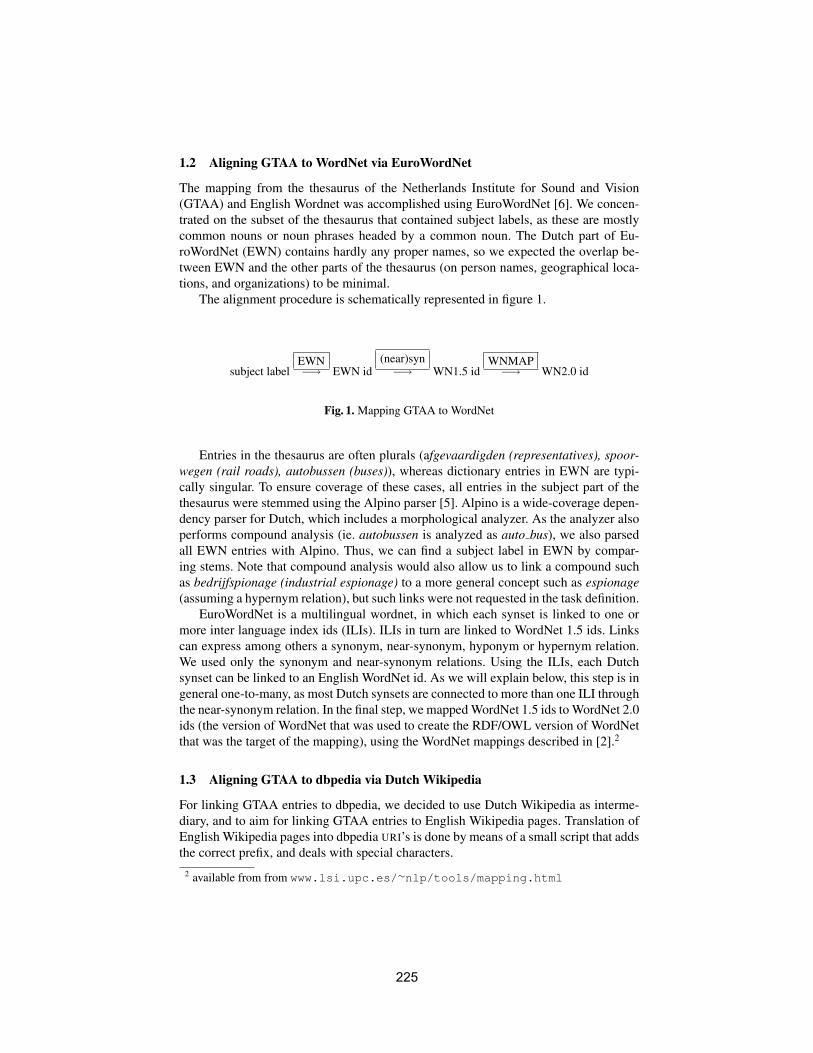
1.2 Aligning GTAA to WordNet via EuroWordNet
The mapping from the thesaurus of the Netherlands Institute for Sound and Vision(GTAA) and English Wordnet was accomplished using EuroWordNet [6]. We concen-trated on the subset of the thesaurus that contained subject labels, as these are mostlycommon nouns or noun phrases headed by a common noun. The Dutch part of Eu-roWordNet (EWN) contains hardly any proper names, so we expected the overlap be-tween EWN and the other parts of the thesaurus (on person names, geographical loca-tions, and organizations) to be minimal.
The alignment procedure is schematically represented in figure 1.
subject labelEWN−→ EWN id
(near)syn−→ WN1.5 id
WNMAP−→ WN2.0 id
Fig. 1. Mapping GTAA to WordNet
Entries in the thesaurus are often plurals (afgevaardigden (representatives), spoor-wegen (rail roads), autobussen (buses)), whereas dictionary entries in EWN are typi-cally singular. To ensure coverage of these cases, all entries in the subject part of thethesaurus were stemmed using the Alpino parser [5]. Alpino is a wide-coverage depen-dency parser for Dutch, which includes a morphological analyzer. As the analyzer alsoperforms compound analysis (ie. autobussen is analyzed as auto bus), we also parsedall EWN entries with Alpino. Thus, we can find a subject label in EWN by compar-ing stems. Note that compound analysis would also allow us to link a compound suchas bedrijfspionage (industrial espionage) to a more general concept such as espionage(assuming a hypernym relation), but such links were not requested in the task definition.
EuroWordNet is a multilingual wordnet, in which each synset is linked to one ormore inter language index ids (ILIs). ILIs in turn are linked to WordNet 1.5 ids. Linkscan express among others a synonym, near-synonym, hyponym or hypernym relation.We used only the synonym and near-synonym relations. Using the ILIs, each Dutchsynset can be linked to an English WordNet id. As we will explain below, this step is ingeneral one-to-many, as most Dutch synsets are connected to more than one ILI throughthe near-synonym relation. In the final step, we mapped WordNet 1.5 ids to WordNet 2.0ids (the version of WordNet that was used to create the RDF/OWL version of WordNetthat was the target of the mapping), using the WordNet mappings described in [2].2
1.3 Aligning GTAA to dbpedia via Dutch Wikipedia
For linking GTAA entries to dbpedia, we decided to use Dutch Wikipedia as interme-diary, and to aim for linking GTAA entries to English Wikipedia pages. Translation ofEnglish Wikipedia pages into dbpedia URI’s is done by means of a small script that addsthe correct prefix, and deals with special characters.
2 available from from www.lsi.upc.es/∼nlp/tools/mapping.html
225
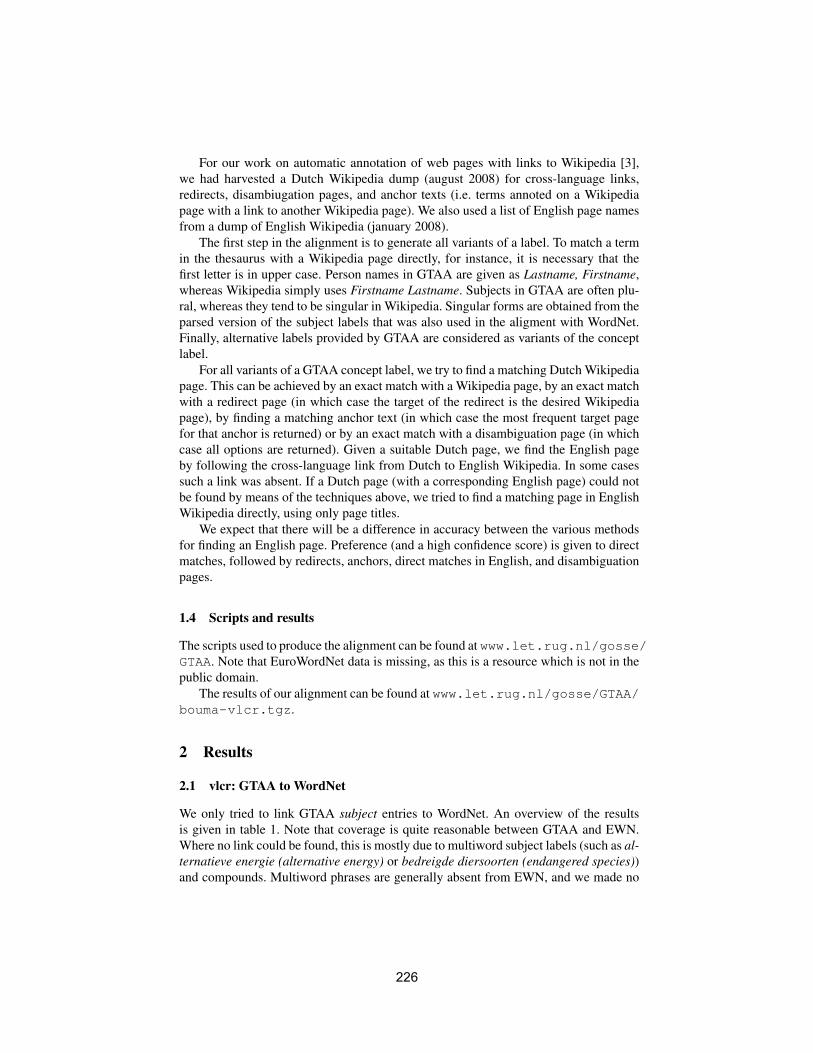
For our work on automatic annotation of web pages with links to Wikipedia [3],we had harvested a Dutch Wikipedia dump (august 2008) for cross-language links,redirects, disambiugation pages, and anchor texts (i.e. terms annoted on a Wikipediapage with a link to another Wikipedia page). We also used a list of English page namesfrom a dump of English Wikipedia (january 2008).
The first step in the alignment is to generate all variants of a label. To match a termin the thesaurus with a Wikipedia page directly, for instance, it is necessary that thefirst letter is in upper case. Person names in GTAA are given as Lastname, Firstname,whereas Wikipedia simply uses Firstname Lastname. Subjects in GTAA are often plu-ral, whereas they tend to be singular in Wikipedia. Singular forms are obtained from theparsed version of the subject labels that was also used in the aligment with WordNet.Finally, alternative labels provided by GTAA are considered as variants of the conceptlabel.
For all variants of a GTAA concept label, we try to find a matching Dutch Wikipediapage. This can be achieved by an exact match with a Wikipedia page, by an exact matchwith a redirect page (in which case the target of the redirect is the desired Wikipediapage), by finding a matching anchor text (in which case the most frequent target pagefor that anchor is returned) or by an exact match with a disambiguation page (in whichcase all options are returned). Given a suitable Dutch page, we find the English pageby following the cross-language link from Dutch to English Wikipedia. In some casessuch a link was absent. If a Dutch page (with a corresponding English page) could notbe found by means of the techniques above, we tried to find a matching page in EnglishWikipedia directly, using only page titles.
We expect that there will be a difference in accuracy between the various methodsfor finding an English page. Preference (and a high confidence score) is given to directmatches, followed by redirects, anchors, direct matches in English, and disambiguationpages.
1.4 Scripts and results
The scripts used to produce the alignment can be found at www.let.rug.nl/gosse/GTAA. Note that EuroWordNet data is missing, as this is a resource which is not in thepublic domain.
The results of our alignment can be found at www.let.rug.nl/gosse/GTAA/bouma-vlcr.tgz.
2 Results
2.1 vlcr: GTAA to WordNet
We only tried to link GTAA subject entries to WordNet. An overview of the resultsis given in table 1. Note that coverage is quite reasonable between GTAA and EWN.Where no link could be found, this is mostly due to multiword subject labels (such as al-ternatieve energie (alternative energy) or bedreigde diersoorten (endangered species))and compounds. Multiword phrases are generally absent from EWN, and we made no
226
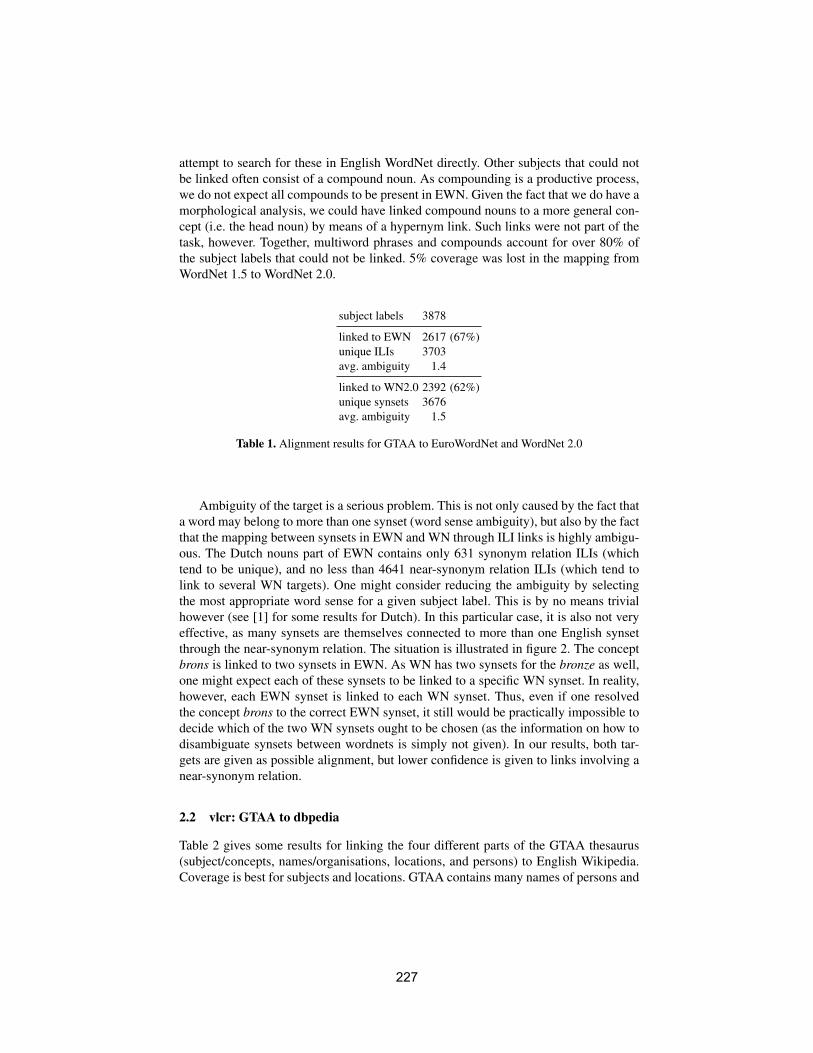
attempt to search for these in English WordNet directly. Other subjects that could notbe linked often consist of a compound noun. As compounding is a productive process,we do not expect all compounds to be present in EWN. Given the fact that we do have amorphological analysis, we could have linked compound nouns to a more general con-cept (i.e. the head noun) by means of a hypernym link. Such links were not part of thetask, however. Together, multiword phrases and compounds account for over 80% ofthe subject labels that could not be linked. 5% coverage was lost in the mapping fromWordNet 1.5 to WordNet 2.0.
subject labels 3878
linked to EWN 2617 (67%)unique ILIs 3703avg. ambiguity 1.4
linked to WN2.0 2392 (62%)unique synsets 3676avg. ambiguity 1.5
Table 1. Alignment results for GTAA to EuroWordNet and WordNet 2.0
Ambiguity of the target is a serious problem. This is not only caused by the fact thata word may belong to more than one synset (word sense ambiguity), but also by the factthat the mapping between synsets in EWN and WN through ILI links is highly ambigu-ous. The Dutch nouns part of EWN contains only 631 synonym relation ILIs (whichtend to be unique), and no less than 4641 near-synonym relation ILIs (which tend tolink to several WN targets). One might consider reducing the ambiguity by selectingthe most appropriate word sense for a given subject label. This is by no means trivialhowever (see [1] for some results for Dutch). In this particular case, it is also not veryeffective, as many synsets are themselves connected to more than one English synsetthrough the near-synonym relation. The situation is illustrated in figure 2. The conceptbrons is linked to two synsets in EWN. As WN has two synsets for the bronze as well,one might expect each of these synsets to be linked to a specific WN synset. In reality,however, each EWN synset is linked to each WN synset. Thus, even if one resolvedthe concept brons to the correct EWN synset, it still would be practically impossible todecide which of the two WN synsets ought to be chosen (as the information on how todisambiguate synsets between wordnets is simply not given). In our results, both tar-gets are given as possible alignment, but lower confidence is given to links involving anear-synonym relation.
2.2 vlcr: GTAA to dbpedia
Table 2 gives some results for linking the four different parts of the GTAA thesaurus(subject/concepts, names/organisations, locations, and persons) to English Wikipedia.Coverage is best for subjects and locations. GTAA contains many names of persons and
227
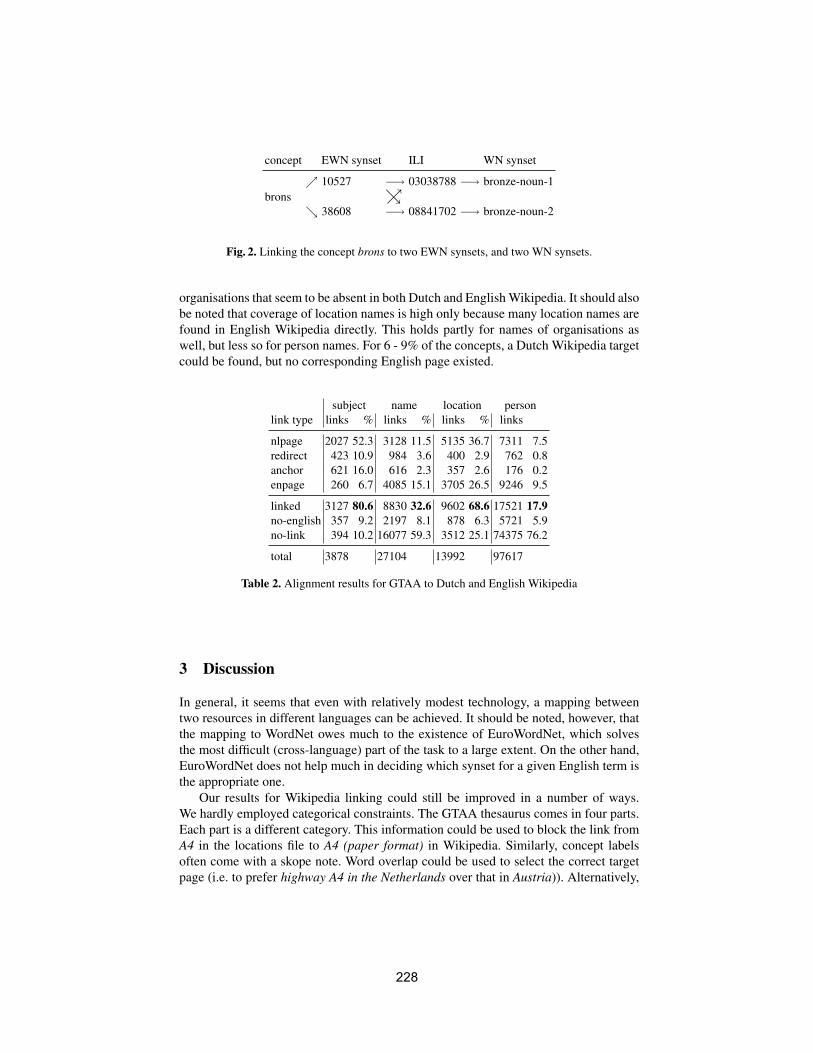
concept EWN synset ILI WN synset
↗ 10527 −→ 03038788 −→ bronze-noun-1brons ↘↗
↘ 38608 −→ 08841702 −→ bronze-noun-2
Fig. 2. Linking the concept brons to two EWN synsets, and two WN synsets.
organisations that seem to be absent in both Dutch and English Wikipedia. It should alsobe noted that coverage of location names is high only because many location names arefound in English Wikipedia directly. This holds partly for names of organisations aswell, but less so for person names. For 6 - 9% of the concepts, a Dutch Wikipedia targetcould be found, but no corresponding English page existed.
subject name location personlink type links % links % links % links
nlpage 2027 52.3 3128 11.5 5135 36.7 7311 7.5redirect 423 10.9 984 3.6 400 2.9 762 0.8anchor 621 16.0 616 2.3 357 2.6 176 0.2enpage 260 6.7 4085 15.1 3705 26.5 9246 9.5
linked 3127 80.6 8830 32.6 9602 68.6 17521 17.9no-english 357 9.2 2197 8.1 878 6.3 5721 5.9no-link 394 10.2 16077 59.3 3512 25.1 74375 76.2
total 3878 27104 13992 97617
Table 2. Alignment results for GTAA to Dutch and English Wikipedia
3 Discussion
In general, it seems that even with relatively modest technology, a mapping betweentwo resources in different languages can be achieved. It should be noted, however, thatthe mapping to WordNet owes much to the existence of EuroWordNet, which solvesthe most difficult (cross-language) part of the task to a large extent. On the other hand,EuroWordNet does not help much in deciding which synset for a given English term isthe appropriate one.
Our results for Wikipedia linking could still be improved in a number of ways.We hardly employed categorical constraints. The GTAA thesaurus comes in four parts.Each part is a different category. This information could be used to block the link fromA4 in the locations file to A4 (paper format) in Wikipedia. Similarly, concept labelsoften come with a skope note. Word overlap could be used to select the correct targetpage (i.e. to prefer highway A4 in the Netherlands over that in Austria)). Alternatively,
228
one might use the information that concepts with the same scope note are likely to belinked to Wikipedia pages with identical or closely related Wikipedia categories to de-tect outliers. For selecting the most promising target, we experimented with a simplepreference scheme (which always prefers the link given by the most reliable relation),and a simple weighting scheme (which adds scores when multiple links to the same tar-get are found). Weighting was used for the final results. No doubt, more subtle schemescould be developed. For instance, at the moment we only take into account the mostfrequent target of an anchor text. Alternatively, one might consider all targets pointedto by anchor text as potential targets, and use the frequency of these links as a weight.
Somewhat surprisingly, we discovered that cross-language links are not reversible.Initially, we used cross-language links harvested from English Wikipedia, as this is thelarger resource, and we expected that this might also be more thorough in providingcross-language links. However, since English Wikipedia has more pages than DutchWikipedia, several English pages may be linked to the same Dutch page (i.e. Bowl-ing and Ten pin Bowling both point to the Dutch page Bowling). If one works withcross-language links harvested from Dutch Wikipedia, this situation does occur lessfrequently, although similar problems can occur here as well (i.e. in the versions ofWikipedia we used, the Dutch A4 highway was linked to an English page which redi-rected to a general page on Dutch highways).
4 Conclusion
We have presented a method for linking the thesaurus of the Netherlands Institute forSound and Vision with two English resources, WordNet and Wikipedia. We used anad-hoc method which relied on the existence of cross-language links for similar data,namely EuroWordNet, a multi-lingual wordnet with cross-language links, and DutchWikipedia, which contains cross-language links to English Wikipedia.
References
1. Gosse Bouma. Linking Dutch Wikipedia Categories to EuroWordNet. In Proceedings ofthe 19th Computational Linguistics in the Netherlands meeting (CLIN 19). Groningen, theNetherlands, 2009.
2. J. Daude, L. Padro, and G. Rigau. Mapping wordnets using structural information. In Pro-ceedings of the 38th Annual Meeting on Association for Computational Linguistics, pages504–511. Association for Computational Linguistics Morristown, NJ, USA, 2000.
3. Proscovia Olango, Gerwin Kramer, and Gosse Bouma. Termpedia for interactive docu-ment enrichment. In Computational Linguistics Applications (CLA) workshop at IMCSIT,Mragowo, Poland, 2009.
4. Fabian M. Suchanek, Gjergji Kasneci, and Gerhard Weikum. Yago: a core of semantic knowl-edge. In WWW ’07: Proceedings of the 16th international conference on World Wide Web,pages 697–706, New York, NY, USA, 2007. ACM Press.
5. Gertjan van Noord. At last parsing is now operational. In Piet Mertens, Cedrick Fairon, AnneDister, and Patrick Watrin, editors, TALN06. Verbum Ex Machina. Actes de la 13e conferencesur le traitement automatique des langues naturelles, pages 20–42. 2006.
6. P. Vossen. Eurowordnet a multilingual database with lexical semantic networks, 1998.
229
TaxoMap in the OAEI 2009 alignment contest
Faycal Hamdi1, Brigitte Safar1, Nobal B. Niraula2, and Chantal Reynaud1
1 LRI CNRS UMR 8623, Universite Paris-Sud 11, Bat. G, INRIA Saclay2-4 rue Jacques Monod, F-91893 Orsay, France
[email protected] [email protected]
Abstract. TaxoMap is an alignment tool which aims to discover rich correspon-dences between concepts. It performs an oriented alignment (from a source toa target ontology) and takes into account labels and sub-class descriptions. Thisnew implementation of TaxoMap reduces significantly runtime and enables pa-rameterization by specifying the ontology language and different thresholds usedto extract different mapping relations. It improves terminological techniques,with a better use of TreeTagger and introduces new structural techniques whichtake into account the structure of ontology. Special effort has been made to han-dle large-scale ontologies by partitioning input ontologies into modules to align.We conclude the paper by pointing out the necessary improvements that need tobe made.
1 Introduction
TaxoMap was designed to retrieve useful alignments for information integration be-tween different sources. The alignment process is then oriented from ontologies thatdescribe external resources (named source ontology) to the ontology (named target on-tology) of a web portal. The target ontology is supposed to be well-structured whereassource ontology can be a flat list of concepts.
TaxoMap makes the assumption that most semantic resources are based essentiallyon classification structures. This assumption is confirmed by large scale ontologieswhich contain rich lexical information and hierarchical specification without describingspecific properties or instances.
To find mappings in this context, we can only use the following available elements:labels of concepts and hierarchical structures.
The new implementation of TaxoMap proposes a better morpho-syntactic analysisand new techniques. Moreover, the methods to partition large ontologies into moduleswhich TaxoMap can handle easily were refined.
We take part to five tests. We hope we perform better in terms of precision of map-pings generated and runtime. Tests on library data sets allow us to experiment our algo-rithm on large multilingual ontologies (English, French, and German).
230
2 Presentation of the System
2.1 State, Purpose and General Statement
We consider an ontology as a pair (C, HC) consisting of a set of concepts C arranged ina subsumption hierarchy HC . A concept c is defined by two elements: a set of labels andsubclass relationships. The labels are terms that describe entities in natural languageand which can be an expression composed of several words. A subclass relationshipestablishes links with other concepts.
Our alignment process is oriented; from a source (OS) to a target (OT ) ontology. Itaims at finding one-to-many mappings between single concepts and establishing threetypes of relationships, equivalence, subclass and semantically related relationships de-fined as follows.
Equivalence relationships An equivalence relationship, isEq, is a link between a con-cept in OS and a concept in OT with labels assumed to be similar.
Subclass relationships Subclass relationships are usual isA class links. When a conceptcS of OS is linked to a concept cT of OT with such a relationship, cT is considered asa super concept of cS .
Semantically related relationships A semantically related relationship, isClose, is alink between concepts that are considered as related but without a specific typing of therelation.
2.2 Techniques Used
The different techniques are based on the use of the moropho-syntactic analysis toolTreeTagger [1], and a similarity measure which compares the trigrams of the conceptlabels [2].TreeTagger is a tool for tagging text with part-of-speech and lemma information, en-ables to take into account the language, lemma and an use word categories in an ef-ficient way. The words are classified as functional (verbs, adverbs or adjectives) andstop words (articles, pronouns). Once classified by TreeTagger, the words are dividedinto two classes, full words and complementary words, according to their categoryand their position in the label. In principle, all names are full words except if they areplaced after a determiner, all other words are complementary words.This classification is then used to give more weight to the full words in the calculationof similarity between labels.
The main methods used to extract mappings between a concept cs in OS and aconcept ct in OT are:
– Label equivalence: An equivalence relationship, isEq, is generated if the similaritybetween one label of cs and one label of ct is greater than a threshold (Equiv.threshold).
231
– High lexical similarity: Let ctmax be the concept in OT with the highest similar-ity measure with cs. If the similarity measure is greater than a threshold (High-Sim.threshold) and if one of the labels of ctmax shares at least two full words incommon with one of the labels of cs, the heuristic generates the relationship < cs
isA ctMax > if the label of ctmax is included in the cs one, otherwise it generates< cs isClose ctMax >.
– Label inclusion (and its inverse): If one of the labels of ctmax is included in oneof the labels of cs, and if all words of included label are full words, we propose asubclass relationships < cs isA ctmax >. Inversely, if one of the labels of cs is in-cluded in one of the labels of ctmax, we propose a semantically related relationships< cs isClose ctmax >.
– Reasoning on similarity values: Let ctMax and ct2 be the two concepts in OT withthe highest similarity measure with cs, the relative similarity is the ratio of ct2
similarity on similarity ctMax. If the relative similarity is lower than a threshold(isA.threshold), one of the three following techniques can be used:• the relationship < cs isClose ctMax > is generated if one of the labels of cs
is included in one of the labels of ctMax, and the words of the included labelare complementary words.
• the relationship < cs isClose ctMax > is generated if the similarity of ctMax
is greater than a threshold (isClose.thresholdMax).• an isA relationship is generated between cs and the father of ctMax if the
similarity of ctMax is greater than a second threshold (isA.thresholdMax).– Reasoning on structure:
• an isA relationship < cs isA ct > is generated if the subclass relation < cs
isSubClassOf X > appears in OS and if the equivalence mapping < XisEq ct > have been identified.
• the relationship < cs isClose ct > is generated if ct is the concept in OT whichhave the most number of children in OT with the same label as the children ofcs in OS . More details of this approach are given at the end of this sub-section.
• an isA relationship < cs isA p > is generated if the three concepts in OT withthe highest similarity measure with cs have similarity greater than a threshold(Struct.threshold), and have a common father p in OT .
As we mentioned above, we use a structural heuristic based on the SemanticCotopy measure of a concept, proposed by Maedche and Staab [3]. The SemanticCotopy is based on the intentional semantics of a concept c in an ontology O, SC(c, O),defined as the set of all its super- and sub-concepts in O. When a concept c belongs totwo ontologies, one can define the taxonomic overlap (TO) between O1 and O2 for thisconcept, denoted TO(C, O1, O2) and defined as the ratio between the number of com-mon elements in the intentional semantics of c in O1 and in O2 and the total number ofelements belonging to the union of these two sets. If a concept c is in O1 but not in O2,an optimistic approximation of TO(c,O1, O2) is defined as the maximum overlap ob-tained by comparing SC(c,O1) to the intentional semantics of all the concepts in O2.Our heuristic uses SCD(c) which includes only the concept and its descendants insteadof the original Semantic Cotopy. If a concept c is in O1 but not in O2, we propose ascandidate mapping for this concept c, the concept cMax of O2 which maximizes theTO, if c and cMax have at least two descendants in common.
232
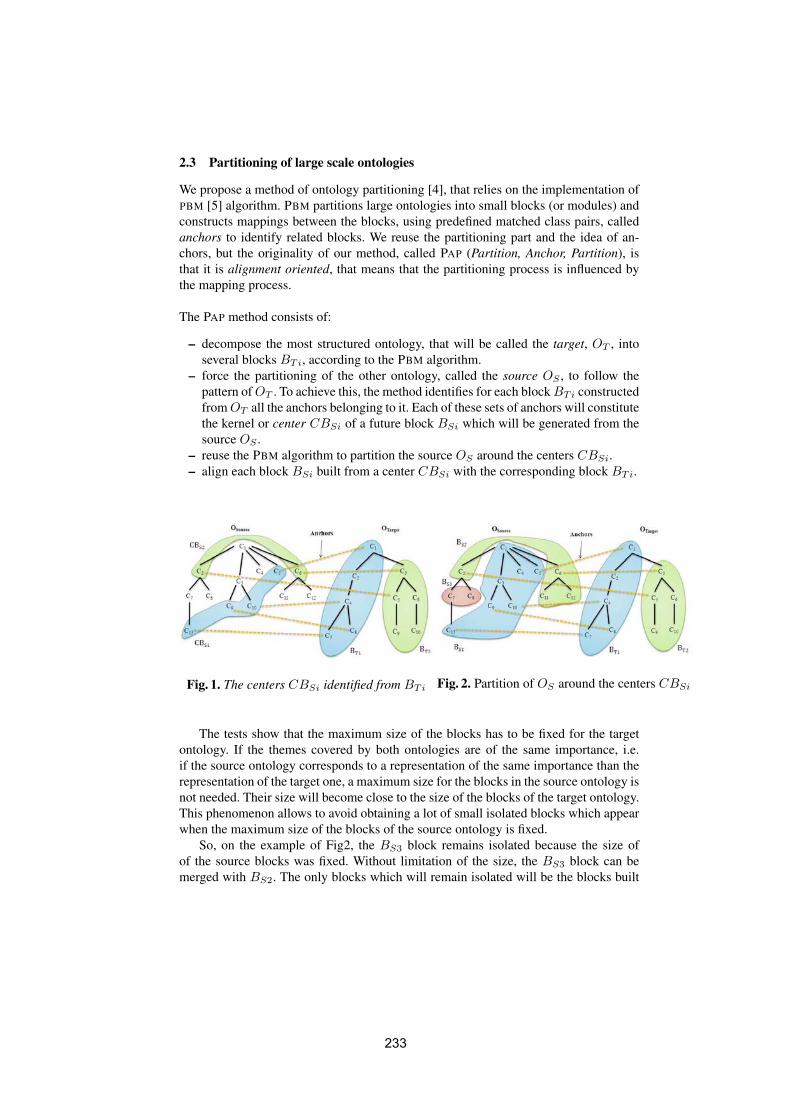
2.3 Partitioning of large scale ontologies
We propose a method of ontology partitioning [4], that relies on the implementation ofPBM [5] algorithm. PBM partitions large ontologies into small blocks (or modules) andconstructs mappings between the blocks, using predefined matched class pairs, calledanchors to identify related blocks. We reuse the partitioning part and the idea of an-chors, but the originality of our method, called PAP (Partition, Anchor, Partition), isthat it is alignment oriented, that means that the partitioning process is influenced bythe mapping process.
The PAP method consists of:
– decompose the most structured ontology, that will be called the target, OT , intoseveral blocks BTi, according to the PBM algorithm.
– force the partitioning of the other ontology, called the source OS , to follow thepattern of OT . To achieve this, the method identifies for each block BTi constructedfrom OT all the anchors belonging to it. Each of these sets of anchors will constitutethe kernel or center CBSi of a future block BSi which will be generated from thesource OS .
– reuse the PBM algorithm to partition the source OS around the centers CBSi.– align each block BSi built from a center CBSi with the corresponding block BTi.
Fig. 1. The centers CBSi identified from BTi Fig. 2. Partition of OS around the centers CBSi
The tests show that the maximum size of the blocks has to be fixed for the targetontology. If the themes covered by both ontologies are of the same importance, i.e.if the source ontology corresponds to a representation of the same importance than therepresentation of the target one, a maximum size for the blocks in the source ontology isnot needed. Their size will become close to the size of the blocks of the target ontology.This phenomenon allows to avoid obtaining a lot of small isolated blocks which appearwhen the maximum size of the blocks of the source ontology is fixed.
So, on the example of Fig2, the BS3 block remains isolated because the size ofof the source blocks was fixed. Without limitation of the size, the BS3 block can bemerged with BS2. The only blocks which will remain isolated will be the blocks built
233
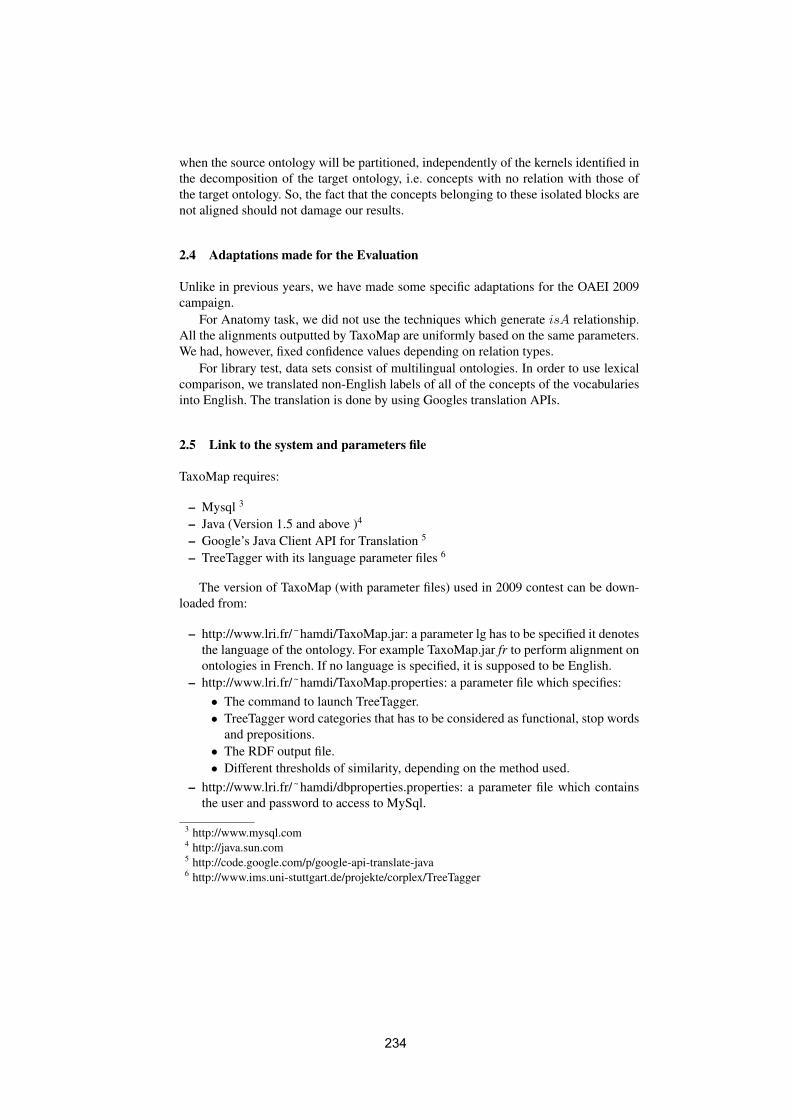
when the source ontology will be partitioned, independently of the kernels identified inthe decomposition of the target ontology, i.e. concepts with no relation with those ofthe target ontology. So, the fact that the concepts belonging to these isolated blocks arenot aligned should not damage our results.
2.4 Adaptations made for the Evaluation
Unlike in previous years, we have made some specific adaptations for the OAEI 2009campaign.
For Anatomy task, we did not use the techniques which generate isA relationship.All the alignments outputted by TaxoMap are uniformly based on the same parameters.We had, however, fixed confidence values depending on relation types.
For library test, data sets consist of multilingual ontologies. In order to use lexicalcomparison, we translated non-English labels of all of the concepts of the vocabulariesinto English. The translation is done by using Googles translation APIs.
2.5 Link to the system and parameters file
TaxoMap requires:
– Mysql 3
– Java (Version 1.5 and above )4
– Google’s Java Client API for Translation 5
– TreeTagger with its language parameter files 6
The version of TaxoMap (with parameter files) used in 2009 contest can be down-loaded from:
– http://www.lri.fr/˜hamdi/TaxoMap.jar: a parameter lg has to be specified it denotesthe language of the ontology. For example TaxoMap.jar fr to perform alignment onontologies in French. If no language is specified, it is supposed to be English.
– http://www.lri.fr/˜hamdi/TaxoMap.properties: a parameter file which specifies:• The command to launch TreeTagger.• TreeTagger word categories that has to be considered as functional, stop words
and prepositions.• The RDF output file.• Different thresholds of similarity, depending on the method used.
– http://www.lri.fr/˜hamdi/dbproperties.properties: a parameter file which containsthe user and password to access to MySql.
3 http://www.mysql.com4 http://java.sun.com5 http://code.google.com/p/google-api-translate-java6 http://www.ims.uni-stuttgart.de/projekte/corplex/TreeTagger
234
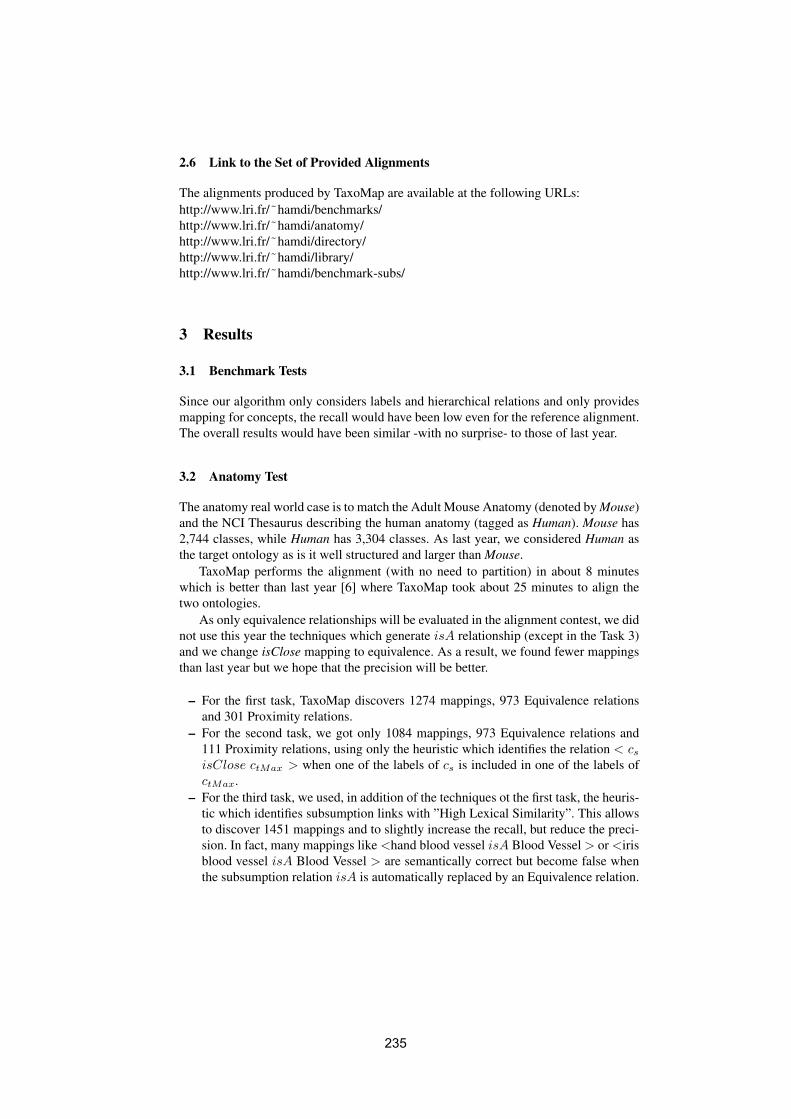
2.6 Link to the Set of Provided Alignments
The alignments produced by TaxoMap are available at the following URLs:http://www.lri.fr/˜hamdi/benchmarks/http://www.lri.fr/˜hamdi/anatomy/http://www.lri.fr/˜hamdi/directory/http://www.lri.fr/˜hamdi/library/http://www.lri.fr/˜hamdi/benchmark-subs/
3 Results
3.1 Benchmark Tests
Since our algorithm only considers labels and hierarchical relations and only providesmapping for concepts, the recall would have been low even for the reference alignment.The overall results would have been similar -with no surprise- to those of last year.
3.2 Anatomy Test
The anatomy real world case is to match the Adult Mouse Anatomy (denoted by Mouse)and the NCI Thesaurus describing the human anatomy (tagged as Human). Mouse has2,744 classes, while Human has 3,304 classes. As last year, we considered Human asthe target ontology as is it well structured and larger than Mouse.
TaxoMap performs the alignment (with no need to partition) in about 8 minuteswhich is better than last year [6] where TaxoMap took about 25 minutes to align thetwo ontologies.
As only equivalence relationships will be evaluated in the alignment contest, we didnot use this year the techniques which generate isA relationship (except in the Task 3)and we change isClose mapping to equivalence. As a result, we found fewer mappingsthan last year but we hope that the precision will be better.
– For the first task, TaxoMap discovers 1274 mappings, 973 Equivalence relationsand 301 Proximity relations.
– For the second task, we got only 1084 mappings, 973 Equivalence relations and111 Proximity relations, using only the heuristic which identifies the relation < cs
isClose ctMax > when one of the labels of cs is included in one of the labels ofctMax.
– For the third task, we used, in addition of the techniques ot the first task, the heuris-tic which identifies subsumption links with ”High Lexical Similarity”. This allowsto discover 1451 mappings and to slightly increase the recall, but reduce the preci-sion. In fact, many mappings like <hand blood vessel isA Blood Vessel > or <irisblood vessel isA Blood Vessel > are semantically correct but become false whenthe subsumption relation isA is automatically replaced by an Equivalence relation.
235
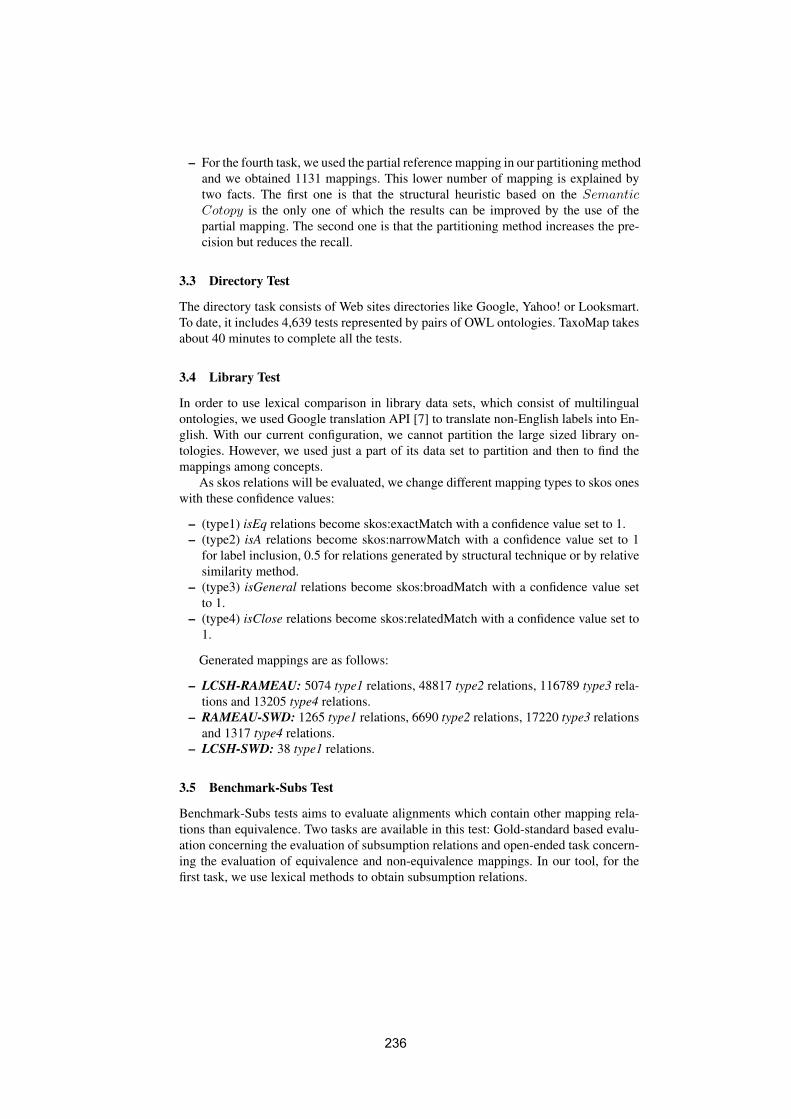
– For the fourth task, we used the partial reference mapping in our partitioning methodand we obtained 1131 mappings. This lower number of mapping is explained bytwo facts. The first one is that the structural heuristic based on the SemanticCotopy is the only one of which the results can be improved by the use of thepartial mapping. The second one is that the partitioning method increases the pre-cision but reduces the recall.
3.3 Directory Test
The directory task consists of Web sites directories like Google, Yahoo! or Looksmart.To date, it includes 4,639 tests represented by pairs of OWL ontologies. TaxoMap takesabout 40 minutes to complete all the tests.
3.4 Library Test
In order to use lexical comparison in library data sets, which consist of multilingualontologies, we used Google translation API [7] to translate non-English labels into En-glish. With our current configuration, we cannot partition the large sized library on-tologies. However, we used just a part of its data set to partition and then to find themappings among concepts.
As skos relations will be evaluated, we change different mapping types to skos oneswith these confidence values:
– (type1) isEq relations become skos:exactMatch with a confidence value set to 1.– (type2) isA relations become skos:narrowMatch with a confidence value set to 1
for label inclusion, 0.5 for relations generated by structural technique or by relativesimilarity method.
– (type3) isGeneral relations become skos:broadMatch with a confidence value setto 1.
– (type4) isClose relations become skos:relatedMatch with a confidence value set to1.
Generated mappings are as follows:
– LCSH-RAMEAU: 5074 type1 relations, 48817 type2 relations, 116789 type3 rela-tions and 13205 type4 relations.
– RAMEAU-SWD: 1265 type1 relations, 6690 type2 relations, 17220 type3 relationsand 1317 type4 relations.
– LCSH-SWD: 38 type1 relations.
3.5 Benchmark-Subs Test
Benchmark-Subs tests aims to evaluate alignments which contain other mapping rela-tions than equivalence. Two tasks are available in this test: Gold-standard based evalu-ation concerning the evaluation of subsumption relations and open-ended task concern-ing the evaluation of equivalence and non-equivalence mappings. In our tool, for thefirst task, we use lexical methods to obtain subsumption relations.
236
4 General Comments
4.1 Results
The new version of TaxoMap improves significantly the results on the previous versionof TaxoMap in terms of runtime and precision of generated mappings. The new imple-mentation offers extensibility and modularity of code. TaxoMap can be parameterizedby the language used in ontologies, the choice of used techniques and different thresh-olds. Our partitioning algorithms allow us to participate to tests with large ontologies.
4.2 Future Improvements
The following improvements can be made to obtain better results:
– To take into account all concepts properties instead of only the hierarchicals ones.– Use of WordNet as a dictionary of synonymy. The synsets can enrich the termino-
logical alignment process if an a priori disambiguation is made.– To develop the remaining structural techniques which proved to be efficient in last
experiments [8] [9].
5 Conclusion
This paper reports our participation to OAEI campaign with the new implementationof TaxoMap. Our algorithm proposes an oriented mapping between concepts. Due topartitioning, it is able to perform alignment on real-world ontologies. Our participationin the campaign allows us to test the robustness of TaxoMap, our partitioning algorithmsand new structural techniques.
References
[1] Schmid H. Probabilistic Part-of-Speech Tagging Using Decision Trees, International Confer-ence on New Methods in Language Processing (1994)
[2] Lin, D. : An Information-Theoretic Definition of Similarity. ICML. Madison. (1998) 296–304
[3] Maedche, A. and Staab S. Measuring Similarity between Ontologies, EKAW (2002)[4] Hamdi, F., Safar, B., Reynaud, C. and Zargayouna, H. Alignment-based Partitioning of
Large-scale Ontologies, in Advances in Knowledge Discovery and Management (AKDM09),to appear.
[5] Hu, W., Zhao, Y., and Qu, Y. Partition-based block matching of large class hierarchies, Proc.of the 1st Asian Semantic Web Conference (ASWC06). pp.72-83, (2006)
[6] Hamdi, F., Zargayouna, H., Safar, B., and Reynaud, C. TaxoMap in the OAEI 2008 alignmentcontest, Proceedings of the ISWC’08 Workshop on Ontology Matching OM-08 (2008)
[7] http://code.google.com/p/google-api-translate-java/[8] Reynaud, C. and Safar, B. When usual structural alignment techniques don’t apply, The
ISWC’06 Workshop on Ontology matching (OM-06), (2006)[9] Reynaud, C. and Safar, B. Exploiting WordNet as Background Knowledge,The ISWC’07
Workshop on Ontology Matching (OM-07), (2007)
237
Using Ontology Alignment to Dynamically Chain Web
Services
Dru McCandless, Leo Obrst {mccandless, lobrst}@mitre.org
The MITRE Corporation
Abstract. This statement of interest presents a brief rationale and description of
issues for using ontology alignment as a key step in dynamically chaining
together a sequence of web services.
Keywords: Ontology Alignment, Web Services, Dynamic Service Chain
Composition
1 Introduction
As in much of the world, the Department of Defense (DoD) has seen an explosion in
the growth of web services. But integration of these disparate information sources to
answer complex questions remains a challenge. Many information integration tasks
are unforeseen at the time the services are constructed, and are therefore difficult to
perform “on the fly”. This typically involves searches among various web service
definitions and deciding how best to arrange and call them in an ad-hoc manner. A
better method of assembling a dynamic service chain is needed.
Using semantic web technology to semi-automatically create a service chain
is an active area of research [2, 3, 4, 5]. However, most of this work is centered on the
use of formal ontologies using standards such as WSMO (Web Services Modeling
Ontology), WSML (Web Services Modeling Language), OWL-S, or SAWSDL
(Semantic Annotations for WSDL), which assume that the builders of web services
will also build the accompanying ontologies necessary for integration. This hasn‟t
been the case for DoD web service builders. This is in part because there is a lack of
consensus about ontology standards, and the skills needed to develop ontologies are
different from those needed to build and deploy web services. As a result, these
services do not have formal ontologies that define the domain within which the
service operates or that describe the service messages.
We have developed a different approach for dynamic web service assembly
that takes advantage of the formal structure inherent in web services that are defined
by WSDL documents. This is based on our past efforts using ontology alignment to
integrate different sources of information [1, 6]. The XML Schema definitions are
extracted from the WSDLs, and the schemas are then converted into OWL. The
resulting OWL files are aligned using ontology alignment tools, which allows for
Communicating author: Dru McCandless, The MITRE Corporation, 1155 Academy Park
Loop, Colorado Springs, Colorado 80910.
238
semi-automated mapping of the service input and output messages at the semantic
level. A theorem prover is then used to construct a service chain based on the aligned
service inputs and outputs which meets some information goal.
2 Issues
We are sometimes asked to justify converting schemas into ontologies to do
alignment when there are schema alignment tools available. Our response is that by
converting to an ontology, it enables us to apply the power of the underlying logic
model to make better decisions – an example being the case where there are two
schemas with the word „mustang‟, but one refers to the car and the other the horse. A
purely linguistic aligner will almost always align these – and usually the schemas we
work with are small enough such that a structural analysis doesn‟t have enough
information to make a better decision. But by using ontologies, it is fairly easy for a
person to add some additional taxonomy information above each of the „mustang‟
classes, by asserting for example that one mustang is a subclass of vehicle and the
other is a subclass of animal, and that the two classes are disjoint. This should enable
an ontology matcher to reach the correct conclusion. In addition, of course, using an
ontology enables one to perform automated consistency checking on it – something
that is not easy to do with a schema. As alignments become complicated, and the
ontologies involved become large and complex, consistency checking becomes
increasingly valuable.
In practice, when applying ontology alignment to real-world services a
number of difficulties are encountered, with missing and false alignments being the
most frequent. Some of the areas about which we would like to engage alignment
researchers are: an increased emphasis on meta-properties, such as disjointness, to
help with alignment decisions, and techniques for including domain information (such
as mid-level ontologies or controlled vocabularies) to improve performance.
References
1. Stoutenburg, S., Hawthorne S., Obrst L., McCandless D., Wootton S., Bankston B., Rapid,
Agile Integration Through Ontology Mapping. MITRE 2008 Technical Report, forthcoming.
2. Hibner A., Zielinski K., "Semantic-based Dynamic Service Composition and Adaptation,"
pp.213-220, 2007 IEEE Congress on Services (Services 2007), 2007
3. Agre, Marinova, “An INFRAWEBS Approach to Dynamic Composition of Semantic Web
Services,” Bulgarian Academy of Sciences, Cybernetics and Information Technologies Vol
7, Number 1.
4. Traverso P., Pistore M., Automated composition of semantic web services into executable
processes. In 3rd International Semantic Web Conference (ISWC 2004), pages 380–394,
2004.
5. Rao J., Su X., "A Survey of Automated Web Service Composition Methods". In Proceedings
of the First International Workshop on Semantic Web Services and Web Process
Composition, SWSWPC 2004, San Diego, California, USA, July 6th, 2004.
6. McCandless, Dru; Leo Obrst; Shayn Hawthorne. 2009. Dynamic Web Service Chaining
using OWL and a Theorem Prover. Accepted, Third IEEE International Conference on
Semantic Computing, Berkeley, CA, USA - September 14-16, 2009.
239
Semantic geo-catalog: a scenario and requirements
Pavel Shvaiko1, Lorenzino Vaccari2, and Gaia Trecarichi3
1 TasLab, Informatica Trentina S.p.A., Trento, Italy2 Autonomous Province of Trento, Trento, Italy
3 DISI, University of Trento, Trento, Italy
Abstract. In this short paper we present a scenario and requirements for on-tology matching posed by a geographical application, namely a semantic geo-catalog, which is an integral part of any spatial data infrastructure (SDI). It en-ables semantic interoperability among various geo-data and geo-service providers,and thus, contributes to the harmonization of geo-information.
Introduction. The need for coherent and contextual use of geographic information be-tween different stakeholders, such as departments in public administrations, formedthe basis for a number of initiatives aiming at sharing of spatial information, e.g., theINfrastructure for SPatial InfoRmation in Europe (INSPIRE)1, see also [8, 10]. In thispaper, we focus on a particular component of the INSPIRE architecture, which is a dis-covery service, that ought to be implemented by means of the Catalogue Service for theWeb (CSW)2, a recommendation of the Open Geospatial Consortium (OGC).
There have been provided several implementations of the CSW-based geo-catalog,e.g., GeoNetwork3. A first attempt to provide a semantic geo-catalog has been madein [6], though it was based on a single ontology approach. The approach in [9] proposedan OWL profile for CSW. Finally, the 52◦North semantics community4 proposed toencapsulate ontology repositories by OGC services. In turn, the problem of ontologymatching [2] in geo applications has been rarely addressed [7], with some exceptions,such as in [1, 5, 10]. The contribution of this paper includes a specific scenario andrequirements for ontology matching posed by a semantic geo-catalog to be realizedwithin the SDI of the Autonomous Province of Trento (PAT).Scenario. Figure 1 shows a high-level architecture for the semantic geo-catalog system-to-be. Users can issue queries, such as Trentino mountain hovels reachable with mainroads. The query and search results, such as a map of hovels, are handled by theTrentino geo-portal5 implemented within the BEA ALUI framework. The geo-catalogwill be based on the GeoNetwork open source, while its semantic extension will be de-signed and developed on top of SWeb6 search and matching technologies [3, 4]. Specifi-cally, user queries will be analyzed in order to extract concepts out of labels. Then, theseare matched at run time against the universal knowledge of the SWeb system (SWe-bUK). In turn, GeoNetwork will contain domain specific ontologies (e.g., Agrovoc)which are associated with geo-metadata and matched with the SWebUK at design time.
1http://www.ec-gis.org/inspire/
2http://www.opengeospatial.org/standards/cat
3http://geonetwork-opensource.org/
4http://52north.org
5http://www.territorio.provincia.tn.it/
6http://www.dit.unitn.it/˜knowdive/description.php
240
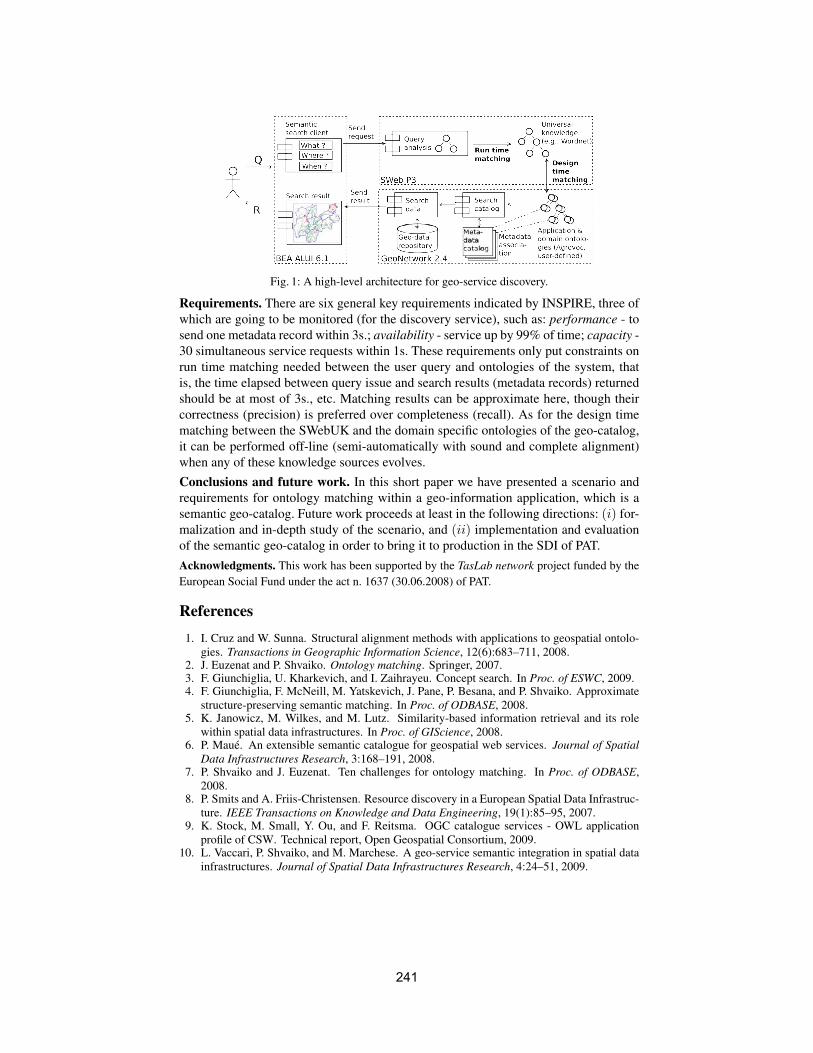
Fig. 1: A high-level architecture for geo-service discovery.
Requirements. There are six general key requirements indicated by INSPIRE, three ofwhich are going to be monitored (for the discovery service), such as: performance - tosend one metadata record within 3s.; availability - service up by 99% of time; capacity -30 simultaneous service requests within 1s. These requirements only put constraints onrun time matching needed between the user query and ontologies of the system, thatis, the time elapsed between query issue and search results (metadata records) returnedshould be at most of 3s., etc. Matching results can be approximate here, though theircorrectness (precision) is preferred over completeness (recall). As for the design timematching between the SWebUK and the domain specific ontologies of the geo-catalog,it can be performed off-line (semi-automatically with sound and complete alignment)when any of these knowledge sources evolves.Conclusions and future work. In this short paper we have presented a scenario andrequirements for ontology matching within a geo-information application, which is asemantic geo-catalog. Future work proceeds at least in the following directions: (i) for-malization and in-depth study of the scenario, and (ii) implementation and evaluationof the semantic geo-catalog in order to bring it to production in the SDI of PAT.Acknowledgments. This work has been supported by the TasLab network project funded by theEuropean Social Fund under the act n. 1637 (30.06.2008) of PAT.
References1. I. Cruz and W. Sunna. Structural alignment methods with applications to geospatial ontolo-
gies. Transactions in Geographic Information Science, 12(6):683–711, 2008.2. J. Euzenat and P. Shvaiko. Ontology matching. Springer, 2007.3. F. Giunchiglia, U. Kharkevich, and I. Zaihrayeu. Concept search. In Proc. of ESWC, 2009.4. F. Giunchiglia, F. McNeill, M. Yatskevich, J. Pane, P. Besana, and P. Shvaiko. Approximate
structure-preserving semantic matching. In Proc. of ODBASE, 2008.5. K. Janowicz, M. Wilkes, and M. Lutz. Similarity-based information retrieval and its role
within spatial data infrastructures. In Proc. of GIScience, 2008.6. P. Maue. An extensible semantic catalogue for geospatial web services. Journal of Spatial
Data Infrastructures Research, 3:168–191, 2008.7. P. Shvaiko and J. Euzenat. Ten challenges for ontology matching. In Proc. of ODBASE,
2008.8. P. Smits and A. Friis-Christensen. Resource discovery in a European Spatial Data Infrastruc-
ture. IEEE Transactions on Knowledge and Data Engineering, 19(1):85–95, 2007.9. K. Stock, M. Small, Y. Ou, and F. Reitsma. OGC catalogue services - OWL application
profile of CSW. Technical report, Open Geospatial Consortium, 2009.10. L. Vaccari, P. Shvaiko, and M. Marchese. A geo-service semantic integration in spatial data
infrastructures. Journal of Spatial Data Infrastructures Research, 4:24–51, 2009.
241
Tax and Revenue Service scenario for Ontology Matching
Stefano Brida1, Marco Combetto, Silvano Frasson
2 and Paolo Giorgini
3
1 Trentino Riscossioni S.p.A., Trento, Italy
2 Informatica Trentina S.p.A., Trento, Italy
3 D.I.S.I., University of Trento, Italy
Abstract. In this paper we present a scenario for ontology matching
posed by the Trentino Riscossioni S.p.A data integration system
focusing the opportunity to enhance the level of data integration over a
large set of Tax and Revenue industry-specific data sources.
Introduction. The mission of Trentino Riscossioni S.p.A1, a company owned by the
Autonomous Province of Trento, is to promote simplification processes and
harmonize the activity of more than 250 public entities in the province, creating
policies for fair taxation and for operating costs reduction. The need for consistent
and contextual use of the heterogeneous information sources between its offices, the
municipalities and the other public bodies is a fundamental requirement for the
implementation of an accurate and balanced taxation system. In this paper we want to
focus on the possibility offered by matching technology [1] to enhance the in the
present day data integration architecture and increase its flexibility in managing
hundreds of new data sources with reduced software development for each new
sources added. Besides, even if the data integration has been extensively studied in
the database community, according to some recent research works [2,3,4,5], the issue
to improve the automatic schema matching in a data integration scenario for the Tax
and Revenue market is a relative new ground of application. The contribution of this
paper includes a specific scenario focusing several of the basic requirements that have
to be considered in order to build a data integration system capable to support
dynamically hundreds of data sources.
Scenario. The scenario is to make possible the insertion, management and deletion of
new data sources (e.g., new data source from a new provincial database). The
inclusion of a new data source would result in the census of syntactic and semantic
information related to the attributes of the source and in an automatic mapping of
these attributes over the proper attributes of the destination database schema. If the
attributes are not present in the destination schema, the system must support the
design of a schema extension. The source information is collected in a knowledge
base. The search results will be available for at least 2 types of applications: (i) the
business intelligence application that enables the monitoring, tracking and
management of the data quality [6] of the integrated database and four (ii) mission-
critical applications focusing specific business-strategic tasks: assessment revenue,
territory mapping, planning support, final users services. As depicted hereafter in
Figure 1, the information coming from the external data sources is processed through
the SSMB (Semantic Schema/data Matching Box). The SSMB must be able to
calculate the new system status n + 1 through a function based on the previous states
1 http://www.trentinoriscossionispa.it
242
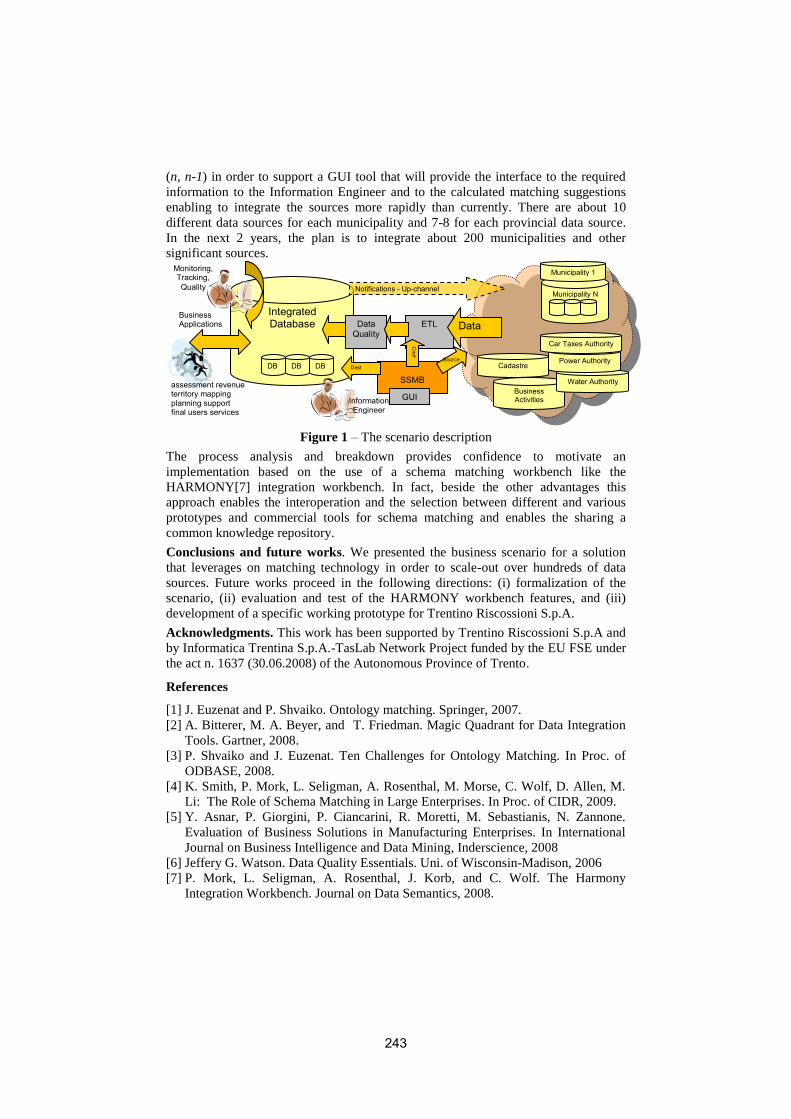
(n, n-1) in order to support a GUI tool that will provide the interface to the required
information to the Information Engineer and to the calculated matching suggestions
enabling to integrate the sources more rapidly than currently. There are about 10
different data sources for each municipality and 7-8 for each provincial data source.
In the next 2 years, the plan is to integrate about 200 municipalities and other
significant sources.
Figure 1 – The scenario description
The process analysis and breakdown provides confidence to motivate an
implementation based on the use of a schema matching workbench like the
HARMONY[7] integration workbench. In fact, beside the other advantages this
approach enables the interoperation and the selection between different and various
prototypes and commercial tools for schema matching and enables the sharing a
common knowledge repository.
Conclusions and future works. We presented the business scenario for a solution
that leverages on matching technology in order to scale-out over hundreds of data
sources. Future works proceed in the following directions: (i) formalization of the
scenario, (ii) evaluation and test of the HARMONY workbench features, and (iii)
development of a specific working prototype for Trentino Riscossioni S.p.A.
Acknowledgments. This work has been supported by Trentino Riscossioni S.p.A and
by Informatica Trentina S.p.A.-TasLab Network Project funded by the EU FSE under
the act n. 1637 (30.06.2008) of the Autonomous Province of Trento.
References
[1] J. Euzenat and P. Shvaiko. Ontology matching. Springer, 2007.
[2] A. Bitterer, M. A. Beyer, and T. Friedman. Magic Quadrant for Data Integration
Tools. Gartner, 2008.
[3] P. Shvaiko and J. Euzenat. Ten Challenges for Ontology Matching. In Proc. of
ODBASE, 2008.
[4] K. Smith, P. Mork, L. Seligman, A. Rosenthal, M. Morse, C. Wolf, D. Allen, M.
Li: The Role of Schema Matching in Large Enterprises. In Proc. of CIDR, 2009.
[5] Y. Asnar, P. Giorgini, P. Ciancarini, R. Moretti, M. Sebastianis, N. Zannone.
Evaluation of Business Solutions in Manufacturing Enterprises. In International
Journal on Business Intelligence and Data Mining, Inderscience, 2008
[6] Jeffery G. Watson. Data Quality Essentials. Uni. of Wisconsin-Madison, 2006
[7] P. Mork, L. Seligman, A. Rosenthal, J. Korb, and C. Wolf. The Harmony
Integration Workbench. Journal on Data Semantics, 2008.
Business Activities
SSMB
ETL Integrated Database Data
Conf
Cadastre
Municipality N
Notifications - Up-channel
Monitoring, Tracking, Quality
DB
Data Quality
Business Applications
DB DB Source
Dest
Municipality 1
Information Engineer
GUI
Water Authority
Power Authority
assessment revenue territory mapping planning support final users services
Car Taxes Authority DB
243
An Ontology-based Data Matching Framework:
Use Case Competency-based HRM
Peter De Baer1, Yan Tang
1, Pieter De Leenheer
2
1 VUB STARLab, Vrije Universiteit Brussel, Pleinlaan 2, 1050 Brussels, Belgium 2 Collibra nv/sa, Ransbeekstraat 230, 12 Brussels, Belgium
{Peter.De.Baer, Yan.Tang}@vub.ac.be; [email protected]
Abstract. As part of the European PROLIX (Process Oriented Learning and
Information eXchange) project, VUB STARLab designed a generic ontology-
based data matching framework (ODMF). Within the project, the ODMF is
used to calculate the similarity between data elements, e.g. competency,
function, person, task, and qualification, based on competency-information.
Several ontology-based data matching strategies were implemented and
evaluated as part of the ODMF. In this article we describe the ODMF and
discuss the implemented matching strategies.
Keywords: data matching, competency management, matchmaking, ontology
1 ODMF
Semantic data matching plays an important role in many modern ICT systems.
Examples are data mining [6], electronic markets [1], HRM [2], service discovery [5],
etc. Many existing solutions, for example [2], make use of description logics and are
often tightly linked to certain ontology engineering platforms and/or domains of data
matching. This often leads to a knowledge bottleneck because many potential domain
users and domain experts may not be familiar with description logics or the specific
platform at hand. To avoid such potential technical barrier we designed the ODMF so
that it is independent of a particular ontology engineering platform, and does not
require the use of description logics. Instead, we make use of the combination of an
ontologically structured terminological database [3] and a DOGMA ontology [4] to
describe data. Both the DOGMA ontology and the terminological database make use
of natural language to describe meaning. On top of this semantic data model we
developed an interpreter module and a comparison module. Both the interpreter and
the comparator make use of a library of matching algorithms. The matching
algorithms have access to the data model via an API, and may be written in any
programming language that can access this Java API. Via the terminology base, data
can be described and interpreted in different natural languages. We believe that this
multilingualism will improve the usefulness of the framework within an international
setting.
The ODMF is designed to support data matching in general. Currently, the ODMF
has been, however, only implemented and evaluated as part of the European
244
integrated PROLIX project1. Within the PROLIX platform
2, the ODMF supports
semantic matching of competency-based data elements, e.g. competency, function,
person, task, and qualification.
2 Matching strategies
We implemented and evaluated several ontology-based data matching algorithms
within the ODMF. These algorithms relate to three major groups: (1) string matching,
(2) lexical matching, and (3) graph matching. However, most matching algorithms
make use of a combination of these techniques.
1. String matching techniques are useful to identify data objects, e.g. competences
and qualifications, using a (partial) lexical representation of the object. We
selected two matching tools for this type of data matching: (a) regular
expressions and (b) the SecondString3 library.
2. Lexical matching techniques are useful to identify data objects, e.g. competences
and qualifications, using a (partial) lexical representation of the object. In
addition to plain string matching techniques, linguistic information is used to
improve the matching. We selected two techniques to improve the matching: (a)
tokenization and lemmatization and (b) the use of an ontologically structured
terminological database.
3. Graph matching techniques are useful (a) to calculate the similarity between two
given objects and (b) to find related objects for a given object.
References
1. Agarwal, S., Lamparter, S.: SMART - A Semantic Matchmaking Portal for Electronic
Markets. In: Proceedings of the Seventh IEEE International Conference on E-Commerce
Technology, pp. 405 – 408, (2005)
2. Biesalski, E., Breiter, M., Abecker, A.: Towards Integrated, Intelligent Human Resource
Management. In: 1st workshop "FOMI 2005", Formal Ontologies Meet Industry (2005)
3. De Baer, P., Kerremans, K., and Temmerman, R.: Constructing Ontology-underpinned
Terminological Resources. A Categorisation Framework API. Proceedings of the 8th
International Conference on Terminology and Knowledge Engineering, Copenhagen (2008)
4. Jarrar, M., Meersman, R.: Formal Ontology Engineering in the DOGMA Approach. In: On
the Move to Meaningful Internet Systems: CoopIS, DOA, and ODBASE, LNCS, Springer
Verlag, pp. 1238-1254 (2002)
5. Shu, G., Rana, O. F., Avis, N. J., Dingfang, C.: Ontology-based semantic matchmaking
approach. In: Advances in Engineering Software 38, pp. 59–67, ScienceDirect (2007)
6. Stamou, S., Ntoulas, A., and Christodoulakis, D.: TODE- an ontology based model for the
dynamic population of web directories. In: “Data Mining with Ontologies: Implementations,
Findings and Frameworks”, edited by Nigro, H., O., Cisaro, S., E., G., Xodo, D., H., IGI
Global (2007)
1 http://www.prolixproject.org/ 2 http://prolixportal.prolix-dev.de/ 3 http://secondstring.sourceforge.net/
245
Improving bio-ontologies matching using typesand adaptive weights
Bastien Rance1 and Christine Froidevaux1
LRI, UMR 8623, Univ. of Paris-Sud, CNRSF-91405 Orsay CEDEX [email protected]
Functional annotation consists in assigning a biological function to a givenprotein. It is a crucial task in biology and has various impacts on many fields,including understanding cellular processes and drug designing. In order to be ableto share and reuse annotations, biologists and bioinformaticians have developedstructured controlled vocabularies that were first simple classifications and thenmore elaborated ontologies such as the Gene Ontology [1].
In our project, biologists and bioinformaticians collaborators are interested inproteins annotated with two distinct ontologies, such that no protein is annotatedwith both of them. These ontologies are merely functional hierarchies (Subtilist[2] and FunCat [3]) that share common features: (i) a simple structure with noexplicit relationships (subsumption relationships can be deduced from conceptsidentifiers), (ii) high broadness and small depth, and (iii) variable size.
The system O’Browser [4] we have designed to align functional hierarchies,is based on a weighted combination of matchers as many ontology matchingsystems [5], with two original characteristics. Indeed, we had to face two issues:(a) a high number of candidates pairs of concepts, and (b) a variable quality ofthe results of the matchers with respect to the gold standard built by the expert.
As the number of candidates pairs of concepts can be unnecessarily huge,we propose to reduce it by exploiting domain knowledge. For it, we have usedtypes (groups of concepts sharing the same semantic context). Concepts thatare related to the same field (in our case the same functional genomic field) areassigned to the same type. As an example, the concepts Utilization of Carbonand Synthesis of Glucose are related to the type Metabolism. As in [6], conceptsof distinct types will never be mapped (e.g. Germination in the context of plantsand Germination in the context of bacteria). In our approach, an expert man-ually assigns types to the top concepts of the hierarchies, that represent only asmall part of the whole set of concepts of both hierarchies. Types are then spreadto all concepts using subsumption relationships. In our experiment, the use oftypes has allowed to divide the number of candidate pairs by 7. The originalityof our contribution is to propose a machine learning strategy to assign types toconcepts.
The second issue is about the variable quality of the scores of a given matcher.It has been shown that the good results of a matcher may be spoiled by the scoresof other matchers [7, 8]. To address this issue, we would like to give a high weightto a matcher in a combination of matchers only when its results are informative.We claim that the weight of a matcher in a combination should partially depend
246
on its scores (adaptive weighting). As an example, let us consider a string-based matcher that compares concepts from two biological ontologies. If thelabels of the concepts are close, the two concepts are likely to be equivalent.On the opposite, distant labels do not indicate necessarily that the concepts aredistant. Consequently the weight of the string-based matcher should be high forhigh scores and weak for low scores.For each matcher, we define a weighting function which associates a weight toeach score of the matcher. Let O1 (resp. O2) be the set of concepts of the first(resp. second) ontology and let Mi be a matcher: O1×O2 → Domi, the weightingfunction Wi is defined on Domi and has [0, 1] as a range. For example, assumethat the range of the string-based matcher is DomString−based = [0, 1]. Thena weighting function could be the following simple function: WString−based :[0, 1] → [0, 1], where WString−based(α) = 1 if α > 0.5 and WString−based(α) =0.25 otherwise. Unlike in [9], we allow to associate a strong confidence (andthus a high weight) to low results of a matcher in the case where the scoreof the matcher is a strong indicator of the absence of equivalence between theconsidered concepts.
We successfully used types and adaptive weighting to align Subtilist andFunCat and compared the results to the gold standard. O’Browser with adaptiveweighting found 80 % of the actual correspondences, while O’Browser with thebest classical matcher combination found only 70 % of them.
References
1. The Gene Ontology Consortium: Creating the gene ontology resource: design andimplementation. Genome Res. 11 (2001) 1425–1433 http://www.geneontology.org.
2. Moszer, I., Jones, L., Moreira, S., Fabry, C., Danchin, A.: Subtilist: the referencedatabase for the Bacillus subtilis genome. Nucleic Acids Res 30 (2002) 62–5
3. Ruepp, A., Zollner, A., Maier, D., Albermann, K., Hani, J., Mokrejs, M., Tetko, I.,Gldener, U., Mannhaupt, G., Mnsterktter, M., Mewes, H.: The FunCat, a functionalannotation scheme for systematic classification of proteins from whole genomes.Nucleic Acids Res. 14((32)18) (2004) 5539–5545
4. Rance, B., Gibrat, J.F., Froidevaux, C.: An adaptive combination of matchers:application to the mapping of biological ontologies for genome annotation. In:Proc. of the 5th Data Integration in the Life Sciences workshop DILS’09. LNBI5647 (2009) 113–126
5. Euzenat, J., Shvaiko, P.: Ontology matching. Springer-Verlag, Heidelberg (DE)(2007)
6. Zhang, S., Mork, P., Bodenreider, O., Bernstein, P.A.: Comparing two approachesfor aligning representations of anatomy. Artificial Intelligence in Medicine 39(3)(2007) 227–236
7. Ghazvinian, A., Noy, N.F., Musen, M.A.: Creating mappings for ontologies inbiomedicine: Simple methods work. Technical report, Stanford Center for Biomed-ical Informatics Research (2009)
8. Ontology Alignment Evaluation Initiative: http://www.oaei.ontologymatching.org9. Mork, P., Seligman, L., Rosenthal, A., Korb, J., Wolf, C.: The harmony integration
workbench. J. Data Semantics 11 (2008) 65–93
247
Parallelization and Distribution Techniques for
Ontology Matching in Urban Computing Environments
Axel Tenschert1, Matthias Assel1, Alexey Cheptsov1, Georgina Gallizo1, Emanuele
Della Valle², Irene Celino²
1 HLRS – High-Performance Computing Center Stuttgart, University of Stuttgart,
Nobelstraße 19,
70569 Stuttgart, Germany
{tenschert, assel, cheptsov, gallizo}@hlrs.de
´
² CEFRIEL - ICT Institute, Politecnico of Milano,
Via Fucini 2,
20133 Milano, Italy
{emanuelle.dellavalle, irene.celino}@cefriel.it
Abstract. The usage of parallelization and distribution techniques in the field of
ontology matching is of high interest for the semantic web community. This
work presents an approach for managing the process of extending complex
information structures as used in Urban Computing system by means of
ontology matching considering parallelization and distribution techniques.
Keywords: Ontology Matching, Semantic Content, Parallelization, Distribution
Ontology Matching through Distribution and Parallelization
Current ontology matching approaches [1] require a high amount of compute
resources with the aim to meet the requirements of the matching and merging
methods. Hence, several issues have to be considered such as the selection of a
suitable ontology, scalability and robustness, matching sequence and identification of
the ontology repositories. Approaches for partitioning selected ontologies with the
aim to execute matching processes independently from other parts of the ontology are
considered to solve this challenge [2]. However, a local ontology matching is a risk
for these approaches in terms of scalability and performance issues. Therefore, local
ontology matching could be extended by making use of distribution methods as well
as parallelization techniques allowing overcoming existing limitations and improving
the overall performance.
Within the LarKC project1, respective techniques for processing large data sets in
the research field of the semantic web are investigated and developed. In particular,
distribution methods and parallelization techniques are evaluated by executing the
matching processes concurrently on distributed and diverse compute resources. A
1 LarKC (abbr. The Large Knowledge Collider): http://www.larkc.eu
248
dedicated use case in LarKC deals with the application of these techniques for Urban
Computing problems [3].
Common ontology matching algorithms often perform computation intensive
operations and thus being considerably time consuming. That poses a number of
challenges towards their practical applicability for complex tasks and efficient
utilization of the computing architectures that best fit the requirements in order to
achieve maximal performance and scalability of the performed operations [4].
Distributed ontology matching enables the use of diverse computing resources, from
users’ desktop computers to heterogeneous Grid/Cloud infrastructures. Parallelization
is the main approach for the effective ontology matching, especially when time
characteristics are settled to the point. When thinking of matching several parts of an
ontology in parallel in a cluster environment, the matching processes needs to be
partitioned. After processing the data, the parts of the ontology have to be merged
together again and an extended ontology is generated [5].
Several techniques can be recognized for the parallel implementation of distributed
ontology matching.
Single Code Multiple Data (SCMD workflow)
In this case the data that is being processed in the code region can be
constructed of subsets that have no dependencies between them. The same
operation is performed on each of these subsets.
Multiple Code Single Data (MCSD workflow without conveyer dependencies)
For this workflow, several different operations are performed on the same
dataset. Herewith, no dependencies between processed data sets exist. This is
typical for a transformation of one dataset to another one according to rules,
which are specific for each subset of the produced data.
Multiple Code Multiple Data (MCMD workflow)
This type of workflow is the combination of both previous workflows (SCMD
and MSCD).
The presented approach is an effective method to solve the challenge of matching
large ontologies in a scalable, robust and timesaving way. Within the LarKC project,
these parallelization and distribution techniques for processing semantic data
structures are deeply analyzed and further developed.
Acknowledgments. This work has been supported by the LarKC project
(http://www.larkc.eu), partly funded by the European Commission's IST activity of
the 7th Framework Program. This work expresses only the opinions of the authors.
References 1. Alasoud, A., Haarslev, V., Shiri N.: An empirical comparison of ontology matching
techniques. Journal of Information Science 35, 379--397 (2009)
2. Hu W., Cheng G., Zheng D., Zhong X., Qu Y.: The Results of Falcon-AO in the OAEI 2006
Campaign. Ontology Alignment Evaluation Initiative (2006)
3. Kindberg, T., Chalmers, M., Paulos E.: Introduction: Urban Computing. IEEE Pervasive
Computing 6, 18--20 (2007)
4. Shvaiko, P., Euzenat, J.: Ten Challenges for Ontology Matching. In: Proceedings of
ODBASE, LNCS 5332, pp. 1164--1182, Springer (2008)
5. Dean, J., Ghemawat, S.: Simplified Data Processing on Large Clusters. OSDI'04: Sixth
Symposium on Operating System Design and Implementation, San Francisco (2004)
249
CompositeMatch: Detecting N-Ary Matches inOntology Alignment?
Kelly Moran1, Kajal Claypool1, and Benjamin Hescott2
1 MIT Lincoln Laboratory{kmoran,claypool}@ll.mit.edu
2 Tufts [email protected]
Abstract. The field of ontology alignment still contains numerous unre-solved problems, one of which is the accurate identification of compositematches. In this work, we present a context-sensitive ontology alignmentalgorithm, CompositeMatch, that identifies these matches, along with thetypical one-to-one matches, by looking more broadly at the informationthat a concept’s relationships confer. We show that our algorithm canidentify composite matches with greater confidence than current tools.
1 Introduction
Numerous ontology alignment algorithms have been developed during recent yearsto handle the growing challenge of aligning ontologies. While numerous advanceshave been made, most ontology alignment algorithms are still somewhat inade-quate at identifying complex relationship-based matches, a la composite matches.A composite match is defined as a match between a concept c0 in ontology O andmultiple concepts c0’...cn’ in ontology O’; the reverse; or alternatively betweenmultiple concepts in O and multiple concepts in O’. For example, if an ontology Ocontains the concept Name and an ontology O’ contains concepts FirstName andLastName, then Name matches neither FirstName nor LastName but the com-posite of the two. In this work, we present CompositeMatch, an algorithm thatcombines linguistic and contextual approaches for semi-automatically discoveringboth one-to-one and composite matches.
2 The CompositeMatch Algorithm
CompositeMatch is a three-pass algorithm that operates on two input ontologiesand produces an alignment file containing matches between them. The first phaseperforms a linguistic match between the ontologies’ concepts. The linguistic matchassigns a normalized similarity score between 0 and 1.0 to each pair.? This work was sponsored by the Federal Aviation Administration under Air
Force Contract No. FA8721-05-C-0002. Opinions, interpretations, conclusions, andrecommendations are those of the authors and are not necessarily endorsed by theUnited States Government.
250
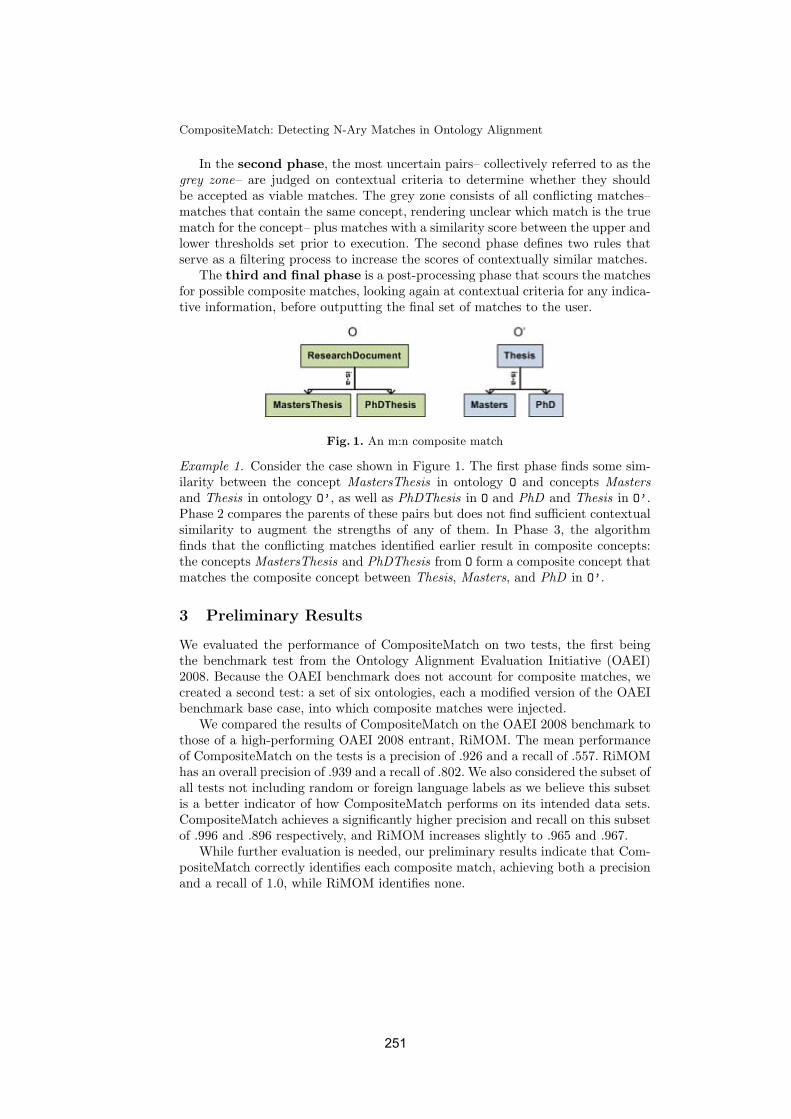
CompositeMatch: Detecting N-Ary Matches in Ontology Alignment
In the second phase, the most uncertain pairs– collectively referred to as thegrey zone– are judged on contextual criteria to determine whether they shouldbe accepted as viable matches. The grey zone consists of all conflicting matches–matches that contain the same concept, rendering unclear which match is the truematch for the concept– plus matches with a similarity score between the upper andlower thresholds set prior to execution. The second phase defines two rules thatserve as a filtering process to increase the scores of contextually similar matches.
The third and final phase is a post-processing phase that scours the matchesfor possible composite matches, looking again at contextual criteria for any indica-tive information, before outputting the final set of matches to the user.
Fig. 1. An m:n composite match
Example 1. Consider the case shown in Figure 1. The first phase finds some sim-ilarity between the concept MastersThesis in ontology O and concepts Mastersand Thesis in ontology O’, as well as PhDThesis in O and PhD and Thesis in O’.Phase 2 compares the parents of these pairs but does not find sufficient contextualsimilarity to augment the strengths of any of them. In Phase 3, the algorithmfinds that the conflicting matches identified earlier result in composite concepts:the concepts MastersThesis and PhDThesis from O form a composite concept thatmatches the composite concept between Thesis, Masters, and PhD in O’.
3 Preliminary Results
We evaluated the performance of CompositeMatch on two tests, the first beingthe benchmark test from the Ontology Alignment Evaluation Initiative (OAEI)2008. Because the OAEI benchmark does not account for composite matches, wecreated a second test: a set of six ontologies, each a modified version of the OAEIbenchmark base case, into which composite matches were injected.
We compared the results of CompositeMatch on the OAEI 2008 benchmark tothose of a high-performing OAEI 2008 entrant, RiMOM. The mean performanceof CompositeMatch on the tests is a precision of .926 and a recall of .557. RiMOMhas an overall precision of .939 and a recall of .802. We also considered the subset ofall tests not including random or foreign language labels as we believe this subsetis a better indicator of how CompositeMatch performs on its intended data sets.CompositeMatch achieves a significantly higher precision and recall on this subsetof .996 and .896 respectively, and RiMOM increases slightly to .965 and .967.
While further evaluation is needed, our preliminary results indicate that Com-positeMatch correctly identifies each composite match, achieving both a precisionand a recall of 1.0, while RiMOM identifies none.
251
Recommendations for QualitativeOntology Matching Evaluations
Aliaksandr Autayeu, Vincenzo Maltese, and Pierre Andrews
DISI, University of Trento, Italy
Abstract. This paper suggests appropriate rules to set up ontologymatching evaluations and for golden standard construction and use whichcan significantly improve the quality of the precision and recall measures.
We focus on the problem of evaluating ontology matching techniques [1]which find mappings with equivalence, less general, more general and disjoint-ness, and on how to make the evaluation results fairer and more accurate.
The literature discusses the appropriateness and quality of the measures [2],but contains little about evaluation methodology [3]. Closer to us, [4] raises theissue of evaluating non-equivalence links.
Golden standards (GS) are fundamental for evaluating the precision and re-call [2]. Typically, hand-made positive (GS+) and negative (GS−) golden stan-dards contain links considered correct and incorrect, respectively. Ideally, GS−
complements GS+, leading to a precise evaluation. Yet, in big datasets annotat-ing all links is impractical and golden standards are often a sample of all nodepairs, leading to approximate evaluations [5]. However, most current evaluationcampaigns tend to use tiny ontologies, risking biased or poorly significant results.
Recommendation 1. Use large golden standards. Include GS− for a goodapproximation of the precision and recall. To be statistically significant,cover in GS+ and GS− an adequate portion of all node pairs.
In a sampled GS, results reliability depends on: (a) the portion of the pairscovered; (b) the ratio between GS+ and GS− sizes and (c) their quality (see lastrecommendation).
Most matching tools produce equivalence, some also produce less generaland more general relations, but few output disjointness [6]. This must be takeninto account to correctly compare evaluations. Usually, only the presence of arelation is evaluated, regardless the kind. Moreover, disjointness (two completelyunrelated nodes) is often confused with overlap (two nodes whose intersectionis not empty) and both are put in the GS− [5]. This leads to imprecise results.
Recommendation 2. When presenting evaluation results, specify whetherand how the evaluation takes into account the semantic relations kind.
We use the notion of redundancy [7] to judge the quality of a golden stan-dard. We use the Min(mapping) function to remove redundant links (pro-ducing the minimized mapping) and the Max(mapping) function to add all
252
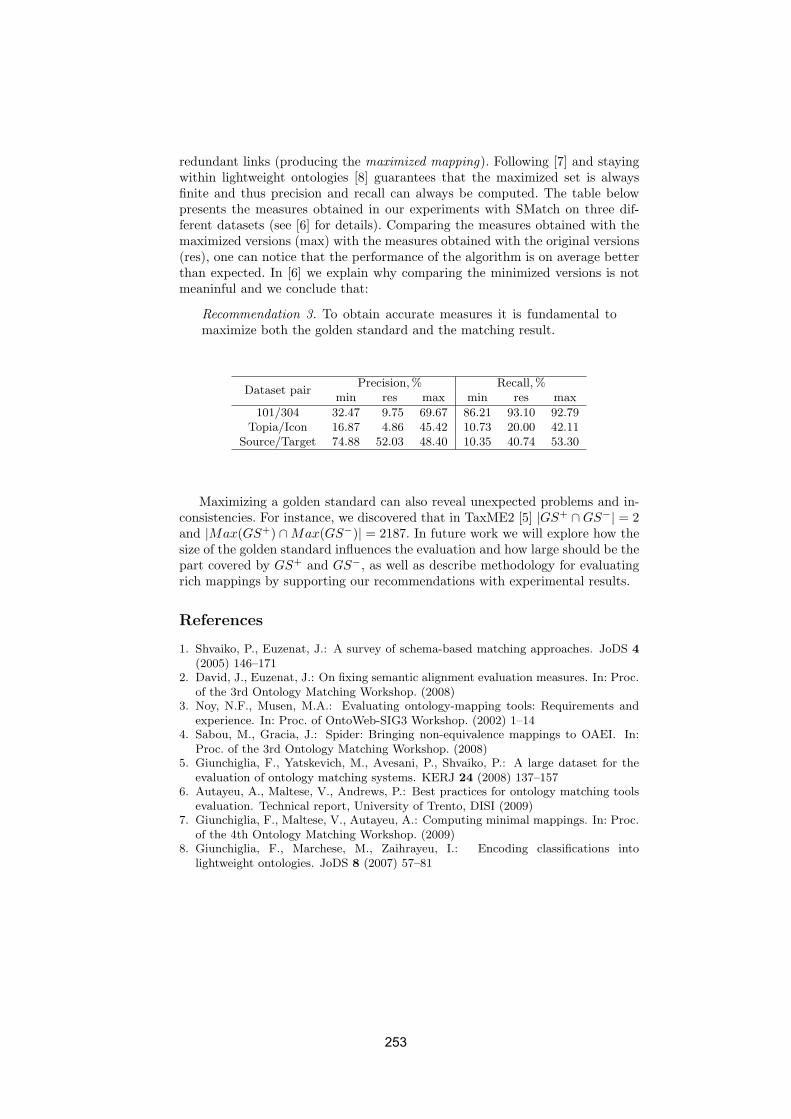
redundant links (producing the maximized mapping). Following [7] and stayingwithin lightweight ontologies [8] guarantees that the maximized set is alwaysfinite and thus precision and recall can always be computed. The table belowpresents the measures obtained in our experiments with SMatch on three dif-ferent datasets (see [6] for details). Comparing the measures obtained with themaximized versions (max) with the measures obtained with the original versions(res), one can notice that the performance of the algorithm is on average betterthan expected. In [6] we explain why comparing the minimized versions is notmeaninful and we conclude that:
Recommendation 3. To obtain accurate measures it is fundamental tomaximize both the golden standard and the matching result.
Dataset pairPrecision,% Recall,%
min res max min res max
101/304 32.47 9.75 69.67 86.21 93.10 92.79Topia/Icon 16.87 4.86 45.42 10.73 20.00 42.11
Source/Target 74.88 52.03 48.40 10.35 40.74 53.30
Maximizing a golden standard can also reveal unexpected problems and in-consistencies. For instance, we discovered that in TaxME2 [5] |GS+ ∩GS−| = 2and |Max(GS+) ∩Max(GS−)| = 2187. In future work we will explore how thesize of the golden standard influences the evaluation and how large should be thepart covered by GS+ and GS−, as well as describe methodology for evaluatingrich mappings by supporting our recommendations with experimental results.
References
1. Shvaiko, P., Euzenat, J.: A survey of schema-based matching approaches. JoDS 4(2005) 146–171
2. David, J., Euzenat, J.: On fixing semantic alignment evaluation measures. In: Proc.of the 3rd Ontology Matching Workshop. (2008)
3. Noy, N.F., Musen, M.A.: Evaluating ontology-mapping tools: Requirements andexperience. In: Proc. of OntoWeb-SIG3 Workshop. (2002) 1–14
4. Sabou, M., Gracia, J.: Spider: Bringing non-equivalence mappings to OAEI. In:Proc. of the 3rd Ontology Matching Workshop. (2008)
5. Giunchiglia, F., Yatskevich, M., Avesani, P., Shvaiko, P.: A large dataset for theevaluation of ontology matching systems. KERJ 24 (2008) 137–157
6. Autayeu, A., Maltese, V., Andrews, P.: Best practices for ontology matching toolsevaluation. Technical report, University of Trento, DISI (2009)
7. Giunchiglia, F., Maltese, V., Autayeu, A.: Computing minimal mappings. In: Proc.of the 4th Ontology Matching Workshop. (2009)
8. Giunchiglia, F., Marchese, M., Zaihrayeu, I.: Encoding classifications intolightweight ontologies. JoDS 8 (2007) 57–81
253
Implementing Semantic Precision and Recall
Daniel Fleischhacker and Heiner Stuckenschmidt
University of Mannheim, Mannheim, Germany
[email protected], [email protected]
1 Introduction
The systematic evaluation of ontology alignments still faces a number of problems.One is the argued inadequacy of traditional quality measures adopted from the field ofinformation retrieval. In previous work, Euzenat and others have proposed notions ofsemantic precision and recall that are supposed to better reflect the true quality of analignment by considering the deductive closure of a mapping rather than the explicitlystated correspondences. So far, these measures have been mostly investigated in theory.In this paper, we present the first implementation of a restricted version of semanticprecision and recall as well as experiments in using it, we conducted on the results ofthe 2008 OAEI campaign.
2 Restricted Semantic Precision and Recall
In this work, we treat alignments as sets of correspondences whereas correspondencesgive a relation between two entities from different ontologies. To evaluate alignments,we use the notion of aligned ontologies. An aligned ontology is made of the two ontolo-gies which are referenced by an alignment and the correspondences contained in thisalignment added into the aligned ontology as axioms. To convert correspondences intoaxioms, we use semantics as the natural and pragmatic semantics given by Meilicke andStuckenschmidt [3]. The basis of our work is the work of Euzenat [2] which we adaptedto our different understanding of alignment semantics. The basic notion given by Eu-zenat and used here is the notion of α-consequences. These are correspondences whichare implied by an aligned ontology given specific semantics. For ontologiesO1 andO2,a corresponding alignment A and reductionistic semantics S, we say A �S
O1,O2 c if c isan α-consequence.
Applying this definition to complete alignments instead of single correspondences,we get the closure of an alignment which resembles the sets of α-correspondences usedby Euzenat. For given ontologies O1, O2 and a reductionistic semantics S the closureCn of an alignment A is given by CnS
O1,O2(A) = {c |A �SO1,O2 c}.
We introduce a restricted variant of ideal semantic precision and recall which doesnot suffer from the problems of the ideal semantic precision and recall mentioned byEuzenat [2] and also prevent problems examined by David and Euzenat [1]. For thispurpose, we call alignments non-complex if they contain only correspondences whoseentities refer to single atomic concepts of the ontologies.
254
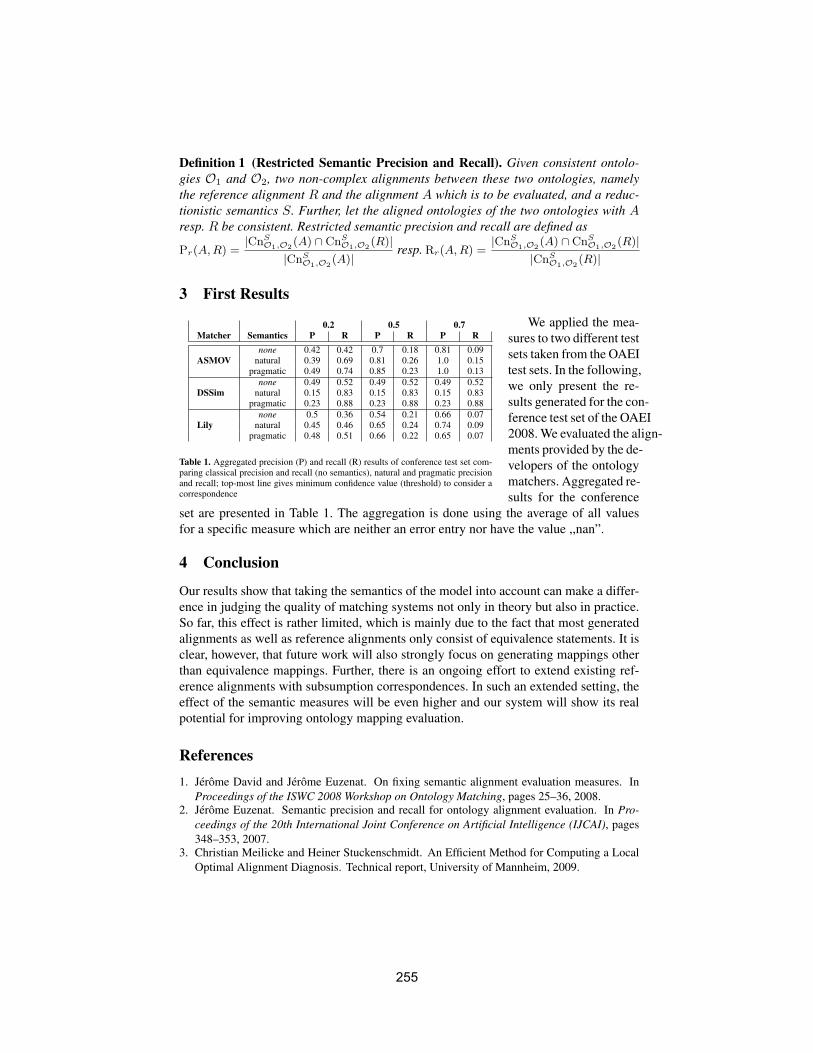
Definition 1 (Restricted Semantic Precision and Recall). Given consistent ontolo-gies O1 and O2, two non-complex alignments between these two ontologies, namelythe reference alignment R and the alignment A which is to be evaluated, and a reduc-tionistic semantics S. Further, let the aligned ontologies of the two ontologies with Aresp. R be consistent. Restricted semantic precision and recall are defined as
Pr(A, R) =|CnS
O1,O2(A) ∩ CnSO1,O2(R)|
|CnSO1,O2
(A)|resp. Rr(A, R) =
|CnSO1,O2(A) ∩ CnS
O1,O2(R)||CnS
O1,O2(R)|
3 First Results
We applied the mea-0.2 0.5 0.7Matcher Semantics P R P R P R
ASMOVnone 0.42 0.42 0.7 0.18 0.81 0.09
natural 0.39 0.69 0.81 0.26 1.0 0.15pragmatic 0.49 0.74 0.85 0.23 1.0 0.13
DSSimnone 0.49 0.52 0.49 0.52 0.49 0.52
natural 0.15 0.83 0.15 0.83 0.15 0.83pragmatic 0.23 0.88 0.23 0.88 0.23 0.88
Lilynone 0.5 0.36 0.54 0.21 0.66 0.07
natural 0.45 0.46 0.65 0.24 0.74 0.09pragmatic 0.48 0.51 0.66 0.22 0.65 0.07
Table 1. Aggregated precision (P) and recall (R) results of conference test set com-paring classical precision and recall (no semantics), natural and pragmatic precisionand recall; top-most line gives minimum confidence value (threshold) to consider acorrespondence
sures to two different testsets taken from the OAEItest sets. In the following,we only present the re-sults generated for the con-ference test set of the OAEI2008. We evaluated the align-ments provided by the de-velopers of the ontologymatchers. Aggregated re-sults for the conference
set are presented in Table 1. The aggregation is done using the average of all valuesfor a specific measure which are neither an error entry nor have the value ,,nan”.
4 Conclusion
Our results show that taking the semantics of the model into account can make a differ-ence in judging the quality of matching systems not only in theory but also in practice.So far, this effect is rather limited, which is mainly due to the fact that most generatedalignments as well as reference alignments only consist of equivalence statements. It isclear, however, that future work will also strongly focus on generating mappings otherthan equivalence mappings. Further, there is an ongoing effort to extend existing ref-erence alignments with subsumption correspondences. In such an extended setting, theeffect of the semantic measures will be even higher and our system will show its realpotential for improving ontology mapping evaluation.
References1. Jerome David and Jerome Euzenat. On fixing semantic alignment evaluation measures. In
Proceedings of the ISWC 2008 Workshop on Ontology Matching, pages 25–36, 2008.2. Jerome Euzenat. Semantic precision and recall for ontology alignment evaluation. In Pro-
ceedings of the 20th International Joint Conference on Artificial Intelligence (IJCAI), pages348–353, 2007.
3. Christian Meilicke and Heiner Stuckenschmidt. An Efficient Method for Computing a LocalOptimal Alignment Diagnosis. Technical report, University of Mannheim, 2009.
255
Learning to Map Ontologies with Neural Network
Yefei Peng, Paul Munro
School of Information Sciences University of Pittsburgh
Pittsburgh, PA 15206 USA {ypeng, pmunro}@mail.sis.pitt.edu
Ming Mao SAP Labs
Palo Alto, CA 94304 USA [email protected]
Abstract. In this paper the authors applied the idea of training multiple tasks simultaneously on a partially shared feed forward network to domain of ontology mapping. A “cross training” mechanism was used to specify corresponding nodes between the two ontologies. By examining output of one network in response to stimulus from the other network, we can test if the network can learn the correspondence that was not cross-trained. Two kinds of studies on ontology mapping were conducted. The result shows the network can fill in the missing mappings between ontologies with sufficient training data.
Keywords: neural network, shared weights, transfer, analogy, ontology mapping
An early implementation of IENN appeared at Munro’s work [2], which used feedforward network with two hidden layers and trained on three simple analogous tasks: three squares with different orientation. In this study, we use partially shared network architecture [3] [4]. It should be noted that the partially shared network architecture used here is virtually identical to the network used in Hinton’s [1] classic “family trees” example. The network in that paper also had independent inputs and shared hidden units, but only briefly addresses the notion of generalization.
The ontologies used in our experiment were Ontology A and B shown in Figure 1. There are four types of relationship: identity, parent, child, and sibling. So there are 4 nodes in Sin. Training in NetA include all possible training data in Ontology A, i.e. possible combinations of 6 nodes and 4 relationships. The same for NetB.
The network is cross trained on the following pairs: (r, R), (a, A), (b, B), (c, C) and (d, D).
Totally 100 trials were performed. In each trial, networks were initialized by setting the weights to small random values from a uniform distribution. The network was trained with two vertical training tasks (NetA and NetB), and two cross training tasks(NetAB and NetBA).
One training cycle of the networks is 1) randomly train a record for NetA 2) randomly train a record for NetB 3) with a probability train a record for NetAB and the same record for NetBA. The probability of cross training is 0.6. After each trial, cross-testing was performed for A:1, B:2, B:3, and B:4. “self”
relationship was used during cross-testing.
256
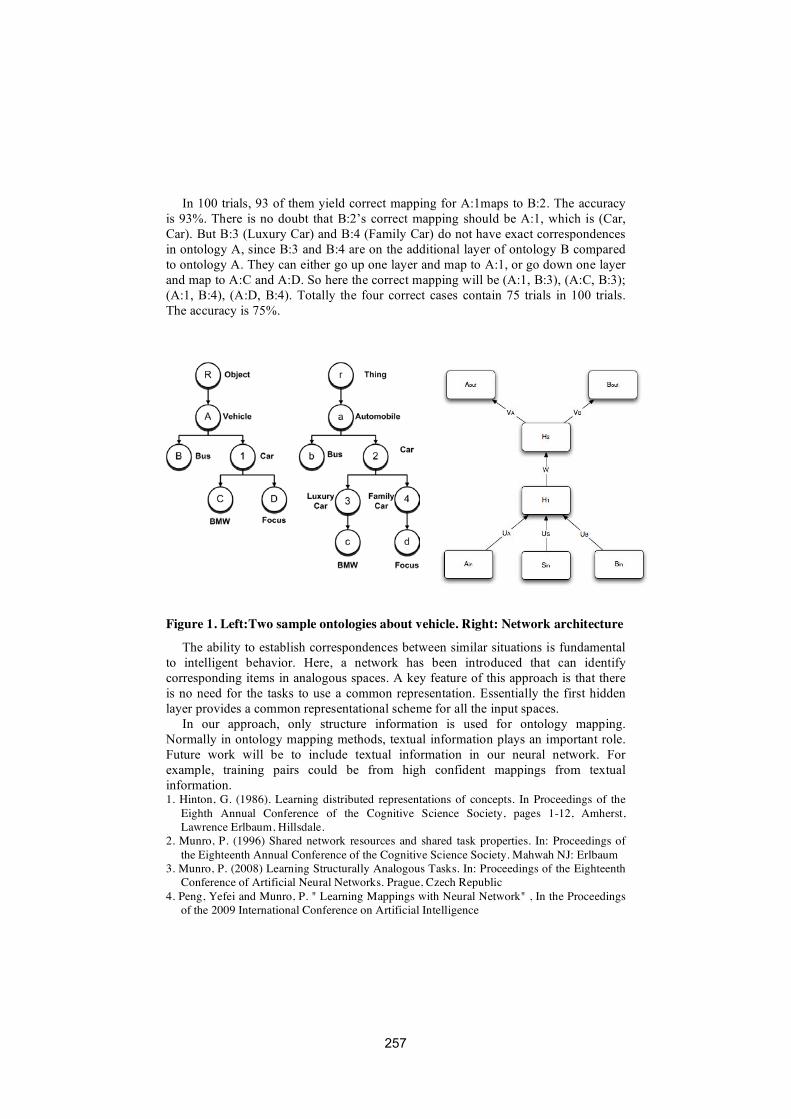
In 100 trials, 93 of them yield correct mapping for A:1maps to B:2. The accuracy is 93%. There is no doubt that B:2’s correct mapping should be A:1, which is (Car, Car). But B:3 (Luxury Car) and B:4 (Family Car) do not have exact correspondences in ontology A, since B:3 and B:4 are on the additional layer of ontology B compared to ontology A. They can either go up one layer and map to A:1, or go down one layer and map to A:C and A:D. So here the correct mapping will be (A:1, B:3), (A:C, B:3); (A:1, B:4), (A:D, B:4). Totally the four correct cases contain 75 trials in 100 trials. The accuracy is 75%.
Figure 1. Left:Two sample ontologies about vehicle. Right: Network architecture
The ability to establish correspondences between similar situations is fundamental to intelligent behavior. Here, a network has been introduced that can identify corresponding items in analogous spaces. A key feature of this approach is that there is no need for the tasks to use a common representation. Essentially the first hidden layer provides a common representational scheme for all the input spaces.
In our approach, only structure information is used for ontology mapping. Normally in ontology mapping methods, textual information plays an important role. Future work will be to include textual information in our neural network. For example, training pairs could be from high confident mappings from textual information. 1. Hinton, G. (1986). Learning distributed representations of concepts. In Proceedings of the
Eighth Annual Conference of the Cognitive Science Society, pages 1-12, Amherst, Lawrence Erlbaum, Hillsdale.
2. Munro, P. (1996) Shared network resources and shared task properties. In: Proceedings of the Eighteenth Annual Conference of the Cognitive Science Society. Mahwah NJ: Erlbaum
3. Munro, P. (2008) Learning Structurally Analogous Tasks. In: Proceedings of the Eighteenth Conference of Artificial Neural Networks. Prague, Czech Republic
4. Peng, Yefei and Munro, P. " Learning Mappings with Neural Network" , In the Proceedings of the 2009 International Conference on Artificial Intelligence
257
Matching Natural Language Data with Ontologies
Johannes Heinecke
Orange Labs, F-22307 Lannion cedex – [email protected]
Abstract. Ontologies and natural languages are complementary. Whereas ontologiesare used to model knowledge formally, natural language is primarily used by users tocommunicate with ontology based systems. In order to transform information or queriesin natural language into valid ontological expressions, the meaning of natural languageentities have to be matched with the given ontologies. In contrast to pure ontologymatching, the matching with natural language data poses some problems linked to theirambiguities (synonymy, homonymy/polysemy, redundancy, to name but a few).
1 Introduction, context and related work
In the context of the Semantic Web, the interfacing of ontological representation and naturallanguage is an important issue. Since much information on the Web exists (only) in tex-tual form, the usage of this information in ontology based tools is not possible unless thesetexts are made accessible or comprehensible by such tools. This means that texts and userqueries have to be “translated” into an ontological representation language such as the W3Clanguages RDF/RDFS and OWL.
The need for the work described here came from the aceMedia project (http://www.acemedia.org/ ) [1,2] (cf. also [3]). In this project, the two tasks are
transforming textual annotations of multimedia contents into an ontological representa-tion (based on an existing ontology) in order to make them available for a knowledge-base;and translating English and French user queries into an ontological query language (in ourcase SPARQL). The matching of linguistic data (lexicons, thesauri) with ontologies is similarbut not identical to ontology matching or ontology alignment, i.e. trying to find correspond-ing classes of ontology A in ontology B [4]. Different methods of matching are discussedin detail by [5, p. 65]. Following this classification the present approach can be consideredbeing terminological and linguistic, since we use relationships found in the lexicon (via asemantic thesaurus, [6]) and the taxonomic hierarchies of both, the lexical semantic data andthe ontologies notably for the disambiguation of polysemous words. Similar work describe[7] and [8]. In contrast to their results we do not have a classification at hand.
2 Linguistic-ontology matching
Apart from the ontologies, the matching requires a complete lexicon of the language used tolabel or describe the ontological classes and properties (= entities). Our lexicon is lso linkedto a semantic thesaurus. The ontologies, on the other hand, usually have non-ambiguousentity labels (like http: //www.acemedia.org/ontos/tennis#Player1) or a comment, explain-ing the entity. This is especially necessary if the entity labels are not self-explanatory like
1 We shorten name spaces like http://www.acemedia.org/ontos/tennis# to “tennis:” etc.
258
tennis:C12 (a fortunately rare case). Further, the semantic thesaurus contains a thematic hi-erarchy of all semantic concepts to help disambiguation. These are grouped into 880 themeswhich in turn are organized in 80 domains. Domains are divided into about 10 macro-do-
NLP
(a) extract and correct class and property labels
(d) Detecting synonyms and hyponyms
(b) Semantic analysis of classes (taking into
account their taxonomic context)
(c) Semantic analysis of properties (taking into
account their range and domain)
(f) Creation of semantic clustering rules for complex classes
(g) Creation of RDFS rules (predicateclass
transformation)
semanticthesaurus
domainontologies
lexicon
(e) adding ontologies to semantic thesaurus
Fig. 1. linguistic-ontological matching
mains. The matching itself comprises severalsteps (cf. fig. 1). Apart from a (more or lessmanual) preparation in order to correct possi-ble labeling errors in the ontologies, the othersteps do not need any intervention: (a) extract-ing the “ontological context” of entities and as-signing eventual reformulations of entity labels;(b) natural language processing passes: detect-ing meanings for classes using their ontological
context (direct sub-classes); (c) and for properties using their ontological context (domainand range classes); (d) determining the application depending synonyms and co-hyponyms;(e) adding the ontological hierarchy to the semantic taxonomy; (f) creating semantic trans-formation rules for “complex class labels”2; (g) creating transformation rules for the creationof ontological representation (from semantic graphs. Synonyms (defined in our multilingualthesaurus, [9]) are all matched onto the same ontological class (e.g. “river”, “stream”, “creek”etc.→ holidays:River). If a class has no sub-classes, we also match the co-hyponyms of thelabel to the class (e.g. in our case “car”, “bus”, “truck”, “motorbike” . . . → general:Vehicle.The resulting linguistic data is successfully used the aceMedia prototype, similarly produceddata is used in an industrial application to create and access ontological based informationfrom/via natural language.
New perspectives are offered by structured semantic data which is getting more and moreavailable. Databases like Wikipedia (especially the categorization schema used within) orRDF or ontology based information systems like DBpedia or freebase3 (both initialized byWikipedia contents) will help to improve the linking of natural languages and formally mod-eled ontologies.
References
1. Heinecke, J.: Generation automatique des representations ontologiques. In: TALN. (2006) 502–5112. Dasiopoulou, S., Heinecke, J., Saathoff, C., Strintzis, M.G.: Multimedia reasoning with natural
language support. In: IEEE-ICSC. (2007) 413–4203. Heinecke, J., Toumani, F.: A Natural Language Mediation System for E-Commerce applications.
In: Workshop HLT for the Semantic Web and Web Services. ISWC. (2003) 39–504. Ehrig, M., Staab, S.: QOM - quick ontology mapping. In: ISWC. (2004) 683–6975. Euzenat, J., Shvaiko, P.: Ontology Matching. Springer, Heidelberg (2007)6. Heinecke, J., Smits, G., Chardenon, C., Guimier De Neef, E., Maillebuau, E., Boualem, M.: TiLT :
plate-forme pour le traitement automatique des langues naturelles. TAL 49:2 (2008)7. Giunchiglia, F., Marchese, M., Zaihrayeu, I.: Encoding classifications into lightweight ontologies.
Journal of Data Semantics VIII (2007) 57–818. Reiter, N., Hartung, M., Frank, A.: A resource-poor approach for linking ontology classes to
Wikipedia articles. In: STEP. (2008) 381–3879. Chagnoux, M., Heinecke, J.: Aligner ontologies et langues naturelles. gerer la synonymie. In:
Plateforme AFIA, Grenoble (2007) 87–94
2 Labels which use multi-word expressions like tennis:ExhibitionMatch instead of simple words.3 http://dbpedia.org/ , http:// freebase.com/
259
Reducing polysemy in WordNet
Kanjana Jiamjitvanich, Mikalai Yatskevich
Department of Information and Communication Technology, University of Trento, Italy
[email protected], [email protected]
1 WordNet
WordNet [4] is the lexical database for English language. A synset is a WordNet structure for storing senses of the words. Synset contains a set of synonym words and their brief description called gloss. For example, well, wellspring and fountainhead have the same meaning according to WordNet, so these three words are grouped in to one synset which is explained by a gloss "an abundant source".
A known problem of WordNet is that it is too fine-grained in its sense definitions. For instance, it does not distinguish between homographs (words that have the same spelling and different meanings) and polysemes (words that have related meanings). We propose to distinguish only between polysemes within WordNet while merging all homograph synsets. The ultimate goal is to compute a more coarse-grained version of linguistic database.
2 Meta matcher
Meta matcher is designed as a WordNet matcher, i.e., a matcher that is effective in matching WordNet with itself. It utilizes extensible set of element level matchers (see [1] for extensive discussion) and combines their results in hybrid manner, i.e., the fi-nal score is computed from the scores of independently executed matchers.
We implemented three element level matchers. WordNet relation matcher (WNR). WNR takes two senses as an input and obtains
two sets of senses connected to input senses by a given relation. Then these two sets are compared exploiting well-known Dice coefficient formula.
Part of speech context (POSC). POSC matcher exploits part of speech (POS) and sense tagged corpora for similarity computation. In particular, for each WordNet sense occurrence within corpora a set POS tags in the immediate vicinity of sense is memorized. Given multiple occurrence of a sense within corpora each sense is associ-ated with a set of POS contexts. Then, the similarity between two senses is computed as set similarity between sets of POS contexts associated with them.
Inverted sense index inexact (ISII). ISII matcher exploits sense tagged WordNet 3.0 glosses for similarity computation. In particular, for each WordNet sense occur-rence within sense tagged glosses, the synset of a tagged gloss is memorized. Than, senses are compared by comparing sets of synsets associated with them. We compare synsets exploiting well known Resnik similarity measure [6].
Matching process is organized in two steps.
260
2.1 Element level matchers threshold learning
The necessary prerequisite for this step is a training dataset or (a part of) the matching task for which human alignment H is known. All element level matchers then are exe-cuted on the training dataset, i.e., we obtain complete set of correspondences M for all matchers. Then the threshold learning procedure is executed. It performs exhaustive search through all threshold combinations for all element level matchers. Thus, we can select threshold that maximizes a given matching quality metric, e.g., Recall.
In the case of several matchers system result set S is obtained from their results through a combination strategy, namely a function that takes matchers results in input and produces a binary decision of whether the given correspondence holds. In this pa-per we used union of all matchers results as a combination strategy, i.e., if a given correspondence is returned by at least one matcher it is included in S.
2.2 Hybrid matching
On this step meta matcher is executed on testing dataset. Element level matchers results are combined using thresholds and the combination strategy exploited in the previous step. For union combination strategy positive result is produced only if con-fidence score, as computed by element level matchers, is higher than threshold learned on the previous step.
3 Evaluation results
We used a dataset exploited in SemEval1 evaluation. The dataset contains 1108 nouns, 591 verbs, 262 adjectives and 208 adverbs. We split it into two equal parts: training and testing datasets.
We compared results of meta matcher with 3 other sense merging methods. In par-ticular, we re-implemented sense merging algorithm [2], Genclust algorithm [5] and MiMo algorithm [3]. Meta matcher outperforms the other methods in terms of F- Measure.
References
1. F. Giunchiglia and M. Yatskevich. Element level semantic matching. In The Semantic Web: ISWC 2004: Third International Semantic Web Conference: Proceedings, 2004.
2. W. Meng, R. Hemayati, and C. Yu. Semantic-based grouping of search engine results using wordnet. In 9th Asia-Pacific Web Conference (AP-Web/WAIM'07), 2007.
3. R. Mihalcea and D. Moldovan. Automatic generation of a coarse-grained wordnet. In NAACL Workshop on WordNet, 2001.
4. G. Miller. WordNet: An electronic Lexical Database. MIT Press, 1998. 5. W. Peters, I. Peters, and P. Vossen. Automatic sense clustering in eurowordnet. In Proceed-
ings of LREC'1998, 1998. 6. P. Resnik. Semantic similarity in a taxonomy: An information-based measure and its applica-
tion to problems of ambiguity in natural language. Journal of Artificial Intelligence Re-search, 11:95{130, 1999.
1 http://lcl.di.uniroma1.it/coarse-grained-aw/index.html
261

![GENOMA: GENeric Ontology Matching Architectureart.uniroma2.it/publications/docs/2015_AIxIA_GENOMA.pdf2.3 iMAP iMap [6] can be considered as an atypical Ontology Matching tools, since](https://img.dokumen.tips/doc/110x75/5ea2dd867151e42ac07ebdc2/genoma-generic-ontology-matching-23-imap-imap-6-can-be-considered-as-an-atypical.jpg)