Embed Size (px)
Citation preview
Page 65
Bell miner Associated Dieback National Forum 2005
Session 7
Adaptive Management in Practice - Dr Bernard T Bormann, USDA Forest Service
Designing Management Options

Session 7 - Designing Management Options - Adaptive Management in Practice - Dr Bernard T Bormann
Bell miner Associated Dieback National Forum 2005
Page 66
Slide 1
Session 7 - Designing Management Options - Adaptive Management in Practice - Dr Bernard T Bormann
Bell miner Associated Dieback National Forum 2005
Page 67
Slide 2Learning DesignQuestions for the management study:
Can late-successional habitat be restored and protected from high-severity fire by managing in more than one way in the Reserves (not designated as roadless) burned in the Biscuit Fire?
How fast will various management pathways, and their interactions with natural disturbances, achieve late-succession conditions?
Pathway debate:Group 1 --- Need to intensively salvage and regenerate conifers.Group 2 --- No need for salvage.Group 3 --- Need to re-institute indian burning patterns.
Pathway decisions:Pathway A. Group-1 like: maximum salvage; no fuels-
management zones around the perimeters
Pathway B. Group-2 like: promote natural recovery processes & add 200-ft fuels-management zones
Pathway C. Group-3 like: reestablish landscape-scale, low-intensity fire & 400-ft fuels-management zones
•
•
•••
Slide 3Selecting experimental unitsSize of areas applying 1 pathway
(experimental unit) were based on: A minimal area for operationsAccess logistics (road layout)Encompassing the patterns of the fire
Conclusions: Need 3 to 4 townships to have reasonable chance of encompassing full range of fire intensities (3000 to 4000 ha);Could mainly use watershed boundaries because most roads are on ridgetops;
•••
•
•
Session 7 - Designing Management Options - Adaptive Management in Practice - Dr Bernard T Bormann
Bell miner Associated Dieback National Forum 2005
Page 68
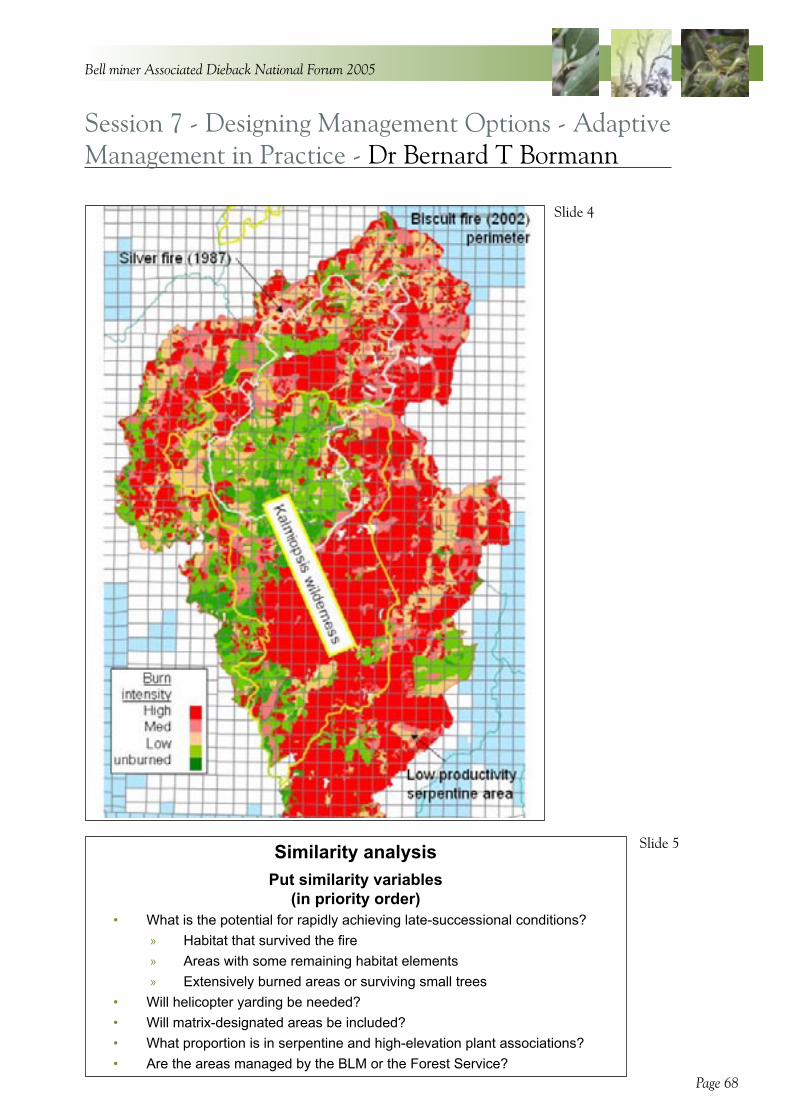
Slide 5Similarity analysisPut similarity variables
(in priority order)What is the potential for rapidly achieving late-successional conditions?
Habitat that survived the fireAreas with some remaining habitat elementsExtensively burned areas or surviving small trees
Will helicopter yarding be needed? Will matrix-designated areas be included? What proportion is in serpentine and high-elevation plant associations? Are the areas managed by the BLM or the Forest Service?
•»
»
»
••••
Slide 4

Session 7 - Designing Management Options - Adaptive Management in Practice - Dr Bernard T Bormann
Bell miner Associated Dieback National Forum 2005
Page 69
Slide 6

Session 7 - Designing Management Options - Adaptive Management in Practice - Dr Bernard T Bormann
Bell miner Associated Dieback National Forum 2005
Page 70
Slide 7

Session 7 - Designing Management Options - Adaptive Management in Practice - Dr Bernard T Bormann
Bell miner Associated Dieback National Forum 2005
Page 71
Slide 8Table 2. Primary variables to compare pathway outcomes Goal Primary variables Units Approach
Restore habitat in late-successional stands
Conifer stocking Trees acre-1 Permanent stand-exam plots extrapolated to units with remote sensing (photo interp.)
Conifer 100-yr growth
Site index, G&Y models#s & vol. acre-1
Snags and logs #s & vol. acre-1 Brown transect linesUnderstory diversity Species cover Ecology-plot methods
Protect late-successional stands from high-severity fire
Dead fuel amounts and distribution
Volume acre-1 layer-1
Permanent Brown transects extrapolated to units with remote sensing (photo interp.)
Live fuels amounts and distribution
Biomass acre-1 layer-1 by species
Permanent stand-exam plots extrapolated to units with remote sensing (photo interp.)
Undesired ignitions controlled
#s Fire response records
Wildfire behavior entering units
Acres day-1 Infra-red, satellite, images
Manage land-scapes to approach historical late-succession pattern and extent
Pattern-generating management and natural disturbances
Patterns, patch sizes and distributions
Mapping changes in tree mortality from fire, insects, diseases, wind, landslides, etc.
Distribution of various late-successional habitat inocula
Acres, distances, frequencies
Spatial statistics
Implement pathways according to study plan
Salvage volumes by closure class, planting, and fuels treatments
Acres, volumes Standard implementation monitoring
Session 7 - Designing Management Options - Adaptive Management in Practice - Dr Bernard T Bormann
Bell miner Associated Dieback National Forum 2005
Page 72
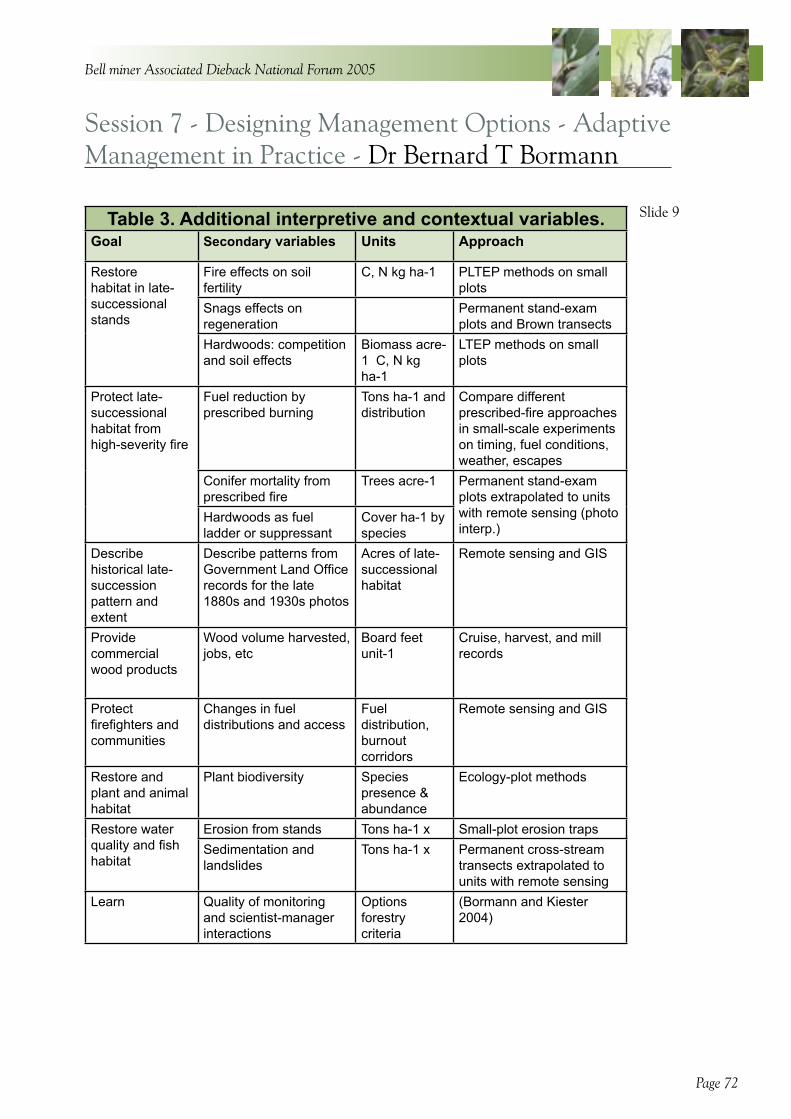
Table 3. Additional interpretive and contextual variables. Goal Secondary variables Units Approach
Restore habitat in late-successional stands
Fire effects on soil fertility
C, N kg ha-1 PLTEP methods on small plots
Snags effects on regeneration
Permanent stand-exam plots and Brown transects
Hardwoods: competition and soil effects
Biomass acre-1 C, N kg ha-1
LTEP methods on small plots
Protect late-successional habitat from high-severity fire
Fuel reduction by prescribed burning
Tons ha-1 and distribution
Compare different prescribed-fire approaches in small-scale experiments on timing, fuel conditions, weather, escapes
Conifer mortality from prescribed fire
Trees acre-1 Permanent stand-exam plots extrapolated to units with remote sensing (photo interp.)
Hardwoods as fuel ladder or suppressant
Cover ha-1 by species
Describe historical late-succession pattern and extent
Describe patterns from Government Land Office records for the late 1880s and 1930s photos
Acres of late-successional habitat
Remote sensing and GIS
Provide commercial wood products
Wood volume harvested, jobs, etc
Board feet unit-1
Cruise, harvest, and mill records
Protect firefighters and communities
Changes in fuel distributions and access
Fuel distribution, burnout corridors
Remote sensing and GIS
Restore and plant and animal habitat
Plant biodiversity Species presence & abundance
Ecology-plot methods
Restore water quality and fish habitat
Erosion from stands Tons ha-1 x Small-plot erosion trapsSedimentation and landslides
Tons ha-1 x Permanent cross-stream transects extrapolated to units with remote sensing
Learn Quality of monitoring and scientist-manager interactions
Options forestry criteria
(Bormann and Kiester 2004)
Slide 9

Session 7 - Designing Management Options - Adaptive Management in Practice - Dr Bernard T Bormann
Bell miner Associated Dieback National Forum 2005
Page 73
Monitoring plan (1 of 3) Focus 1. Commitment of the
Siskiyou National Foresta 2. Potential Forest commitment, given additional funding
Understanding the Biscuit Fire’s behavior and effects
Make all historical and current data available to researchers and others. This includes georectified post-fire photos, management records, and plot data.
Digitize all historical air photos and Government Land Office records and make into GIS layers.
Restoring habitat - trees and stand structure
Monitor species, growth trajectory of dominant trees, and stand structure with standard exams. Use permanent plotsc monitored at years 0, 1, and 3 years after the pathways are established and remote sensing to draw inferences on unit responses.
Extend the sampling to years 5 and 10, and every 10 years thereafter; expand the sample size of permanent plots to speed the detection of differences between pathways.
Restoring habitat - snags and woody debris
Monitor size and numbers per acre of burned and insect-created snags and logs with standard exams and remote sensing.
Monitor effect of shade from snags on planted and natural tree seedlings.
Restoring habitat - landscape patterns
Track changes in amount and distribution of “patches,” including seral stages, interior habitat, structure, canopy density, and layering from air-photo interpretations (LSRA 1995).
a Includes the Medford BLM as well.b Includes synthesis of ongoing federally sponsored research on the Forest ecology
and inventory plots and the long-term ecosystem productivity experiment, with new analyses of available data.
cSee text for description of permanent plots.
Slide 10
Session 7 - Designing Management Options - Adaptive Management in Practice - Dr Bernard T Bormann
Bell miner Associated Dieback National Forum 2005
Page 74
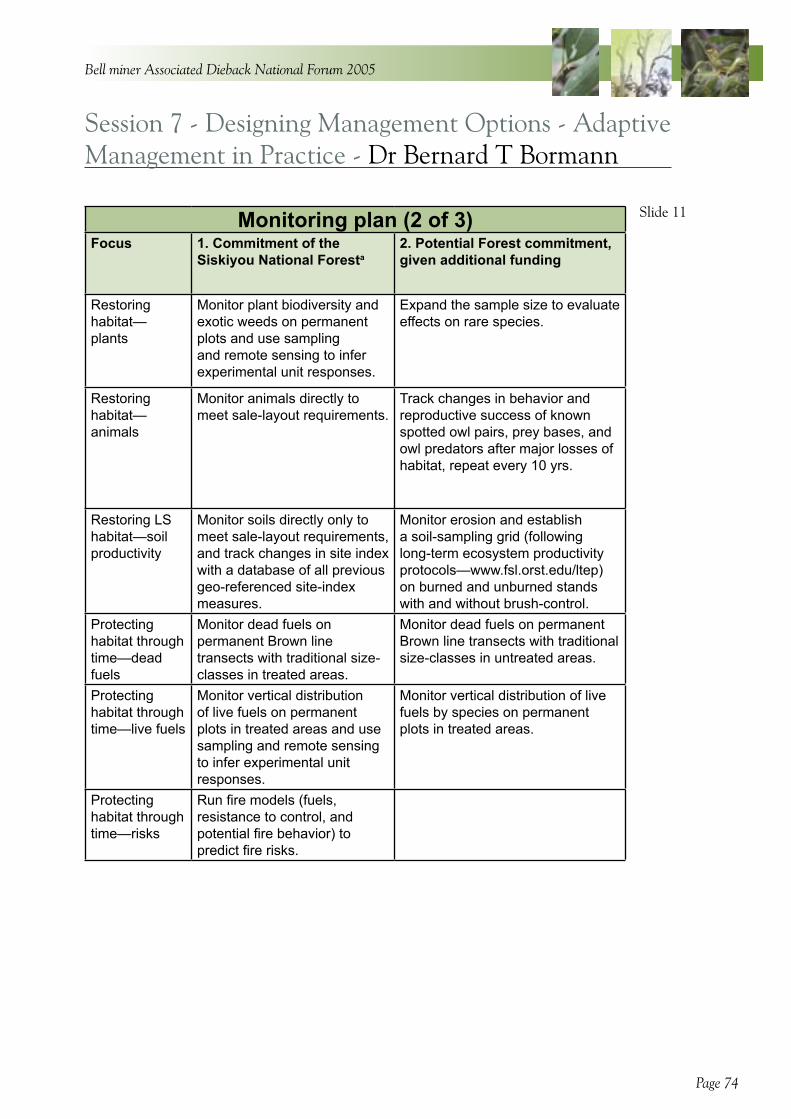
Slide 11Monitoring plan (2 of 3) Focus 1. Commitment of the
Siskiyou National Foresta 2. Potential Forest commitment, given additional funding
Restoring habitat— plants
Monitor plant biodiversity and exotic weeds on permanent plots and use sampling and remote sensing to infer experimental unit responses.
Expand the sample size to evaluate effects on rare species.
Restoring habitat— animals
Monitor animals directly to meet sale-layout requirements.
Track changes in behavior and reproductive success of known spotted owl pairs, prey bases, and owl predators after major losses of habitat, repeat every 10 yrs.
Restoring LS habitat—soil productivity
Monitor soils directly only to meet sale-layout requirements, and track changes in site index with a database of all previous geo-referenced site-index measures.
Monitor erosion and establish a soil-sampling grid (following long-term ecosystem productivity protocols—www.fsl.orst.edu/ltep) on burned and unburned stands with and without brush-control.
Protecting habitat through time—dead fuels
Monitor dead fuels on permanent Brown line transects with traditional size-classes in treated areas.
Monitor dead fuels on permanent Brown line transects with traditional size-classes in untreated areas.
Protecting habitat through time—live fuels
Monitor vertical distribution of live fuels on permanent plots in treated areas and use sampling and remote sensing to infer experimental unit responses.
Monitor vertical distribution of live fuels by species on permanent plots in treated areas.
Protecting habitat through time—risks
Run fire models (fuels, resistance to control, and potential fire behavior) to predict fire risks.
Session 7 - Designing Management Options - Adaptive Management in Practice - Dr Bernard T Bormann
Bell miner Associated Dieback National Forum 2005
Page 75
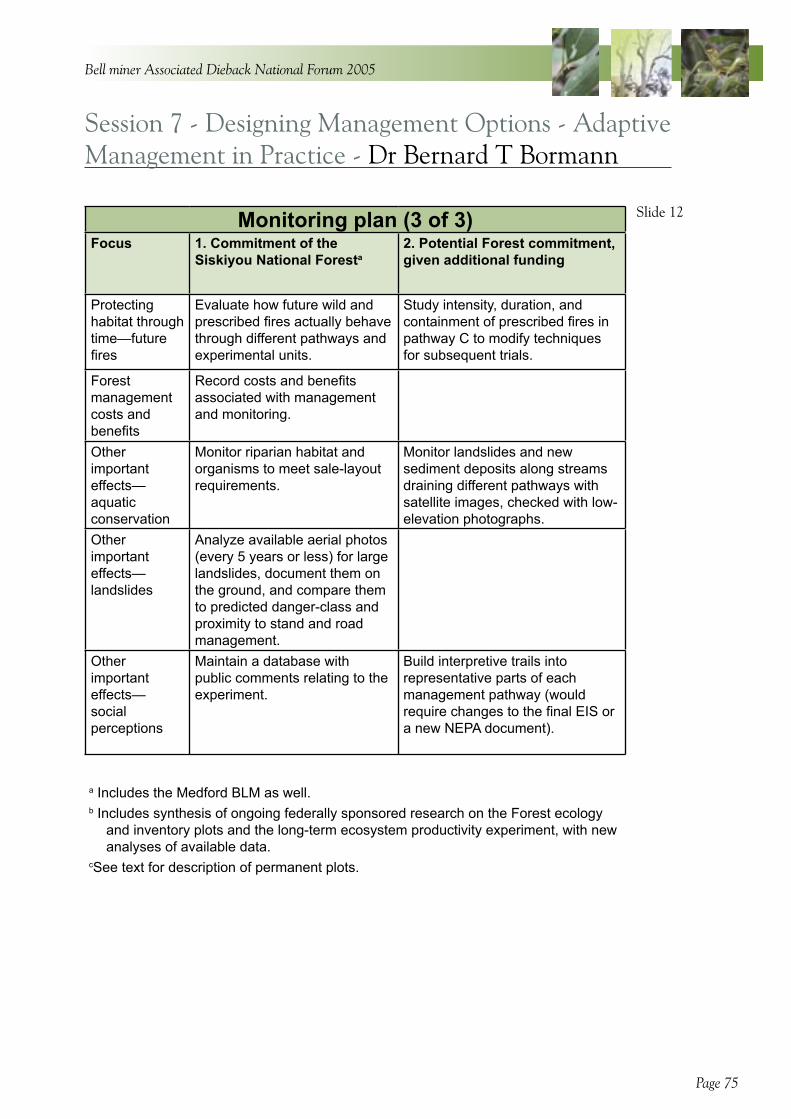
Slide 12Monitoring plan (3 of 3) Focus 1. Commitment of the
Siskiyou National Foresta 2. Potential Forest commitment, given additional funding
Protecting habitat through time—future fires
Evaluate how future wild and prescribed fires actually behave through different pathways and experimental units.
Study intensity, duration, and containment of prescribed fires in pathway C to modify techniques for subsequent trials.
Forest management costs and benefits
Record costs and benefits associated with management and monitoring.
Other important effects— aquatic conservation
Monitor riparian habitat and organisms to meet sale-layout requirements.
Monitor landslides and new sediment deposits along streams draining different pathways with satellite images, checked with low-elevation photographs.
Other important effects— landslides
Analyze available aerial photos (every 5 years or less) for large landslides, document them on the ground, and compare them to predicted danger-class and proximity to stand and road management.
Other important effects— social perceptions
Maintain a database with public comments relating to the experiment.
Build interpretive trails into representative parts of each management pathway (would require changes to the final EIS or a new NEPA document).
a Includes the Medford BLM as well.b Includes synthesis of ongoing federally sponsored research on the Forest ecology
and inventory plots and the long-term ecosystem productivity experiment, with new analyses of available data.
cSee text for description of permanent plots.

Session 7 - Designing Management Options - Adaptive Management in Practice - Dr Bernard T Bormann
Bell miner Associated Dieback National Forum 2005
Page 76
Table 6. Timeline for Forest commitments (federal agencies cannot budget beyond current year)
Activity 2004 2005 2006 2007 2008 2009 2010
Conduct surveys as required for timber sales
XX
Layout sales to meet study design
XX
Publish the hypothesis database on a web page, detailing various assumptions in table 3 and model projections, and invite alternative hypotheses.
XX
Establish permanent stand exams and transects
XX
Redo late-successional reserve assessment on units
XX
Take pre-treatment ground measures
XX
Take post-treatment measures (10 yr thereafter)
XX XX
Monitor activities and costs specific to pathways
XX XX XX XX XX XX XX
Develop and test remote-sensing techniques
XX XX XX XX
Track all ignitions and fire spread in and near units
XX XX XX XX XX XX XX
Monitor fire intensity in prescribed fires
XX XX XX XX XX XX
Slide 13
Session 7 - Designing Management Options - Adaptive Management in Practice - Dr Bernard T Bormann
Bell miner Associated Dieback National Forum 2005
Page 77
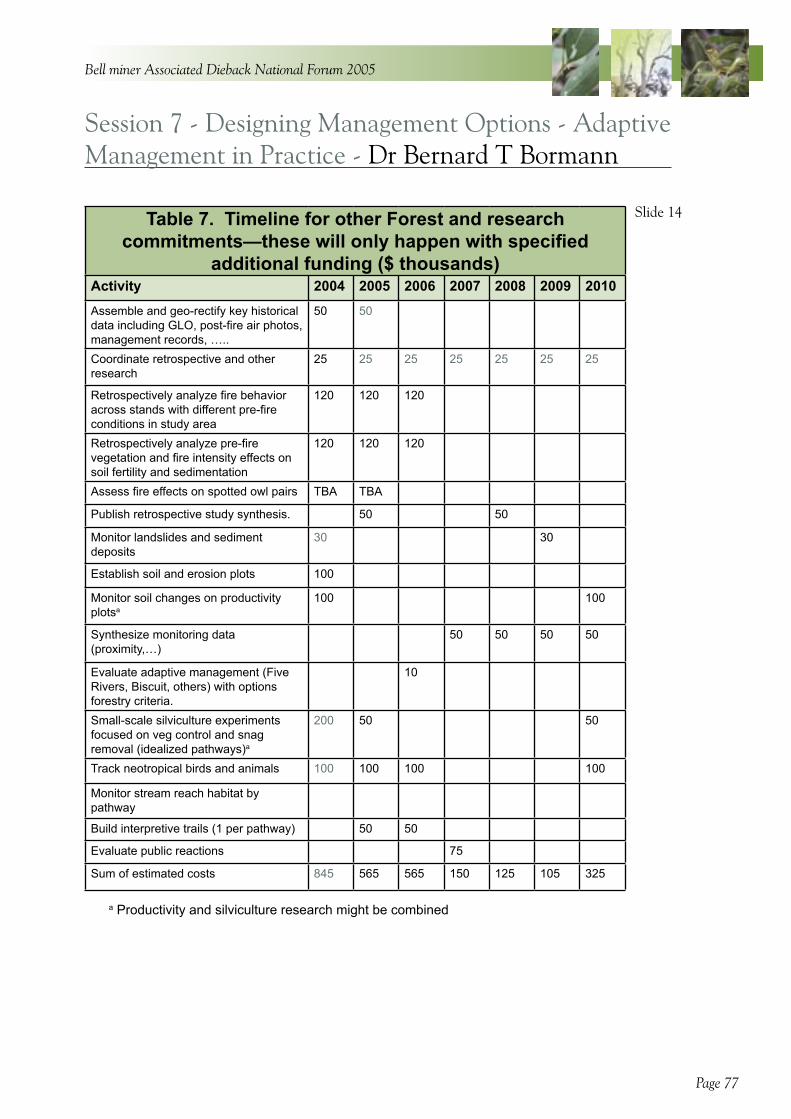
Slide 14Table 7. Timeline for other Forest and research commitments—these will only happen with specified
additional funding ($ thousands)Activity 2004 2005 2006 2007 2008 2009 2010
Assemble and geo-rectify key historical data including GLO, post-fire air photos, management records, …..
50 50
Coordinate retrospective and other research
25 25 25 25 25 25 25
Retrospectively analyze fire behavior across stands with different pre-fire conditions in study area
120 120 120
Retrospectively analyze pre-fire vegetation and fire intensity effects on soil fertility and sedimentation
120 120 120
Assess fire effects on spotted owl pairs TBA TBA
Publish retrospective study synthesis. 50 50
Monitor landslides and sediment deposits
30 30
Establish soil and erosion plots 100
Monitor soil changes on productivity plotsa
100 100
Synthesize monitoring data (proximity,…)
50 50 50 50
Evaluate adaptive management (Five Rivers, Biscuit, others) with options forestry criteria.
10
Small-scale silviculture experiments focused on veg control and snag removal (idealized pathways)a
200 50 50
Track neotropical birds and animals 100 100 100 100
Monitor stream reach habitat by pathway
Build interpretive trails (1 per pathway) 50 50
Evaluate public reactions 75
Sum of estimated costs 845 565 565 150 125 105 325
a Productivity and silviculture research might be combined