Embed Size (px)
Citation preview

Aquaculture
Proceedings of the 1997
North Central RegionalAquaculture Conference
February 6-7Indianapolis, Indiana
Sponsored by:
Illinois-Indiana Sea Grant ProgramIndiana Aquaculture Association
Illinois Aquaculture Industry AssociationNorth Central Regional Aquaculture Center
Edited byLaDon Swann
Illinois-Indiana Sea Grant Program
Sponsored by:
Illinois-Indiana Sea Grant ProgramIndiana Aquaculture Association
Illinois Aquaculture Industry AssociationNorth Central Regional Aquaculture Center
Edited byLaDon Swann
Illinois-Indiana Sea Grant Program
CES-305

This publication can be found on the World Wide Web.
If you would like to order additional copies of this proceedings send acheck for $25.00 payable to Purdue University to:
phone: 317-494-6264electronic mail: [email protected]
http://www/ansc.purdue.edu/aquanic/publicat/other_pubs/ces305.htm
Aquaculture Extension SpecialistIllinois-Indiana Sea Grant ProgramPurdue University1026 Poultry BuildingWest Lafayette, IN 47907-1026
IL-IN-SG-97-5
Issued in furtherance of Cooperative Extension Work,Acts of May 8 and June 30, 1914, in cooperation with the U.S. Department ofAgriculture, Cooperative Extension Service, University of Illinois at Urbana-
Champaign and Purdue Universtiy, West Lafayette, IN.
Purdue University and the Universtiy of Illinois are equalaccess/equal opportunity institutions.


Welcome.doc
WELCOME
LaDon SwannIllinois-Indiana Sea Grant Program
Purdue University1026 Poultry Building
West Lafayette, IN 47907-1026
Good morning and welcome to the North Central Regional Aquaculture Conference. Ithank the Illinois-Indiana Sea Grant Program, the Indiana Aquaculture Association, the IllinoisAquaculture Industry Association, the North Central Regional Aquaculture Center and theCooperative Extension Services at Purdue University and the University of Illinois forsponsoring this conference. Without their support none of the learning opportunities duringthe next two days would be possible. The proceedings provided to you is an outstandingresource for your use during and after the conference. The fact that you have the proceedingstoday is a tribute to every speaker on the agenda. It is rare to find presenters who agree tosubmit papers prior to the program. Our speakers deserve a heartfelt thanks for all the workthey did prior to today.
As president of the Indiana Aquaculture Association (IAA) and board member of theIllinois Aquaculture Industry Association (IAIA), I feel compelled to encourage you to joineither association. However, if you are a visitor from another state and are not involved inyour state association then you are missing similar learning opportunities. State aquacultureassociations are the pulse of each state’s aquaculture industry. Most state associations aremembers of the National Aquaculture Association (NAA) and therefore have a voice in thedevelopment of national initiatives. We all have to join together to develop an expandedaquaculture industry and there is no better way of accomplishing a common goal thanthrough participation in an association. Besides participating in association sponsoredprofessional development opportunities such as today’s, I have found members of the IAAand IAIA to be some of the kindest and most genuine people I have every had the privilege tomeet.
I also want to thank everyone involved with the planning this conference. You can seefrom the agenda the diversity of topics to be discussed. The goal of this conference is toprovide you with some of the most current research findings and production practices found inthe Midwest. Long-term success depends on profitability of a farm. Much of the informationwe will present deals with ways to increase farm profits. Only your level of increase willdictate how much you can learn during the next two days. Therefore, do not be afraid to askquestions of the speakers when you do not understand a topic being discussed. Finally, I thinkmost of us who attend professional development programs, have found that a great deal oflearning occurs in the halls, over meals or through some other form of networking. Enjoyyourself and I look forward to working with you during the next two days.
AQUATIC PLANT MANAGEMENT
Carole A. Lembi, Aquatic Weed SpecialistPurdue University
Cooperative Extension ServiceWest Lafayette, In 47907
Aquatic plants are natural and important components of the aquatic environment.Microscopic plants (algae) form the base of the aquatic food chain. Larger algae and plantsprovide habitat and shelter for fish, waterfowl, and other wildlife; and all plants produceoxygen as they photosynthesize during the daylight hours. Because of these benefits, someaquatic plant growth in a body of water is desirable. However, excessive growths of aquaticplants can have detrimental effects on a body of water, its inhabitants, and its users. Some ofthe problems caused by excessive aquatic plant growth are as follows:
1. Recreational activities such as swimming, fishing, and boating can be impaired and evenprevented.
2. Excessive growths can lead to fish stunting and overpopulation. This occurs because theproduction of too much habitat prevents effective predation of small fish by larger fish.
3. Aquatic plant growths can play a role in causing fish kills. This usually occurs becauseoxygen is taken out of the water. During the day, plants produce oxygen throughphotosynthesis; at night (as well as day), they consume oxygen through respiration. Ifplant growth is excessive, plants at night can use up most of the oxygen in the water. Infact, fish that are stressed for oxygen often die just before dawn when the oxygen contentis lowest. Oxygen depletion also occurs when plants die and decompose. When plants die,photosynthetic production of oxygen ceases, and the bacteria, which break down thedecaying plant material, use oxygen in their own respiration. Fish kills in summer aresometimes caused by die-offs of algae blooms. Stress due to prolonged periods of lowoxygen content (e.g., after a period of cloudy, warm days) may lead to greater fishsusceptibility to diseases and toxicants. Fish kills in winter occur when snow accumulateson ice cover. Light is blocked thus preventing photosynthesis by any living plants or algae.Decomposition of plants that died in the fall causes further oxygen depletion. Other causesof fish kills include insecticide runoff, ammonia runoff from feedlots or leakage fromstorage tanks, and diseases.
4. Aquatic weed growth provides quiet water areas ideal for mosquito breeding. Certainalgae can impart foul tastes and odors to the water.
5. Weeds impede water flow in drainage ditches, irrigation canals, and culverts and causewater to back up.
6. Deposition of weeds, as well as sediment and debris, can cause the gradual filling in ofbodies of water.
7. Excessive weed growth can lower property values and decrease aesthetic appeal of a bodyof water.
The goal for a person managing a body of water is to achieve a balance: somevegetation is desirable and can in fact add interest and appeal. A sterile, swimming pool effectfor a natural body of water should be avoided. How do we achieve this balance? We attempt
to do it by careful use of one or several management methods. These are preventive,mechanical, biological, habitat alteration, and chemical methods.
Preventive Control Methods
Many aquatic weeds or their seeds are carried into a body of water by wind, birds, fishintroduction, fishermen, etc. These weeds become infestations only if the water conditions arejust right. This usually means that the body of water is shallow or has shallow areas with goodlight penetration, and has an available source of nutrients (nitrogen and phosphorus), either inthe water or stored in the sediment. Often nutrients enter a body of water from runoff orstream flow. To help prevent serious weed infestations you can do the following things:
1. Do not fertilize your pond or lake. Most Midwestern waters are sufficiently rich inplankton and other food organisms to support large fish without being fertilized.
2. Maintain a good sod and grass cover around the body of water. This will help preventrunoff and erosion. Lawn fertilizers should not be applied any closer than 10-20 feet fromthe shoreline.
3. Do not allow livestock access to a pond except under conditions of extreme heat stress. Ifthe water is used for livestock, fence the pond. Water the animals from a stock tank belowand outside the fence. Animals in the water will increase turbidity and fertility and teardown the banks.
4. Check septic tanks for possible leakage or seepage into the water. New septic drainagefields should be directed away from the body of water.
5. Do not permit runoff from chicken coops, feedlots, etc. to enter the body of water. If thiskind of runoff is occurring upstream from your water site, you should check with yourcounty board of health to see if anything can be done about it.
6. Do not spread aquatic vegetation yourself. Remove vegetation from boat trailers, boatwells, and bait boxes before you move to another body of water.
All of these measures will help prevent weed growth, particularly in a newly constructed bodyof water. In older bodies these measures will probably aid in gradually reducing infestations offree-floating plants such as algae and duckweed.
Mechanical Control Methods
Even with preventive measures, many bodies of water still have severe plantinfestations. Hand-pulling or raking plants is a possible method of control. Since most aquaticplants are perennial with underground portions that can resprout new shoots, it is essentialthat below-ground growth also be harvested. In the case of larger plants such as cattails, thisis difficult to do. Hand held devices for pulling plants in small areas are available.
For larger bodies of water, motor-driven underwater weed harvesters are available.This equipment is usually a major investment and may have to be operated several timesduring the season to effectively keep the vegetation cut back. The premise is the same asmowing a lawn; the weeds will not be eliminated, but they can be prevented from becoming anuisance. The cut vegetation should be harvested and dumped where it cannot reenter thewater. Plant fragments, even less than an inch long, left to float in the water can produce a

new plant. The harvested material can be satisfactorily used as a fertilizer or mulch in gardensor as land fill.
For more information on weed harvesting equipment, write to the following companies(these are only a few of several companies; their listing does not imply an endorsement of theirproducts):
United Marine International, Inc.1436 West River RoadPO Box 750Waterloo, NY 13165Phone 315-539-5665 FAX 315-539-5667
Aquarius Systems220 N. HarrisonPO Box 215North Prairie, WI 53153Phone 414-392-2162
Hockney Company913 Cogswell DriveSilver Lake, WI 53170Phone 414-889-4581
Biological Control Methods
Biological controls (organisms that control pest organisms) have received considerablepublicity. Certain bacteria, fungi, and insects are currently being tested for their ability toreduce aquatic plant infestations. Waterfowl such as swans can keep small ponds weed-free,but they require some husbandry and protection from predators.The most widely used biological control agent to date is a herbivorous fish, the grass carp(also known as the white amur). The grass carp is native to China and Russia. It can live 15-20 years. This fish consumes most filamentous algae, submersed and free-floating vegetation.Since it has the potential to denude a body of water of its vegetation, it must not be releasedin natural lakes and wetland areas where vegetation is critical to wildlife. The landsurrounding the pond or lake must be totally in private ownership and all precautions shouldbe taken to prevent escape of the fish from the stocked area. Barriers should be erected at thespillway or outflows. Where vegetation has been removed, game fish habitat may have to bereplaced with artificial structures such as dead trees or rubber tires.The only form of the grass carp that is legal in Indiana is the triploid grass carp, a form thatwill not reproduce itself. Fish must be purchased from a holder of an Indiana AquaculturePermit. The permit holder must deliver and stock the fish and present the purchaser with a billof sale and copy of triploid certification. It is the responsibility of the purchaser to retain thesedocuments for at least two years.The recommended stocking rates are 15 or 30 fish per acre. Fish should be 8-12 inches long.Smaller fish will be rapidly removed by predators such as bass. The lower stocking rate isrecommended for most ponds so that some vegetation remains. Where total vegetation

control is desired, the higher stocking rate can be used. Vegetation control may not beobserved for a year or more; after about five years, the grass carp slows its feeding rate, sothat more fish may be needed to maintain adequate vegetation control.
For more information on using the grass carp and a list of distributors, contact yourdistrict fisheries biologist or contact the Fisheries Section, Division of Fish and Wildlife,402 W. Washington St., Room W273, Indianapolis, IN 46204.
Habitat Alteration Methods
Certain methods of manipulating or altering the aquatic environment can be effectivein aquatic plant management. One of the more successful methods is the drawdown techniquein which water levels are lowered over the winter. Exposure of the sediments in the shallowareas of a lake or pond to alternate freezing and thawing action will kill the undergroundstructures of many aquatic plants. This method has been successful for the control of Eurasianwatermilfoil and waterlilies, although the degree of control depends somewhat on the severityof the winter.
Other types of habitat manipulation include riprapping shorelines or anchoring blackplastic sheeting on the bottom sediments to prevent rooted plant growth. Dyes such asAquashadow® are used to inhibit light penetration throughout the water. This blue dye can beapplied right out of the bottle along the shoreline. It mixes throughout the body of waterwithin 24 hours. The dye intercepts light normally used for photosynthesis by underwaterplants. The dye can only be effective if its concentration is maintained. Some general rules forusing Aquashadow® or other registered dye products are as follows:
1. Do not apply where water outflow will reduce the dye concentration.2. Apply in March or April before plants reach the water surface. Midsummer reapplication
is usually necessary. Dyes are effective only on rooted underwater plants growing atdepths greater than 2 to 3 feet. Supplemental treatments of copper sulfate might be neededfor algae control.
3. Do not use in muddy water.
Aeration has been publicized as another method of weed control. Although aeration isdefinitely beneficial for fish life and can help prevent fish kills, there is no evidence thataeration inhibits weed growth.
Chemical Control Methods
When properly applied, certain herbicides can control aquatic vegetation withoutharming the fish and other wildlife. In some instances, herbicides can be used selectively, thatis, to control certain plant species without killing others. Aquatic herbicides can also fit into anaquatic plant management plan where some areas are treated and others are left withvegetation. They can be particularly effective for controlling certain aggressive weed speciessuch as Eurasian watermilfoil. Aquatic herbicides offer temporary solutions. None of theproducts listed here, when properly used, will eliminate plants from a body of water. Plants

will reappear, and retreatment or application of another control method will usually benecessary.
All of the herbicides discussed in this publication are registered with the federalEnvironmental Protection Agency (EPA) and, when used in water as directed, generally poseno significant threat to the environment or to public health. Most herbicides, however, ARETOXIC IF TAKEN INTERNALLY; and direct contact with the chemical should be avoided.Protective clothing, gloves, and a face mask or respirator should be worn during mixing andapplication. If herbicide comes in contact with the skin, it should be washed off immediatelywith water. If herbicide is accidentally swallowed, go to a physician immediately and consultthe container label for first aid information. Because these chemicals are toxins and requirespecial precautions, the remainder of this paper is devoted to the proper use of aquaticherbicides.
What You Need to Know Before Using a Chemical
Before buying and applying a herbicide it is essential that you READ THE LABEL todetermine whether the product will meet your needs. Important considerations in choosing aherbicide include:
1. Identity of the weed. This can save you a lot of money because certain chemicals willwork only on certain weeds and not on others. Identification help can be obtained fromyour county Cooperative Extension Service or a fisheries biologist. Always transport theplant in a plastic bag without extra water.
2. Restrictions on use of water treated with herbicides. Although most aquatic herbicidesbreak down readily and rapidly in water and pose no threat to human or animal health,there are waiting periods on the use of water treated with most herbicides. Theserestrictions—usually on fishing, swimming, domestic use, livestock watering orirrigation—dictate which herbicides will be appropriate for your lake or pond. Alwayscheck the herbicide label for possible restrictions.
3. Dosage. Calculate carefully and don’t overdo it. Some aquatic herbicide labels givedosages on the basis of acre-feet (a volume measurement). Acre-feet is calculated bymultiplying the surface area by the average depth. For example, a pond with a surface areaof 1/2 acre and an average depth of 4 feet contains (4 feet X 1/2 acre) 2 acre-feet. Theherbicide label can then be consulted for the amount of chemical to apply per acre-foot.
4. Timing. Late spring is usually the best time to apply aquatic herbicides. The plants areyoung and actively growing and most susceptible to herbicides. Do not wait until July orAugust! If you wait until late summer to treat, you are running a serious risk of killingfish. By that time, the vegetation is usually extensive and thick. Also the water is warmand still. Killing all vegetation at once under these conditions could seriously deplete thewater of its oxygen and cause a fish kill. If you must treat this late in the summer, treatonly a portion of the weed growth at a time.
5. Temperature. Aquatic plants are not affected by herbicides when the water is too cold.The water temperature should be in the 60’s, preferably the upper 60’s (in the area to betreated). These temperatures usually occur from late April to early June. This means thatas soon as the plants are up and actively growing, and if the water temperature is right, theherbicide should be applied.

6. Retreatment. More than one treatment (e.g., copper sulfate on algae) may be required foradequate control. Retreatment is usually required in succeeding years. Plants canregenerate each spring from seeds, spores, and underground structures. Seeds andunderground structures generally are not affected by most aquatic herbicides. Exceptionsinclude Rodeo and 2,4-D which translocate into underground structures and kill them.However, new plants can sprout from seed.
Aquatic Weed Identification Guide
Aquatic plants can be divided into two botanical groups: algae and flowering plants.Algae are usually very simple in structure, but some (for example, Chara) can resembleflowering plants. For effective chemical control, it is essential that you distinguish betweenalgae and flowering plants.
AlgaeMicroscopic algae form scums and/or color the water green or yellow-green.
Sometimes they can cause red, black, or oily streaks in the water. When in sufficient numbersto color the water they are called “blooms”. Die-off of these algae can cause fish kills. Bloomsusually occur where abundant nutrients (e.g., fertilizers) are reaching the water. They shouldbe treated with chemicals before they cause a noticeable color. They are not consumed bygrass carp.
Filamentous algae (also known as moss) form floating, mat-like growths which usuallybegin around the edges and bottoms of bodies of water in the spring. This type of growth isprobably the most common in lakes and ponds in the Midwest. Repeated chemical treatmentsduring the summer season are often necessary for effective control. Although grass carp willgenerally eat submersed rooted plants first, they may eventually begin consuming filamentousalgae.
Chara or stonewort usually grows in very hard water and is often calcified and brittle.The plant is rooted, and leaves are arranged along the stem in whorls. The plant is completelyunderwater and has a musky smell. In some bodies of water where it is low-growing, it canprovide valuable habitat for fish. It can, however, grow up to the surface and be troublesome.

CharaChara can be difficult to control once it has become established and has aheavy coating of calcium carbonate. Use copper compounds when theplants are still young and not heavily calcified. Although this plantresembles some flowering plants, it is an alga.
Flowering Plants
Flowering plants can be grouped into broad categories according to where they arefound in a body of water.
Submersed plants are rooted in the bottom sediments and grow up through the water.Flowers or flowering spikes sometimes emerge above the water surface. Some of thepondweeds, such as American pondweed, have both underwater leaves and leaves that floatabove the water surface. The main criteria for identification are leaf arrangement and leafshape. The plants shown here are some of the most common underwater plants with weedycharacteristics. However, within almost each group there are species that have value for fishand/or wildfowl habitat. For example, curly-leaf pondweed is considered a weed but beds oflarge-leaf pondweed can provide good shelter for game fish. Eurasian watermifoil is a veryaggressive, introduced weed, but other milfoil species are native and have less potential as

weeds. Information beyond what this bulletin can provide is necessary for complete aquaticplant identification.
Curly-leaf pondweed
Alternate leaf arrangement (one leaf per node). Grows best in thespring and tends to die out in the summer. Common in ponds,lakes, and ditches.
Leafy pondweedVery narrow leaves; alternate leaf arrangement. More commonin ponds than in large lakes.
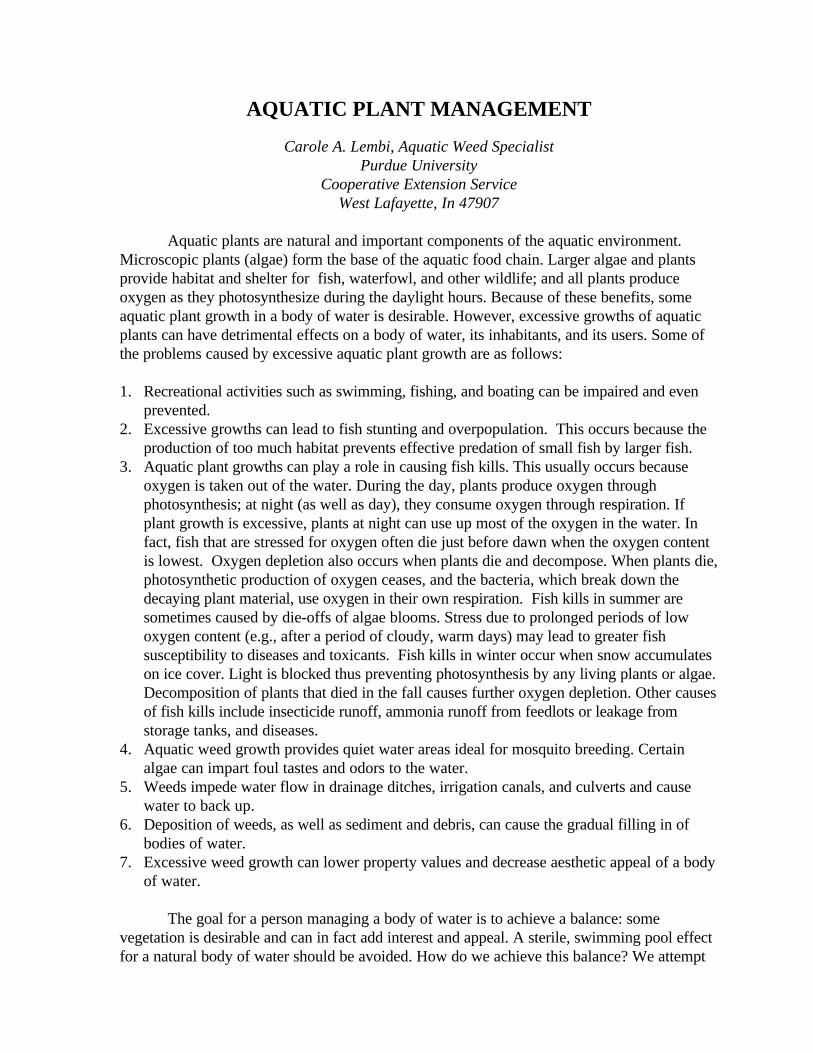
Sago pondweed
Leaves are almost thread-like. Individual leaves tend to beslightly curved. Although a weed in some situations, can bevaluable as a food plant for waterfowl.
American pondweed
Leaves that float on top of the water surface are about 1 to 4inches long. Usually restricted to shallow water
.
Brittle naiad
Opposite (two leaves per node) leaf arrangement; sometimesthree leaves appear at a node. Leaves slightly spined. Morecommon in southern portions of Indiana.

Southern naiadOpposite leaf arrangement; sometimes appearing asthree leaves per node. Very common in lakes and pondsthroughout Indiana.
American elodea
Three leaves at a node. Very common in lakes andponds throughout Indiana.
Coontail
Whorled leaf arrangement (more than two leaves at a node);leaves branched and spined. Very common in lakes and pondsthroughout Indiana.

Eurasian watermilfoil
Feather-like leaf; usually four leaves at a node. A serious andrapidly spreading invader. Found in lakes and pondsthroughout Indiana.
Free-floating plants such as duckweed and watermeal can completely cover the surface of apond. These plants are extremely small. Duckweed is no more than 1/4 to 1/2 inch in diameterand watermeal is even smaller. Both plants are found in nutrient-rich waters; therefore, theinput of waste water from feedlots, septic fields, etc. should be eliminated for effectivecontrol. These plants are very difficult to control with chemicals.
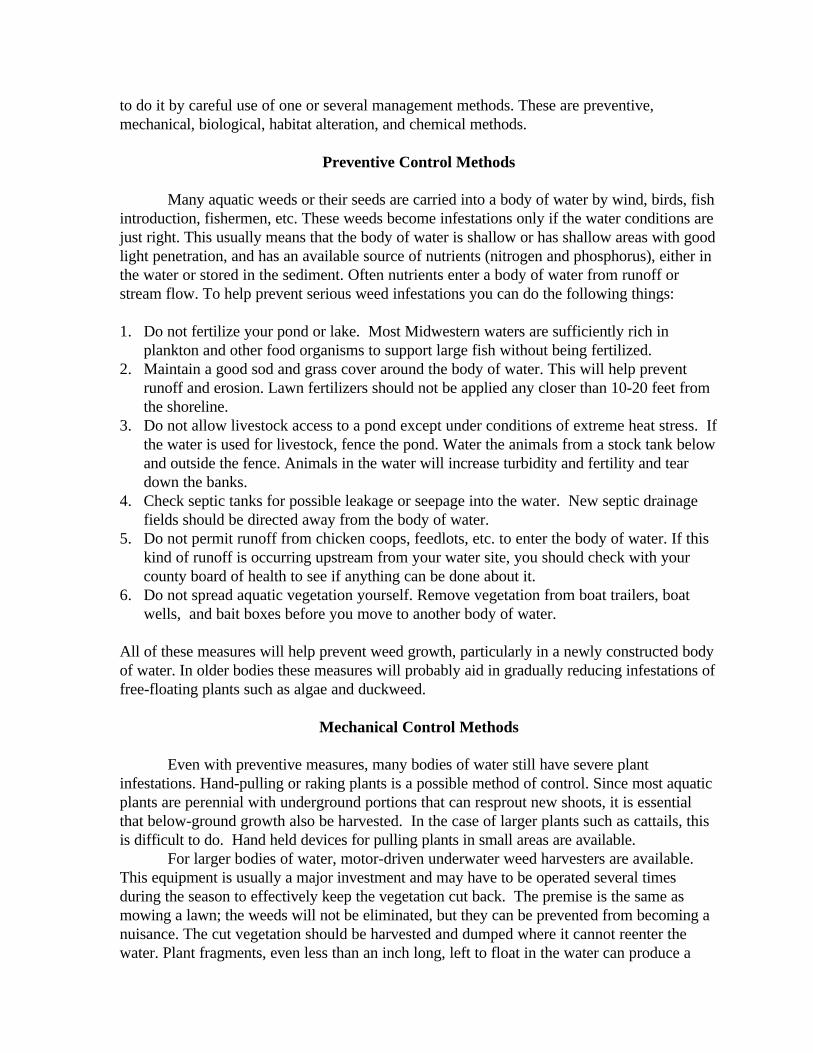
Rooted-floating plants include waterlily, spatterdock, and water lotus. Spatterdock is usuallythe more aggressive of the three and can completely fill in shallow areas less than 3 or 4 feetdeep. Spatterdock has a massive underground rhizome from which new plants can sprout. Itdiffers from waterlily in having a heart-shaped rather than round leaf, and the leaves comeabove the surface of the water rather than float. Spatterdock has yellow flowers. This groupof plants can provide wildlife habitat and may be
WatermealDuckweed
Emergent (shoreline or marginal) plants include grass-like and broad-leaved plants. Grass-like plants commonly include cattails, bulrushes, spikerushes, and reed canarygrass.Broadleaves include willow trees, creeping water primrose, and purple loosestrife. Purpleloosestrife is an invader of wetland areas, has no wildlife value, and is considered a seriousweed. All of these plants spread rapidly by underground systems as well as by seed.
Spatterdock
Waterlily
CattailPlants 5-7 ft. tall. Spikerush
Plants usually no more than 1 ft. tall.

BulrushPlants 3-7 ft. tall.
Creeping water primrosePlants low-growing in shallow water.

A HACCP APPROACH FOR AQUACULTURE PRODUCTS
Richard H. Linton, Ph.D.Food Safety Specialist
Department of Food SciencePurdue University
317-494-6481
Hazard analysis critical control point (HACCP) is a systematic approach for assuringfood safety. The concept of HACCP involves designating a food process into a series ofsteps. Each of these steps is then assessed for potential foodborne hazards that could beinjurious to health. Those steps which contain controllable foodborne hazards are called“critical control points.” Safe limits (such as temperature, time, pH, and moisture) for eachcritical control point are established and monitored to assure a safe food process andultimately a safe food product. During this discussion, an brief overview and general conceptsof HACCP will be presented. The discussion will be focused toward HACCP implementationof aquacultured fish products. A model HACCP plan for aquacultured fish will be presentedas well as potential impacts (costs and time) for HACCP program development andimplementation.
Included in this packet are copies of the overheads that will be used during thepresentation as well as the model HACCP program that will be discussed.
Production Step Hazard Preventive Measure1. Site Selection Chemical contamination Site history
Soil analysis
2. Water Source Chemical contamination Water analysis
3. Receiving eggs andfingerlings
No hazard identified
4. Feed Biological contaminationChemical contamination
Use proper feedInspect for contamination
5. Drugs andChemotherapeutics
Drug/chemotherapeutic residues Use approveRead labelsObserve withdrawal
6. Pesticides andHerbicides
Chemical residues Use approved productRead labelsObserve withdrawal
7. Medicated Feed Feed and color residues Use approved productRead labelsObserve withdrawal

8. Feed and ColorAdditives
Feed and color residues Use approved productRead labelsObserve withdrawal
9. Pre-harvest Sampling No hazard identified
10. Harvesting No hazard identified
11. Cold Holding Biological contaminationDecomposition
TemperatureApproved water
12. Live Hauling No hazard identified
13. Transportation Biological contaminationDecomposition
TemperatureApproved water
CCP1 - Site Selection
Hazards1. Pesticides and herbicides2. Heavy metals
Critical limits1. No sources of contamination of soil or contamination that drain directly into
aquaculture waters2. No aquaculture production area located within 50 feet of a septic system
Monitoring1. Documented history of site2. Have soil analyzed for chemical, pesticide, and herbicide residues Corrective action1. Do not select a site that is contaminated or within 50 feet of a septic system
Records1. Keep written records of land use and chemical land applications within 100 feet of site2. Keep records of soil analysis
CCP2 - Production Water
Hazards1. Pesticides and herbicides2. Heavy metals
Critical limits1. No sources of contamination of soil or contamination that drain directly into
aquaculture waters2. No aquaculture production area located within 50 feet of a sewage sludge area3. No livestock in aquaculture production area or water sources
Monitoring1. Inspect watershed area for potential sources of contamination at least semi-annually2. Have water analyzed for contaminant whenever water is suspected to be contaminated3. Have suspect fish analyzed for contamination4. Inspect fencing or permanent structure to keep livestock out of aquaculture
facility (if applicable)
Corrective action1. Do not water source until contamination is corrected2. Repair damaged fencing or permanent structure
Records1. Log date of inspection for potential sources of contamination2. Log date of fence/permanent structure inspections3. Log all corrective action procedures4. Keep all records of water and fish flesh analysis
CCP3 - Drugs and Chemotherapeutics
Hazards1. Incorrect dosage of legal drugs or chemotherapeutics2. Withdrawal period not observed3. Illegal drugs or chemotherapeutics
Critical limits1. No dose exceeding recommended dosage in quantity of frequency of legal
drugs or chemotherapeutics2. No fish harvested before required withdrawal period3. No illegal use of drugs or chemotherapeutics
Monitoring1. Periodically inventory and properly dispose of out of date drugs and chemotherapeutics2. Record all drug and chemotherapeutic usage - double checking all dosage calculations3. Check date and time withdrawal period before harvesting4. Have edible portion of fish tested to determine if illegal levels of or types of5. drugs or chemotherapeutics have been administrated and are present in greater than legal
residue limit Corrective action1. Properly dispose of fish treated with illegal types or levels of drugs of chemotherapeutics.
These fish cannot be sold for human food.

2. Do not sell fish until withdrawal period has been met
Records1. Record date, drug or chemotherapeutic used, dosage level, and lot number of fish.2. Calculate and record data and time for the end of withdrawal period3. Log all corrective action procedures4. Keep all records of water and fish flesh analysis
CCP4 - Medicated Feed
Hazards1. Medical feed not manufactured in compliance with USFDA regulations2. Incorrect type or dosage of animal drug in medicated feed3. Unobserved withdrawal periods
Critical limits1. No use of medicated feed that does not meet with USFDA regulations2. No use of feed that exceeds dosage limit or is unapproved3. No use of fish harvested before required withdrawal period
Monitoring1. Perform quarterly inventory and properly dispose of outdated medicated feed2. Conduct regular inspections of medicated feed storage area3. Record all medicated feed usage - double checking all feed dosage calculations4. Check date and time withdrawal period ends before harvesting5. Have edible portion of fish tested to determine if unapproved medicated feed
has been used
Corrective action1. Properly dispose of fish contaminated with unapproved medicated feed2. Do not sell fish until withdrawal period has been met
Records1. Record date, medicated feed used, dosage level, and lot number of fish.2. Calculate and record data and time for the end of withdrawal period3. Log all corrective action procedures4. Keep all records fish flesh analysis
CCP5 - Pesticides and Herbicides
Hazards1. Approved pesticide or herbicide applied at incorrect rate or frequency2. Use of nonapproved pesticide or herbicide3. Unobserved withdrawal periods

Critical limits1. No application directly within 100 feet of aquaculture water source or production area
exceeding recommended rate in quantity or frequency of an approved pesticideor herbicide
2. No use of fish harvested before required withdrawal period3. No land applications of unapproved pesticide or herbicide within 100 feet of aquaculture
water supply or production facility4. No aerial applications of an unapproved pesticide or herbicide within 500 feet of
aquaculture water supply or production facility.
Monitoring1. Record all pesticide and herbicide usage2. Periodically inventory pesticides and herbicides and check for leaking and
damaged containers3. Check date and time withdrawal period ends before harvesting4. Test suspect fish for greater then legal chemical residues
Corrective action1. Properly dispose of contaminated fish - contaminated fish cannot be sold as human food2. Do not sell fish until withdrawal period has been met
Records1. Record date and time, pesticide used, application rate, and lot number of fish2. Calculate and record data and time for the end of withdrawal period3. Log all corrective action procedures4. Keep all records fish flesh analysis
CCP6 - Feed
Hazards1. Biologically contaminated feed
Critical limits1. No rancid feed or feed containing mold or other growth2. No contaminated feed used
Monitoring1. Collect and label a sample of each lot of feed used and store it in a freezer for at least one
year after the fish are sold2. Conduct regular inspections of feed storage area checking for proper conditions and
absence of potential contaminants3. Have suspected feed tested for contamination immediately Corrective action1. Properly dispose of all feed found to be contaminated

Records1. Record the lot number of feed, manufacturer, and manufacturers recommended shelf-life
when receiving feed2. Log date of feed and storage area inspections3. Log all corrective action procedures
CCP7 - Feed and Color Additives
Hazards1. Approved feed or color additives used at greater than approved levels2. Unapproved feed or color additives3. Withdrawal times not followed
Critical limits1. No use of approved feed or color additives at greater than approved levels or frequency2. No use of nonapproved feed or color additive3. No use of fish harvested before required withdrawal period
Monitoring1. Record all feed and color additive usage2. Periodically inventory feed and color additives3. Conduct regular inspections of feed and color additives storage area for proper conditions
and absence of potential contaminants4. Check date and time withdrawal period ends before harvesting5. Periodically sample feed to determine level of feed and color additives
Corrective action1. Properly dispose of fish fed with unapproved type or level of feed or color additives2. Do not sell fish until withdrawal period has been met
Records1. Record date and time, lot number of feed or color additives, manufacturers, level
administered, and lot number of feed2. Calculate and record date and time for the end of the withdrawal period3. Record any feed analysis4. Log all corrective action procedures
CCP8 - Holding
Hazards1. Dead or dying fish2. Decomposition3. Microbiological growth4. Cross contamination

Critical limits1. No fish sold with an internal body temperature >40oF after being held on ice
or refrigerated2. No fish sold on ice not made from a water source approved by state or local
health officials3. No fish sold which were dead or dying before harvesting4. No decomposed fish sold5. No commingling of unprotected raw fishery products, cooked ready-to-eat fishery
products, smoked fishery products, or mulluscan shellfish Monitoring1. Monitor and log internal body temperature - repack fish with more ice or adjust
refrigeration to ensure internal body temperature is <40oF2. Check fish for signs of decomposition3. Check for physical separation between different types of fish and fishery products4. Periodically calibrate temperature recording devices at least annually or
whenever damaged
Corrective action1. Fish subject to temperature abuse must be given a thorough sensory examination2. Decomposed fish cannot be sold as human food3. Fish subject to temperature >40oF for > 4 hours cannot be sold as human food4. Properly dispose of decomposed fish, temperature abuse fish, or cooked5. ready-to-eat or smoked fishery products that have been cross contaminated with raw
fishery products
Records1. Record date, lot number of fish, time and temperature of fish2. Log proper physical separation of fishery product3. Log all corrective action procedures
CCP9 - Transport
Hazards1. Dead or dying fish2. Decomposition3. Microbiological growth4. Cross contamination
Critical limits1. No fish sold with an internal body temperature >40oF after being held on ice
or refrigerated2. No fish sold on ice not made from a water source approved by state or local
health officials3. No fish sold which were dead or dying before harvesting4. No decomposed fish sold
5. No commingling of unprotected raw fishery products, cooked ready-to-eat fisheryproducts, smoked fishery products, or mulluscan shellfish
Monitoring1. Monitor and log internal body temperature - repack fish with more ice or adjust
refrigeration ensure internal body temperature is <40oF2. Check fish for signs of decomposition3. Check for physical separation between different types of fish and fishery products4. Periodically calibrate temperature recording devices at least annually or
whenever damaged
Corrective action1. Fish subject to temperature abuse must be given a thorough sensory examination2. Decomposed fish cannot be sold as human food3. Fish subject to temperature >40oF for > 4 hours cannot be sold as human food4. Properly dispose of decomposed fish, temperature abuse fish, or cooked ready-to-eat or
smoked fishery products that have been cross contaminated with raw fishery products
Records1. Record date, lot number of fish, time and temperature of fish2. Log proper physical separation of fishery product3. Log all corrective action procedures
MARKETING OF AQUACULTURE PRODUCTS(TILAPIA)
Kerry TudorIllinois State University
To Produce or Not To Produce?
Do not produce aquaculture products because:1. it sounds like a fun business;2. it’s a new business and there just aren’t many people doing it;3. the neighbor is producing aquaculture products;4. you are an expert in livestock production;5. new technology intrigues you;6. people who attend aquaculture conferences intrigue you;7. you need extra money to send the kids to college;8. corn and soybeans are cheap;9. nobody at the coffee shop ever sells corn and soybeans at a higher price than you;10. your spouse is under-employed.
Do produce aquaculture products because:1. customers need what you can produce, and;2. in most years those customers are willing and able to pay a price that covers your costs of
production and marketing, including the opportunity cost of your labor, management, andinvested capital.
Management and Marketing
In a light-hearted way, the ten reasons not to produce aquaculture products representfirst steps on paths to business failure. In contrast to the firm that is doomed to fail, thesuccessful firm is built upon successful management, and successful management is built upongood decision making. Superlative marketing skills probably cannot rescue a firm that wasestablished as a result of poor decision making. On the other hand, aquaculture producersmust have good marketing skills in order to maintain a prosperous business, regardless of howefficiently they produce their products. The most efficient recirculating system is nothingmore than a technological curiosity if the product cannot be sold at a profitable price. PeterDrucker advised that “Marketing is so basic that it cannot be considered a separate function....It is the whole business seen from the point of view of its final result, that is from thecustomer’s point of view.” (Kotler, p. 1)
In order to be economically successful, the owners of aquaculture firms must shift theirstrategic visions or focus from a) producing fish to b) satisfying customers with products thecustomers did not realize they needed. Companies often fail to take advantage of marketingopportunities because they do not define themselves in terms of the benefits they can provideto customers (Hiam and Schewe, p. 16). Note that among the ten reasons not to produceaquaculture products, there is no sign of the word “customer.”

Since marketing falls under the umbrella of business management, it is typicallyassociated with the following management functions (Anderson):
1. planning,2. organizing,3. directing,4. staffing, and5. controlling,
which require some degree of each of the following management skills:
1. goal setting,2. decision making, and3. interpersonal relationships.
The importance of directing and staffing will vary depending upon the size of the firm andthe number of employees. Planning, organizing, and controlling, on the other hand, are ofutmost importance to all businesses all of the time, whether they are a one-person operationselling live fish from a roadside stand or a firm with dozens of employees selling filleted fish toa wholesaler. Anderson (pp. 19-23) provides the following definitions:
Planning - Deciding on a future course of action for the organization.
Organizing - Arranging the resources of an organization, department, or job in order toachieve objectives.
Controlling - Establishing performance standards, developing performance measures, andtaking steps to correct deviations from standards.
While all functions are important, managers generally agree that planning is the corefunction, and the remaining four support achievement of goals established by planning. Awell-worn phrase that applies to aquaculture management, marketing included, is failing toplan means planning to fail.
Planning: Establishing a Marketing Plan
According to Downey and Ericson (p. 32), the planning process should include the followingsteps:
1. Gather facts and information that have a bearing on the situation.2. Analyze what the situation is and what problems are involved.3. Forecast future developments.4. Set goals, the benchmarks for achieving objectives.5. Develop alternative courses of action and select those that are most suitable.6. Develop a means of evaluating progress, and readjust one’s sights as the planning process
moves along.
Aquaculture producers must begin development of a marketing plan by gatheringfacts and information. How much information should be collected? Lee Iacocca ofChrysler Corporation had no definitive answer to that question, but he suggested that eventhough intuition appears to play a key role in management decision making, intuition shouldalways be supported by facts. At the same time information is subject to diminishing returns;therefore, most important decisions must involve a certain amount of risk. Economicallyspeaking, it is not feasible or desirable to know everything. The cost of gathering additionalinformation, including the value of the information gatherer’s time, should always be less thanor equal to the additional revenue generated by that information.
The Internet is a source of vast amounts of information about aquaculture, some ofwhich would be useful when developing a marketing plan. Aquaculture producers who haveaccess to the Internet should attend Internet workshops or visit with extension personnel whohave expertise on using the Internet in order to make the most efficient use of their time whilelogged on. Other sources of information include aquaculture magazines, aquacultureassociations, aquaculture conferences and workshops, cooperative extension services,universities that are conducting aquaculture research, and other producers. Informationpertaining specifically to markets may come from live-haulers, chambers of commerce,supermarket chain purchasing agents, restaurants, and other fish and seafood retail outlets.
When analyzing the situation and pinpointing problems, the following questionsshould be answered (Beem and Hobbs):
1. Who are the potential customers?2. What do the customers want?3. Who are the competitors?4. What prices are being paid, and what prices have been paid?5. What are the projected production and marketing costs?
In aquaculture, the potential customers may be numerous but unknown. This isbecause the markets for aquaculture products are vastly different from the markets forcommodities such as corn, soybeans, hogs, and cattle where information concerning marketoutlets and prices is abundant and easily accessible. It is typically the job of the aquacultureproducer to identify existing customers or even cultivate future customers through productpromotion. In fact, aquaculture producers might have to be more creative when they aredeveloping their customer base than when they are developing their production systembecause there are no engineers to direct them in marketing development. Hiam and Schewe(p. 15) refer to “marketing imagination” as an essential element in satisfying the latent needsof a customer, in other words, the customer’s need for things he doesn’t yet realize he needs.
In response to the question about what customers want, Willis (p. 62) states that acustomer buys a product and a group of services provided with the product which mightinclude convenience, quality, performance, service, and reputation. It is wise for the producerto remember that the customer is always purchasing a bundle of product attributes rather thanjust a physical product. Convenience to the customer might include such things as delivery ofthe product to the customer’s door, being able to place a phone order with a human beingrather than an answering machine, or being able to buy a product in a form that requireslimited handling and preparation. Customers generally seek a quality product, but it is up to

the seller to determine the customer’s quality requirements. Performance means that theproduct continuously satisfies the needs of the customer. The demand for service might besatisfied by providing assistance in using the product, for example preparation and servinghints or recipes. Reputation reflects dependability and integrity which must be establishedover time and should be monitored periodically.
Collection of useful information about potential customers and customer wants will bestrongly influenced by the producer’s interpersonal relationship skills. If the producer doesnot have an entrepreneurial spirit and sufficient time to commit to the business, criticalinformation will be lacking.
Competition among sellers often gives rise to marketing warfare. McDonalds,Wendys, Burger King, and Hardees are constantly involved in marketing warfare because theyare selling similar products to a large group of customers whose tastes and preferences areconstantly changing. In many cases, aquacultural marketing is more appropriately describedas guerrilla warfare. Aquacultural producers may not know where the competition is, whatthe competition is doing, or even who the competition is.
Aquaculture firms compete primarily with other firms that produce the same species,but they are also competing with all other producers of aquacultural products and ultimatelywith all firms that sell food products. In the North Central Region, there are only a few tilapiaproducers, but most of them find that marketing their product at a profitable price is adaunting task. Tilapia producers are competing among themselves as well as with tilapiaproducers in other regions of the country and the world. The live-haul tilapia market forDetroit, Chicago, and St. Louis can stretch for several hundred miles outside the NorthCentral Region borders. Frozen product can be shipped from Southeast Asia and soldcompetitively in the U.S. as can fresh fillets from Central America.
Reliable price information is not easy to obtain due to the fragmentation of aquaculturemarkets. Because producers are often trying to protect markets they have developed, theyhesitate to provide information about their marketing. The tilapia market in particular hasevolved into a series of sometimes overlapping niche markets where selling prices are typicallybased upon what the market will bear. Available price information may come from publicagencies such as state cooperative extension services, some of which list prices periodically onthe Internet, and private firms such as supermarket chain purchasing agents, fish and seafoodwholesalers, and restaurants.
It is essential that aquaculture producers project production and marketing costs sothat they can project break-even selling prices. Similar to other agricultural enterprises,aquaculture is subject to production risks; therefore, production and marketing costs perpound or hundredweight are difficult to pin down. However, major financial problems can beaverted if production is terminated because selling prices are unlikely to cover production andmarketing costs. Computerized spreadsheets can be very beneficial at this point, since theyallow rapid analysis of multiple outcomes.
A third step in the development of a marketing plan is forecasting future events.Anticipating what consumers will want in the future and anticipating problems is a cornerstoneof good management. Useful forecasts are dependent upon a combination of personalforecasting skills, the amount of time available to think about the future, and the quality ofinformation which has been previously collected. Hiam and Schewe (p. 137) correctly pointout that “There are no sure forecasts - in fact, the only certainty is that the forecast will bewrong, and the key question is by how much it will be wrong.”

A fourth step in developing a marketing plan is setting goals or establishing benchmarks.These goals should be based upon information gathered in steps 1 through 3, they shouldfocus on how the firm can most effectively satisfy customers, and they should be written. Thegoals should be flexible so that the firm can adjust to take advantage of new opportunities thatarise. Most importantly, there should be a description of how each goal will be achieved. LeeIacocca stated that the vexing problems in management and marketing are often associatedwith answering how questions rather than what questions. It is often easier to establish a goalthan to decide how that goal should be achieved.
Examples of production oriented goals include survival rate, feed conversion ratio, andpounds produced per week. Examples of marketing goals would be to sell so many pounds ofproduct at a specified price per pound or to increase sales by a certain percent each year.Other less common goals might include contacting and surveying all current customersregarding product satisfaction, and contacting and surveying a certain number of potentialcustomers regarding future product needs. A brief product/service survey that would providecustomer satisfaction scores could be developed. An additional goal could be to increase thesatisfaction score by a given percent each year.
A fifth step in developing a marketing plan would be to develop alternative coursesof action and select those that are most suitable. The alternative courses of action should bedriven by the goals established for the firm, and they should address the four P’s of marketing- product, place, promotion, and price (see Fact Sheet AS-464, Aquaculture Extension,Illinois - Indiana Sea Grant Program and Technical Bulletin Series #107, North CentralRegional Aquaculture Center, both of which are authored by Swann and Riepe, for detaileddiscussions of the 4 P’s of marketing). Given the structure of aquaculture markets in theNorth Central Region and the necessary person-to-person contact between buyer and seller,most decisions and actions related to place, promotion, and price will be influenced by theinterpersonal relationship skills of the producer. Personal promotion and selling generallyrequire most, if not all, of the following characteristics: self-motivation, enthusiasm,determination, ability to communicate, and ability to negotiate.
Part of the process of developing alternative courses of action should include some formof “crisis” planning. Crisis planning is often done for the technical components of anaquaculture business, and there is no good reason why a crisis plan should not be developedfor marketing. Johnson and Johnson successfully utilized a brainstorming procedure in whichmanagement: 1) made a list of all the bad things that could happen and ranked them accordingto probability of occurrence, 2) developed a most effective response to each possible event,and 3) discussed ways of reducing the probability of each event occurring. Anticipating thefuture and developing contingency plans can sometimes be the difference between disaster andoutstanding profits (Hiam and Schewe, p. 50).
The sixth and final step is to develop a means of evaluating progress and readjustinggoals as necessary. This step is absolutely necessary since planning is a continuous processthat must include continuous evaluation of the environment. Just as water quality must becontinually monitored, oftentimes with electronic alarms to warn of unexpected changes, somust the marketing environment be monitored. “The firm that monitors its environment bestis most likely to be prepared for such [unpredictable] events.” (Hiam and Schewe, p. 48) Toevaluate progress, information about the current situation must be collected, analyzed, andcompared to the goals which have been established for the business.

Conclusions
Management and marketing decisions of aquaculture producers should be driven bycustomer needs including latent customer needs. The strategic vision and related goals of thefirm should focus on what the customer will be buying rather than what the firm is producing.In addition, producers must possess skills in decision making, interpersonal relations, and goalsetting so that they can successfully plan, organize, and control as well as staff and directwhen necessary. Collecting and analyzing useful information are the nuts and bolts of gooddecision making which allow skilled managers to make the right decisions at the right times..
References
Anderson, Carl R. Management: Skills, Functions, and Organization Performance. Boston: Allynand Bacon, Inc., 1988.
Beem, Marley and J. C. Hobbs. “Recirculating Aquaculture Systems: Questions to Ask Before YouInvest,” OSU Extension Facts F-9207, Oklahoma Cooperative Extension Service, Division ofAgricultural Sciences and Natural Resources.
Downey, W. David and Steven P. Ericson. Agribusiness Management. St. Louis: McGraw-HillBook Co., 1987.
Hiam, Alexander and Charles D. Schewe. The Portable MBA in Marketing. New York: John Wiley& Sons, Inc., 1992.
Iacocca, Lee (with William Novak). Iacocca: An Autobiography. New York: Bantam Books, 1984.
Kotler, Philip. Marketing Management, 5th Edition. Englewood Cliffs, NJ: Prentice-Hall, 1984.
Willis, Walter J. Introduction to Agricultural Sales. Reston, VA: Reston Publishing Co., Inc., 1983.


REVISITING RETAIL AND WHOLESALE MARKETS(Walleye and Yellow Perch)
Jean R. RiepeDepartment of Agriculture Economics
Purdue UniversityWest Lafayette, IN 47907
Need for Market Information
One of the primary goals of any business venture is to make a profit by marketing aproduct that is produced. This means that marketing is not just a sideline to a successfulbusiness, but an integral part of the operation. Kristina Cannon-Bonventre, the marketinganalyst for Seafood Business, even goes so far to say that, "Marketing is everything." Whethermarketing is actually everything, the main thing, or some part of the thing, it is obvious thatmarketing is extremely important. Consequently, aquaculturists must have market information.They need it: to develop a marketing plan, to choose a product line, to determine the idealfacility location, to identify prospective buyers, to properly price products, to effectivelypromote products (are we seeing the 4 P's of marketing here??), and to convince investorsthat there is a market for their product. A business plan without a marketing plan is a researchproject.
Obtaining good marketing information is not always easy. In fact, defining what themarket is can be difficult. There are different levels and types of businesses throughout themarketing channel. For example, there are processors who also perform wholesaling anddirect sales functions and there are restaurants which buy seafood from foodservicedistributors as well as seafood wholesalers. There are bigger and smaller geographic locationsto consider. National consumer trends must be monitored as well as regional and local trends.There are competing products to consider, especially their price, quality and supply. Inaddition to a whole host of competing fish/seafood species, the situation/outlook forbeef/pork/poultry cannot be overlooked nor foods in general. Also, different types of retailoutlets need to be assessed in terms of trends, including the restaurant business, grocery trade,and the smaller fish markets, farmers' markets, direct consumer sales, and other firm types.
Once the market has been defined, obtaining good information still may not be easy. Afew good trade magazines can be purchased or perused at a library for ideas and data. Surveyresults published by universities and other public or private institutions are often available fora small price. However, no one else is likely to do a statistically valid marketing survey ofyour chosen market niche.
To develop a sound business plan, more than anecdotal marketing information isneeded. Vital business decisions cannot be based on the shifting sands of anecdotal evidence.For large aggregates of firms either in terms of numbers or geographic location, data from astatistically representative sample of the population are best. One example is restaurants in thestate of Indiana. One must be careful, though, with the population surveyed and the questionsasked. There have been several fish/seafood marketing studies conducted on the East Coast ornationwide. The validity of these data for understanding the Midwestern market for seafood,however, is questionable.. Certainly there are many seafood marketing insights to be gainedfrom such studies. At the same time, the data cannot be expected to accurately reflect all

characteristics of the Midwest market.. Another problem with fish/seafood marketing studiesis that "fish" are not homogeneous like #2 yellow corn. There are hundreds of species, eachwith its own peculiarities. To complicate matters further, each can typically be sold in morethan one product form or size. Simply calling a species by its proper name can also be aproblem. The lack of homogeneity of fish/seafood products makes them more interesting,colorful, and varied, but it also presents problems in marketing and marketing studies.
Current NCR Marketing Project
Since the fall of 1995 I have been working on a jointly funded fish/seafood marketingproject involving the North Central Region. If you will recall, NCRAC funded a couple ofmarketing studies in the early 1990's. The purpose of these was to survey fish/seafoodwholesalers and retail grocery stores and fish markets in order to determine several things,including: 1) the normal channels of distribution in the NCR for fish/seafood; 2) what specieswere being handled and in what form; 3) what species had the most market potential foraquaculture products. Every survey has its limitations because of the limited amount ofinformation that can be asked for in any single survey, and based on the budget, personnel,and time constraints of the survey project. The survey project I am in the middle of seeks tobuild on these former studies in three ways: 1) by exploring in more detail the market for thetwo species identified in the previous studies as having the most market potential asaquaculture species, walleye and yellow perch; 2) by adding restaurants, grocery wholesalers,and foodservice distributors to the list of firm types that have been surveyed region-wide fortheir behavior regarding the purchase and sale of fish/seafood; and 3) by exploring further thetracking of different species and/or product forms in fish/seafood distribution channels in theNCR.
The firm types of businesses currently being surveyed include seven different ones: 1)restaurants; 2) supermarkets; 3) fish seafood wholesalers; 4) fish/seafood retailers; 5)foodservice distributors; 6) grocery wholesalers; and 7) fish/seafood brokers. After someinvestigation I determined that these firm types (by SIC code) were the most likely to handlefish/seafood at the wholesale or retail level in the NCR. Further research showed that thecategory of restaurants could be effectively down-sized for the purposes of this survey toinclude only non-chain establishments that do not primarily serve pizza and that do offertableservice either with a full or limited menu. There are over 90,000 restaurants in the NorthCentral Region, so it is best to further refine the definition to match more closely the types ofestablishments for which data are desired. The category of grocery stores was similarlyredefined to include only those stores that qualify as supermarkets, which the trade defines asstores having $2 million or more in sales.
Survey instruments were developed based on which types of firms are the mosthomogeneous. Since survey data are often influence by factors which can loosely be calledfirm characteristics (e.g. size, location, gross sales, menu theme, etc.), a single surveyinstrument would not be able to capture the differences in various types of firms and still haveany room left to ask about fish. Therefore, five different survey instruments were developed.Restaurants and supermarkets each warranted their own set of two survey instruments, andthe rest of the firm types were judged to be able to be well-served with a single, fifthinstrument. Survey instruments for restaurants and supermarkets were split into two becauseof two major concerns. One was that a single survey would end up being too lengthy in orderto contain all the questions needed for firm characterization and for obtaining walleye- and

yellow perch-specific data (hereafter called "species-specific"). Another was that there was noway to know ahead of time which of the thousands of restaurants and supermarkets werehandling walleye and/or yellow perch. To send a lengthy, detailed survey to all firms in thedrawn sample would have been costly and could have greatly discouraged the firms' managersfrom ever completing the surveys. Therefore, the Phase-I survey were designed to containquestions only to acquire information on firm characteristics, general fish/seafoodpurchase/sales behavior, and whether or not they sold walleye or yellow perch. Phase-IIsurveys, then, were designed as a follow-up to obtain the species-specific information onlyfrom those firms that indicated in the Phase-I survey that they did in fact sell these species in1996.
The Four P's of Marketing: and a Practical Application
What lecture/speech on marketing would be complete without a mention of the 4 P'sof marketing? It occurred to me recently that the 4 P's are not only useful as a way to easilyremember what the different aspects of marketing are, but also that they can be used as a gridthrough which to view incoming market information. Below is a brief explanation of the 4 P'sand then the application will follow.
Product is one of my favorites of the 4 P's, especially when it comes to fish andseafood. The list of species is endless and when this is multiplied times the potential number ofproduct forms and size ranges then the number of products approaches infinity (asymptoticallyof course). This of course means that a good manager must be very careful that all aspects ofthe business venture jive with the chosen product form(s). Product means answering suchquestions as: which species? fresh or frozen? round, fillet, or value-added? Does my productcompete well in my chosen marketing niche or do I have the wrong marketing niche orpossibly the wrong product?
Price can be a particularly tricky part of the 4 P's. Fortunately, people buyingfish/seafood seem more interested in quality than price. However, there are a lot of competingproducts out there begging for the buyer's dollar. Just make sure that you have correctlyidentified your costs so that you know the lowest price you can afford to sell for withoutbankrupting yourself.
Place appears to be an important marketing factor in species like yellow perch andwalleye which have a more regional appeal. It is much easier to sell a product in a place wherecustomers have already acquired a taste for it -- and that is what consumers want in fish, taste.
Promotion is especially important in the fish/seafood marketing world since, with sucha variety of competing products, every market is a niche market. Add to that the stagnation inconsumption per capita of fish in the United States, and the argument for promotion is verystrong.
How can the 4 P's be used practically? One problem with our information age is thatwe are often inundated with too much information. Often, the information is not organized inany meaningful way, which can render it practically useless. The 4 P's provides us with a toolto filter any marketing information we read or hear about, whether in the context offish/seafood marketing or some other product. When we read or hear something aboutmarketing that catches our attention, instead of filing it simply for future reference (or morelikely forgetting it), we can use the framework of the 4 P's to apply it to our own individualbusinesses. So the first step is to read/hear an attention getting marketing thought. The second

step is classification; deciding which of the 4 P's this particular thought is concerned with. Thefinal step is to think in concrete, not abstract, terms as to how this thought can be applied toimprove our own business in this P of marketing. The 4 P's can help us avoid thinking aboutmarketing improvements only in the abstract and focus our thinking on specifics.
Businesses, like people, don't change in the fuzzy land of generalities and abstractthought. If a wife wants to improve her marriage by loving her husband, nothing is going tochange if all she does is think warm lovey-dovey thoughts about her husband. But, if shemakes a list of practical, everyday living deeds that will communicate love to her husband, andpractices them, then she will see change. Some examples of these concrete deeds could bedaily telling him verbally that she loves him, daily praising him for some specific area in his lifewhere he is doing well, daily thanking him for one specific thing that he provides or a specificdeed that he has done for their family, and working at being attentive to his needs so that shecan do some special things for him without being asked. Similarly, businesses won't grow andthrive without attention to specifics on how to improve the product, price, promotion, andplace of the product line.
Marketing Ideas Gathered from the Trade Literature
In order to gain a better understanding of the businesses I intended to target in mymarketing survey, and to gain some insight into what I might expect in terms of theirpurchase/sales behavior regarding fish/seafood, I conducted a review of some trade magazinesfor restaurants, grocery stores, and seafood businesses. I took some notes along the way ofmarketing thoughts or statistics that caught my attention. I hope that you will find these to benot only interesting but thought-provoking. You might even want to practice classifying themalong the lines of the 4 P's and thinking through some specific applications to your ownbusinesses.
Where is seafood consumed? Seafood Business reported that in 1993, consumersspent about 2/3 of their $38 billion on seafood in foodservice outlets (primarily restaurants)and 1/3 in retail outlets (primarily supermarkets). How does this information affect the placestrategy in your marketing plan?
What are the top species nationwide? Seafood Business reported that the top 10species in 1993 in terms of consumption were: tuna, shrimp, pollock, cod, salmon, catfish,flatfish (flounder/sole), clams, crabs, and scallops. Nationally, these are the top competitorsfor your aquaculture products. Regionally and locally, this list is likely to be quite different.
What are the obstacles to increased sales of seafood nationally? Based on a 1993survey of retailers selling seafood, Seafood Business reported the following obstacles: 1) highwholesale prices; 2) consumer education; 3) inconsistent quality; 4) inconsistent availability; 5)erratic wholesale prices; and 6) consumer safety concerns. In my thinking, these add up to twothings: 1) a whole lot of opportunity for aquaculture; and 2) a set of issues to deal withspecifically in any marketing plan.
What are some of the biggest trends in retail seafood sales? Seafood Business reportedtwo trends based on their 1993 Retail Seafood Survey: 1) a shift from full-service toself-service; and 2) a switch from concentration on fresh products to high quality, previouslyfrozen-at-sea fish. These two trends both send up red product flags for me. Packaging couldbecome much more important with a shift from full- to self-service for those servicingsupermarkets. Investing in some type of cryovac or IQF technology (I'm totally ignorant ofthe costs involved in either of these) might be a way to profit from either of these trends.

What are some of the weaknesses of supermarkets regarding the marketing offish/seafood? Supermarket Business reported a few based on their surveys and discussionswith people in the trade. The biggest and it seems the foundational weakness is that the folkswho staff the seafood department in supermarkets don't know enough (in terms of speciesbackground, cooking suggestions, recipes) and aren't as well trained (concerning handling anddisplay) as they should be. This invites all kinds of promotional strategies. In the 1994 annualnationwide survey of supermarkets, some of the results correspond to this weakness. Whenasked who conducts employee training the respondents indicated that while 100% of theseafood department managers conducted some training on their own, 38% of them had somestaff training conducted by seafood suppliers. When asked what they would like help with,retailers most frequently indicated: consumer education, ad allowances, employee training,couponing, demonstrations, and point-of-purchase.
Similar weaknesses in restaurants appear in restaurant trade publications as well. Anarticle in the 1995 Seafood Service Supplement to Restaurant Business indicated that seafoodsuppliers should expect to provide support to restaurants, as well as providing the products, insuch ways as server training, menu marketing, signature selling, and recipes.
Supermarket and restaurant markets are also alike in the increasing use of seafood invalue-added ways. In supermarkets for instance, prepared seafood items are becoming moreand more common, either uncooked in the seafood department or cooked in the hot-deli area.Supermarket Business reported that some fish/seafood suppliers are providing supermarketswith ingredients for staff to use in preparing value-added seafood items. Restaurants are usingseafood outside the arena of traditional entree. More seafood is showing up in appetizers,soups, stews, and salads. Perhaps your product line could become more competitive andprofitable with the addition of one or more value-added items or the ingredients/recipes toprepare them.
One idea brought out in Seafood Business is that consumers no longer want to eatfish/seafood because it is good for them healthwise, but because it tastes good. Indeed, whenconsumers were asked in a 1993 national consumer survey what was the single mostimportant factor to them when choosing seafood in a restaurant, 52% indicated that taste wasthe top reason. Quality/freshness came in a distant second with 25% of the votes, followed byprice (16%). Nutritional value was only indicated by only a tiny fraction of respondents (1%)as their single most important factor when choosing seafood to eat in a restaurant. Whenasked the same question about choosing seafood to cook at home the numbers weresomewhat different, but not for price or nutritional value. The tradeoff came between tasteand quality. When choosing seafood to cook at home, consumers indicated that their singlemost important factor was quality/freshness (32%) followed closely by taste (30%).
Seafood Business also contains articles addressing the producer side of the business.One of these was an article titled "Rules for Success with Aquaculture" in the Jan/Feb `94issue. In this article, Don Haynie, president of Farm Fresh Catfish laid out four rules: 1) youneed a plan; 2) you need to identify all costs before you start; 3) do a good job of siteselection; and 4) be consistent with your product and your goals. Note that all four of theserules deal with good management while only one primarily relates to production.
The marketing analyst for Seafood Business, Kristina Cannon-Bonventre, wrote about10 essential marketing ideas in her column in the Nov./Dec. `93 issue of that publication. Hereare her "10 proactive items you can't afford to ignore. ...: 1) You must understand theindividual, household consumer, regardless of where you are in the distribution channel; 2) themass market is gone -- period [essentially, all food markets are niche markets, so do you know
the behavior and trends of your niches, and are you marketing innovatively within them?]; 3)Loyal customers are more profitable; 4) Your employees are crucial for building customerloyalty; 5) Offer only the finest products in their class; 6) Work together as an industry toeducate the public and build demand; 7) Look beyond the seafood industry -- or even the foodindustry -- for good marketing ideas; 8) Constantly define your business; 9) Always be on thelookout for incremental improvements to your business; and 10) Marketing is everything."Lots of food for thought in this list. Don't let these ideas pass you by without using the grid ofthe 4 P's to categorize the ideas and think of concrete, specific ways in which you could applythem to change your business.
Finally, one way to be competitive in whatever your chosen market niche, given theproliferation in number of different fish/seafood species and product forms and competitionfrom other suppliers, is to follow the advice given by F.W. Bryce in the Sept./Oct. `94 issue ofSeafood Business, "Establish a reputation for superior quality product and a relentlesscommitment to customer service and satisfaction ... You too will stand out in a big pond." Iespecially like the "relentless" part of that quote. Not only is customer service essential in afree market economy, but `relentless" also conjures up in my mind a unique list of specificsteps typically taken that ensure and define "a relentless commitment to customer service" foran individual business.
Preliminary Survey Findings
It cannot be emphasized enough that everything being reported in this section ispreliminary. The survey mailing process is not yet complete, much less the data analysis.However, there are some discernible trends in the data. They are significant enough to suggestthat, when the data analysis is finalized, these trends will remain. Therefore, most of what isreported below will be ideas buttressed by some preliminary percentages. Tables were notused so as to avoid the perception of finality regarding the data.
With five different survey instruments and seven different firm types, there are a lot ofdata. As it was, not all of the data in the surveys returned to-date have been entered. Fourdifferent groupings of data are discussed below. The first grouping is data from the Phase-Isupermarket survey, followed by data from the Phase-I restaurant survey. The latter groupincludes only those respondents who indicated they serve yellow perch and/or walleye. Therestaurants that serve fish but not those two species have not had their data entered yet. Thedata from the Phase-I surveys are the more general information on fish/seafood purchases andsales. The next grouping is data from the Phase-II restaurant survey followed by data from thewholesaler survey. The data in both of these groups are species-specific purchase and salesdata for walleye and yellow perch.
Supermarkets: Phase-IThe top ten species sold by the 52 supermarkets responding to the supermarket survey
(asking what were their five best-selling species) include the following in order of greatestfrequency: catfish, shrimp, orange roughy, salmon, pollock, ocean perch, cod, haddock, lakewhitefish, and flatfish (flounder/sole). That catfish is at the top of the list is surprising, butshows how the popularity of this formerly regional species has spread widely throughout theUnited States through extensive promotion of a good product. Neither walleye nor yellowperch made it into the top ten list. Indeed, only 2-3 supermarkets listed it as one of their topfive selling species.

Supermarkets in the NCR purchase more frozen fish/seafood than they do fresh. Freshitems accounted for only 32% of supermarket purchases in the survey.
Supermarkets purchase most of their fish/seafood from either a seafood wholesaler ora grocery wholesaler, with the former being the more common supplier. Secondary suppliersinclude the same two as above followed by foodservice distributors and fishermen.
Supermarkets were asked to indicate which type of supplier they typically use topurchase different types of fish/seafood products: fresh shrimp, frozen shrimp, fresh oceanfish, frozen ocean fish, fresh lake fish, frozen lake fish, fresh farm-raised fish, and frozenfarm-raised fish. It was hypothesized that retail level firms were likely to acquire differentspecies or product forms from different supplier types. The data confirm this suspicion.Seafood wholesalers was listed as the customary supplier type for the fresh versions of each ofthe listed products by 57%-69% of respondents. At the same time, seafood wholesalersaccounted for only 1/4 - 1/3 of frozen purchases. About half of frozen purchases for eachfish/seafood type came from grocery wholesalers.
Restaurants: Phase-IFor restaurants, data had only been entered to-date for 260 establishments, or 41% of
all the 637 returned, usable Phase-I restaurant surveys. These 260 were the ones that indicatedon the survey that they had sold yellow perch or walleye in 1996. Thus, the data given beloware only for restaurants selling these two species and are not representative of the entirerespondent group.
Walleye were sold in 1996 by virtually all (91%) of the 260 restaurants whichindicated they sold either walleye or yellow perch that year. About one-third (36%) indicatedselling any yellow perch in 1996. Some restaurants sold both species (27%) and others soldonly walleye (64%) or only yellow perch (9%). Obviously, walleye is more widely popularthan is yellow perch in restaurants in the NCR.
The list of top ten best-selling species by restaurants is much different from thesupermarket list and includes in order of greatest frequency: shrimp, cod, walleye, salmon,yellow perch, scallops, pollock, orange roughy, tuna, and lobster. Note that both walleye andyellow perch ranked high in the top ten list for restaurants but not supermarkets. Apparently,and this is supported somewhat by some of the hand-written comments, consumers in theareas where sport fishing for these species is common typically do not want to have to pay forthem in the grocery store. However, consumers do expect these species to be served inrestaurants in these areas.
Restaurants in the NCR prefer to purchase frozen fish/seafood. Respondents indicatedthat, on average, only 24% of seafood purchases are fresh. It was expected that the freshpercentage would be much higher for restaurants. However, this expectation was based onnational and East Coast survey data. Apparently, the NCR market differs in this respect. Thisis good news for aquaculture. If aquaculturists can be relieved of the burden of deliveringfresh supplies frequently, this gives them a lot more flexibility in production and marketing. Acouple respondents indicated in writing that they preferred IQF or cryovaced products tofresh. It is unknown how widespread this preference is.
During 1996, restaurants in the NCR primarily purchased their fish/seafood through afoodservice distributor (58%) or a seafood wholesaler (31%). Half did not indicate anysecondary supplier, while the only secondary supplier type in double digits besides the twomention above was grocery wholesalers. Again, data revealed patterns opposite from previousthinking. It had been assumed that seafood wholesalers were the primary source of

fish/seafood for restaurants. And again, this was based on information for the nation and theEast Coast. However, it makes sense that if 3/4 of restaurant seafood purchases are for frozenproducts that the supplier would be a foodservice distributor that is likely selling other foodproducts to them as well.
Restaurants were asked to indicate which type of supplier they typically use topurchase different types of fish/seafood products (fresh shrimp, frozen shrimp, fresh oceanfish, etc. as above). Similar to supermarkets, restaurants also tend to utilize different suppliertypes for different fish/seafood products. The restaurants in this group typically purchaseabout half (46%-54%) of their fresh seafood products of all types from seafood wholesalers,but only about one-fifth of frozen shrimp, ocean fish, lake fish, or farm-raised fish. Unlikesupermarkets which tend to purchase the balance of their seafood products from grocerywholesalers, restaurants typically purchase the balance of their seafood products (about 2/3 offrozen products and 1/3 of fresh products) from foodservice distributors.
Seafood sales as a percent of food sales is typically quite low for supermarkets (lessthan 5%) This held true for the responding supermarkets in this survey. Restaurants, on theother hand, commonly have a much higher percentage. The responding restaurants in thissample averaged seafood sales of 27% of total food sales. This is somewhat surprising. Evenmore surprising is that virtually every responding restaurant listed at least five species inanswer to the question asking for their top five best sellers. Apparently, and this wascorroborated by the restaurant trade literature, seafood is a growing trend in restaurants. Thisis good news for aquaculturists. Restaurants already accustomed to handling fish are muchmore likely to add or switch to a new species than a restaurant unfamiliar with fish.
Where are the best markets for yellow perch and walleye? Of course there are manyfactors that would need to be considered to answer this question fully. However, identifyingthe geographic location of current consumption is one factor and one of the goals of thisproject. Survey data on two types of locational aspects provide some interesting clues as towhere these species are popular in restaurants. Because of the mailing list database, it waspossible to determine from which states all 637 usable restaurant responses came as well asthe 260-unit subgroup of those serving walleye and/or yellow perch. The percent responsefrom each state (relative to the total number of surveys returned) tracked reasonably well withthe percent from each state in the mailing list. However, when it came to the percent ofresponding walleye/perch restaurants (W/YP) by state, there were some very tellingdifferences. It appears that the state having the largest above-normal percentage of restaurantsselling walleye and/or yellow perch is Wisconsin.(Normal being defined as the percentage ofall responding restaurants coming from that state.) The Badger State accounted for about15% of all completed surveys, but accounted for nearly double the proportion (27%) of W/YPrestaurants. Unfortunately, at this time it was not possible to break this down further todetermine whether these restaurants are selling walleye or yellow perch or both. Other stateswith above-average percentages of walleye/perch restaurants included Minnesota (14% ofW/YP restaurants versus 8% of all completed surveys), Michigan (19% versus 14%), andNorth and South Dakota (each 3% versus 2%). The remaining states in the NCR hadbelow-average percentages. The states with the worst spread between W/YP and allrestaurants were Illinois (7.6% W/YP versus 13.5% all), Kansas (1% versus 5%), Missouri(1% versus 5.5%), Nebraska (1.5% versus 4.2%), and Iowa (3.4% versus 6.4%). Ohio andIndiana each had percentages of W/YP restaurants that were slightly less than theirpercentages of all responding restaurants. Ohio had 13% of the W/YP restaurants and 15% ofall responding restaurants, while the percentages for Indiana were 7 and 10. Because of the

mailing list database, it is also possible to determine in which county each respondingrestaurant is located. This analysis will be undertaken at a later date.
Restaurant managers were asked to indicate how close their restaurant is located tothe Great lakes: within 50 miles, between 51-100 miles, or over 100 miles. Responses to thisquestion were significantly different between restaurants that sold walleye in 1996 and thosethat sold yellow perch. More than two-thirds (70%) of the restaurants serving yellow perchare located within 50 miles of the Great Lakes. This percentage is only 41% forwalleye-serving restaurants. Conversely, only 13% of restaurants selling yellow perch arelocated more than 100 miles from the Great Lakes, while this is true for 41% of restaurantsserving walleye. These substantial differences indicate very different market dynamics forthese two species.
Restaurants: Phase-IIData from the Phase-II restaurant survey only cover the marketing of yellow perch and
walleye. Several aspects of the purchase and sale of these species were explored in the survey.Preliminary results are discussed below.
Because of the strong presence of commercial and sport fisheries for walleye andyellow perch it is important to study the seasonal patterns of supply, demand, and wholesaleprice. Restaurant managers were asked to rank the top four months of the year for the highestconsumer demand, supply, and wholesale price paid. Survey data show that consumer demandfor both species in NCR restaurants is strongest in the summer, June through September.Supplies are also more abundant during this time of year. For both demand and supply, thepattern of frequencies from January to December resembles a normal distribution with thebulge appearing over the summer months. The seasonality of wholesale prices, however,follows a much different pattern. There is no definite pattern, nor four months that stand outas the top four. Rather, wholesale prices appear to be higher by October/November, stay highthoughout the winter months, and then make a sharp drop between March and April.
Surprisingly, despite the apparent supply problems with walleye and yellow perch,more than two-thirds of restaurants serving either one of these species offer them year around.In addition, 67% of restaurants serving walleye and 57% of restaurants serving yellow perchindicated that they offer their respective species on a daily basis. Another 20% offer themweekly.
When asked what walleye product form they most prefer to purchase, restaurantmanagers chose frozen fillets two to one over fresh fillets (59% versus 26%). What theyactually purchased was very similar, 66% frozen and 20% fresh fillets. Most all of the filletswere of the skin-on variety. For yellow perch, the purchased product form was flip-floppedwith the preferred product form. While restaurateurs indicated that they prefer fresh fillets(50%) over frozen fillets (39%), they ended up purchasing more frozen fillets (59%) thanfresh (35%).
Restaurants were asked to indicate the wholesale prices they paid for their two mostfrequently purchased products in July, 1996. Since the data are rather thin, prices for all sizeswithin each product form were averaged together. On average, restaurants paid higher thanexpected prices for walleye: $5.76/lb. for frozen fillets, $5.88/lb. for fresh fillets, and $2.53/lb.for fresh round or dressed walleye. Yellow perch prices were even higher and exhibited awider spread between fresh and frozen: $6.41/lb. for frozen and $7.71/lb. for fresh. From theanswers to some of the questions and hand-written comments, it is likely that prices for bothspecies, but yellow perch especially, are prohibitively high. This was expected for yellow

perch, but not so much for walleye. The high prices coupled with supply problems has been adifficult combination for restaurants to combat and still offer these species.
Foodservice distributors typically are the primary suppliers of frozen walleye or yellowperch to responding restaurants (about 72% each). Seafood wholesalers, however, are thecommonly used source of fresh fillets (about 70% each). Two-thirds of the respondingrestaurants receive deliveries weekly or more often for either fresh or frozen walleye or yellowperch.
When asked how much their weekly purchases might increase if aquaculture increasedthe availability and somewhat reduced the price of walleye and yellow perch, responses givenby restaurateurs indicate that their walleye purchases might increase by about one-half whiletheir yellow perch purchases could get close to doubling. These hefty percentages suggest thatthere is a price/supply problem for both species but that it is worse for yellow perch.
While some restaurants did indicate they purchase farm-raised walleye or yellow perch(about 13% each), the most frequent answer for both species was no, but interested in doingso. About 1/4 (28%) of walleye-serving respondents do not know for sure if they are usingfarm-raised products or not, while only 18% of restaurants serving yellow perch were unsure.
It was hypothesized that restaurants must use one or more strategies for coping withthe supply and price challenges presented to them by the vagaries of the walleye and yellowperch markets. To test this, the same list of strategies was presented as potential solutions tosupply and price problems for both species. For both species, restaurants most frequentlyindicated the same two strategies for handling supply problems: switching to a different size ofthe same product form and temporarily switching suppliers. Switching from fresh to frozen isalso common for yellow perch purchasers. Switching to a different species was the leastcommon strategy for handling supply problems of either species. When price is a problem, foreither species, responses were spread out among the same four strategies rather than focusingon two-three. The most frequently employed strategy of these four for both species istemporarily dropping that particular species from the menu. Closely following are: switchingto a different size of the same product form, temporarily switching suppliers, and switchingfrom fresh to frozen. The strategies with the lowest percentages for handling price problemsare switching to a different species and switching to a different product form. It is interestingto note that none of the restaurants serving yellow perch suggested under either a supply orprice problem to solve that problem by switching species.
Wholesalers and Seafood RetailersThe firms surveyed with one survey instrument are a diverse lot. The seafood retailers
were lumped in together with the six other types of firms that operate primarily at thewholesale level. This is because seafood marketing channels are rather mixed with firmsperforming multiple functions within the marketing channels. It was hypothesized that seafoodretailers would conduct much more wholesaling business than a supermarket would ever do,and would more closely resemble seafood wholesalers in their seafood purchasing and salesthan supermarkets. Also, many wholesalers and processors do a significant amount of directsales to consumers.
Since the mailings of wholesale/retail surveys is not yet complete (only the first round)and few surveys have been completed for each firm type, few preliminary results are presentedhere. In some cases data are presented for three firm types, fish markets seafood wholesalers,and foodservice distributors. (Fish markets are really seafood retail but the former terminologyis used to avoid confusion with seafood wholesale.) Processors have generally been classified

as either fish markets or seafood wholesalers depending upon what types of firms are typicallytheir customers. In other instances, data from all three of these firm types have been lumpedtogether.
When asked whether they handled walleye or yellow perch, responses differed by firmtype and species. About two-thirds of fish markets and foodservice distributors indicated thatthey do handle walleye, while less than half of seafood wholesalers (45%) answeredaffirmatively. The same percentage of seafood wholesalers reported selling yellow perch, butsomewhat fewer fish markets did so (57%). Only 22% of foodservice distributors reportedhandling yellow perch. Virtually all firms which reported handling walleye and/or yellow perchindicated that they do so year around.
Clear trends in product forms purchased are also apparent from the small amount ofdata in hand. Foodservice distributors handle only frozen fillets whether walleye or yellowperch. Fish markets purchase both fresh and frozen fillets, but tend to buy more frozen forboth walleye and yellow perch. Seafood wholesalers tend to handle multiple product forms(average of 3.2 for walleye). Regarding walleye, all respondents indicated that they purchaseboth fresh and frozen fillets, while more than two-thirds also buy fresh rounds and just underone-half also buy fresh dressed. Purchases of yellow perch by seafood wholesalers wereevenly split (relatively high percentages for all) among fresh rounds, fresh fillets, and frozenfillets.
Prices paid in July 1996 for walleye and yellow perch by wholesalers and seafoodretailers were lower than those paid by restaurants (as one would expect) but still high. Thefollowing average prices are based on quite small amounts of data and thus can be expected tochange, perhaps significantly, when the data collection and analysis are completed. However,they do provide some indication of relative pricing. Prices were reported for walleye asfollows: $5.80/lb. for frozen fillets, $4.99/lb. for fresh fillets, and $2.06/lb. for fresh rounds.Prices for similar yellow perch product forms were $6.36/lb., $6.10/lb., and $2.08/lb.,respectively.
Conclusions
Marketing is a very important component of any aquaculture business. Without a goodmarketing strategy and ceaseless attention to the various aspects of marketing, long-termprofitability will be difficult to achieve. There are so many products in the fish/seafood mixand so many potential businesses to sell to, that locating and servicing the niche markets thatwork best for an individual business can be a difficult, time-consuming challenge. However,these challenges suggest that marketing opportunities for aquacultured products abound. Inaddition, guidance is always available (usually at a price) in the form of marketing ideas, data,and expertise from many sources both within and without aquaculture and the fish/seafoodtrade. Marketing may or may not be everything, but without careful attention to it, there willbe nothing.

KEYS TO A SUCCESSFUL BUSINESS PLAN
Norma A. TurokExtension Educator
Small Business ManagementSouthern Illinois Small Business Incubator
150 E. Pleasant Hill RoadCarbondale, IL 62901
618/453-5561
A prospective business owner as well as those already in business need to develop awritten plan. Written plans provide a management tool for determining specific strengths andweaknesses of an idea, documenting reasonable objectives and identifying resources to attainthem. A written plan will also provide the basis for developing a more detailed businessoperating plan. Even though the risk of going into business cannot be eliminated, a good planwill help reduce the risk. The following outline will take you through the "thinking process"and help in gathering and organizing the necessary information.
Perspectives
When starting a new business or operating an existing one, it is essential to developand maintain a basic understanding of the changing world in which the business is operating.
1. Business Planning2. Business Statistics3. Business Definition4. Business Survival5. Economic Environment
Preliminaries
Personal StrengthsA major determination of the ultimate success or failure of a business is directly related
to personal characteristics and skills of the owner. A questionnaire to analyze your strengthsand weaknesses to determine your "entrepreneurial qualities" can be found in Appendix E.
Resume DevelopmentYour resume should present a positive personal image -- it is your marketing tool!
Although various formats are acceptable, the following is a guideline for chronologicallyorganizing your personal information. Most funding agencies require a personal data sheet foranyone owning twenty percent or more of the business.

Goal ClarificationRealistic, but challenging goals, should be written to help clarify thinking about what
the business will do for you and your customers in the future.
Decision-MakingBusiness owners often have difficulty making decisions. Working through the steps
helps analyze opportunities for choosing alternatives to achieve desired goals. Stating theproblem in the form of a question increases possible alternative solutions. The followingworksheet will prove helpful as you consider what business to start or how to expand anexisting business.
Personal Financial InformationIf you plan to present your business plan to potential lenders, include personal financial
information on anyone owning 20% or more of the business:
• Pertinent tax records, including tax returns for the past three years.• An up-dated (no older than 30 days) net worth statement.
Throughout this section critical questions will be asked, followed by suggestedsources to use while searching for answers.
Preparation
Be creative in your approach and use as many resources as possible to collectinformation.
⇒ Key questions to consider:What products or services should be offered?What is unique about the products or services?What will the products or services do for customers?What will they do in the future that they do not do now?Why will each product or service be necessary to the success of business?
Market Evaluation
What information needs to be gathered?
Defining and evaluating the market is an essential task that may involve considerabletime and effort to establish a probable demand for the product or service. There are manymethods and approaches for gathering up-to-date market information. Be alert for creativeopportunities!
What geographic area will the market include?
The target market (or market segment) is composed of customers to whom theproducts or services have the most appeal. For example, if analyzing the market for a

janitorial business, segments of the market might include prospective new home buyers, asubdivision where new homes are being built, or an area where expensive homes are located.
⇒ Key questions to consider:
What geographic area will the market include?What is the market population?What are the population characteristics? Age? Sex? Income? Education? Employment?Employment Trends? Occupation? (if you used these to define your market.)
Sources to Use:• County and City Extra• Survey of Buying Power. Demographics USA• Lifestyle Zip Code Analyst• Sourcebook of County Demographics• Census Data• State Department of Employment Security
What portion of the population is seasonal (employees and tourists)?How many tourists will visit your state or region?
Sources to use:• U.S. Travel Data Center • Regional Planning Commissions• Economic Development Professionals• Chambers of Commerce• Tourism Professionals
What are the development plans of the community? Will plans change traffic flow orshopping patterns? What business and residential developments are planned?
Sources to use:• City and County Planners• Industrial Development Groups• Chambers of Commerce• Economic Development Professionals• Realtors
How much money is being spent in the market area for the potential product or service?
Sources to use:• Survey of Buying Power. Demographics USA.• Census of Service Industries• Census of Retail Trade• State Department of Revenue (Sales Tax)

• Census of Manufacturing• Trade Associations What are major industry trends?
Sources to use:• Industrial Outlook• Encyclopedia of Associations• Survey of Current Business (monthly)• Wholesalers and Manufacturer Suppliers
Trend information is usually stated on a national or regional level. Therefore, adecision to enter or not enter a particular business should never be made solely on trends inthe industry.
Competition AnalysisOnce the market has been identified and evaluated, it is important to consider
competition. Understanding competitors helps project sales, avoid surprises, decreasereaction time, and understand your own business (or proposed business) better. Aftercompetition information has been compiled and evaluated, develop strategies for competing.For example, if competitors' emphasis is on a variety of products or services, specializationmight be an effective approach. For an analysis, consider the following questions:
⇒ Key questions to consider:Who are they? Where are they?How many and how strong are they (aggressive and well-managed)?Do they have one product line or a variety of products?What are their terms of sale?Are their prices higher or lower than industry average?What distribution channels do they use?Who is their target audience?What media do they use?What is their service reputation?
Sources to use:• Census of Retail Trade • Trade Associations • State Business Directories• International Directories• County Business Patterns• Business Directories• Yellow Pages

Market ShareMarket share is an allocation of total sales of similar businesses. Utilize results of the
market evaluation and competition analysis to realistically estimate if there is room for another"like" business.
Marketing StrategyMarketing involves activities necessary for getting and keeping customers. A carefully
conceived and executed marketing plan, focusing on the customer, is a major contribution tobusiness success. Develop your overall marketing strategy by considering how theproduct/service will help the customer.
LocationThe type of product or service offered will often influence how accessible you need to
be to your market. Once the market is defined and competition has been identified andanalyzed, site location becomes easier. Choose your location carefully. Answering thefollowing questions will help in choosing a location with the best advantages.
⇒ Key questions to consider:Is it properly zoned for the type of business? For an anticipated expansion?How near is the location to other stores, offices, plants, competitors?What is the cost (be cautious about making a decision on cost alone)?Is there an existing lease? If so, what are the terms?Will it be suitable for business?How convenient to transportation?Is there adequate parking?Does it have easy access and exits?Will it require improvements? If so, to what extent?Do building(s) aesthetics and operations enhance the surrounding environment?
Sources to use:• Transportation Departments (city, county, state)• Chambers of Commerce• Industrial Development and Planning Commissions
PersonnelIf there is a need to hire employees, it is important to consider the following questions:
⇒ Key questions to consider:What are the job responsibilities? (job description)What skills are needed to perform the job? (job specifications)What is labor availability?What training plan will be implemented?What are projected salaries?

Sources to use:• National Trade and Professional Associations of the U.S.• Occupational Outlook Handbook• American Salaries and Wages Survey• American Directory of Organized Labor• Employment Agencies• Community Colleges (on-the-job training) Insurance
Insurance has become a major cost to both new and existing businesses. It isimportant to obtain cost estimates from reputable firms. Liability insurance costs vary andmay prove prohibitive for some types of businesses. Keep in mind that the purpose ofinsurance is to protect assets against unlikely, but potentially devastating, losses.
What types and how much will be needed?
Sources to use:• State Department of Insurance• Best's Key Rating Guide: Property/Casualty Edition• Local Insurance Agencies
TaxesThere are federal, state, and local taxes that must be paid by a small business.
Estimated tax expense should be listed on the income statement.
SuppliersIdentify appropriate suppliers that meet desired criteria.
Political and Legal AspectsInsure compliance with the law by checking with proper authorities. Modify the
business idea, if necessary, to conform to county, city, state, or federal regulations.
Are there any zoning laws affecting chosen location?
Sources to use:• City and County Clerk
Are there any building requirements?
Sources to use:• Building Inspector, Fire Marshall
Are there any health restrictions?

Sources to use:• Local and State Health Department
Are there any licensing or registration requirements?
Sources to use:• State Department of Professional Regulation• Appropriate City and County Departments
Is there a need to apply for patent, trademark, or copyright protection?
Sources to use:• Patent and Trademark Office
What laws or regulations affect your proposed business? (OSHA, Labor Laws, EPAregulations, etc.)
Sources to use:• Appropriate State and Federal Agencies
What form of ownership (sole proprietorship, cooperative, partnership, or corporation)?
Sources to use:• Accountant, Attorney
InventoryInventory planning and control is important in projecting cash flow and its impact on
day-to-day survival. Turn-around delivery time is very important to help avoid carrying toomuch or too little inventory. Good inventory control increases collection on sales and reducestheft.
⇒ Key questions to consider:What inventory, raw materials, and supplies will be needed?How will potential or actual shortages be avoided?Are prices likely to be steady or fluctuating?What overall plans need to be made?
Projections
This section provides a "reward" for your previous hard work and dedication. Youwill now be able to organize, summarize, and simplify collected information in a meaningfulway. Your factual information provides justification for the figures you will use in financialprojections. The answer to the question, "Does my idea have a chance for success?" shouldbecome evident in this section.

1. Sales and Revenue Forecast2. Pro Forma Income Statement3. Pro Forma Balance Sheet4. Cash Flow5. Accounting Methods6. Capital Needs7. Break-Even

DIETARY DEVELOPMENT FOR NEW SPECIES
Paul B. BrownPurdue University
Department of Forestry and Natural ResourcesWest Lafayette, IN 47907-1159
Introduction
Optimal nutritional intake is vital for the health and well-being of all animals.Ingestion of food provides the necessary nutrients for development, growth, and reproductionof animals as well as maintenance of vital functions during these important life history stages.Those functions include all aspects of physiology and biochemistry, including diseaseresistance. Thus, developing optimal diets for the target species is an important step in theevolution of an aquaculture industry. Nutritional research with fish began in the 1940’s andcontinues to this day with the established aquacultural species. Nutritional research, ordevelopment of diets for hybrid striped bass, yellow perch, bluegill, walleye or crayfish beganonly in the last 10 years. We do not have optimal diets for these new species.
Feed costs are often the highest annual variable cost in aquaculture simply from thestandpoint of dollars per pound of feed purchased in a given year. When we apply a moreimportant unit to fed costs (dollars per pound of weight gain in the target species), minorchanges in cost per pound of feed and feed conversion ratios can have profound impacts onoverall economic viability of an aquaculture operation.
In this presentation, I will attempt to explain our current level of understanding of feeddevelopment in fish and crustaceans and our approaches to rapidly developing diets for newspecies. Recent pertinent information developed through the North Central RegionalAquaculture Center will be used as a foundation for this presentation.
Dietary Formulation
There are two vital pieces of information needed to formulate a diet for an animal; thenutritional requirements and availability of the nutrients from the chosen ingredients. Forcatfish, trout and salmon, tilapia, common carp, Japanese eel, and red sea bream, most of thenutritional requirements have been quantified; not all of them, but most. For new culturespecies, very few nutritional requirements are known. If all nutritional requirements foranimals, and particularly fish, were the same, we would not need to laboriously developprecise requirement data for each new species. However, there is a good deal of variability inrequirement data and no general consensus that all are the same.
The second piece of information required for formulation is the availability of nutrientsfrom the chosen ingredients. There are very few data of this nature for any of the species usedin aquaculture. Data developed thusfar include digestibility of the macronutrients (crudeprotein, energy, lipid and carbohydrates), digestible, or available amino acid data for threespecies, available phosphorus data for several species of interest and availability of selectedcritical nutrients such as new chemical forms of vitamin C.
The presentation will include recently developed data with hybrid striped bass, yellowperch, and bluegill demonstrating how practical diets formulated to meet the requirements of

catfish and trout give highly variable results when fed to the new species in the North CentralRegion (NCR).
The approach used to rapidly develop diets for new culture species is simple. First,experimental diets are identified that result in excellent growth of fish. Secondly, criticalnutritional requirements are quantified. Then, the third step is to evaluate the ability of feedingredients to meet those requirements. Examples from several new culture species will bepresented.
Acceptance
Acceptance of feed is another critical consideration. Even if we formulate a diet thatmeets the requirements of the target species and takes into account availability of nutrientsfrom the ingredients, poor acceptance of the diet will result in poor growth, slower time tomarket size and impaired cash flow. Several of the species of interest in the NCR are finickyeaters; that is, they will not eat just any dietary formulation. Fish meal is an importantingredient in diets fed to hybrid striped bass, but fish oil does not elicit a feeding response. Inour first series of studies, fish meal needed to be incorporated at 7-10% of the dry diet forhybrid striped bass. In more recent studies with larger fish, fish meal-free diets were accepted,but growth was impaired. Thus, there are often age-related changes in various nutritionalconsiderations. Bluegill and yellow perch have also proven finicky eaters, but preciserecommendations for feed formulation have not been developed. Flavor additives,compounds that can be incorporated in small quantities in the diet, are under investigationwith most of the species of interest in the NCR.
Recommendations
So, must you become a fish nutritionist to successfully raise fish? Absolutely not.However, you must be aware of the state of our knowledge in formulating feeds for newculture species and you should follow some relatively simple recommendations.
First and foremost, use a feed with proven responses in the target species. Currently,these will be from feed evaluations conducted in a laboratory setting under precisely definedconditions and constant water quality characteristics. Under these conditions, the onlydifferences in growth will be due to different feeds. Many people are concerned that resultsfrom these types of studies are not applicable because practical fish rearing is done on a largerscale, at higher densities, and varying water quality conditions. While these concerns are oftenaccurate statements, the feed evaluations are still quite meaningful for practical use.Acceptance of feed formulations and growth under laboratory conditions provide the mostprecise information we can develop. There are rarely problems extrapolating these data toproduction operations. Several of the factors known to influence data from laboratory studiesare known and can be considered prior to feeding your first fish.
Secondly, feed costs are one of your highest annual variable costs. Thus, this is animportant consideration in any business plan. You should be less concerned about the cost offeed expressed as dollars/pound of feed, and more concerned about cost expressed asdollars/pound of fish fillet grown. This requires knowing the feed conversion ratio and theconcentrations of fat and muscle resulting from a particular feed. Again, a good qualitylaboratory study will provide these data.

There are a number of people working in the area of fish nutrition in the NCR. Talk tothem. Information of this nature is usually free.
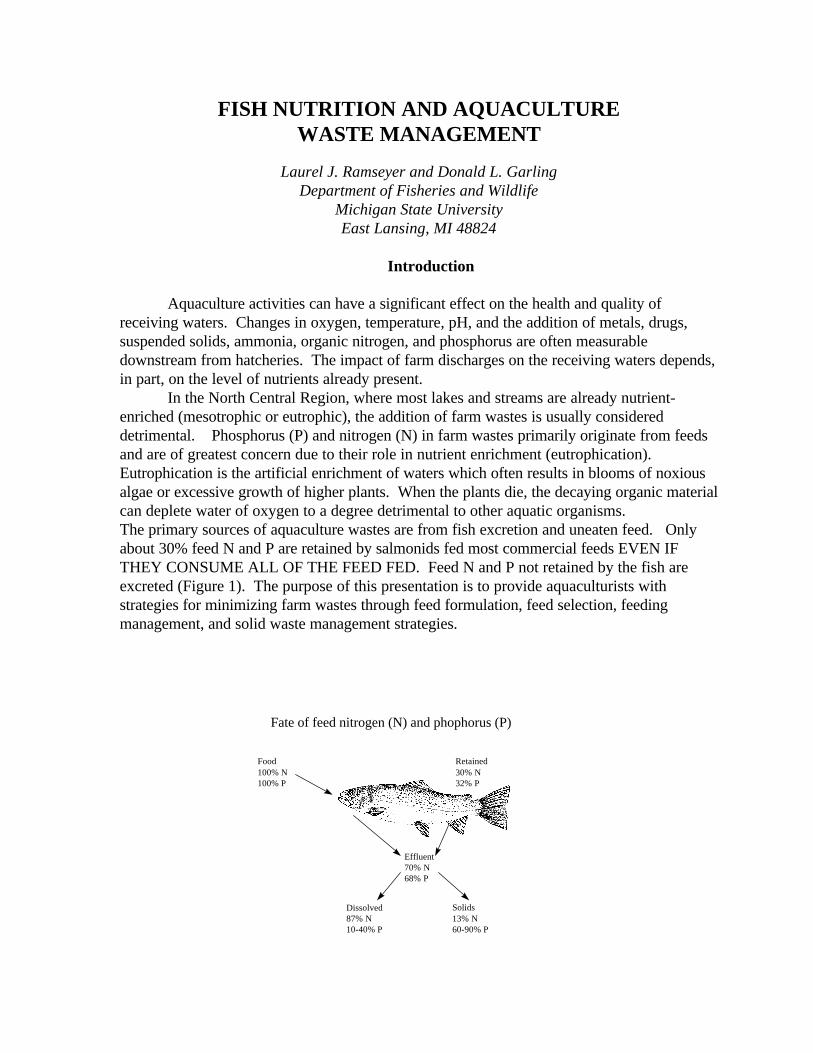
FISH NUTRITION AND AQUACULTUREWASTE MANAGEMENT
Laurel J. Ramseyer and Donald L. GarlingDepartment of Fisheries and Wildlife
Michigan State UniversityEast Lansing, MI 48824
Introduction
Aquaculture activities can have a significant effect on the health and quality ofreceiving waters. Changes in oxygen, temperature, pH, and the addition of metals, drugs,suspended solids, ammonia, organic nitrogen, and phosphorus are often measurabledownstream from hatcheries. The impact of farm discharges on the receiving waters depends,in part, on the level of nutrients already present.
In the North Central Region, where most lakes and streams are already nutrient-enriched (mesotrophic or eutrophic), the addition of farm wastes is usually considereddetrimental. Phosphorus (P) and nitrogen (N) in farm wastes primarily originate from feedsand are of greatest concern due to their role in nutrient enrichment (eutrophication).Eutrophication is the artificial enrichment of waters which often results in blooms of noxiousalgae or excessive growth of higher plants. When the plants die, the decaying organic materialcan deplete water of oxygen to a degree detrimental to other aquatic organisms.The primary sources of aquaculture wastes are from fish excretion and uneaten feed. Onlyabout 30% feed N and P are retained by salmonids fed most commercial feeds EVEN IFTHEY CONSUME ALL OF THE FEED FED. Feed N and P not retained by the fish areexcreted (Figure 1). The purpose of this presentation is to provide aquaculturists withstrategies for minimizing farm wastes through feed formulation, feed selection, feedingmanagement, and solid waste management strategies.
Fate of feed nitrogen (N) and phophorus (P)
Food100% N100% P
Retained30% N32% P
Effluent70% N68% P
Dissolved87% N10-40% P
Solids13% N60-90% P

Feed Formulation
Interest in the culture of many fish species, such as yellow perch and sunfish, has outpaced research on their nutritional requirements. As a result, aquaculturists often must feedcommercial feeds which were formulated for other fishes like trout and catfish. This strategyis generally successful in terms of growth and fish health, but may result in unnecessary wastewhen dietary nutrients exceed the species requirements.
Commercial feeds are often formulated to contain a slightly higher level of a nutrientthan is required by the species for maximum growth. The extra nutrients are added to feedsbecause few if any feed ingredients are completely digested and absorbed and serves as asafety margin to insure that requirements for maximum growth are met. Unfortunately, thesesafety margins contribute, in part, to the production of excess wastes in fish farm effluents.
NitrogenMost feed N is found in amino acids, the basic units of protein. Intestinal enzymes
break down feed protein into amino acids which are absorbed and used to build new proteinssuch as muscle. Excreted N comes from several sources, including undigested andunabsorbed dietary protein, sloughed intestinal cells, amino acids absorbed in amounts greaterthan the fish can utilize, and degraded metabolic products.Undigested and/or unabsorbed proteins are excreted in the feces. Fecal N can be reduced bydeveloping feed formulations that meet the specific species requirements and feedingpractices. However, most of the N excreted by fish is lost through the gills and is notrecoverable. Excreted gill N originates from absorbed but unused amino acids and degradedmetabolic products. Because excreted gill N is in dissolved form, balancing amino acidprofiles to fit the specific species requirements and avoiding over-feeding are the best ways tominimize excreted gill N. Typical losses of metabolic N range from 100-200 mg N⋅kg fish-
1⋅day-1 in salmonids and are unavoidable.Since most N is excreted in dissolved form, typical management practices to control
farm solids, like siphoning or solids settling areas, are not effective in reducing effluent N.Reducing the amount of excess N introduced into the system as feed is the only effectivemethod to control N in fish farm effluents. Therefore, feed protein quality and quantity areimportant factors to consider in controlling effluent N. Protein quality refers to the balanceand digestibility of dietary amino acids. There are 10 essential amino acids (EAA), whichmost fish cannot make and must obtain from their feed. A high-quality feed will supply theEAAs usually from high quality ingredients like fish meal and soybean meal. The ingredientsmust also be added in the proportion and quantity necessary to match the specific fish’srequirements for metabolism and muscle growth. Feeding the appropriate level of proteincomprised of amino acids balanced for another species results in increased effluentammonia-N.
Lower quality feeds may be formulated with larger amounts of a poorly-balancedprotein sources to meet the minimum EAA requirements. Similarly, feeds formulated with theproper EAA for one fish may not be properly balanced for other fishes. This results in theabsorption of some amino acids in amounts beyond the fish’s ability to utilize them for musclegrowth. When more amino acids are absorbed than the fish can utilize, the N is removed andexcreted via the gills as dissolved unionized ammonia (NH3).
Fish size, protein intake, and temperature all affect the amount of ammonia excreted.

Young, faster growing fry generally require feeds containing higher percentages of protein.Even though relatively little feed N is put into the system for first-feeders, a larger percentageof it will be excreted because nitrogen excretion is inversely proportional to fish weight.Increasing temperatures effect N excretion by increasing voluntary feed intake and foodmovement through the gut while decreasing nutrient utilization. This is a problem if feedingto satiation or using demand feeders. Fish will usually consume more feed than required foroptimal growth rate and nutrient utilization.
Some loss of N is unavoidable even when premium feeds are fed due to proteinturnover in the fish and because enzymes that break down proteins are always active in fish.However, protein utilization for non-muscle uses is minimized by substituting caloriessupplied as protein by calories from carbohydrates or fat. This is called protein sparingbecause fish will then use fat or carbohydrates rather than protein for energy needs, thussparing protein for muscle growth. High levels of dietary carbohydrate are usually nottolerated well by salmonids and should be avoided.
PhosphorusPhosphorus is found in all plant and animal feed ingredients. The availability of P
varies greatly depending on the source (Table 1). Excess dietary P is excreted in both solidand dissolved form (Fig. 1) and is therefore more amenable than N to solids collectiontechniques. However, feed-related P wastes can be minimized by using forms which arehighly available to the fish yet have low water solubility.
Table 1. Percent availability of phosphorus incommon feedstuffs.
Ingredient salmonid catfish carp
blood meal 81
brewer’s yeast 79-91 93
feather meal 77
poultry by-product meal 81
anchovy meal 40
herring meal 52
menhaden meal 87 39
rice bran 19 25
wheat germ 58 57
wheat middlings 32 28
ground corn 25
dehulled soybean meal 36 29-54

Most freshwater fish require 5-8 g P⋅kg-1 dry feed, but commercial feeds, because of theingredients used in formulation, typically contain 10 g P⋅kg-1 or more. Fish meal, used in mostfish feeds, contains bone which is a highly concentrated source of P, but it is not efficientlydigested by fish. Recent advances in fish meal processing technology enables the removal ofbone; however, this adds significantly to the cost of the meal. Soybean meal and other plantingredients contain phytin, a plant P storage molecule. Phytin P is poorly digested by fish andother animals with simple stomachs. The undigested phytin P is excreted with the feces intothe environment.
Feed Selection
Floating feeds should be used whenever possible. Floating feeds allow theaquaculturist to monitor fish feeding activity. In addition, floating feeds may be more water-stable than some sinking pellets. However, sinking feeds are generally less expensive thanfloating feeds and some fish species may be reluctant to actively feed at the surface.
It is good practice to feed the largest pellet size which is acceptable to the fish. Fishexpend less energy during feeding if their feed needs are met by fewer, larger pellets. Largerpellets also have a smaller surface-to-volume ratio than smaller pellets which reduces the rateand amount of nutrients that leach into the water before the pellets are consumed. Feed ‘dust’and particles too small to be consumed by the fish should be screened out prior to feeding. Ahigh quality feed will contain < 1% fines.
Researchers and feed manufacturers are looking for improved feed binders andalternate processing techniques to improve feed stability. Certain feed binders may alsoimprove fecal stability in water, thereby increasing the efficiency of solids removal.
FreshnessFeed bags should be checked for the expiration date. Care should be taken to avoid
feeding older feed. Many key ingredients such as vitamins are unstable beyond the timedesignated by the manufacturer. Fish will not fully utilize the feed if it is deficient in nutrientsdue to break down over time which will increase the amount of waste produced by your fish.Most manufacturers recommend storing feeds in cool, dry conditions to maximize their shelflife. If feed is not purchased directly from the manufacturer, the purchaser should verify withthe retailer that the feed had been stored properly.
Feeding
Poor feeding management can be an important source of farm wastes. Even perfectlyformulated feeds will result in excess effluent nutrients if fish are over fed. Most feedmanufacturers suggest feeding rates for their different feeds based on fish size and watertemperature. Feed tables have also been published in National Research Council (1993) andPiper et al. (1982) for trout and catfish.
If given the opportunity, fish generally will consume more feed than they can useefficiently. For this reason, demand feeders should be avoided except under specialcircumstances such as feed training. If a demand feeder must be used, the amount of feed
provided daily should be limited to feeding table values or established daily feeding rates forthe farm.
Feeding schedules should be designed to account for fish behavior. Factors that affectof active feeding, such as light sensitivity or time of day, may influence feeding efficiency.
Estimating Nutrient Loading
The amount of N and P released in farm effluents is often estimated using watersamples. The concentration of nutrients in farm effluents fluctuates frequently due tomanagement practices and nutrient interaction with the air, bacteria and algae, and sediments.Since water sampling is expensive, samples may not be tested often enough to accuratelyreflect farm nutrient discharges.
Alternately, N loading may be calculated based on fish weight gain. Using thismethod, fish protein gain, based simply on weight gain, is mathematically translated into Ngain. Subtracting the amount of N gained by the fish from the amount of N fed results in an Nloss estimate. This simple calculation is possible because the amount of protein (or N) in afish is directly related to its weight (Ramseyer and Garling, unpublished data).If fish are excessively fatty, N lost will be underestimated. If final weights of individual fishare not similar or normally distributed about the mean, calculations must be made forsubgroups of similarly sized fish.
Solid Waste Removal
Control of solid waste is important to reduce the level of P in fish farm effluents.Approximately 80% of the P in wastes from aquaculture is in solid form as feces or uneatenfood. Intact fish feces and uneaten feed settle rapidly; but, can be easily broken into fineparticles by fish movement and management activities. Solid wastes can be removedefficiently from hatchery raceways if the raceway and settling areas are properly designed.For example, raceway baffles or tube raceways can efficiently move solids to the settlingareas. Settling areas must be physically separated from the fish and solids removed regularly.Significant amounts of P and other nutrients may leach from small fecal fragments within anhour because of the increased particle surface-to-volume ratio. Smaller fecal fragments mayremain suspended in the water and may be too small for removal by filtration.Collected raceway solids have a potential use as fertilizer. They are a slurry, containingapproximately 80% water, which can be pumped from the raceway or settling basin. Themethods and timing of application of fish farm solids to fields are important to ensure that thenutrients do not pollute surface waters. For example, fish farm wastes should not be appliedover frozen ground or fields during heavy precipitation. Application of fish farm wastes maybe regulated by states and may require permits. Check with your state Department ofAgriculture for applicable regulations.
Eforts to recapture dissolved or suspended nutrients from farm effluents have includedthe production of other economically important aquatic species such as agar-producing algaeand mussels. In the North Central Region, diverting nutrient-rich effluents into secondarycrayfish or baitfish ponds may be effective in reduce waste products while providing anadditional crop.
Wetlands have been used as ‘biological sponges’ to remove nutrients from water byslowing the water which allows solids to settle out and wetland vegetation to absorb nutrients.

Aquaculture facilities located on or adjacent to traditional agricultural fields may be able totake advantage of the Wetlands Reserve Program managed by the Agriculture Stabilizationand Conservation Service. The Wetlands Reserve Program takes agricultural land out ofproduction through payment to landowners for permanent conservation easements. However,if the amount of solid wastes produced by a fish farm exceeds the capacity of the wetland toprocess the material, the wetland will fill in and loose its effectiveness. Certain types ofendangered and threatened natural wetlands communities may also be adversely affected bythe addition of fish farm wastes.
Bibliography
National Research Council. 1993. Nutrient requirements of fish. National Academy Press.Washington, D.C. 114p. (Available from: National Academy Press, PHONE: 202-334-3313).
Piper, R.G., McElwain, I.B., Orme, L.E., McCraren, J.P., Fowler, L.G. and J.R. Leonard. 1982.Fish Hatchery Management. United States Department of the Interior Fish and Wildlife Service,Washington, D.C., USA. (Available from: American Fisheries Society, PHONE: 412-741-5700).

BASIC NUTRITIONAL RESEARCH-WHAT DOES ITMEAN FOR THE FARMER?
Konrad DabrowskiOhio State University
School of Natural ResourcesColumbus, OH 43210
Introduction
In most aquaculture operations today, the cost of food accounts for one-half of theproduction of fish. This means that small savings in the cost of food can make aquacultureenterprises profitable. However, the costs of food cannot be compromised with decreasedamounts of essential nutrients, nutrients availability, or unbalanced composition of nutrients.The requirements for optimum growth, survival and health of animals set the limits of"economic" diet formulation.
The nutrient requirements are determined (in most cases) for aquatic species in thegrow-out phase and with respect to nutrient concentrations in the diet, rather than in the dailyrecommended allowance. With this in mind, intake for maximum growth of larval and juvenilefish, that have significantly elevated metabolic rates, will require higher nutrient concentrationsthan older (larger) fish.
Dietary Requirement
Fish require three macronutrients, proteins, fats and carbohydrates, along with manysubstances and elements classified as micronutrients. Some nutrients are called indispensable(essential) because they are not synthesized in the body, whereas others are interchangeable asenergy sources.
In general proteins do not impose metabolic blocks in fish, because these animalsexcrete ammonia as their final catabolic product in protein metabolism. Therefore, utilizationof proteins in fish is extremely efficient and they can afford "high return rates of free aminoacid pools" to protein synthesis (Cowey and Luquet, 1983). The high levels of free aminoacids in body fluids of fish result in regulatory mechanisms which frequently incapacitate theutilization of dietary free amino acids. Consequently, similarly to some carnivorous mammals(kittens) fish are probably susceptible to amino acid "toxicity."
There is some evidence to conclude that the requirements of essential amino acidsreported for various fish species are in reasonable agreement (National Research Council,1993). However, differences frequently in the range of 25-35% among single amino acids, aswell as discrepancy in estimation by various investigators (arginine example in salmonids)suggest that much work need to be done. Some examples of African tilapias with the activeurea cycle pathway, would suggest that these species would not require dietary arginine, asmost mammals.
At present, the protein requirement values for all fish range from 35 to 55%. This issynonymous with high protein quality found, at least in part, in fish meal or semi-purifiedprotein sources.
Recent evidence by Norwegian researchers indicated that lipid levels of 25-30% insalmon diets have a beneficial effect on growth and reduction of dietary protein needs. Fish, incommon with other vertebrates, have no capability for synthesizing polyunsaturated fatty acids(18 and longer carbon chains). There are also dramatic differences among fish, for instancefreshwater pike (Esox lucius) are incapable of elongating and desaturating linoleate andlinolenate (18 carbon unsaturates) (Henderson et al. 1995).
Vitamin requirements differ in respect to the systematic position of fish; for instanceChondrostei (sturgeon and paddlefish) do not require dietary vitamin C, in direct contrast toall (in the author's opinion) bony fishes (Teleostei). Dietary supplements of some vitamins infish species with intestinal bacterial flora have proven to be inessential (folate in common carp;cobalamine in catfish and tilapia). However, there is a universal agreement that larval fish dietsneed to be supplemented with all vitamins.
Missing Information
There is a major gap in our understanding of "native" and "denaturated" proteinutilization in fish intestine during ontogeny. The partitioning of activity of pancreatic and/orbrush border enzymes in the process of absorption/digestion in larval fish is not understood.This may be a primary reason for our inability to raise larval fish of many species. Inconclusion, a new dimension to our understanding of protein and amino acid composition ofdietary protein is required.
How much "is enough but not too much" (Diamond, 1991) in respect to concentrationof single nutrient and possible interactions? An example with vitamin A (Dedi et al. 1995) isprobably the first in the series of side effects due to active molecules. The vitamin Ahypervitaminosis in larval diet of hatchery-reared Japanese flounder resulted in growthdepression and high incidence of bone deformity.
The role of nutrition, vitamins deficiencies in particular, on gene expression, in case offolate deficiency leading to DNA strand breaks (chromosomal breakage) in vivo, may provedecisive in resistance to infectious diseases, stress and cancer in fish.
Recommendations
There are limitations in identifying nutrient requirement for "new" aquatic species ofinterest to aquaculture. An analogy can be made based on "warm-water" or "cold-water"biology (ontogeny) of the species. A less successful approach would be to tune requirementsto feeding habits of fish (Dabrowski, 1993).
References
Cowey, C.B. and Luquet, P. 1983. Physiological basis of protein requirements of fishes. Criticalanalysis of allowances. In: IVth Intern. Symp.Protein Metabolism and Nutrition, Clermont-Ferrand, France, pp. 365-384.
Dabrowski, K. 1993. Ecophysiological adaptations exist in nutrient requirements in fish: True orfalse? Comp. Biochem. Physiol. 104A: 579-584.
Dedi, J., Takeuchi, T., Seikai, T. and Watanabe, T. 1995. Hypervitaminosis and safe levels of vitamin

A for larval flounder fed Artemia nauplii. Aquaculture 133: 135-146.
Diamond, J. 1991. Evolutionary design of intestinal nutrient absorption: enough but not too much.News in Physiol.Sci. 6: 49-60.
Henderson, R.J., Park, M.T. and Sargent, J.R. 1995. The desaturation and elongation of 14C-labelledpolyunsaturated fatty acids by pike (Esox lucius) in vivo. Fish Physiol.Biochem. 14: 223-235.
National Research Council, 1993. Nutrient Requirement of Fish. National Academy Press,Washington, D.C.
WHAT THE FUTURE FISH FARMERSARE LEARNING IN SCHOOL
Chad NunleyArea 30 Career Center
Greencastle, IN
Since the promotion of aquaculture education by the National Council for AgricultureEducation in 1989 through a project funded by the USDA, aquaculture has become an integralpart of many secondary Agri-Science programs throughout the United States. The purpose ofinfusing aquaculture into the high school curriculum was not to produce fish farmers but touse this subject area to incorporate more principles of science and math, utilize hands onactivities, and increase student interest in the agriculture curriculum. Many agricultureprograms were threatened with extinction unless more students enrolled and aquacultureeducation was seen as an avenue to increase student awareness. Because of its uniqueness tothe classroom and appeal to educators, administrators and most importantly the students,many schools have adopted aquaculture education.
Results of the 1995 survey revealed the extent to which aquaculture was being infusedinto the agriculture curriculum. Approximately 1700 teachers in thirty four states wereteaching aquaculture to more than fifty thousand students. We expect, from conversationswith teachers from across the US this past year, that these figures have increased dramaticallyif not doubled. A new survey is in progress and should be completed by late 1997. Indianaalone has between 30 and 40 schools involved in teaching aquaculture.
Since its inception into the curriculum at South Putnam High School in 1991, studentenrollment has remained steady after an initial increase. The program continues to enrollapproximately twenty give percent of the high school population. Unlike many agricultureprograms, students at South Putnam are able to enroll in aquaculture (animal science) forthree years. Students from all of the Putnam County schools are also able to enroll in a twoyear vocational aquaculture program through the Area 30 Technology Center. A variety ofdifferent methods are utilized to teach animal science through aquaculture
Tilapia is the choice for most school programs and most schools utilize recirculatingsystems. At South Putnam students are taken through the production cycle from reproductionthrough marketing. Principles of animal science from nutrition to physiology and anatomy areexplored by the students. Considerable time is spent on water quality in recycle systems aswell as in pond and river systems. Recirculating system function, design, construction andmanagement are also examined. The importance of accurate record keeping is stressed.Computer application in aquaculture is also a primary focus. Students are exposed to avariety of important aquaculture species such as hybrid striped bass, yellow perch andlargemouth bass and various tropicals including angelfish, African cichlids and goldfish.Integration of fish and plant culture is also covered during the course. An unlimited numberof subject areas can be covered in the lab and many teachers at South Putnam utilize the labduring the school year.
As one of the six regional aquaculture learning centers (IN, IA, PA, SC, TX, WA), weconduct two to three workshops per year for beginning and advanced aquaculture instructorsfrom throughout the U.S. Our program is also fortunate to have received a value-added grantfrom the state of Indiana to build a mobile aquaculture laboratory. This mobile lab was

constructed to transport to other schools and special events (fairs, farm shows, FFAconventions) to outreach, promote and educate students and individuals throughout Indianaand beyond about aquaculture. We are also working with inner city schools in helping set upand maintaining aquaculture programs within their schools.
The Council is continuing to update curriculum materials and is currently developingbiotechnology and sustainable agriculture curriculums as they relate to aquaculture. Thecontinued support of the National Council for Agriculture Education and USDA will no doubtgreatly impact the future of aquaculture education. Many new programs are being institutedevery year and this growth will continue as long as the industry maintains its current level ofgrowth. An educated public, however is the real key to successful aquaculture programs,especially in states where aquaculture is not a large industry. Parents must realize thatstudents don’t necessarily enroll in aquaculture to become aquaculturists, but once in classthey become aware of the potential jobs which relate to the industry. The future of ourindustry will no doubt be influenced by those currently enrolled in a high school aquacultureprogram.

HOW DO I KNOW IF I HAVE SICK FISH...ANDWHY ARE THEY SICK ?
M. Randy White, DVM, Ph.D.Diplomate, ACVP, Asst. Director
Animal Disease Diagnostic Laboratory1175-ADDL
West Lafayette, IN 47905-1175
Introduction
For any fish producer, one of the greatest challenges is to produce wholesome healthyfish and/or fish products for the marketplace. To accomplish this goal, the fish must bedisease-free. This text will help the fish producer: (a) identify evidence of disease in fish, (b)understand the mechanisms involved in stress as well as disease processes, and (c) provideexamples of pathogens which cause disease.
Understanding symptoms versus clinical signsSymptoms are a group of processes which describe how an individual feels when they
are not healthy. These symptoms can be related to the health care professional, such as aphysician or nurse to help that professional “target” specific organ systems which mayestablish a diagnosis. For example, if you have a respiratory illness, such as a cold or “flu”bug, you may describe such symptoms as: difficulty breathing, coughing, “rattling sounds inyour chest”, wheezing, sneezing, etc. Clinical signs, on the other hand, are words or phraseswhich describe your observations of a population of non-healthy animals. For fish, this mayinclude things such as: “flashing”, i.e., the turning over of the fish as they swim, exposing theirwhite underside, “piping”, the process of coming to the surface and “breathing”. Othercommon clinical signs may include: anorexia, i.e., the lost of appetite and food intake,lethargy, i.e., listlessness, failure to swim aggressively in the water. Other clinical signsinclude erratic swimming patterns or a loss of fright response. It is important to understandthe difference between symptoms and clinical signs in order to “target” the possible organsystems affected when dealing with sick fish.
LesionsThis is another important term which must be understood in order to arrive at a proper
diagnosis. Simply stated, a lesion is “any abnormal tissue”. Most commonly we use this termto describe diseased tissue. Lay terminology such as “pus”, “goop” or “crud” (heaven forbid)is ambiguous and therefore has different meanings to different individuals. Examples oflesions include: ascites, which is the accumulation of fluid within the abdominal cavity of fish,exophthalmos, which is the bulging of eyes of the fish and may involve only one eye(unilateral) or both eyes (bilateral). Ascites and exophthalmos are probably the two mostcommon lesions observed in sick fish. It is important to realize that these common lesionsare not diagnostic for any particular disease process, i.e., they only alert you to the fact thatthere is a disease process. Other common lesions include: hemorrhage and/or congestion,cutaneous erosions and/or ulcerations, gill necrosis, abscesses (or abscessation) andgranulomas.

StressMost fish are, by nature, very healthy animals, and in order for fish to become ill, they
must first be stressed. Stress to you and I may include: working very long hours under poorwork conditions, or the in-laws “dropping in for a visit” and staying too long, etc. Stress for afish is a physiologic state caused by a procedure, environmental or other factor whichinterferes with the fish’s ability to grow to market size at the expected rate. If the fish isstressed for an extended period of time, it may become sick or diseased due to infection bypathogens.
Effects of stress upon fishStress measurements can be divided into primary, secondary and tertiary effects. The
primary effects occur instantly and include an increase in the plasma level levels ofcorticosteroids, as well as an adrenergic response with a resultant increase in plasma levels ofcatecholamines, specifically, epinephrine and norepinephrine. The secondary effects occurmore slowly as compared to the primary and include: (a) abnormal (increased or decreased)blood glucose/lactate levels, (b) abnormal (increased or decreased) plasma free fatty acids, (c)decreased numbers of circulating lymphocytes (i.e., lymphopenia), (d) decreased total watercontent, and (e) increased heart and gill blood flow rate. The tertiary effects are those whichare most likely to be noticed by the fish producer and include: abnormal behavior, abnormalfeed consumption, decreased feed conversion efficiency, decreased growth rates, andincreased disease incidence and mortality rates.
StressorsThese are the processes or mechanisms by which fish become stressed. They can be
categorized into the following: (a) poor water quality, (b) environmental conditions, (c)individual factors, and (d) pathogens.
Poor water quality can have the effect of producing chronic stress upon fish or if thewater quality changes abruptly in a short period of time, a high death loss may occurimmediately. For example, temperature fluctuations of a few degrees may go completelyunnoticed in a tank situation but may provide a source of chronic stress for the fish, whereasfish in a pond which has temperature stratification may die rapidly following a thunderstormdue to the release of the dissolved oxygen from the pond. Other water quality conditionswhich can cause stress include: pH changes, nitrite toxicity, ammonia poisoning and improperhardness and/or salinity.
Environmental conditions which may cause stress include: overstocking and/orovercrowding, and in pond situations, predation by birds or other animals, as well asenvironmental contaminants/pollutants, such as heavy metals, particulates, hydrocarbons andsewage. Again, each of these factors may result in a chronic stress situation for fish, or maycause a rapid die-off of fish if the factors change rapidly.
Individual factors are another potential source of stress for fish, but they are probablythe least controllable. Individual factors include genetic considerations of the fish, such aswhether or not the fish are from an inbred line, an outbred line or hybrids. The potentialproblems which should be considered linked to the genetic traits of the animals include:temperature tolerances, genetic abnormalities, including severity and incidence of occurrence,etc. The immune status of the fish is probably the single most important factor related towhether or not a fish will be stressed and how the individual animal handles that stress. The
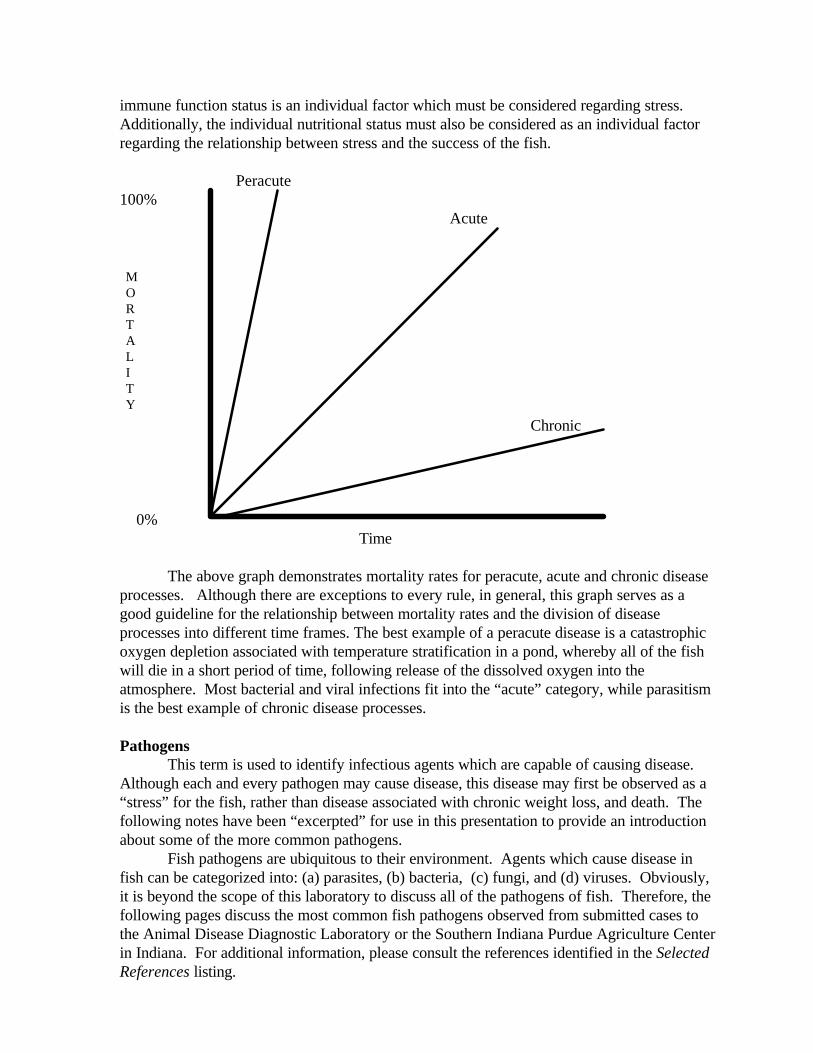
immune function status is an individual factor which must be considered regarding stress.Additionally, the individual nutritional status must also be considered as an individual factorregarding the relationship between stress and the success of the fish.
Peracute100%
Acute
Chronic
0%Time
The above graph demonstrates mortality rates for peracute, acute and chronic diseaseprocesses. Although there are exceptions to every rule, in general, this graph serves as agood guideline for the relationship between mortality rates and the division of diseaseprocesses into different time frames. The best example of a peracute disease is a catastrophicoxygen depletion associated with temperature stratification in a pond, whereby all of the fishwill die in a short period of time, following release of the dissolved oxygen into theatmosphere. Most bacterial and viral infections fit into the “acute” category, while parasitismis the best example of chronic disease processes.
PathogensThis term is used to identify infectious agents which are capable of causing disease.
Although each and every pathogen may cause disease, this disease may first be observed as a“stress” for the fish, rather than disease associated with chronic weight loss, and death. Thefollowing notes have been “excerpted” for use in this presentation to provide an introductionabout some of the more common pathogens.
Fish pathogens are ubiquitous to their environment. Agents which cause disease infish can be categorized into: (a) parasites, (b) bacteria, (c) fungi, and (d) viruses. Obviously,it is beyond the scope of this laboratory to discuss all of the pathogens of fish. Therefore, thefollowing pages discuss the most common fish pathogens observed from submitted cases tothe Animal Disease Diagnostic Laboratory or the Southern Indiana Purdue Agriculture Centerin Indiana. For additional information, please consult the references identified in the SelectedReferences listing.
MORTALITY

Protozoal Parasites
The majority of the fish parasites which cause disease in fish include protozoalparasites. Typically, these parasites are present in large numbers either on the surface of thefish, within the gills, or both. When they are present in the gills, they cause problems withrespiration and death will commonly occur when additional stressors are present in the aquaticenvironment. Protozoal parasites on the skin, fins or scales only, (i.e., not affecting the gills)usually do not result in death, unless they are accompanied by a secondary bacterial infection.The more common protozoal parasites are listed below.
Ichthyophthirius multifilis
This is probably the most common parasite of all fishes. The common name for thisparasite and disease is “Ich” or “white spot”. The mature parasite reaches approximately 1mm in diameter and is commonly observed in the gills and/or skin as coalescing white spots,hence the common name. The trophont or mature stage of the parasite has a large“horseshoe” shaped nucleus, and the entire surface of the parasite is covered in cilia. The lifecycle (Fig. 1) of this parasite is direct, but is spent, in part, off of the host. The trophont iswithin the epidermis of the host, until it leaves the fish, encysts and divides to produce manyhost-seeking tomites. The tomites penetrate the skin and gills of the fish to complete the lifecycle. The life cycle is temperature dependent with a shorter life cycle occurring at warmerwater temperatures.
Figure 1. Life cycle of Ichthyophthirius multifilis. (a) “White spot” on fish, (b) maturetrophont, (c), (d) divisions and (e) release of ciliated tomites. From Aquaculture forVeterinarians, edited by Lydia Brown.

Fish with a cutaneous infection will “flash”, i.e., turn over and expose their whiteunderside, whereas fish with a gill infection will “pipe”, i.e., come to the surface of the waterand “breathe” through their mouth. Gill lesions include epithelial hyperplasia with thepresence of mature trophonts within the gills. Cutaneous lesions also exhibit focal epidermalhyperplasia, with parasites being located beneath the hyperplastic epidermis. Trichodinia sp:
There are three genera which form the Trichodina complex: Trichodina, Trichodonella andTripartiella, however, all three are commonly referred to as “Trichodina”. All areapproximately 100 µm in diameter and have a saucer to “frisbee” shape and are ringed withcilia around its entire surface. They have a circular arrangement of tooth-like structures(denticular ring) within the body which provides them a characteristic appearance in fresh gilland skin cytology preparations (Fig. 2). Fish with severe gill infections of trichodina will haverespiratory and osmoregulatory difficulty and may “pipe” as well as “flash” if there iscutaneous involvement. Fin erosions and/or ulcerations can be observed in chronic cutaneousinfections. Diagnosis of this parasitic disease is dependent upon identification of the parasitewithin the skin or gill cytologic preparations or histopathology.
Ambiphyra sp
These are ciliated protozoal organisms which are thought to be free-living, but havebeen known to parasitize fish. They are sessile organisms with a cylindrical to conical bodywith oral cilia and a permanent motionless equatorial ciliary fringe (Fig. 3). They range in sizefrom approximately 60-100 µm and adhere to the epithelium of the skin and/or gills. Diseaseand death of fish have been associated with chronic infections of the gills due to mechanicalblockage of respiratory epithelium. Diagnosis of this parasite is dependent upon identificationof this organism within the skin or gill scrapings or histopathology.
Ichthyobodo sp
This parasite is also known as Costia sp. These are obligate flagellate parasites with adirect life cycle. The free-swimming form is renniform, and approximately 10-20 µm longwith two pairs of flagellae; whereas the attached form is pear-shaped and attaches to the gillsand skin (Fig 4.). Disease associated with this parasite includes increased cutaneous mucousproduction (hence the lay terminology of “blue slime disease”), epithelial hyperplasia of theskin and gills, ulceration and erosion of fins. This pathogen commonly causes disease insalmonid fry, resulting in high mortality. Diagnosis is dependent upon demonstration of theagent within affected fish by cytology or histopathology.
Hexamita sp
These parasites are pyriform to oval with tapering toward the posterior end.Occasionally, rounded individuals can be identified. The organisms are 6-8 µm wide and 10-12 µm long. They have three pairs of anterior flagella which are approximately one and one-half times the length of the body. The flagella originate from the blepharoplast at the anteriorend of the axostyles (Fig. 5). These organisms can reproduce by longitudinal binary fission aswell as undergo schizogony within the epithelial cells of the ceca or intestine. This parasitecauses disease within the gastrointestinal tract of fish and affected fish will have clinical signsrelated to malnutrition and emaciation. Diagnosis is dependent upon finding the parasite fromcytologic scrapings of the ceca or intestinal tract or histopathology of these organs. A poorly

understood parasite, thought to be Hexamita-like is thought to be responsible for FreshwaterHole-in-the-Head and Lateral Line Erosion (FHLLE).
Figure 4. Line drawings of Icthyoboda demonstrating key characteristics. From FishDisease, Diagnosis and Treatment, by E. J. Noga.

Chilodonella sp
This is a motile ciliated protozoal parasite which causes disease in the skin and gills offish. It is typically heart-shaped with the posterior end being broader and slightly notched. Itmeasures approximately 20-40 µm in width and 30-70 µm in length and its surface is coveredwith cilia. There is a large macronucleus in the posterior portion of this organism
and a smaller micronucleus is near or within the macronucleus (Fig. 6). This parasitehas been attributed to death of fish due to respiratory and osmoregulatory imbalancesassociated with severe gill parasitism. Diagnosis is dependent upon demonstration of theorganism within the affected organs by either cytology or histopathology.
Figure 6. Line drawingdemonstrating ventral view ofChilodonella. From Textbook ofFish Health, by G. Post.
Figure 5. Line drawing of Hexamita demonstrating characteristic features of eight flagella(three anterior pairs and one posterior pair) and pyriform to ellipsoidal shape. From FishDisease, Diagnosis and Treatment, by E. J. Noga.

Myxozoan Parasites
This is a very large group of parasites which can cause disease in a wide variety offishes. They are obligate parasites of tissue (histozoic forms that reside in intercellular spacesor blood vessels that reside intracellularly) and organ cavities. Key characteristics of theMyxozoa include development of a multicellular spore, presence of polar capsules in theirspores and endogenous cell cleavage in both the trophozoite and sporogony stages. Themethod of transmission of myxozoans is unknown, but evidence suggests that at least somepathogenic myxozoans have an indirect life cycle. This life cycle may require the completionof two different life cycles involving a vertebrate (fish) and an invertebrate (annelid) host witheach life cycle having its own sexual and asexual stages. Severe infestations by these parasitescan result in disease and/or death of the host fish. Each parasite is somewhat species specificas well as organ specific. A few of the more common myxozoan parasites are discussedbelow.
Myxobolus cerebralis
This parasite is known for causing “whirling disease” in salmonids. This is a chronicdebilitating disease which is very common in the Western U. S. and is uncommon in theMidwestern and Eastern U. S., although recent “outbreaks” have been reported in New York.The parasite feeds on cartilage of the axial skeleton and clinical signs are related to thisdamage. This parasite produces spores within the cartilage which are oval to circular andapproximately 7-9 µm in diameter and 6-7 µm long with a thick mucoid envelope on theposterior half of the spore (Fig. 7). Histologically, myxozoan parasites within the cartilage ofthe axial skeleton, with morphological characteristics of Myxobolus cerebralis, must beobserved to confirm the diagnosis.
Figure 7. Line drawing of Myxobolus sp. From Fish Disease, Diagnosis and Treatment, byE. J. Noga.
AurantiactinomyxonThis is currently thought to be the causative agent of “proliferative gill disease” of
catfish. This myxozoan parasite causes a rapid, severe, proliferation of the gill epithelium

which results in impairment of respiration and osmoregulatory function. The intermediatehost is thought to be a microscopic aquatic oligochaete worm, Dero digitata, which is foundin the mud and sediment in the ponds of affected catfish. Diagnosis is dependent upon thepresence of the parasite within swollen, clubbed proliferative gill lamellae, many of which arefractured due to the associated chondrodysplasia.
Henneguya sp
These parasites were once thought to be responsible for the “proliferative gill disease”of catfish, but are now thought to be less pathogenic, although they can cause respiratoryproblems if present in large numbers. They have a very characteristic paired, long, whip-likecaudal processes giving them a spermatozoan-like appearance. Size of spores range from 8-24 µm in length with the caudal processes being approximately 20-45 µm long (Fig. 8).Diagnosis is dependent upon observing the parasites within the histopathology of the gilllamellae.
Figure 8. Line drawing of Henneguya. From Fish Disease, Diagnosis and Treatment, by E. J.Noga.
Platyhelminths of Fish
The phylum Platyhelminthes is composed of three taxonomic classes: Turbellaria,Trematoda, and Cestoda. The Turbellaria are all free-living and have no association with fishdiseases. All members of the other two classes live in close relationship with host animals.The trematodes are commonly known as flukes, whereas the cestodes are known astapeworms.

Mongenetic Trematodes
This is a group of trematodes which complete their entire life cycle on the host. Theadults attach to the host by a haptor or opishaptor which is a specially adapted structure onthe posterior end of the parasite. This organ has hooks which allow the parasite to attachfirmly to the host fish. These parasites usually cause minimal damage to fish, but will infestthe skin, fin and gills of pond fishes. Severe infestations may be responsible for poorrespiration and/or emaciation. The two most common mongenetic trematodes include:Dactylogyrus and Gyrodactylus.
Dactylogyrus sp
This parasite is approximately 0.2 to 0.5 mm in length, reaching a maximum length of2.0 mm. It has seven pairs of marginal hooks and usually one pair of median hooks on theopishaptor. The dactylogrids have two to four pigmented spots (known as “eyes” or “eyespots”) in the anterior fourth of the body. All dactylogrids are oviparous with no uterus.
Gyrodactylus sp
This parasite is smaller, rarely reaching a maximum length of over 0.4 mm. All speciesare viviparous with one to three daughter generations being observable in the V-shapeduterus. This parasite is more commonly found on the skin and less commonly present in thegills, although severe infestation will have both organs affected. (Fig. 9).
Figure 9. Line drawing of Gyrodactylus.

Digenetic Trematodes
This group of parasites has a complex life cycle with several successive larvalgenerations, alternating sexual and asexual generations and changes of hosts to develop intothe adult in its primary host. The life cycles of trematodes involving fishes may either usefishes as the primary hosts or as intermediate hosts. Adult trematodes may infest the intestineor gall bladder of fishes. A few of the more common digenetic trematodes are listed below.
Diplostomum spathaceum
The life cycle of this parasite begins as an adult trematode in the intestine of gulls orother fish-eating birds. The body of the adult is 0.3-0.5 cm in length and distinctly dividedinto a flattened anterior forebody and a cylindrical and narrower hindbody. Eggs are shed andpassed in the feces of the bird to the water. The eggs hatch in approximately 21 days intofree-swimming ciliated miracidia. The miracidia infest aquatic snails as the first intermediatehost by penetration of the snail’s hepatopancreas. The miracidia then become a mothersporocyst, followed by one or more daughter sporocysts. Each daughter sporocyst producesmany cercariae which are released into the water. These cercariae seek a second intermediatehost by penetrating the fins, skin, gills or cornea of small fishes. Primary host fish whichingest the initially infected fish (second intermediate host) become infected and the life-cycle iscompleted when the host fish are ingested by fish-eating birds. (Fig. 10).
Posthodiplostomum minimum
This trematode has several synonyms including: Neodiplostomum minimum,Neodiplostomum orchilongum and Postodiplostomum orchilongum. The life cycle of thistrematode is very similar to that of D. spathaceum above, although, infectivity of cercariae tofishes lasts no more than 24 hours after release from the snail. Each cercaria actively raises ascale and enters under the scale pocket, causing irritation to the fish. Blood, congestion andhemorrhage occur at the bases of fins or other places of cercarial penetration. The trematodesmigrate from the point of entry to visceral organs of the fishes, usually within one to threehours after penetration. Metacercariae are located in any organ of the fishes’ body, but aregenerally more numerous in the liver, kidney, heart, spleen and other organs of abdominalviscera. With many of the digenetic trematodes, the metacercariae within the skin results inincreased melanin deposition, hence the term “black spot disease”. Visible white or yellowspots in the visceral organs, usually no larger than 1 mm in diameter are often referred to as“white grubs” or “yellow grubs” and could be caused by several trematode species. Diagnosisof digenetic trematode infections is dependent upon identification of the genus and species ofthe trematode within infected fish.

Figure 10. Life cycle of a typical trematode. (1) Fully developed adult in the primary host.(2) Egg released in feces, urine or other routes from the primary host. (3) Free-swimmingmiracidium actively seeks a snail, clam, annelid, or other invertebrate; egg is ingested by theinvertebrate in some trematode species. (4a) Miracicium metamorphoses to redia and toseveral daughter rediae in some trematode species. 4b) Miracidium transposed to mothersporocyst and asexually to daughter sporocysts, both mother and daughter asexually produceseveral hundred cercariae in some trematode species.(5a) Ophthalmoxiphidiocercariae from redia actively seek a second intermediate host in sometrematode species. (5b) Cercaria from sporocysts actively seeks a second intermediate host,or the second intermediate host ingests precocious cercaria within the first intermediate host insome trematode species.(6) Cercaria or ophthalmoxiphidiocercariae penetrates tissues of the second intermediate hostand develop into a metacercaria. A primary host ingests the metacercaria along with thesecond intermediate host and the life cycle is complete. From Textbook of Fish Health, by G.Post.

Cestodes
Cestodes are a taxonomic class of organisms in which the adult stage usually lives inthe intestinal tract of vertebrates. Intermediate stages live in a wide variety of body locationsin both vertebrate and invertebrate hosts. The bodies of most cestodes are ribbon-shaped anddivided into short segments called proglottids, hence the name “tapeworm”. Diagnosis ofcestodiasis is dependent upon demonstration of the parasite within the intestinal tract of thefish. Clinical signs of cestodiasis include emaciation, anemia, discoloration of the skin, andsusceptibility to secondary infections. Low numbers of pleurocercoids may be located in vitalorgans such as the brain, heart, spleen, kidney, or gonad and have a devastating effect on thefish. A few of the more common cestodes are listed below.
Proteocephalus ambloplitis
This parasite belongs to a large family of cestodes with ten recognized subfamilies.This parasite has a complicated life cycle involving a piscine second intermediate host and apiscivorous primary host fish. These parasites are observed within the intestines of bass.Eggs are expelled from gravid proglottids and pass from the host in feces. The eggs mature toan embryo which is ingested by several species of copepods as the first intermediate host. Theprocercoid develops from the embryo inside the copepods. The copepod is ingested by aforage-fish whereby the procercoid penetrates the intestinal wall of the second intermediatehost. Some encyst in the wall of the intestine, other penetrate organs in the visceral cavity andmay eventually reach the musculature. Here they develop into plerocercoids, which is theningested by a piscivorous fish. (Fig. 11).
Figure 11. Life cycle of Proteocephalus ambloplitis. (1) Primary host, largemouth orsmallmouth bass. (2) Eggs passed in feces. (3) Develops to hexacanth embryo. (4)Hexacanth embryo ingested by copepod, develops to procercoid. (6) Forage fish withplerocercoid ingested by a bass, adult cestode develops in the intestine. From Textbook ofFish Health, by G. Post.

Ligula intestinalis
This group of parasites is distinct for three reasons: (a) they are not highly host-specific, but can develop in a wide variety of second intermediate host fishes, (b) thepleurocercoid stage develops sexually in the second intermediate host, and (c) these cestodesare very broad in shape and for this reason have also been known as “beltworms”.
Acanthocephala
This group of parasites is comprised of worms with an anterior proboscis covered withmany hooks. These parasites are often referred to as “thorny-headed worms”. The body iscomposed of a presoma (proboscis and associated structures) and a cylindrical trunk. Theintestinal tract of the affected fish may contain a blood-tinged fluid, and histologically, theproboscis of these parasites will be firmly attached to the intestinal mucosa. Affected fish willexhibit emaciation, lethargy, anemia, and possibly death with a marked infection. We haveobserved salmonids from the Great Lakes with marked infestation of this parasite with literallyhundreds of these parasites embedded in the intestinal mucosa.
Leeches and Copepods
Although not a common problem, occasionally, fish will be observed infected witheither leeches or copepods. Leeches have long, slender flexible bodies and actively swim foran attack on their prey. Skin and underlying soft tissues are damaged and allow blood to flowinto the leeches digestive tract. Leeches are not host-specific, and the damage to the skin andgills is dependent upon the number of leeches present at any time. Small fishes can beseriously injured or die due to excessive leech infestation.
Copepods include fish lice or “anchor worms”. The more common fish lice includeLepeophtheirus and Caligus, and Argulus. The most common genus of anchor wormsincludes Lernae sp. All of these are external parasites which affect the fish by imbibing bloodfrom the host fish and causing localized skin and soft tissue damage. They may also allow forsecondary bacterial infection of the skin or musculature which may ultimately cause thedemise of the fish.
Bacterial Pathogens of Fish
Fish are susceptible to a wide variety of bacterial pathogens. Many of these bacteriacapable of causing disease are considered by some to be saprophytic in nature. This bacteriaonly become pathogens when fishes are physiologically unbalanced, nutritionally deficient, orthere are other stressors, i.e., poor water quality, overstocking, which allow opportunisticbacterial infections to proceed. Some of these bacterial pathogens of fishes are fastidious andrequire special growth media for laboratory culture. Others grow at different temperatures,dependent upon the aquatic environmental temperature of the fish. Some of the morecommon bacterial pathogens are listed below.
Aeromonas salmonicida
This is the most common bacterial pathogen of fishes worldwide. This bacteria can cause thefollowing diseases:
(a) Furunculosis of salmonids, (b) Goldfish Ulcer Disease, (c) Carp Erythrodermatitis, and (d)Trout Ulcer Disease. Additionally, several other species of Aeromonas, including: A.hydrophila, A. formicans, A. liquefaciens, and A. hydrophila complex are capable of causinga disease known as “Motile Aeromonas Septicemia” or “Bacterial Hemorrhagic Septicemia”.Each of the following diseases is discussed briefly below.
Furunculosis of Salmonids
Typical furunculosis in salmonids may occur in one of several forms:
(1) Peracute form in fingerlings: These fish usually have a dark discoloration and dierapidly without any other premonitory signs. The gross lesions may resemble thoseobserved in the acute form of the disease. (2) Acute form: Premonitory signs of anorexia occur 2-3 days prior to death. Grosslesions include hemorrhage of the liver and splenomegaly. (3) Subacute: This form has a much slower onset of clinical signs with petechialhemorrhages being observed in the skin and around the fins. Fish exhibit focaldiscolorations and anorexia and die approximately 4-6 days after the onset of clinicalsigns. Gross lesions include typical “furuncles” as well as internal lesions listed above forthe acute form. (4) Chronic: This form is observed in fish which survive the subacute form and ismanifested by healing of the furuncles and scarring. Affected and recovered fish mayexhibit poor weight gain and be focally discolored.
Histologic lesions observed in the peracute and acute form will demonstrate necrosis,hemorrhage and bacterial microcolonies within affected organs. Furuncles classically aredescribed a dark, raised tumefaction involving the skin, subcutis and underlying skeletalmusculature. These lesions will ulcerate and drain a serosanguinous fluid. These lesionsdevelop from localization of hematogenous bacteria in the muscle or skin, not from anexternal skin leison. The lesion histologically is characterized by marked necrosis of the skin,subcutis and skeletal muscle with mild to minimal acute inflammatory infiltrates in the acutestage. In the chronic form, scarring with be characterized by the replacement of muscle tissuewith fibrous connective tissue. Culture of acute lesions will often recover the organism inpure culture.
Cutaneous Ulcerative Disease of Goldfish
This disease, although it is most common in goldfish, also affects other non-salmonidfishes. It is caused by Aeromonas salmonicida, and the disease is also referred to as“furunculosis”. However, unlike furunculosis as discussed above, this disease is typicallylocalized to the skin and only becomes systemic late in the disease. The skin lesions rangefrom whitish discolorations to shallow hemorrhagic ulcers to deep lesions which may exposeunderlying muscle or bone. These lesions can become secondarily infected with fungi,

protozoa, or other bacterial agents. Fish may exhibit hemorrhage on the body as well as thebase of the fins.
Diagnosis of this disease is dependent upon culture of the etiologic agent from thelesions. Histologically, the lesions have a mild to moderate primarily mononuclearinflammatory infiltrate. Large numbers of bacterial microcolonies are observed in many of thelesions.
Motile Aeromonas Septicemia(MAS)
This is the third manifestation of disease caused by Aeromonas sp. This is probablythe most common bacterial disease of freshwater fish. This disease has been associated withseveral members of the genus Aeromonas, including A. hdrophila, A. sobria, A. caviae, A.schuberti, and A.veronii. Clinical signs of motile aeromonas septicemia range from suddendeath with high morbidity in peracute cases to superficial to deep skin lesions. Skin lesionsinclude variously sized areas of hemorrhage and necrosis and the base of the fins. Theselesions may progress to reddish to gray ulcerations with necrosis of the underlyingmusculature. Ulcers may be observed in conjunction with a hemorrhagic septicemia whichcan produce non-specific lesions and clinical signs of exophthalmos, ascites, visceralpetechiation, and a hemorrhagic and swollen lower intestine and vent. Anorexia andcutaneous discoloration are also observed with the septicemia.
Histopathological lesions include acute-to-chronic dermatitis and myositis. With thesepticemia, there may be depletion and necrosis of the renal and splenic hematopoietic tissue,as well as necrosis in the intestinal mucosa, heart, liver, pancreas and gonad.
Definitive diagnosis of MAS requires biochemical identification of the suspectedbacterial agent within the target tissues, with attendent clinical signs and lesions. The kidneyis probably the best target tissue for culture, however, clinical lesions should also be cultured.
Yersiniosis
This disease is also known by the following synonyms: Enteric Redmouth Disease,Redmouth, and Blood Spot Disease. This disease is caused by the pathogen Yersiniaruckeri. This is an important pathogen of salmonids, particularly rainbow trout. Outbreaks ofthis disease usually begin with chronic, low mortality which slowly escalates. Severity ofyersiniosis is dependent mainly on strain virulence and the degree of environmental stress.There are six serovars of Y. ruckeri classified as Strains I through Strain VI, with Strain Ibeing the most common. However, not all Strain I serovars are pathogenic, but all of theother strains are highly lethal. The early stages of this disease may resemble MAS withpetechial hemorrhages observed around the fin and on the skin. Additionally, there isdiscoloration of the dorsum of the fish, as well as anorexia and lethargy. With chronicdisease, there is ascitic fluid and unilateral or bilateral exophthalmos and hyphema (hence theterm, “blood spot disease”). The characteristic gross lesions of this disease includehemorrhage of the oral cavity and skin erosions of the mouth. Histopathology includesbacterial colonization of well-vascularized tissues and hemorrhage of the gills, kidney, liver,spleen, and heart, as well as muscle. Definitive diagnosis of this disease involves culture ofthe target organ (kidney) as well as attendent clinical signs and lesions.

Enteric Septicemia of Catfish(ESC)
This is probably the most important bacterial disease of catfish. It has a very highpredilection for channel catfish, but has been occasionally reported in other ictalurids such asbrown bullhead, blue and white catfish. This is a markedly seasonal disease, with outbreaksoccurring when water temperatures are in the range of 24 - 28 οC. Therefore it is mostprevalent during May to June and September to October in the southeastern United States.There are two forms of ESC which are directly related to the route of exposure.
Acute form: Bacteria are ingested into the gastrointestinal tract and enter thebloodstream through the intestine with subsequent colonization of internal organs withresultant necrosis of these organs. There is usually a very high mortality and in some cases,very few premonitory clinical signs are observed. Clinical signs may include corkscrew spiralswimming, abdominal distention, exophthalmos, or pale gills. Petechial hemorrhages may beobserved on dark areas of the skin as small (1 to 3 mm) depigmented foci (called “falsespots”). Internally, the peritoneal cavity contains a bloody or clear fluid, hemorrhage andnecrosis of the liver, as well as splenic and renal hypertrophy.
Chronic form: Bacteria enter the catfish via the nervous system, by invading theolfactory organ via the nasal opening and migrate up the olfactory nerve to the brain, wherethe infection spreads from the meninges to the skull and finally to the skin, forming the classic“hole-in-the-head” lesion. This is a raised or open ulcer on the frontal bone of the skull.
Histologically, enteritis, hepatitis, myositis, and interstitial nephritis begin as acutelesions and develop into chronic foci. Fish with the nervous form develop neuritis of theolfactory nerve with meningoencephalitis developing in the late stages. Definitive diagnosis ofESC requires identification of the gram negative bacteria in target tissues, with attendantclinical signs. In the acute form, the kidney is the target organ for culture, whereas in thechronic form, the brain is the target organ for culture.
Edwardsiellosis(EPD)
This disease is also known as Emphysematous Putrefactive Disease (EPD) and iscaused by Edwardsiella tarda. This disease is much less common than ESC and is more of aproblem in older channel catfish, but fingerlings are still susceptible. Clinically, lesions areinitially observed as 3 to 5 mm red cutaneous foci on the flanks and caudal peduncle. Theyare caused from fistulas originating deep in the skeletal muscle. There is petechiation andmalodorous liquefactive necrosis of the viscera with fibrinous peritonitis. Catfish affectedwith this disease will continue to eat even if they are severely affected. There may beposterior paresis in the later stages of the disease. Definitive diagnosis is based onidentification of the bacterium within the lesions and the attendent clinical findings. Afluorescent antibody test is available for identification of the bacterial agent, using kidney asthe target tissue.

Bacterial Kidney Disease(BKD)
This disease is caused by Renibacterium salmoninarum and primarily affectssalmonids, especially rainbow, chinook, coho, brown and brook trout. Any age fish issusceptible to this disease, but losses may not occur until the fish are well grown. Verticaltransmission of the disease from parent to offspring is thought to be the most common routeof infection, however, horizontal transmission can also occur. Clinical disease is most likely tooccur during times of stress, especially during transfer of salmonids from freshwater toseawater, or during spawning. Fish with BKD may have no external lesions, however, theymay also present with cutaneous discoloration, exophthalmos, pale gills, abdominal distentionor hemorrhages at the vent or base of the fins. Small vesicles on the flanks (often called“spawning rash”) filled with fluid, rupture to form cutaneous ulcers. The major target organ isthe kidney, which may have large white, raised coalescing granulomas. These granulomasmay also be observed in the spleen in severe cases. Histopathologic evaluation of thesegranulomas reveals large numbers of macrophages with phagocytized Renibacteriumsalmoninarum. Definitive diagnosis of clinical BKD requires identification of the bacteriawithin target tissues. Renibacterium salmoninarum is an extremely fastidious organism andmay require up to twelve weeks to culture using selective media. Other methods ofidentification may include ELISA and/or FA testing or immunohistochemistry.
Mycobacteriosis
This is probably the most common chronic disease of aquarium fish, as well as otherfreshwater and marine fishes. Clinical signs include emaciation, poor growth or retardedsexual maturation. Lesions include skeletal deformities, chronic nonhealing shallow to deepulcers or fin erosions. Internally, 1 to 4 mm white nodules may be present on the visceraincluding the liver and kidney. Histopathology reveals a chronic inflammatory response withlarge numbers of epithelioid macrophages surrounding the bacteria. This disease can bestrongly suspected based on the presence of acid-fast staining bacteria within the lesions.Confirmation of this disease requires culture of the organism.
Columnaris Disease
Columnaris, is a common bacterial disease that affects the skin or gills of freshwaterfish and is caused most commonly by Flexibacter columnaris. This disease is also known by awide variety of synonyms including the following: mxyobacterial disease, peduncle disease,saddleback, fin rot, cotton wool disease, and black patch necrosis. This bacteria is usuallypathogenic at temperatures greater than 59 οF. Both mortality and acuteness of the diseasewill increase at higher water temperatures. Virulence mechanisms associated with this diseaseare not well understood, however, the mineral content of the water is thought to be important,since this bacteria has been shown to be less pathogenic in soft water as compared to hardwater. Other risk factors include physical injury, low dissolved oxygen, organic pollution andhigh nitrite levels.
This is primarily an epithelial disease, i.e., it causes erosions and necrosis of the skinand gills which may become systemic. It often presents as whitish plaques that may have a red

peripheral zone on the head or back (hence the name saddleback) and/or the fins (hence, finrot) and especially the caudal fin (hence, peduncle disease). Fragments of the fin rays mayremain after the epithelium has sloughed, leaving a ragged appearance. Lesions rapidlyprogress to ulcers, which may be yellow or orange due to masses of pigmented bacteria.Ulcerations spread by radial expansion and may penetrate into deeper tissues, producing asepticemia. Gill infections are less common but more serious. Columnaris begins at the tipsof the lamellae and causes a progressive necrosis that may extend to the base of the gill arch.Definitive diagnosis is dependent upon the isolation of the bacterial agent in the presence ofattending clinical lesions. It should be noted that a presumptive identification of Flexibactercolumnaris can be made by examination of wet mounts and observation of long thin bacterialrods which a characteristic flexing or gliding motion. In addition to Flexibacter columnaris,other bacterial agents which have been implicated in this disease include: Flexibacterpsychrophilia as well as Cytophaga and Flavobacterium branchiophila.
Viral Diseases of Fish
Although there are relatively few common viruses of fish when compared tomammals, these viruses do cause important diseases which can result in markedly highmortality and/or morbidity in a very short period of time. General characteristics of viralinfections of fish include: (a) temperature-dependent pathogenicity; (b) host-specificity;(usually affecting only one species or a closely related group of species), and (c) younger fishare usually the most susceptible to viral infection, with the older fish being possible viralcarriers. A definitive diagnosis of any systemic viral disease is based on observation ofrelevant clinical signs and history in combination with virus isolation. A few of the morecommon viral diseases are discussed below.
Channel Catfish Virus Disease (CCVD)Channel catfish virus is the most important viral disease affecting channel catfish. It is
a highly species-specific herpesvirus and only naturally affects channel catfish, although it canexperimentally infect some other ictalurids (blue catfish and channel/blue catfish hybrids).Different strains of channel catfish vary in their susceptibility.
In an CCVD epidemic, the younger, more robust fish typically die first with only theyoung (less than one year old) and smaller (less than 15 cm long) fish becoming clinically sick.Mortalities are most severe at higher water temperatures, with the greatest mortalitiesoccurring at 77 - 86 οF. Clinical signs may become evident in as little as one day at 86 οFwater temperature. There is also some evidence that younger fish or broodfish may develop achronic infection. During epidemics, this virus is readily transmitted horizontally in the fecesand urine of clinically affected fish. There is also evidence for vertical transmission as well asrecrudescence of latent infections.
Clinical signs including fish hanging head up in the water, disorientation (corkscrewspiral swimming), abdominal distension, exopthalmos, and hemorrhages on the body, gills andat the base of the fins. Internally, there is a yellowish fluid in the peritoneal cavity andpunctate hemorrhage in the viscera. Histologically, lesions can be observed in all major organsystems. Focal necrosis occurs in the posterior kidney and quickly progresses to diffusenecrosis of both hematopoietic and excretory tissues accompanied by hemorrhage and edema.Necrosis can also be observed in the liver, spleen, gastrointestinal tract, pancreas, and skeletal

muscle. Neurological damage includes vacuolated neurons and edematous neurofibers.Kidney is the best organ for culture of the virus and ictalurid cell lines (BB or CCO) are mostcommonly used for isolation. Synctia formation and the presence of Cowdry type A inclusionbodies are strong presumptive evidence of CCVD with serum neutralization of cell culture-isolated virus being the most widely used method for definitive diagnosis.
Infectious Hematopoietic Necrosis Virus of Salmonids (IHN)Synonyms for this viral disease include the following: Chinook Salmon Disease Virus,
Sacramento River Chinook Disease, Columbia River Sockeye Disease and Oregon SockeyeDisease. This disease is caused by a rhabdovirus and is a major cause of mortality insalmonids in freshwater. It is endemic to the Pacific northwest coast of North America buthas been reported in other parts of the United States including the Snake River Valley inIdaho as well as foreign countries such as Japan, Italy, France and Germany.
In the United States, natural outbreaks of IHN have occurred in rainbow (steelhead)trout, brown trout, as well as in Atlantic, chinook, pink and sockeye salmon. During IHNepidemics, only young (i.e., less than 2 years old) fish become clinically ill. High mortalityrates have been observed in fish less than 6 months old while older fish have lower mortalityand may not show clinical signs. The water temperature has an important impact onepidemics, with peak mortalities observed at 50 οF and fewer and more chronic infectionsobserved at less than this temperature, while fewer and more acute infections are seen atgreater than 50 οF. This disease has never been reported in water temperatures above 59 οF.During epidemics, the virus is readily transmitted horizontally by ingestion of infected tissue,as well as via the feces and urine of infected fish. Those fish which survive the outbreak maybe carriers, which is an important consideration, since the disease may also be transmittedvertically. The gills are thought to be the portal entry for horizontal transmission, however,the virus has also been isolated from potential vectors such as leeches, copepods and mayflies.
The classic presentation of IHN is increased mortality among fry and/or fingerlings orsusceptible species at the appropriate water temperature. Fry are lethargic with rare bouts ofsporadic hyperactivity. A long, thick, white fecal pseudocast trailing from the rectum isconsidered by many to be pathognomic for this disease. Other clinical signs include cutaneousdiscoloration, abdominal distention with ascitic fluid, exophthalmos, and hemorrhage at thebase of the fins. The gills are typically pale to white, and internally, there is marked pallor ofthe visceral organs. The gastrointestinal tract is devoid of ingesta but may be distended withmucous (fecal pseudocast). There may be petechiation of the visceral fat, mesenteryperitoneum, swim bladder, meninges and pericardium. In approximately 5% of the sockeyesalmon which survive the disease, spinal deformaties are observed.
Histopathologic lesions of affected fry include necrosis of the kidney (the site ofhematopoietic tissue), pancreas, gastrointestinal tract and adrenal cortex. Splenic and renalhematopoietic tissue are usually affected first and most severely. Pleomorphicintracytoplasmic and intranuclear inclusions are present in the pancreatic and islet cells.Histopathologic lesions of older fingerlings are similar, but more subtle with the addition ofepithelial hyperplasia of the gill tissue observed in fingerlings, but distinctly absent in the fry.
Infectious Pancreatic Necrosis Virus (IPN)This disease is caused by a birnavirus, and is a major cause of mortality in salmonids in
freshwater. It infects rainbow, brook and cutthroat trout as well as Atlantic and cohosalmonids and others. Typically, only young fish (less than 6 months old) become clinically ill,but any age fish can become infected and become a chronic carrier of the virus.
The course of the clinical disease is dependent upon the age and species of the fishaffected, water temperature and other factors, but typically, clinical signs appear on day 3 to 5(fry) or on day 8 to 10 (fingerlings) after exposure to the virus. Peak mortalities usuallyoccurs between day 12 to day 18 post exposure. With this viral infection, even the mostvirulent outbreaks have at least a few survivors, which become stunted due to pancreaticfibrosis. The virus is considered to be highly contagious and readily transmitted horizontallyby contact and ingestion of infected tissue and/or fecal pseudocast during epidemics. Verticaltransmission readily occurs via transport in reproductive fluids and on/in the egg. IPNV hasalso been suspected of contributing to embryo mortality.
Classic presentation of IPN is observed by a sudden increase in mortality of fry orfingerling trout with the larger, more robust fish being the first ones to die. Clinical signsinclude dorsal cutaneous discoloration, trailing fecal pseudocasts, abdominal distention withascitic fluid, exophthalmos, hemorrhages around fins and pale gills. Neurologic signs ofcorkscrew spiraling,and whirling may also be observed.
The characteristic histopathologic lesion is acute necrosis of the pancreatic acinar cells.However, since other viruses, most notably, IHN, can cause this same lesion, diagnosis isdependent upon isolation of the virus. Other histologic lesions which may be observed includerenal tubular and hematopoietic tissue necrosis as well as liver necrosis in terminal cases.
Miscellaneous Oncogenic Viruses of FishThere are a large number of viruses which have been at least associated with
neoplastic or neoplastic-like lesions in fish. Some of these more common viruses include: (a)Herpesvirus cyprini, the causative agent of carp pox, which produces “pox-like” lesions incarp, smelt and bream, (b) Iridovirus, the causative agent of Lymphocystis disease of fish,which produces large, “pearl-like” masses on the cutaneous surfaces of many marine andfreshwater fish, and finally, (c) Retrovirus of Walleyes, which affects wild-caught walleyes inNorth America and produces large sarcomas of the subcutaneous tissues.
Fungal Infections of Fish
Primary fungal infections of fish are considered to be rather rare, however, we havemade this diagnosis in fish on more than one occasion. Nevertheless, by far, the mostcommon fungal infections of freshwater fish are due to a group of fungi referred to as “watermolds”. More correctly, these are fungi belonging to the Class Oomycetes, and most are dueto the Family Saprolegniaceae which is discussed below (Saprolegniasis).
SaprolegniasisThis is due to a large class of water molds, most commonly known as “Saprolegnia”.
They are ubiquitous saprophytes in soil and freshwater. Most transmission is probably via themotile zoospores which allows dissemination to distant sites. Most fish infections areprobably acquired from inanimate sources (i.e., fungi sporulating on dead organic matter).

The classic case of saprolegniasis presents as a relatively superficial, cottony growthon the skin or gills. Such lesions usually begin as small, focal infections that can spreadrapidly over the surface of the body. Newly formed lesions are white due to the presence ofthe pure growth of mycelia. However, with time, the lesions often become discolored red,brown or green due the trapping of sediment, algae, or debris in the mycelial mat. Thegreatest mortalities of this disease are observed in conjunction with infection of the gill tissuedue to osmoregulation and respiratory dysfunction. This fungus is rarely thought to causeprimary infections, and in most cases, occurs as a pathogen secondary to viral or bacterialdiseases in association with other stressors, such as poor water quality, increased stockingdensities, ectoparasitism, etc. Diagnosis of this disease can be made by confirming thepresence of the fungus by cytologic evaluation of the affected tissues.
Visceral Mycosis due to Sporobolomyces Salmonicolor
This is an uncommon disease of salmon, which we have reported from this lab. Thiscase involved high morbidity, low mortality with emaciation, cutaneous discoloration andascites in Chinook salmon fry. Lesions observed histologically included: aerocystitis(inflammation of the swim bladder), myositis, peritonitis, and dermatitis. The diagnosis wasmade by fungal culture of Sporobolomyces salmonicolor, (so named for its characteristicsalmon color in culture) and identification of morphologically consistent fungal hyphae withintissue sections of affected fry.
Guidelines for Submission of Fish Samples to theAnimal Disease Diagnostic Laboratory
Live, untreated sick fish are the best submission samples for diagnosis of diseaseproblems. Dead fish are very poor specimens, since fish decompose rapidly after death.
An excellent submission sample is several live fish that exhibit obvious physical signsof disease, such as: (a) lesions, (b) hemorrhagic to yellow or pale erosions on the fins or gills,or (c) swollen, fused, or clubbed gills. Other indicators of poor fish health would include fishexhibiting abnormal or unusual behavior such as lying listless in shallow water or at the watersurface or swimming erratically or in circles.
The number of fish to be submitted varies and may be dependent upon the size of thefish. If fry or fingerlings are submitted, then 20-25 should be enough to perform diagnostics.If the specimens are adult fish, then 3-5 fish are usually sufficient.
In those instances where water quality may be a problem, water samples can also besent to ADDL for evaluation of water quality. PLEASE NOTE THAT DISSOLVED
OXYGEN (DO) IS NOT TESTED AT THIS LABORATORY, since this parameter willchange greatly between the time the sample is collected and tested.
For shipment of fish to ADDL, it is recommended that fish be placed in a large thickclear plastic bag, filled with approximately 1/3 full with water. An “air cap” or oxygen shouldbe present immediately above the surface of the water, occupying approximately 1/3 to 1/2 ofthe plastic bag. The bag should be sufficiently tied and placed inside another bag to preventleakage. This bag should be placed inside a thick, waxed, cardboard box for

shipping. This box, along with the submission form should be transported or shipped via anappropriate overnight shipping company to ADDL. The correct address is:
Animal Disease Diagnostic LaboratoryPurdue University
1175 - ADDLW. Lafayette, IN 47907-1175
For evaluation of water quality samples, a single, separate water sample should beshipped along with the fish samples. This water should be placed in a clean, one quart glassjar with a screw top lid (such as a canning jar) with a layer of aluminum foil placed betweenthe water sample and the lid. Water samples shipped in this manner are satisfactory forpesticide and herbicide analysis as well as water quality testing.
Please submit a completed submission form (ADDL form 1) along with any fish orwater samples.
PLEASE NOTE: All fish and water samples submitted to ADDL becomeproperty of ADDL and WILL NOT BE RETURNED TO SUBMITTERS.DIAGNOSTICS ARE NOT PERFORMED FOR THE PURPOSE OF DETERMININGIF FISH ARE SAFE FOR HUMAN CONSUMPTION.
If you have any questions regarding fish and/or water quality samples, please contactDr. M. Randy White at (317) 494-7440.
Selected References
Aquaculture for Veterinarians, Fish Husbandry and Medicine. L. Brown, ed. Pergamon Press. 1993.
Revised and Expanded Textbook of Fish Health. G. Post, ed. T. F. H. Publications, 1987.
Fish Disease, Diagnosis and Treatment. E. J. Noga, Mosby-Year Book Publications, 1996.
The Veterinary Clinics of North America, Small Animal Practice, Tropical Fish Medicine. M. K.Stoskopf, ed. W. B. Saunders Company, 1988.
Fish Diseases, Volumes 1 and 2. W. Schaperclaus. American Publishing Company. 1991.
Fish Pathology, Second edition. R. J. Roberts, ed. W. B. Saunders Publishing Company. 1989.
Field Manual for the Investigation of Fish Kills. F. P. Meyer and L. A. Barclay. eds. United StatesDepartment of the Interior. 1990.
Systemic Pathology of Fish, A Text and Atlas of Comparative Tissue Responses in Diseases ofTeleosts. H. W. Ferguson. Iowa State University Press. 1989.
Fish Medicine. M. K. Stoskopf. W. B. Saunders Company. Harcourt Brace Jovanovich,Inc. 1993

sharp.doc
LEVEE AND POND CONSTRUCTION
Larry SharpRust Construction Inc.
PO Box 100Seymour, IN 47274
812-497-2400
Introduction
Description of a pond• Recreational• Irrigation/Fire Protection• Aquaculture
• Two types of ponds:Excavated Topography is flat, must dig hole to capture water. Water level maydepend upon water table level because of little drainage area.Impounded: (Leveed) Hilly topography, Dam a ravine to capture water which drainsfrom the surrounding hills. Water table less important because of water draining intopond.
Site Selection Criteria:
Site TopographySite suited for excavated or impounded pond. Excessive elevation drop through valley.Soil type Soil Survey, need impervious material to contain water.
Drainage AreaLake Area Too low a ratio of drainage area to pond area, pond will stagnate, too great ratiopond will be “flushed” during large rain events.Upstream land used Agricultural can cause siltation and pollution. Commercial can causepollution and excessive runoff (i.e.-paved parking area and roof tops)

sharp.doc
Legal RequirementsWetlands Cannot disturb wetland areas.Property line location Cannot back water up across a property line.
Design
Dam height/Pond depthLaws determine maximum height of levee. Over 20’ tall requires state permit.
Downstream objects can affect the issuing of permits and determine maximum height.
Principal/Emergency SpillwaysPrincipal spillway is often needed to allow normal flow and small rain events to pass
through the dam without causing damage or danger to the dam. Emergency spillways allowlarge rain events to pass around the dam to prevent overtopping and damage to the dam.Sometimes, on small ponds, only emergency spillways are used to pass water around the dam.Excavated ponds sometimes have neither.
Levee Cross SectionCore trench: Excavated down to impervious material to anchor and prevent seepage underfoundation.Side slopes 2:1 steepest levee should be. 3:1 is optimal, 4:1 and flatter is often economicallyprohibitive.
Top Width: Greater than 10 feet allows traffic, narrower could allow excessive seepagethrough near top of dam.Freeboard: Distance in elevation between water and top of dam. Should be 2’ or greater toprevent freatic line from allowing dam to slide.
Aquaculture featuresFilling/Draining Often need to fill and drain ponds to facilitate fish harvest. Can be drainthrough principal spillway, but often need to fill faster than precipitation will allow.

sharp.doc
Depths Minimum of 4-6’Catch Basins Allows fish to gather in a confined area as water level is dropped.
Maximum/minimum bottom slopes Too great of slope and fish will get stranded, too flat andwater will pond in bottom not allow fish to reach catch basin.
Construction
Clearing Clearing dam site, and typically in lake area. Especially if seine net will be used toharvest fish. Material may be buried or burned, if permitted, but never buried in the levee.Topsoil stripping Top soil should be stripped under dam to prevent a seepage layer.
Soil fill locationCore, front side, back side Best material in core, second best in upstream side, worst indownstream side.Topsoil spreading Topsoil from stripping can be respread on back and top of dam to allowvegetation to establish.

sharp.doc
bidwell.doc
REPRODUCTIVE BIOLOGY IN FRESHWATER FISH
Christopher A. BidwellDepartment of Animal Sciences
Purdue UniversityWest Lafayette, IN 47907-1026
Introduction
The long term growth of the aquaculture industry in the Great Lakes region willdepend on the development of domesticated broodstock for temperate species such as whitebass, (Morone chrysops), striped bass, (M. saxatilis), yellow perch, (Perca flavescens),walleye, (Stizostedion vitreum vitreum ) and others. The development of domesticatedbroodstocks for temperate species will enable the consistent production of fry and fingerlingsfor growout and allow for selection of fish that will perform well in intensive culture systems.In order to begin the domestication process it will be necessary to gain control over all phasesof the life cycle, especially reproduction. The development of broodstock is a major cost forthe producer due to the expense of operating and maintaining facilities as well as feeding fishfor extended periods of growth, sexual maturation, and successive reproductive cycles. Thispaper will outline some basic principles of reproduction in females. Although males areequally important in the reproduction, the availability of eggs is most often the limiting factor.In many species, egg production by females is a year long process but viable milt can beproduced by males in a matter of a few weeks.
Reproductive Strategies
The reproductive cycle of different species have developed in response to the fishesnatural range and habitat. In order to close the reproductive cycle for a given species it isnecessary to mimic some elements of the natural environment in order to provide theappropriate stimuli for the reproductive cycle. The timing of spawning in annual spawningfish has developed as a response to “ultimate” factors that will maximize the survival of theeggs and fry. These some of these ultimate factors include the water supply and water quality,availability of a suitable food supply and a reduced number of predators. In order for the fishto be ready to spawn when the ultimate factors are present, the fish needs to respond to"proximate" factors or cues to adjust the reproductive cycle to match the changingenvironment (for review see Sumpter, 1990). In most species native to North America,changing day lengths and water temperatures are strong proximate factors that influence thereproductive cycle. Therefore conditions that are optimum for growth in culture may notprovide appropriate cues to initiate and maintain the reproductive cycle.
There are three basic strategies for the production of eggs and their subsequentspawning. The first strategy, which is used by pacific salmon is synchronous spawning . Onecrop of eggs and sperm are produced and spawned at one time after which the fish dies. Asecond strategy is called group synchronous which is used by most of the common sport fishand aquaculture species. In this strategy, groups of eggs are produced and spawned at onetime but several cycles of development and spawning can occur. The cycle can take a year inannual spawning fish or it may take a few weeks with spawning occurring several times during

bidwell.doc
a given season. The last strategy is asynchronous spawning where there is continuousdevelopment and spawning of oocytes. In some species, individuals can spawn a few eggsevery day throughout a spawning season.
Stages of Reproduction
As a female fish grows, there is proliferation of oogonial cells in the ovary thateventually develop into the oocytes that are commonly referred to as eggs. An important stepis the initiation of meiosis which results in the reduction of chromosome numbers by half. Theprocess of meiosis is interrupted at several stages in egg development and is only completed atfertilization. The initial development of the ovary and its internal structures is mostly afunction of body size. For the purposes of this discussion, this phase of development will notbe included in the stages of the reproductive cycle. Descriptions of the basic stages in fishoocyte development can be found in Wallace and Selman (1981).
The following stages of reproduction result in oocytes being recruited into the nextcohort of spawned eggs. Stage I of oocyte development involves the development of basiccellular structures such as enlargement of the nucleus and appearance of multiple nucleoli andsubcellular organelles including the cortical alveoli which play and important role infertilization events. There is a substantial amount of protein synthesis in the developingoocyte which is referred to as endogenous vitellogenesis. Two cell layers, the theca andgranulosa cells develop and surround the oocyte to form a follicle and support further growth.The theca and granulosa cells are responsible for production of reproductive steroid hormonesthat regulate successive stages of reproduction. At the end of stage I, there is a well definedoocyte encased in its follicle.
Stage II is vitellogenesis, which is the synthesis and uptake of egg yolk proteins whichprovide nutrients for the developing embryo. Vitellogenesis involves the interaction of theanterior pituitary in the brain, the follicle cells, the liver and the eggs. The anterior pituitaryproduces hormones known as gonadotropins and releases these hormones into the circulation.The gonadotropins directly stimulate the theca and granulosa cells to produce estrogen whichtravels in the blood to stimulate the liver to produce vitellogenin, which is the precursor to theegg yolk proteins. Vitellogenin is secreted into the blood and is taken up by the oocytethrough specific receptors. Vitellogenin is further processed into smaller yolk proteins forstorage until they are needed by the embryo. Vitellogenesis is the longest phase of oocytedevelopment and requires a great deal of nutrient input. The nutrients can come eitherdirectly from feed or from body stores of muscle and fat. If insufficient amounts of yolkproteins are deposited into the oocytes then the fry that are produced from these eggs will notcomplete development and will have high mortality as eggs or sac-fry.
Stage III of oocyte development is maturation which is caused by the steroid hormoneprogesterone. It is the final stage of development and usually requires 24-72 hours. This stepmust be completed for viable eggs to be spawned. During this stage, the nucleus of the eggmigrates from the center of the egg to the periphery and meiosis resumes but pauses againbefore completion. The membrane surrounding the nucleus disappears in a process referred toas germinal vesicle breakdown. Depending on the species, uptake of water occurs duringmaturation. This can often be seen in females as the belly becomes even more distended andfirm When maturation is complete, the oocytes are ovulated from the follicle due to theinfluence of prostaglandin’s. In some species, the oocytes are retained in the ovary and inother species the eggs are released into the peritoneal cavity until spawning.

bidwell.doc
Spawning
Stage IV is spawning which should occur shortly after maturation or the eggs willbecome overripe. In an aquaculture setting, spawning requires the proper environment orultimate factors to elicit spawning behaviors. This includes both day length and watertemperature cues and interactions between males and females as well as spawning substrates.In some species, one sex will prepare a nest for spawning. In pond spawning of channelcatfish, milk cans or ammo boxes are submerged in the spawning ponds that enable the malesto prepare a nest. Females that are ready to spawn will enter the nest and engage in matingbehaviors that result in the release of eggs and milt that form a gelatinous mass of fertilizedeggs. After spawning, the male will remain with the eggs and fan them for oxygen exchange.If the eggs are removed then the male will start over again. In other species, aquaticvegetation are natural spawning substrates so grass fiber mats can be submerged or floated inthe ponds to stimulate natural spawning.
Spawning can also be induced by injection of gonadotropic hormones. Carp pituitaryextract or human chorionic gonadotropin are most commonly given in single or multipledoses. Generally only stage III can be induced by gonadotropin treatment which will becompleted in 24-72 hours. Often sampling of the oocytes is done in order to determine ifvitellogenesis or oocyte maturation is complete. For some species, a minimum oocytediameter is known that indicates that vitellogenesis has been completed. Other characteristicssuch as the clarity of the yolk can indicate whether hydration has occurred. In many species,the yolk becomes clear and translucent as hydration is completed. In striped bass, the oilglobules are small and disperse in immature eggs and gradually coalesce into a single largeglobule when the oocytes have completed maturation.
When the fish are ready to spawn either naturally or through hormone induction,manual spawning can be used in many species by squeezing the eggs and milt from the fishand mixing them together. This is most commonly done in salmonid species and many gamefish. Dry stripping is a technique of collecting eggs and milt in the absence of water and wetstripping involves stripping the eggs and milt into a small amount of water. The broodstockare often anesthetized in MS 222 prior to stripping, however, the fish should be rinsed in freshwater and dried before stripping because MS 222 is toxic to both sperm and eggs.
Fresh water activates both sperm and eggs for fertilization. Activation of oocytesinvolves the release of the contents of the cortical alveoli into the space between the eggmembrane and the chorion which forms the egg shell. There is a hole in the chorion called themicropyle that allows the sperm to pass through and fertilize the egg. Upon activation andrelease of the cortical alveoli, the chorion lifts off the egg membrane and the micropyle beginsto close. Sperm become motile and capable of fertilization upon contact with the water.After about one minute, the micropyle will be closed and the motility of the sperm willdecrease. Wet stripping involves adding eggs and milt to a small amount of water in analternating fashion so that freshly activated eggs and sperm are constantly being mixedtogether. The dry stripping technique allows collection of all the eggs and milt followed bythorough mixing prior to activation. Both techniques can produce good fertilization rates butwet stripping requires broodstock that strip easily, good timing and sufficient knowledgeable.The dry stripping technique will be a little more forgiving for the inexperienced or if problemsarise and would be preferred for use with polyploidization techniques due to the more uniformtime of fertilization.

bidwell.doc
Conclusions
The species used for aquaculture in North America will use a variety of reproductivestrategies. The aquaculturist will need to provide both the proximate and ultimateenvironmental cues that sustain the reproductive cycle. In annual spawning species, theproximate factors that signal early oocyte development and vitellogenesis are as important forproducing high quality, viable eggs as the ultimate factors that signal maturation andspawning. At this time, hormonal treatments only induce the final stages of reproduction infemales so providing the proper environment for reproduction well in advance of spawningseason is essential for the development of broodstock.
References
Sumpter, J.P. 1990. General concepts of seasonal reproduction. In “Reproductive Seasonality inTeleosts: Environmental Influences" (A.D. Munro, A.P. Scott, T.J. Lam eds.) CRC Press, BocaRaton, FL.
Wallace, R.A. and Selman K. 1981. Cellular and dynamic aspects of oocyte growth inteleosts. Amer. Zool. 21, 325-343.

kohler.doc
INDUCED SPAWNING OF FISHES
Christopher C. Kohler Fisheries Research Laboratory
and Department of ZoologySouthern Illinois UniversityCarbondale, IL 62901-6511
The ability to control the reproductive cycle of target species is of paramountimportance to successful aquaculture. The controlled induction of spawning enables theaquaculturist to obtain eggs and fry on an as-needed basis. Moreover, some species of fish donot normally spawn in captivity, thus necessitating induction through artificial means.
Most fishes in temperate climates spawn annually with mature eggs and sperm beingproduced when external conditions favor offspring survival. Photoperiod (day length) andtemperature are the prevailing spawning cues for fishes native to the temperate zone.However, gonadal maturation generally extends over many months with the actual release ofgametes comprising only a brief period in the developmental process. Even thoughenvironmental cues external to the fish are responsible for initiating gonadal maturation andreproduction, it is the hormones produced by the endocrine system which directly control thereproductive process. The primary hormones involved are produced by the hypothalamus,pituitary, and the gonad. It is through the understanding of this process that manipulation ofthe reproductive cycle becomes possible.
A combination of changes in the external and internal environment of the fish causes apart of the brain called the hypothalamus to secrete small peptides known as releasinghormones. These peptides pass to the pituitary stimulating this gland to secrete gonadotropichormones into the blood stream, ultimately attaching to receptor sites in the gonads andinitiating all structural and functional changes in the testis or ovary (depending on sex of fish).In male fish the major testicular hormones (androgens) produced are testosterone and 11-ketotestosterone, while in female fish there are two classes of hormones, i.e. estrogens(estradiol-17β and estrone) and progestagens (17α-20β-dihydroprogesterone and 17α-hydroxyprogesterone). All of these gonadal hormones have a steroidal structure.
Methods to induce fish to spawn in captivity have been employed in aquaculture forover 50 years. Globally, pituitary extracts are the most widely used agent employed to inducefish to spawn. This procedure, often called hypophysation, requires using pituitary materialfrom suitable donor fish. Oftentimes the same or closely related species is used. However,carp pituitary extract (CPE) and salmon pituitary extract (SPE) are commercially sold andhave been successfully used with numerous species. Usually CPE is used for warmwater fishand SPE for cool and coldwater fish. Although pituitaries can be used in a fresh state, theyare usually dried in acetone into powdered form. Pituitary extracts can be rather variable inpotency since they are generally composites of extracts taken from many fish of variablematurity. Another limitation is that hypophysation is only effective in broodfish already in thefinal stages of maturation. Dosages for pituitary extracts range from about 1.0 - 10 mg/kg offish, often done in two injections 3-6 hr. apart.

kohler.doc
Human chorionic gonadotropin (hCG) has been widely used since the 1930s to inducespawning and increase milt volume in various species of aquaculture fish. The advantages tohCG are that it is relatively inexpensive and is of known and consistent potency. Studies haverecently been concluded for FDA and a particular brand of hCG, Chorulon®, is currently beingconsidered for FDA approval and labeling for use in broodfish. Dosages in broodfish haveranged from 50 to over 2,000 IU (international units) /kg fish. In most cases, a given dosagehas been cited in the literature as successful and that dosage adopted. Recently, it wasdetermined at my university that dosages commonly used for white bass (Morone chrysops)are much too high. We recommend 150 IU/kg fish as being efficacious for most coolwaterfishes. HCG suffers from the same limitation as pituitary extracts in that it is only effective infish that are already sexually mature.
In more recent years, the releasing hormones (LHRH; GnRH) and their more potentsynthetic analogs (LHRHa) have been widely used. Relatively small quantities injected intofish causes release of endogenous gonadotropic hormones from the pituitary eliciting finalmaturation and spawning. Dosages of LHRHa are usually in the 5-100 µg/kg fish range.Some evidence exists that pretreating and/or simultaneous injection of pimozide (a syntheticdopamine antagonist) at 10 mg/kg fish inhibits production of other hypothalamic hormonesthat serve as negative feedback preventing further release of gonadotropin.
It is generally recommended that administration of hormones to broodstock beconducted under anesthesia. The recommended anesthesia is MS-222 (tricainemethanesulphonate) at 50-100 mg/L water and buffered with sodium bicarbonate (bakingsoda) to pH 7.
Spawning hormones are usually injected with a syringe (the gauge depends on size offish), either intramuscularly (IM) or intraperitoneally (IP). In general, pituitary extracts andhCG are injected IM, while the releasing hormones are done IP. The IM injections are usuallydone midway between the dorsal fin and lateral line (if present) at a point where the tip of thepectoral fin touches when depressed. The injection is made perpendicular to the fish so as notto hit the vertebrae. The IP injections are done vertically, slightly above the vent towards thehead. The needle is inserted into the body cavity at an angle pointing towards the headparallel to the fish.
The releasing hormones are sometimes administered in slow release implants such ascholesterol capsules, silastic tubing, and various polymers. This is done to bring the fish intosexual maturity over an extended period of time.
Even with hormone supplementation, fishes held in captivity oftentimes still do notreach sexual maturity and spawn. For many fishes, it is necessary to maintain a naturalphotothermal regime simulating the seasons of the year. It is also possible to either extend orshorten these seasonal cycles in order to manipulate the time of year in which the fish willspawn. We have successfully used this technique at my university to spawn out-of-seasonwhite bass and channel catfish (Kohler et al. 1994; Kelly and Kohler, 1996).

kohler.doc
In many cases the injected fish will not spawn after ovulation necessitating manualstripping. The broodfish should first be anesthetized as previously described for injection.However, the fish should be rinsed with clean water to remove any residual anesthetic as thismight reduce sperm motility and/or egg viability. Stripping is classified as the wet, dry, ormodified method. In the wet method, eggs are stripped into a pan with water followed bysperm. The fish sperm becomes activated upon contact with the water. Because most fishsperm does not stay activated for very long, the dry method is often employed. In this case,the eggs are stripped into a dry pan and the sperm is added. A feather is often used to ensurethat all eggs are coated with sperm. Water is then added to activate the sperm forfertilization. In the modified method, sperm and water are simultaneously added to the eggs.
Literature Cited
Kelly, A.M. and C.C. Kohler. 1996. Manipulation of spawning cycles of channel catfish inindoor water-recirculating systems. The Progressive Fish Culturist 58:221-228.
Kohler, C.C., R.J. Sheehan, C. Habicht, J.A. Malison, and T.B. Kayes. 1994. Transactions ofthe American Fisheries Society 123:964-974.
malison.doc
REPRODUCTION AND SEX REVERSALIN YELLOW PERCH AND WALLEYE
Jeffrey A. MalisonUniversity of Wisconsin Aquaculture Program,Department of Food Science, 123 Babcock Hall
Madison, WI 53706-1565, USA
Reproduction
Many similarities exist in the reproductive biology of yellow perch and walleye.Sexual maturity in both species is dependent on fish size and age. Male perch often mature at1-2 years of age and at >90 mm total length (TL), whereas females do not usually mature untilthey reach 130 mm TL. Male walleye generally mature at 2-4 years of age and at >280 mmTL, and females mature at 3-6 years of age and at >360 mm TL. Both species spawn onceeach year in the spring. In the Midwest, perch spawn from late March through May, whenwater temperatures reach 10-12°C, and walleye spawn somewhat earlier, when temperaturesreach 4-8°C.
In the wild, both species randomly spawn on suitable substrates, and do not build nestsor provide any parental protection. The eggs of yellow perch are uniquely interconnected in aconcertina-shaped ribbon. Both the number and size of perch eggs increase with the size ofthe female, ranging from less than 5,000 to more than 20,000 eggs per fish and from 100-200eggs per ml. Female walleye produce 40,000-80,000 eggs per kg of body weight, and walleyeeggs range in size from 70-150 per ml.
In both species, the gonads of both sexes are repopulated with new germ cells duringthe late spring and summer. Normal gonadal development requires that fish be held undernear-ambient temperature and photoperiod conditions. Rapid gonadal growth is triggered bydeclining temperature and photoperiod in the autumn, and occurs earlier in walleye(September-October) than in perch (November-December). By mid-winter, almost all of thegerm cells present in the testes are spermatozoa, and some semen can be expressed byapplying gentle abdominal pressure. During the spawning season, injections of humanchorionic gonadotropin (hCG) or a super-active analog of luteinizing hormone releasinghormone (LHRHa) can induce final oocyte maturation and synchronize spawning in females ofboth species. In addition, these compounds can be used in conjunction with simpleenvironmental manipulations to advance spawning in walleye by at least two months. FDA-NADA approval for using hCG in many fish species including perch and walleye is anticipatedin the near future.
Propagation Methods
Several methods are currently used to propagate yellow perch. For pond culture, thesimplest method is to stock several pre-spawn adults into fingerling ponds and allow them tospawn naturally. A major disadvantage to this method, however, is that the aquaculturist haslittle control over when the fish spawn and how many fry are eventually released into thepond. Maximum control over these and other important factors can be gained by holding pre-spawn adults in tanks during the spawning season, and as females mature their eggs can be

malison.doc
manually stripped, fertilized, and incubated until hatch. Hormone injections can reduce theperiod of time over which a group of females will spawn from 3-4 weeks to 3-4 days. Iffemales are inspected twice daily for signs of ovulation, over 80% of the eggs from a group offemales can be successfully stripped and fertilized. Perch eggs are usually incubated bysuspending the ribbons from wires in tanks. Hatch occurs 8-21 days after fertilization,depending on water temperature. In our laboratory we normally incubate perch eggs under agradually increasing water temperature regime of approximately 0.5°C per day from 11-15°C,and under these conditions the eggs hatch in 11-13 days. To maximize hatch, perch eggs mayneed to be exposed to mechanical disruption when the embryos reach maturity.
To propagate walleye, most hatcheries manually fertilize eggs from brood stockcaptured from the wild or held in ponds. In our laboratory we normally spawn females thathave already ovulated prior to capture. Females captured one or two days prior to ovulation,however, will often mature in captivity without further treatment. Less mature females thatare captured can be induced to spawn using hormone injections. Walleye eggs become highlyadhesive shortly after they are exposed to water. To prevent the eggs from clumping at thistime they are normally exposed to a suspension of clay, bentonite, or pond muck, or treatedwith a solution of tannic acid or protease. The most common type of incubator used forwalleye eggs are jars supplied with an upwelling flow of water. During incubation, eggs areoften treated with formalin to inhibit fungal growth. As with perch, the incubation time ofwalleye eggs from fertilization to hatch varies with temperature, and can range from 7-26days. In our laboratory we normally incubate walleye eggs under a gradually increasing watertemperature regime of approximately 0.5°C per day from 11-15°C, and under these conditionswalleye eggs hatch in 11-13 days. Fry are usually allowed to swim out of the hatching jarsand into a centralized collection tank.
Sex Reversal
In both yellow perch and walleye, females grow significantly faster and reach a largerultimate size than males. The accompanying graphs show the comparative growth of maleand female perch and walleye that were reared in our laboratory under near-optimalenvironmental conditions for growth (21°C and 16h light / 8h dark photoperiod). In bothspecies, the difference in growth between the sexes occurs before fish reach normal marketsize. Accordingly, for food fish production the use of all-female stocks would be a significantbenefit. In addition, for stocking recreational fisheries, the use of all females may increaseoverall fish size and the number of trophy fish.
In fish species, such as yellow perch and walleye, in which females are homogametic(i.e., genetically “XX”), three potential methods of producing monosex female populations are(1) direct feminization of juveniles using estrogen; (2) gynogenesis; and (3) indirect use ofhormones in which juveniles are treated with androgens to induce phenotypic sex inversion ofgenetic females, and the sperm from these masculinized females (all of which have an “X”chromosome) are used to fertilize normal eggs. Direct estrogen treatment is not the preferredmethod because of government regulations and consumer concerns regarding the use ofhormones in animals destined for human consumption. Likewise, gynogenesis is not the bestmethod because the performance of gynogens can be negatively affected by increasedhomozygosity and by the heat or hydrostatic pressure shocks used to induce gynogenesis. Forthese reasons, the indirect use of androgens is the method of choice to produce monosexfemale populations of perch and walleye. One potential drawback to this method, however, is

malison.doc
the lag time of one generation that is required to rear treated fish to sexual maturity.
Yellow Perch
Walleye
Treatment of age-0 yellow perch (initially 20-35 mm TL) with 17α-methyltestosterone(MT) at 1.5-60 mg/kg diet for 60-84 days effectively induces partial sex inversion and causesgenetic females to produce sperm. In walleye, treatment of age-0 fish (initially 50-70 mm TL)with MT at 50 mg/kg diet for 60 days also induces partial sex inversion. For both perch andwalleye, the induction of partial rather than complete sex inversion can be accomplished bytiming the initiation of MT treatment to be approximately coincident with the onset ofoogenesis. The main advantage of inducing partial rather than complete sex inversion is theease with which genetic males can be distinguished from genetic females once the fish reachsexual maturity. In both species, sperm collected from masculinized females can be used tofertilize normal eggs, and the resultant offspring are 100% (“XX”) females. The University ofWisconsin-Madison is currently acting as an FDA-INAD sponsor (in conjunction with Auburn
0
10
20
30
40
Wei
ght
(g)
0 25 50 75 100
Day
Female
Male
50
150
250
350
Wei
ght (
g)
0 100 200 300
Day
Female
Male

malison.doc
University) for three private fish farms using MT to produce monosex female yellow perch.Additional research funded by NCRAC is being conducted as part of an effort to gain FDA-NADA approval for using MT.

griffin.doc
TILAPIA REPRODUCTION AND SEX REVERSAL
Mark Griffin6481 Jackson St.
Indianapolis, IN 46241
Introduction
The Tilapias are a diverse group of tropical African Cichlids which have various bodyshapes and colors. The most common tilapia grown for food fish in the US are the NineTilapia, a white colored Nile Tilapia/Aurea cross and the Mossambique. The Nile Tilapia hasthe fastest growth rate, but the while colored tilapia has the most market appeal. TheMossambique is grown in California where the Nile Tilapia is illegal.
Reproduction
All of the tilapia commonly grown for food fish are mouth-brooders and exhibit a highdegree of parental care for fish. Female tilapia obtain sexual maturity at a size of 20-60 g andwill spawn every three to eight weeks. Females produce 300-1000 offspring per spawn withthe number of offspring being somewhat dependent on the size of the female. Afterfertilization by the male, the female takes the eggs into her mouth to incubate them. The eggshatch within the mouth and the sac-fry remain in the mouth for protection. When the frybecome free-swimming, they leave the female’s mouth in search of food.
Tilapia Production
Tilapia are relatively easy fish to breed. Hatcheries typically stock 1 male for every 3to 5 females. To increase fry production, fertilized eggs may be collected from the female’smouth and incubated until hatch. However, many hatcheries allow the female to hold the eggsuntil hatch and harvest the free-swimming fry.
Male tilapia have better growth rates and feed conversion than females and thereforereach market size sooner. Thus, all male populations of tilapia are necessary for efficientproduction. There are four techniques used to obtain a predominantly male population oftilapia, they are: 1) grading or sorting; 2) selective hybridization; 3) use of supermalebroodstock; and 4) chemical sex reversal.
Grading and Sorting
Grading and sorting is probably the oldest technique and is still used in the US today.This technique is labor intensive and often does not have acceptable results.
Selective Hybridization
Certain crosses between different species of tilapia have long been known to result inall male hybrid offspring. The most commonly produced hybrid is that of the T. nilotica x T.
aurea cross. Success with this technique is dependent on maintaining pure genetic lines of the

griffin.doc
parental species. Although this technique is being used in the US, most hatcheries find it toomanagement intensive.
Use of Supermale Broodstock
The most recently developed technique to produce a male population of tilapia is theuse of supermale broodstock. Supermales (males with a YY genotype) can only produce maleoffspring. Although this technique has great promise, there are very few, if any, large scalefingerling producers using this technique. The overwhelming drawback thus far has been theproduction of the supermale broodstock, which requires great managerial skill and extensiveprogeny testing. This technique will not become common until supermales are readilyavailable at a price which proves to be cost-effective.
Chemical Sex Reversal
The most common technique to produce a predominantly male population is that ofchemical sex reversal. first feeding fry are fed a diet laced with methyl-testosterone for atleast 21 days. When done properly this technique is very effective, often resulting inpopulations greater than 90% male. Methyl-testosterone is not an FDA approved chemicalfor tilapia at this time. Therefore, the only legal way a producer can use this chemical is tobecome an investigator in the methyl-testosterone INAD, which is being organized by AuburnUniversity. As of January 1997, data is still being compiled and FDA approval is not expectedfor at least a year.

kellum.doc
FARM POND MANAGEMENT
David KellumIndiana Department of Natural Resources
Division of Fisheries
Private ponds, also called farm ponds, represent a tremendous fishing potential inIndiana. There are over 40,000 ponds in the state -- with an average pond size of about oneacre. Many new ponds continue to be constructed each year. While most ponds are found insouthern Indiana, they are widely distributed throughout the Hoosier area. The primary use ofIndiana ponds is fishing, however they provide opportunities for erosion control, fire control,livestock watering, irrigation, swimming, picnicking and wildlife enhancement. Thispresentation will address some of the more common questions regarding farm pondmanagement. I will be referencing primarily the DNA publication Farm Pond Management.Copies are available after this presentation and upon request from the Indiana Division of Fishand Wildlife.
Good fish management begins with understanding your pond’s physical, chemical andbiological features. These three features determine the quality of fishing your pond canproduce and the kinds of problems you may encounter.
Your local National Resources Conservation Service office, formerly known as theSoil Conservation Service, is a valuable resource for information on pond construction. TheNCR office can provide the technical engineering advice you need to properly construct anddesign a pond. I have a list of all the NRCS offices in Indiana. This list is also available fromthe NRCS Central Office in Indianapolis. Also contact your county survey, planningcommission, or the Indiana Department of Natural Resources to obtain the necessary permits.If you are constructing a pond for fishing purposes several factors should be considered.
Physical factors to be kept in mind when constructing a pond include size, water levelcontrol, depth, and surrounding landscape. Size: ponds should be a minimum of one surfaceacre in size to support sustainable fish populations. Water-level control: ponds should have adrain line installed to allow for water level drawdowns. Depth: deep is not always better.Most ponds in Indiana do not contain enough oxygen for fish in water greater than 15 feetdeep during the summer. Exceptions include gravel pits or spring fed ponds that maintaincool water temperatures of less than 70°F. Surrounding landscape; This is perhaps the mostcommon cause of poor fishing conditions in Indiana ponds. Runoff from surrounding farmfields and feedlots add a great deal of nutrients into the pond, thus disrupting the chemical andbiological balance of the pond. Do not allow cattle to trample the bank and muddy the water;this promotes erosion and nutrient problems. Keep a wide buffer zone between farm field andthe pond. Fertilizers, pesticides and erosion can negatively impact the pond.
Chemical factors: the most important chemical feature of the pond is the amount ofdissolved oxygen, or D.O. Low D.O. causes stress in fish which will trigger secondaryproblems, such as disease. Bluegill, largemouth bass and channel catfish require more than 5parts per million (ppm) of oxygen. Dissolved oxygen can be checked using a testing kit fromthe Hach Chemical Company. An inexpensive alternative to buying the kit is to partner withone of the many school-based water quality testing groups operating in Indiana. They maytest your water for free if you allow them to conduct a field trip at your pond. These groups

kellum.doc
may also test you pH, nitrate levels, and bacteria counts. Contact your local NRCS office orschool system to locate the water-quality testing group nearest you.
Carrying Capacity: a pond can not produce a limitless supply of fish. The climate,fertility and the types of fish determine the amount of fish the pond can produce. This is oftenreferred to as the “standing crop” and it is a theoretically finite number. For example a pondmay have a standing crop of 320 pounds of fish. The amount might consist of 640, one-halfpound bluegills or 200 one-pound bluegills and 60 two-pound bass. A pond owner canmanage the combination of fish species and the sizes of the fish in the pond to best fit his/herdesired use. This begins with a fish stocking strategy.
Fish Stocking Strategy: the stocking strategy you choose depends on the kind offishing you desire from your pond. As aquaculturalists, you know the proper conditions of apond for raising food fishes only such as channel catfish. What becomes more of a challengeis the management of a multi-species pond for the purpose of recreational fishing. The mostcommon combination is the bluegill, largemouth bass, channel catfish combination. Thesespecies have the least amount of competition between each other and the combination ispractically self-sustaining (channel catfish have poor reproduction in pond situations). Pondowners sometimes substitute redear sunfish for bluegill because they rarely overpopulate.However, redear are more difficult to catch than bluegill and they may require restocking.Other combinations involving smallmouth bass, walleye and northern pike can be used if thepond owner is willing to pay for expensive and periodic restocking. Trout may be viable indeep, cool, well-oxygenated ponds. The use of hybrid bluegill is very popular. A crossbetween a bluegill and a green sunfish will produce a fast-growing, bluegill substitute that willnot over populate the pond. The major drawback to the use of hybrid bluegill is thatrestocking may be necessary since reproduction is very poor.
There are two main don’t to fish stocking. 1) Don’t stock fish that will compete witheach other for resources. For example largemouth bass and white crappie compete directlyfor food. A pond stock with both will probably only produce mid-sized specimens. 2) Don’tstock wild fish. Field identification of both adult and young fish is difficult and the change ofstocking incompatible species is very high. Also wild fish may introduce disease and inferiorgenes to the pond’s fish population. The key to obtaining good quality fish for stocking ispurchasing the fish from a reputable hatchery. A list of state hatcheries is available throughoutthe Indiana Division of Fish and Wildlife.
How many fish to stock?The standard ratio of bluegill and largemouth bass recommended by the DNR is five
bluegill fingerlings to one largemouth bass, not exceeding 1, 000 bluegill and 200 bass peracre. Low fertility ponds will require fewer fish per acre. The desirable stocking size is oneto two inch bluegill and three to four inch bass. Channel catfish are recommended to be fourto six inches long and stocked at a rate of 100 fish per acre. If hybrid bluegill are used, stock10 hybrids per each largemouth bass.
So far I have presented the proper formula for creating a productive fishing pond. Ifwe lived in a perfect worked every pond would be full of trophy bass and plate-size bluegill.But we know that is not the case. I will devote the remainder of the presentation to the twomost common problems with ponds that I hear while traveling through Indiana.

kellum.doc
Problem number one“My pond is too weedy”. We must remember that aquatic vegetation is an important
component of a healthy pond. The rule of thumb is that treatment is recommended if morethan 25% of your pond’s surface area is covered with vegetation. Once the need fortreatment is established, the next step is to identify the offending vegetation from the pond.Permeable filter fabric may be placed on the bottom to control weeds in certain spots.Chemical control is a very popular means of control. It is extremely important to use onlyfederally approved aquatic herbicides and to follow the label instructions. The most commonproblem occurs when a pond owner applies too much herbicide and disrupts the entireecological balance of the pond. To help avoid disasters the Indiana Division of Fish andWildlife can send you a list of licensed and certified commercial aquatic pesticide applicatorsin the state. Stocking grass carp is a possible alternative to chemical control. Infertile,triploid fish are legal to stock in Indiana. A grass carp bulletin is available from the IndianaDivision of Fish and Wildlife. It should be noted that results of using grass carp for aquaticweed control are highly variable and are not guaranteed. Often pond owners will stock toomany grass carp and they will decimate the aquatic weed community. Also not all aquaticweeds are controlled by grass carp. A complete description of grass carp use is available inthe Indiana Division of Fish and Wildlife publication Fish Pond Management.
Problem number two “All of the fish are too small”. First, keep written records of the fish caught in yourpond. By reviewing the number and size of the fish being caught you can determine theproper course of action. Keep in mind the notion that a pond can only sustain a finite numberof pounds of fish. If many small bluegill are caught and few large bass, protect the large bassby restricting harvest and reduce the number of small stunted bluegill. To accomplish this youmay request that angles keep all of the bluegills caught or you can craw the water-level downpast the week line. This drastically reduces the amount of cover available for small bluegill tohide from large predator bass. Predation of the bluegill population should increase and thusdrive its numbers down. The pond can then be allowed to fill to normal level once the exposedweeds have died.
Another possible problem may be that many different species of fish are competing forthe same resources. If this is the case eradication of the entire fish population may benecessary. Once all of the fish have been eliminated from the pond, either by draining thepond or by chemical treating the water, the pond can be restocked with the proper balance ofcompatible fish species.
Once again the Fish and Wildlife publication entitled Fish Pond Management addressall of the points covered in this presentation. Other tips and techniques are also describedsuch as how to control muddy water conditions and other nuisance species. The real secret tofish pond management is to pay attention to the entire pond: the water, fish, plants, andsurrounding landscape. Actively manage these factors and you will have great fishingopportunities for generations.

summerft.doc
WATER QUALITY CONSIDERATIONSFOR AQUACULTURE
Robert C. SummerfeltDepartment of Animal Ecology
Iowa State UniversityAmes, IA 50011-3221
Introduction
Fish and other organisms with aquacultural potential live in water, thus, it is no surprise thatprofessional fish culturists state that "Water quality determines to a great extent the success or failureof a fish cultural operation" (Piper et al. 1982). Because water is an essential requirement for fishfarming, any properly prepared business plan for aquaculture must describe the quality and quantity ofwater available for the proposed enterprise. An experienced aquaculturist can judge whether thewater is suitable for the proposed enterprise.
The objective of this report is to present a brief overview of a few physical and chemicalqualities of water that are of importance to aquaculture—the business of fish farming. Although thequantity of water available is of primary importance, only water quality factors are considered here.
Groundwater and Surface Water Sources
There are two main categories of water supply for aquaculture, groundwater andsurface water. Groundwater (also called well water, or spring water) often differssubstantially from surface water in many characteristics (Table 1). Groundwater is commonlyconsidered the most desirable water source for aquaculture because, at a given site, it isusually consistent in quantity and quality, and free of toxic pollutants and contamination withpredator or parasitic living organisms. Natural springs occur where groundwater emergesfrom rock stratum containing an aquifer. Because spring water has consistent and desirabletemperature characteristics, not to mention the valuable fact that it may not be necessary topump the water to the raceways, springs are the most common water supply for land basedtrout and salmon culture (land based as contrast with net pen culture in coastal waters).Idaho’s rainbow trout production, the largest U.S. producer of food-size rainbow trout, with74.6% of the 53.6 million pounds in 1996 (USDA 1996), is based on numerous spring flowfrom the walls of the Snake River Canyon near Hagerman in southern Idaho. Just one facility,Clear Springs, the largest producer of rainbow trout in the USA, raised 18 million pounds in1990 (Anonymous 1990).
The temperature and quality of groundwater varies latitudinally and from site to site becauseof geological characteristics of the aquifer (the bed or layer of earth, gravel, or porous stone thatyields water)—old aquifers often have high concentrations of radon, a factor that is seldomconsidered as a factor in aquaculture. Briny (i.e., salinity > 7 parts per thousand, ppt) groundwatersare widely dispersed in the U.S., and surface waters in the intermountain basin area of Utah, Nevada,and other arid western sites are also saline (e.g., Salt Lake, Utah) or alkaline. In west Texas, largequantities of shallow groundwater are not used for conventional agriculture because they are toosaline (> 7 parts per thousand), however, they have been considered an aquaculture potential resourcefor culture of red drum, an economically popular sport and food fish from the Gulf of Mexico
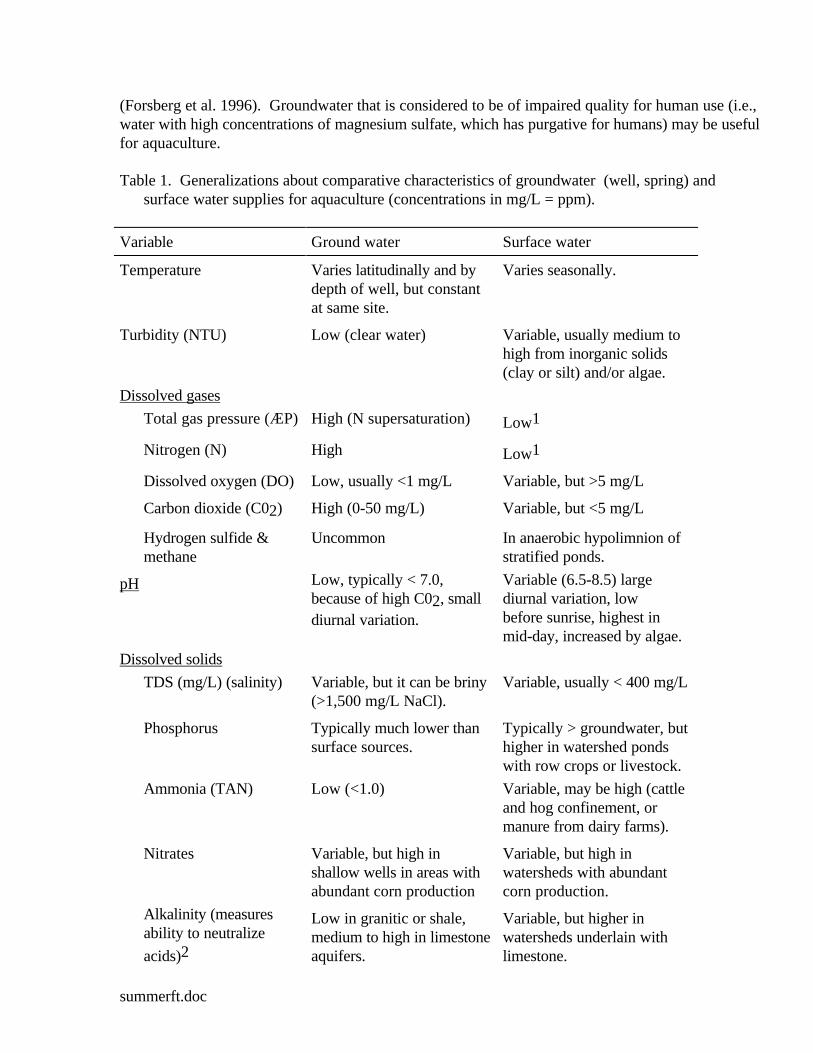
summerft.doc
(Forsberg et al. 1996). Groundwater that is considered to be of impaired quality for human use (i.e.,water with high concentrations of magnesium sulfate, which has purgative for humans) may be usefulfor aquaculture.
Table 1. Generalizations about comparative characteristics of groundwater (well, spring) andsurface water supplies for aquaculture (concentrations in mg/L = ppm).
Variable Ground water Surface water
Temperature Varies latitudinally and bydepth of well, but constantat same site.
Varies seasonally.
Turbidity (NTU) Low (clear water) Variable, usually medium tohigh from inorganic solids(clay or silt) and/or algae.
Dissolved gases
Total gas pressure (ÆP) High (N supersaturation) Low1
Nitrogen (N) High Low1
Dissolved oxygen (DO) Low, usually <1 mg/L Variable, but >5 mg/L
Carbon dioxide (C02) High (0-50 mg/L) Variable, but <5 mg/L
Hydrogen sulfide &methane
Uncommon In anaerobic hypolimnion ofstratified ponds.
pH Low, typically < 7.0,because of high C02, smalldiurnal variation.
Variable (6.5-8.5) largediurnal variation, lowbefore sunrise, highest inmid-day, increased by algae.
Dissolved solids
TDS (mg/L) (salinity) Variable, but it can be briny(>1,500 mg/L NaCl).
Variable, usually < 400 mg/L
Phosphorus Typically much lower thansurface sources.
Typically > groundwater, buthigher in watershed pondswith row crops or livestock.
Ammonia (TAN) Low (<1.0) Variable, may be high (cattleand hog confinement, ormanure from dairy farms).
Nitrates Variable, but high inshallow wells in areas withabundant corn production
Variable, but high inwatersheds with abundantcorn production.
Alkalinity (measuresability to neutralize
acids)2
Low in granitic or shale,medium to high in limestoneaquifers.
Variable, but higher inwatersheds underlain withlimestone.

summerft.doc
Hardness (chiefly Ca++
and Mg++ ions).3
Variable, but commonlymedium to hard (50-250mg/L) .
Variable, soft to hard.
Soluble iron (Fe++) and
manganese (Mn++)
Common, quickly oxidizedin air (O2) to insoluble
forms (Fe+++, Mn+++)
Only in anaerobichypolimnion of stratifiedponds.
1See Boyd (1990a) about occurrence of gas supersaturation in ponds. 2Determined by
titration with a dilute solution of a strong acid (0.022 N H2S04). 3Determined by titrationwith EDTA, a chemical that chelates Mg and Ca (formerly titrated with a standard soapsolution).
An excellent reference on surface water supplies for aquaculture is Yoo and Boyd(1993). Runoff is obviously related to rainfall, therefore, water supply for watershed ponds isquite seasonal. Water storage is affected by seepage and evaporative losses, which vary inrelation to temperature and relative humidity. However, a large watershed pond (lake) mayhave sufficient storage volume to be suitable for cage culture or as a water supply foraquaculture. Obviously, water quality of watershed ponds is strongly influenced by land use.Watersheds dominated by row crops are typically higher in inorganic suspended solids fromsoil erosion than groundwater supplies.
Runoff of plant fertilizers (i.e., nitrogen and phosphorus) applied to row crops may causegrowth of nuisance algae and other aquatic plants in watershed ponds - a problem calledeutrophication. If there are high densities of livestock (pigs or cattle) or poultry, water quality maybe seriously degraded, not only from inputs of nutrients, but from ammonia and organic matter.Microbial decomposition of organic matter causes a biochemical oxygen demand (BOD) that canseverely reduce oxygen content.
Water Quality for Aquaculture
There is not time to review all water quality variables, so for the time available I shall attemptto summarize a few relevant facts about temperature, dissolved oxygen, pH, carbon dioxide,alkalinity, and ammonia. Books by Boyd (1990a and b) are excellent references on water quality andwater quality management for aquaculture.
TemperatureAlthough sometimes called poikiothermic, meaning that they are cold-blooded, most fish are
ectothermal, which means that their body temperature is the same as the surrounding water (tuna anda few other species have body temperatures somewhat higher than the surrounding water, but theyare not homothermal, that is they do not have constant body temperature such as mammals or birds).The body temperature of a eurythermal (wide range of temperature adaptation) fish like largemouthbass may range from near freezing to nearly 90°F. It is important to note that intrinsic differencesexist in adaptation of fish to water temperature. In regards to their temperature tolerance, fish arecategorized as coldwater, coolwater, warmwater, and tropical. Most tropical fish, such as tilapia, diewhen temperatures are less than 50°F (10°C), and most salmonids (trout and salmon) die whentemperatures exceed 80°F (25.7°C). Channel catfish, which are called warmwater fish, survive fromnear freezing to about 90°F (32.2°C). For each species, there exists upper and lower limits, as well as

summerft.doc
an optimum range for growth, which changes with development. The temperature for optimumgrowth of fish is called the SET, standard environmental temperature. The SET for rainbow trout is59°F (15°C), and 85°F (29.5°C) channel catfish. It must be recognized that designating a fish ascoolwater, or warmwater are broad categories, and that variation exists in the optimal temperature fordifferent species that are lumped in the same category. For example, brook, rainbow, and browntrout are coldwater salmonid fishes, but their temperature tolerance differs, brown trout are muchmore tolerant of high summer temperatures than brown trout. Arctic char, another coldwater fish,have optimum growth at 50-53.6°F (10-12°C), compared with 59°F (15°C) temperatures thanrainbow trout.
Because it is impractical to heat or cool large volumes of water in open ponds or single passflow-through culture systems (i.e., raceways), species selection is usually based on anticipated watertemperature. However, it is important to remember that the optimum temperature required for eggincubation, growth and development of larval fish, and for production of a food-size fish can be quitedifferent. The obvious advantage of recycle systems is that of energy conservation, heating water isexpensive, but only a small part of total system volume (2-6%) of new water is added each day.
For ectothermal animals—which include bacteria, insects, zooplankton, frogs and turtles aswell as fish—temperature is a critical environmental factor that strongly influences feeding andgrowth. Also, fish are stressed and disease outbreaks occur after a sudden temperature change orwhen temperatures are chronically near their maximum tolerance. The metabolic rate of ectothermalanimals is said to double with each 18°F (10°C) rise in temperature, a relationship called the Q10factor. For example, the recommended (Piper et al. 1982) feeding rate (lb. of pelleted feed per l00pounds of fish) for 5-6 inch rainbow trout is 1.7 lb. at 50°F (10°C) but 2.3 lb. at 59°F (15°F), a 35%increase over 9°F (5°C), not quite reaching at 1/2 the Q10 factor.
Temperature shock, which will stress or cause high mortality of fish, occurs when fish aremoved from one environment to another without gradual acclimation ("tempered") to the othertemperature. Boyd (1990) reported that 0.2°C/minute (12°C/hour) can be tolerated "provided thetotal change in temperature does not exceed a few degrees."
It is important to remember that temperature controls the solubility of gases in water, and thereaction rate of chemicals, the toxicity of ammonia, and of chemotherapeutics to fish. In freshwater,at sea level, the solubility of oxygen is 11.3 mg/L at 50°F (10°C), but only 9.0 at 70°F (21.1°C)(Figure 1). Solubility of oxygen also decreases with elevation.
89
1011121314
Dis
solv
ed o
xyge
n (m
g/L
)
40 50 60 70 80 90
Temperature (°F)
1,000 feet above sea level
Sea level
Figure 1. Solubility of oxygen in relation to temperature and elevation

summerft.doc
Dissolved Oxygen (DO)Oxygen is the first limiting factor for growth and well-being of fish. Fish require oxygen for
respiration, which physiologists express as mg of oxygen consumed per kilogram of fish per hour (mgO2/kg/h). The respiratory rate increases with increasing temperature, activity, and following feeding,but decreases with increasing mean weight. here are several important implications of thesephysiological facts for aquaculture:
• At a given temperature, smaller fish consume more oxygen per unit of body weight than largerfish; or said in another way, for the same total weight of fish in a tank, smaller fish requiremore oxygen than larger fish
• Actively swimming fish consume more oxygen than resting fish. In raceways, high exchangerates will increase energy expenditures for swimming, and oxygen consumption.
• Oxygen consumption of fish will increase after feeding, multiple feedings per day (3 or more)will result in less variation in oxygen demand than 1 to 2 feedings per day.
If a tank is stocked with fish, over several weeks of a growth cycle, the fish will grow,
reducing their consumption rate (inverse OC-fish size relationship), but the density (pounds/cubic ft3)will increase. Flow to the tank will have to be increased or the population divided to handle the largeroxygen demand. The oxygen consumption rate of fish of different species ranges range from 200-500(mg O2/kg/h).
Oxygen concentration in water is expressed as parts per million (ppm), which is equivalent tomg/L, or as a percent of saturation value for that temperature and pressure (altitude). Recall, thatoxygen concentration at saturation varies in relationship to water temperature and elevation.Elevation is not of much concern throughout the Midwest because elevation changes are minor,however, in the West, particularly in the Rocky Mountains, elevation changes can be substantial,which can reduce the saturation of oxygen in air saturated water. Oxygen concentration should notbe less than 70% of saturation. Blood oxygen capacity decreases with lower pH or high C02, andincreases in temperature not only reduce the saturation level of water, but also reduces oxygen affinityand oxygen capacity of the blood; fish maintain supply to tissues by increased ventilation, as can beseen by opercular movement.
In ponds, the major source of oxygen is from algal photosynthesis and from wind mixing theair and water. In tanks or raceways, oxygen is supplied by the inflowing water, which should be nearsaturation for the temperature and elevation. In many trout hatcheries, the water is reused, that is ittypically passes through a series of raceways (usually not more than 4), with reaeration (oxygenated)by atmospheric contact as the water passes from raceway-to-raceway, or, reaeration may be obtainedwith mechanically powered aerators or air diffusers supplied by air blowers. Supersaturated oxygenconcentrations can be achieved in raceways by addition of "pure" oxygen that is generated on site orpurchased as LOX (liquid oxygen) and stored in Dewars (double-walled vacuum storage vessels likethermos bottles). The choice oxygen supply depends on local availability and the amount of oxygenused. Dewars gradually warm and as they warm gas pressure builds up, which must be vented (fizzedoff) or the bottle would explode. If consumption rate of a culture facility is rapid, then the Dewarmay be the system of choice, it can be a dependable supply of oxygen in an power outage, withnormally closed valves that open when the power goes off, oxygen can be supplied automatically.
A common generalization about oxygen requirements for aquaculture is that the minimum DOshould be greater than 5 mg/L for growth of warmwater fish and 6 mg/L coldwater fishes at theiroptimum temperature. Thus, for a raceway or circular tank, oxygen of the effluent water should be atleast 5 mg/L. The oxygen available for fish (AO) is the difference between the inflow (O2) and
summerft.doc
outflow (O2) oxygen concentration. If the outflow must be no less than 5 mg/L, then the inflow mustbe higher than that for fish to have any oxygen for respiration. At a temperature of 60°F (15.5°C),oxygen saturation would be about 9.6 mg/L at 1000 feet, which would provide about 4.6 mg/L of AOfor fish respiration (9.6-5.0 = 4.6 mg/L). The oxygen requirement for 100 kg (220 lb.) of fish thatconsume 300 mg O2/kg/h would be 30,000 mg O2/h (100 kg fish x 300 mg/kg/h). Assuming AO of4.5 mg/L, an inflow of 6,522 L of water (108.7 Lpm, or 28.6 gpm) to supply 100 kg (220 pounds) offish 30,000 mg/h of oxygen would be needed (30,000 _ 4.6 mg/L) to supply the oxygen consumed.This calculation is not a guide for water flow needed for trout production, Scheffer and Marriage(1969) stated that 450 gpm of high-quality water was needed per 10,000 pounds of annual production(22.2 gpm per pound of production).
At temperatures optimum for growth, fish are stressed at oxygen concentrations less than 5mg/L. If the condition is chronic, fish stop feeding, growth slows down, stress-related disease begins.For rainbow trout, mortality may begin at 3 mg/L, but channel catfish tolerate less than 2 mg/L beforemortality commences. However, if the gills of fish are damaged by parasites (hamburger gill diseaseis a good example of a severe protozoan disease of the gills of channel catfish), the fish may die whenoxygen concentrations drop only slightly below 5 mg/L.
pH, Carbon Dioxide (CO2) and Alkalinity
The pH of water is an index of hydrogen ion (H+) activity of water. The pH scale(range from 0 to 14) is logarithmic (base 10), an important fact to remember because a dropof 1 pH unit indicates a 10 fold increase in hydrogen ions (H+) present in water. A pH valuemay fall anywhere on a scale from 0 (strongly acidic) to 14 (strongly basic or alkaline), with a
value of 7 representing neutrality (= 10-7 moles/liter of H+ ions).The pH of most productive natural waters that are unaffected by pollution is normally in the
range of 6.5 to 8.5 at sunrise, typically closer to 7 than 8. Diurnal variation is related tophotosynthesis:
Chlorophyll
(1) CO2 + H2O ⇔ C6H12O6 + O2 Sunlight
The controlling factor for pH in most aquacultural facilities is the relationship between algal
photosynthesis, carbon dioxide (CO2), and the bicarbonate (HC03-) buffering system:
(2) CO2 + H2O ⇔ H2C03 ⇔ HC03- + H+
At night, respiration by bacteria, plants, and animals results in oxygen consumption and carbondioxide production, the reaction in formula (2) goes from left to right, first producing carbonic acid
(H2C03), then bicarbonate HC03- and H+ ions; the increase in H+ causes the pH to drop. Duringsunlight, respiration continues, but algae use CO2 for photosynthesis, formula (1); the reaction of
formula (1) goes from right to left, reducing the abundance of H+ ions, and pH goes up. Inproductive ponds, especially those with low alkalinity, the daytime pH may reach 10, which can belethal to young fish, especially hybrid striped bass.

summerft.doc
Fish can die also die from pH shock, a consequence of a sudden change in pH (³ 1.7 pH units)that may occur when moving fish from pond to tank, or tank to pond. Toxicity of other compoundsto fish, especially ammonia and chlorine, are affected by pH.
AmmoniaThe major source of ammonia in a water of a heavily stocked culture pond or in the effluent of
a raceway is from excretion of fish, mostly via their gills. Ammonia is produced by animals as abyproduct of protein metabolism. What is measured by chemical analysis (Nessler method) forammonia is called total ammonia nitrogen (TAN) because it includes two forms of ammonia:
ammonia (NH3), the unionized form, and the ammonium ion (NH4+). The unionized ammonia (UIA)is toxic to fish.
(3) NH3 + H2O ⇔ NH4+ + OH-
Low temperature ⇒ ⇐ High temperatureand low pH and high pH
The temperature and pH of water affects the ratio of (NH4+):(NH3) in water. At lower temperaturesand lower pH, the reaction (3) shifts from left to right, decreasing the percent of unionized (toxic)form (NH3) of ammonia (Table 2).
Table 2. Percent unionized (NH3) ammonia as a function of pH andtemperature (from Thurston et al. 1979).
Temperature pH
°F (°C) 6.0 7.0 8.0 9.0 10.050 (10) 0.0186 0.186 1.83 15.7 65.159 (15) 0.0274 0.273 2.66 21.5 73.268 (20) 0.0397 0.396 3.82 28.4 79.977 (25) 0.0568 0.566 5.38 36.3 85.086 (30) 0.0805 0.799 7.45 44.6 89.0
Toxicity from high TAN is more likely at high pH and high temperatures, conditions thatoccur in mid-summer in ponds with high standing crop of fish, which are also likely to have a heavyalgal bloom, and mid-afternoon pH values close to 9. For example, if we assume a TAN value 4.0, atemperature of 86°F (30°C), and a pH of 9, the concentration of the toxic form of TAN would be 1.7mg/L, 4 x 0.446 (using the ratio not the percent). Would 1.7 mg/L UIA be a problem? For salmonidfishes, it is recommended that the concentration of UIA not exceed 0.0125 to 0.02 mg/L to maintainhealth of the fish, however, the toxic concentrations of UIA (NH3) for trout are about 0.32 mg/L forrainbow trout, but 1.50-3.10 for channel catfish (Ruffier et al. 1981, cited by Boyd 1990a). Thus, aUIA of 1.7 mg/L, would be a expected to cause mortality of most fish, and it would be stressful forchannel catfish.
Summary

summerft.doc
Water quality varies considerably between surface water and groundwater sources, andbetween sources at different geographical locations. Groundwater is consider the most desirablesource of supply, because it has more consistent diurnal and seasonally in qualities than surface water,and much less likely to be contaminated by pathogens or fish. Fish can use some water suppliesconsidered impaired for human use, even some saline waters have aquaculture potential. Waterquality affects affect growth and well-being of fish, therefore, water quality should be of greatimportance to the aquaculturist. A high quality oxygen meter, and a water chemistry kit are essentialequipment items for fish farmers who must become accustomed to measuring water quality on aregular basis. It is equally important to know how to interpret the water quality parameters that aremeasured to maintain the health and well-being of their fish stock.
References
Anonymous. 1990. Biggest trout farm factory processes products for wide quality market. FishFarming International 17(2):48-51.
Boyd, C. E. 1990a. Water quality in ponds for aquaculture. Alabama Agricultural ExperimentStation, Auburn University, Auburn, Alabama.
Boyd, C. E. 1990b. Water quality management for pond fish culture.
Boyd, C. E. 1995. Bottom soils, sediment, and pond aquaculture. Chapman and Hall, New York.
Forsberg, J. A., P. W. Dorsett, and W. H. Neill. 1996. Survival and growth of red drum Scianeopsocellatus in saline groundwaters of West Texas, USA. Journal of the World Aquaculture Society27:462-474.
Piper, R. G., I. B. McElwain, L. E. Orme, J. P. McCraren, L. G. Flower, and J. R. Leonard. 1982.Fish hatchery management. U. S. Fish and Wildlife Service, Washington, D. C.
Scheffer, P. M., and L. D. Marriage. 1969. Trout farming. U.S. Soil Conservation Service,Washington, D.C. Leaflet 552.
Thurston, R. V., R. C. Russo, and K. Emerson. 1979. Aqueous ammonia equilibrium - Tabulation ofpercent un-ionized ammonia. Environmental Research Laboratory-Duluth, U.S. EnvironmentalProtection Agency, Duluth, Minnesota. EPA-600/3-79-091.
USDA (U.S. Department of Agriculture). 1996. Aquaculture outlook. U.S. Department ofAgriculture, Economic Research Service, Washington, D.C. Report LDP-AQS-4, October 8,1996.
Yoo, K. H., and C. Boyd. 1993. Hydrology and water supply for pond aquaculture. Wiley & Sons,Inc., New York.

hochheim.doc
WATER CHEMISTRY IN RECYCLE SYSTEMSJohn N. HochheimerOhio State University
Piketon Research and Extension Center
Introduction
Management of water chemistry is one of the most important considerations inrecirculating aquacultural systems. Proper system management results in the minimization ofstress, which in turn leads to healthier fish and hopefully more profitability. The differentcomponents in a recirculating system are designed to control one or more water qualityfunctions, such as ammonia, temperature, dissolved oxygen, or solids. With some basicunderstanding of water chemistry and the ability to manipulate it, you should be able tomanage many of the water quality problems associated with recycle system aquaculture. Thisoverview of water chemistry will outline the basic requirements for recycle systems andreview some of the more important water chemistry considerations.
Temperature
What is it?Water temperature is a relative measure of hotness or coldness.
Why is it important?Fish are ectothermic or “cold-blooded” and must rely on the culture water temperature to
maintain their body heat and to govern metabolic rates. Different fish require differenttemperature regimes, for example trout prefer colder water and catfish prefer and grow betterin warmer water. Changing water temperature suddenly in a culture system can be lethal; tryto keep changes in temperature to less than a few degrees if possible.Temperature affects many processes related to fish culture, including fish activity, behavior,feeding, growth, and reproduction. Temperature also affects the activity of the biologicalfilter as the bacteria in the filter behave in a similar fashion as the fish with respect totemperature. Most chemical processes are affected by temperature, such as ammonia toxicityor dissolved oxygen levels.
How can we measure it?Temperature can be measured with an ordinary thermometer and a wide variety are
available ranging from simple glass thermometers to more elaborate (and expensive) electronicthermometers.
What is optimal?Temperatures should be matched to the particular species being raised. Warmwater
species such as catfish require temperatures in the range of 75-90°F, with about 85°Fconsidered optimal. Coolwater species such as hybrid striped bass, yellow perch, or walleyedesire temperatures in the range of 60-80°F. Trout are an example of a coldwater species andthey prefer temperatures in the range of 48-65°F for optimal growth. Properly designed

hochheim.doc
recirculating systems offer the advantage of allowing for temperature control andmaintenance.
Problem solvingWhen temperatures are outside of desired ranges in a recirculating system, check to make
sure that the heating/cooling components are functioning properly. The solution may be assimple as a tripped circuit breaker or as expensive as a component failure. Remember, do notheat or cool the water too rapidly, slow changes reduce stress and fish kills. Always tempernewly introduced fish in the quarantine area slowly.
Dissolved Oxygen
What is it?When oxygen from the atmosphere (or other sources) comes into contact with water, an
equilibrium is established and a small percentage dissolves in the water. When none of theoxygen is consumed in the water the equilibrium established is the saturation level of oxygen.This saturation level is a function of temperature and salinity. Cold water has a highersaturation level than warmer water and fresh water has higher saturation levels than salt water.
Why is it important?Dissolved oxygen is probably the most critical factor to manage in a recycle system. Low
dissolved oxygen levels can become deadly to your crop in a matter of minutes. Inrecirculating systems, there are many competitors for the available oxygen in the system.These include the fish, nitrifying bacteria (which break down ammonia and nitrite), and otherbacteria that consume organic carbon in the system (commonly referred to as biochemicaloxygen demand or BOD). Oxygen levels in a recirculating system will vary according to thedensity of fish in the system—the more fish, the greater the oxygen demand. Changes inmetabolic rates of the fish can also affect the dissolved oxygen levels in a recirculating system.These metabolic rate changes are a function of water temperatures and fish activities. Feedingis one management activity that affects the metabolic activity of fish and can dramaticallychange the oxygen demand in a recycle system.
How can we measure it?Dissolved oxygen can be measured with wet chemistry test kits or with electronic
instruments. For small-scale systems, test kits could be used, but the chemical tests requireabout 10-15 minutes per test to complete. For most applications, electronic meters arerecommended for monitoring dissolved oxygen. A good meter and probe will probably costabout $500, but the cost is well worth the convenience and durability of the equipment.Dissolved oxygen should be measured routinely in recirculating systems. Measure dissolvedoxygen at least once daily at the same time of day and at the same time in relation to feedingactivity. For example, measure dissolved oxygen each day at 8 AM, just prior to feeding.This will provide a good basis for comparison. Measure more frequently for changingconditions in your system, when the fish appear to be stressed, or during the initial start-up ofa system. Periodically measure dissolved oxygen about 10-15 minutes after feeding todetermine peak demand periods.

hochheim.doc
What is optimal?Dissolved oxygen levels should be kept as close to saturation as possible. Tables are
readily available that show saturation levels of oxygen as a function of temperature andsalinity. In all cases, dissolved oxygen should be maintained at 5 mg/L or more for most fishspecies. Levels lower than 5 mg/L are tolerable for many species, but are also stressful to theanimals.
Problem solvingA properly designed oxygenation system will have sufficient capacity to meet the demands
of the fish and other consumers in a recycle system. Make sure that tanks are well mixed sothat oxygen levels are close to uniform throughout the system. In the event of low oxygenevents, back-up oxygenation supplies are required and should be a part of every recyclesystem. Do not feed fish during an oxygen crisis and keep them off feed for about 12-24hours after the crisis. Bring them back up to optimal feeding rates over a few days to allowthe system to respond. Treat the fish for stress as required in your operating plan.
Ammonia
What is it?Ammonia is a metabolic by-product of the fish in your system. The fish consume food and
excrete ammonia directly form their gills and in their feces. As fecal matter breaks down inthe system, more ammonia is released. Ammonia is present in water in two forms. Ionizedammonia (NH4) is one of the forms and it is relatively nontoxic to fish. Un-ionized ammonia(NH3) is the other form and it is highly toxic or at least stressful to fish at relatively low levels.
The relative proportions of NH4 to NH3 are governed by other chemical factors in thewater. Temperature, pH, and salinity all affect the relative proportion of NH4 to NH3. Theproportion of NH4 to NH3 shifts towards NH3 with higher salinity, pH and temperatures.
Why is it important?Ammonia is highly toxic to fish. A properly designed system will have sufficient biological
filtration capacity to maintain ammonia at levels that are minimally stressful to the fish.Elevated ammonia levels will normally be present in a system during the acclimation and start-up of a biological filter and when feeding levels are suddenly increased. Remember, thebiological filter is a living system and it needs time to adapt to changes.
How can we measure it?Ammonia can be easily measured with water test kits. These kits are available from
several manufacturers and provide sufficient accuracy for management of recirculatingsystems. There are probes available for measuring ammonia, but they are expensive andrequire constant calibration.
What is optimal?Ideally, ammonia in the form of NH3 should be kept below 0.02 mg/L, but levels below
0.1 mg/L should be adequate for short-term exposures. Remember that ammonia is in twoforms. Convert your ammonia measurement (usually either total ammonia or NH4) to NH3 byreferring to the directions with the test kit. Tables are available for converting total ammonia

hochheim.doc
readings to NH3 based on temperature and pH.
Problem solvingElevated ammonia levels can be problematic to manage, but must be decreased as quickly
as possible. Stop feeding the fish. Check for proper flows of water to and through thebiofilter. Flush the system with new water if possible, but remember, that the new water mustbe at the proper temperature or the fish will be additionally stressed.In general, the biological filter should be quite hardy and adaptable to slow changes in feedinglevels. Increase feeding levels slowly over time, especially when the fish are larger andadjustments will result in relatively larger amounts of feed. Check the system pH and makesure that the pH is above 6.5. If not, add alkalinity to the system (see section below onalkalinity). Finally, make sure that there is sufficient oxygen in the filter by checking theeffluent from the filter for oxygen. The effluent should have dissolved oxygen levels of atleast 2 mg/L.
Nitrite
What is it?Nitrite (NO2) is an oxidized form of nitrogen that is a byproduct of the nitrification
process in the biological filter. Nitrite is further oxidized in the biological filter to form nitrate(NO3), which is relatively nontoxic to the fish.
Why is it important?Nitrite is highly toxic to fish. Elevated nitrite levels will interfere with the fish blood’s abilityto transport oxygen. During the start-up of a biological filter nitrite levels will be sufficientlyhigh to be toxic to the fish in a system. Nitrite levels can also be elevated when the biologicalfilter is not operating properly or when feeding levels are increased dramatically.
How can we measure it?Nitrite can be easily measured with water testing kits. These kits are available from a
variety of manufacturers and provide reliable measurements for managing a recirculatingsystem.
What is optimal?Try to maintain nitrite levels below 0.1 mg/L.
Problem solvingEnsure that the biological filter is working properly. Check for oxygen levels in the
biological filter effluent and make sure that there is at least 2 mg/L of dissolved oxygen. Theaddition of salt is not recommended for freshwater recirculating systems as a treatment forhigh nitrite levels because the salt will adversely affect the biological filter. Stop feeding thefish and determine the reason for the problem. Dilute the system water with new water ifsufficient volumes are available at the proper temperature.

hochheim.doc
pH
What is it?By definition, pH is a relative measure of the concentration of hydrogen ions in solution—
pH is the negative logarithm of the concentration of hydrogen ions. From a practicalconsideration, pH gives us a relative comparison of the degree of acidity that a solution is. Aneutral solution has a pH of 7.0, an acidic solution has a pH of less than 7.0, and a basicsolution has a pH greater than 7.0.
Why is it important?The pH of a water can directly affect the fish and other organisms living in that water and
also has many indirect effects. Most aquatic species prefer a pH of about neutral to slightlybasic. The pH also affects the toxicity of many other chemicals, including ammonia andnitrite. Ammonia is more toxic (i.e., in the form of NH3) at higher pH levels and less toxic atlower pH levels. The toxicity of ammonia increases ten fold for every 1.0 increase in pHabove 7.0. The biological filter in a recirculating system produces acid when it is workingproperly, so pH needs to be continually assessed and adjusted to ensure good water quality.
How can we measure it?There are a variety of methods that can be used to measure pH, including simple test
strips, wet chemistry test kits, and electronic probes. For most applications a wide-range testkit should provide adequate pH measuring capabilities.
What is optimal?Optimal pH levels for most fish and the nitrifying bacteria are in the range of about 7.0
9.0. The pH in a recirculating system should, however, be kept in the range of about 6.8 to7.2. Since ammonia is much more toxic at higher pH levels and the biological filter willoperate satisfactorily at in this range, the margin of safety afforded the lower pH levels is thebetter management strategy for maintaining pH. Care must be taken to keep the pH fromfalling below 6.5, as the biological filter will not operate properly.
Problem solvingThe most effective and safest way to maintain pH in a recirculating system is to use
sodium bicarbonate (baking soda). There are many other compounds that can be used, butmost contain undesirable chemicals that will lead to problems in recirculating systems. Forexample, limestone(calcium carbonate) is very similar to sodium bicarbonate, but the build-upof calcium in the system can lead to the precipitation of calcium throughout the system.Sodium bicarbonate also does not cause excessively high pH levels, as the maximum pH thatcan be achieved with sodium bicarbonate is about 8.2. It is not recommended that acids areadded to a system in an attempt to lower pH, let the acid production of the biofilter graduallyreduce the pH and then use sodium bicarbonate to maintain the desired levels.
Alkalinity
What is it?Alkalinity is defined as the total of all of the bases (bicarbonate and carbonate are the
predominate ones) in water. It is important to distinguish alkalinity from hardness, both of

hochheim.doc
which are usually expressed as mg/L of CaCO3. Hardness is the concentration of calcium andmagnesium in water. In many waters, the hardness and alkalinity are approximately equal.Both are important in fish culture, but in recirculating systems, the hardness can be muchhigher than alkalinity as the alkalinity is used up by the biofilter.
Why is it important?Alkalinity serves two very important functions in a recirculating system. The equilibrium
of carbon dioxide, bicarbonate, and carbonate in water serves as an effective means to keepthe pH close to neutral. As acid is added to the system from the biological filter, the acid isneutralized by the bicarbonate in the water. This neutralization property is called bufferingand it prevents large shifts in system pH. The bacteria in the biological filter also requirebicarbonate to build cells as they consume ammonia.
How can we measure it?Alkalinity can be easily measured with wet chemistry test kits.
What is optimal?The alkalinity in a recirculating system should be maintained between 150 to 200 mg/L as
CaCO3.
Problem solvingThe most effective and safest way to maintain adequate alkalinity in a recirculating system
is to constantly add sodium bicarbonate. Once per day additions or as needed additions aresatisfactory, but will produce minor fluctuations in pH. A concentrated solution can be mixedin water and constantly metered into a recirculating system with a peristaltic pump. The dosewill depend on the feeding rate and can be easily calculated. Remember, pH levels below 6.5will adversely affect the performance of the biological filter, but the performance can bequickly improved with the addition of alkalinity and increase in pH.
Suspended Solids
What is it?Suspended solids are small solid particles that remain in the water column, even under
quiescent conditions. Water with excessive suspended solids is termed turbid and should bedistinguished from water that is transparent, but dark in color.
Why is it important?Excessive suspended solids clog the gills of fish and make it difficult for them to breathe.
Additionally, excessive solids in the water add to the oxygen demand in the system andprovide surfaces for many bacteria to grow. Larger particles will settle relatively fast and areeasily removed with properly designed solids removal components. Smaller particles tend tostay in the water column and are much more difficult to remove than larger particles.
How can we measure it?Suspended solids are easily measured with a glass jar. Take a water sample from the
culture tank, place it in the jar and let the jar sit still for about 3-5 minutes. If the majority ofthe solids in the sample are still in the water column and did not settle to the bottom, then

hochheim.doc
there probably high levels of suspended solids in the system. There are a variety of tests formeasuring suspended solids and turbidity, ranging from simple test kits to electronic meters.
What is optimal?When using a jar to determine the suspended solids in water, the water should be relatively
clear after 3 minutes, with the majority of solids settled to the bottom of the jar.
Problem solvingCheck the operation and maintenance of the solids filter if excessive suspended solids are
present in a recirculating system. Add more filtration capacity if necessary.
POND AERATION
Terry KayesDepartment of Forestry, Fisheries and Wildlife
University of Nebraska-LincolnLincoln, Nebraska 68583-0814
Aeration, like feeds and feeding, is one of the most frequently discussed topics inaquaculture. This is true because, at any given temperature, the availability of oxygen plusnutritionally adequate food are defining factors in determining the extent to which oxygen-consuming organisms such as finfish and shellfish thrive and grow, both in nature and inaquaculture systems. Without sufficient oxygen, such organisms will not grow, regardless ofgood nutrition and otherwise near-optimum environmental conditions. Thus, dissolved oxygenabove certain levels is essential not only for the maintenance of life, but also for good healthand growth. The levels required to support life, good health and growth vary, depending onspecies, body size, water temperature and other factors. Under any given set of conditions,more oxygen is required to promote growth in a particular species than the minimum amountsneeded to maintain health and, in turn, provide basic life support.
Aeration is also a topic of frequent discussion among aquaculturists and industrysuppliers because it typically involves the use of equipment that must either be built orpurchased, often at considerable cost. Both the trade and scientific literature on aeration arelarge, often contradictory, and quite confusing to read even for trained aquacultureprofessionals. For the beginner, knowing that such confusion exists (and why) is key to thedevelopment of a sound understanding of aeration practices under practical culture conditions.One basic principle of pond aquaculture is that natural aeration and biological and chemicalprocesses affecting the concentration of dissolved oxygen and other gases normally far exceedanything that can be achieved by mechanical aeration. The latter can be used to good effect toprovide emergency or supplemental oxygen, but such beneficial uses can be readilyoverwhelmed by poor pond design or management practices.
Natural Dissolved Oxygen Dynamics in Aquaculture Ponds
Dissolved Gases in Ponds
Native oxygen (O2) under normal atmospheric temperature and pressure conditions isa colorless chemically-reactive gas that is essential for (aerobic) respiratory processes inbacteria, plants and animals. Only certain bacteria and other primitive organisms can live andgrow (anaerobically) in the absence of oxygen. Nitrogen gas (N2) and oxygen make up about78% and 21% of dry air, respectively. The remaining 1% consists chiefly of argon, along withsmall amounts of carbon dioxide (CO2) and other gases. All of these gases are soluble in waterto varying degrees, depending primarily on temperature and pressure. Water is considered tobe saturated with a gas when the dissolved pressure of the latter in solution is in equilibriumwith its pressure in the atmosphere immediately above the water surface. Supersaturationoccurs when the dissolved pressure of a gas in solution exceeds its atmospheric pressure, orthe pressure of the overlying water column.
The concentration of dissolved gases in water are normally measured in milligrams per

liter (mg/L) or parts per million (ppm), which in most situations is essentially equal (e.g., 5 mgO2/L = 5 ppm O2). Both oxygen and carbon dioxide are biologically important gases. Aerobicrespiration by bacteria, plants and animals consumes oxygen and generates carbon dioxide as awaste product. In turn, photosynthesis in plants utilizes carbon dioxide and generates oxygen.These life-supporting processes are operative in both terrestrial and aquatic systems, includingaquaculture ponds. Dissolved gases in water diffuse far more slowly than gases in air.Likewise, water is much denser than air, and oxygen is invariably present at far lowerconcentrations in the former than the latter. Because of these physical realities, dissolved gasconcentrations fluctuate far more widely, and the relative amount of energy committed torespiration is greater, in aquatic systems then in terrestrial ones.
Oxygen Dynamics in Ponds
An extensive literature exists on dissolved-oxygen dynamics in shallow warmwateraquaculture ponds, though certain important aspects of the information contained appear to beincomplete or contradictory, and in many instances founded more on extrapolations of basiclimnological principles than on systematic investigations as to cause and effect. The mainpoints of this literature, developed largely from data on ponds in southern or tropical climates,has been reviewed by Boyd (1990). To what extent the information outlined in this literatureapplies directly to the understanding of dissolved-oxygen dynamics in the USDA NorthCentral Region (NCR), where climatic extremes are greater and aquaculture pond design andmanagement practices differ, is unclear. For shallow warmwater ponds near the southernmargin of the NCR, the same basic principles probably apply. However, significant differencesshould be expected with increasing latitude or elevation.
Major principles of dissolved-oxygen dynamics that in most cases probably apply toaquaculture ponds in both the NCR and the South are as follows: (1) Photosynthesis byaquatic plants during daylight hours is the main source of dissolved oxygen, particularly inwarmwater ponds. (2) The degree to which oxygen is consumed in a pond is largelydetermined by the total biomass and respiration rates of aquatic plants and bacteria in thewater column and bottom sediments. (3) The potential for oxygen depletion in a pond isgreatly exacerbated by the build up or presence of excessive organic matter, which may comewith runoff from surrounding lands, will normally accompany the accumulation of wasteproducts and uneaten feed or fertilizer addition to intensively managed ponds, or may occurnaturally in the bottom sediments of poorly sited or improperly constructed ponds. (4) Theamount of oxygen required for the aquaculture species being produced constitutes only asmall percentage of the total amount needed to support a healthy pond.
Most ponds during the growing season, both in the South and in the NCR, exhibitdaily cycles of oxygen depletion at night due to respiration, and replenishment during the daydue to photosynthesis. The extent to which these cycles exist, and dissolved oxygen levelsfluctuate in ponds, is geared largely to the abundance, type and health of aquatic plantspresent that can release photosynthetically generated oxygen into the water. Another criticalfactor is light intensity, which affects the rate of photosynthesis. On bright sunny days, aquaticplants in ponds can produce high (supersaturated) levels of dissolved oxygen (e.g., over 20ppm), which are more than adequate to offset oxygen consumption at night due to respiration.Several critical factors can alter or interrupt this cycle. Among them are: a reduction inphotosynthetic activity caused by a succession of cloudy days; and the death of aquatic plantlife due to natural senescence, excessive use of herbicides, oxygen depletion, or the exhaustion

of an essential plant nutrient.Dissolved Oxygen in Northern Ponds
Common differences between aquaculture ponds in the NCR and those in southernclimates, and the potential impacts of these differences on dissolved-oxygen dynamics, are asfollows: (1) Aquaculture ponds in the NCR typically have a smaller surface area (i.e., 1/4-10acres) and greater maximum depth (6-12 feet) than those in the South (1/4-50 acres and 3-8feet, respectively). Because of this, ponds in the NCR are more likely to stratify during thesummer, resulting in potentially dangerous oxygen depletion in deeper waters. (2) Icemovement during winter and spring can cause major damage to pond banks and water inletand outlet systems in the NCR (which is why pond surface areas are typically smaller), andheavy ice and snow cover on ponds can block photosynthesis and result in oxygen depletion(which is one reason why pond depths are traditionally deeper). (3) The average annual andaverage mid-summer water temperatures in ponds in the NCR are generally lower than in theSouth, and the growing season is shorter.
Collectively, these differences greatly influence such factors as the solubility anddistribution of oxygen and other gases in pond water; the extent to which wind can play asignificant role in aerating pond water, especially at cool temperatures (i.e., 40-70°F); thespecies composition of all the organisms in a pond; and the selection of an appropriateaquaculture species for production. Two coolwater fish species of interest to aquaculturists inthe NCR are the yellow perch and the walleye, both of which spawn in the spring. Thefingerlings of both species are usually reared from small larvae in fertilized ponds, starting inlate April or early May when pond water temperatures may fluctuate from 40 to 70°F. Undersuch conditions, maintaining dissolved oxygen levels in ponds can be difficult or easy,depending on the weather, organic load in the ponds, etc. The solubility of oxygen and othergases in water is inversely related to temperature. However, this is no guarantee that dissolvedoxygen levels will be high in ponds when water temperatures are low.
Managing Dissolved Oxygen in Ponds in the North Central Region
Best Management Practices
As a business, the main goal of a commercial aquaculture operation is to generateprofits. For the serious aquaculture entrepreneur, this goal should guide business planning,and supersede all pet theories and desires to substitute trendy equipment or hardware forsound planning. Simply stated, "Income minus costs equals profits." Mechanical aerationconstitutes a cost. Therefore, its use should be evaluated carefully as it affects profits, as partof an overall management plan. Effective long-term planning in pond aquaculture starts withsite selection and facility design, both of which can greatly influence natural aeration processesand the extent to which mechanical aeration ultimately proves to be necessary (orunnecessary). Ideally, good siting, pond design, and management practices should develop astrategy that produce the maximum amount of marketable product with the minimum amountof mechanical aeration.
Some practical considerations in aquaculture pond site selection and facility design, tominimize the need for mechanical aeration, are as follows: (1) The best pond sites are locatedin areas where water (preferably groundwater) is abundant and available at a low cost, to

allow for rapid pond filling and flushing when water quality deteriorates. (2) Pond aquaculturefacilities should not be sited in areas where the organic content of the soil is inordinately high(e.g., filled wetlands) and such soils cannot be readily removed for pond construction, orwhere surface runoff containing high levels of organic matter cannot be readily controlled. (3)Ponds should be designed to minimize surface runoff; constructed whenever possible (if theirsurface area is five acres or less) with their long axis oriented in the direction of prevailingwinds; and built to allow for complete drainage and bottom drying (for the compaction,aeration, and when necessary, removal of accumulated organic matter and wastes). (4) Treesthat are likely to drop leaves or other organic matter into ponds, or shade large areas of waterfrom sunlight should be removed.
Some practical management strategies to help maintain dissolved oxygen levels inaquaculture ponds in the NCR include the following: (1) Maintain deep-rooted grass andclover filter strips around ponds to stabilize their banks and minimize the surface inflow ofwater containing particulate matter and nutrients. (2) With the possible exception of pondsmanaged extensively for fingerling production, do not add fertilizers to ponds in the NCR tomaintain unicellular algae blooms. The likely consequence of this would be to stimulateexcessive growth of rooted or floating aquatic plants or filamentous algae. (3) If ponds arebeing used for intensive aquaculture, feeding practices should be implemented to ensureminimum feed wastage i.e., be sure the feed is being eaten. (4) To take the guesswork out ofaquaculture pond management, procure the necessary water chemistry testing equipment orkits, develop an effective water chemistry monitoring program, and adhere to it. An effectivemonitoring program is essential for informed decision making, particularly with respect todetermining whether and when mechanical aeration is needed.
Mechanical Aeration of Ponds
Claims made about different types of mechanical aeration equipment and systems, andthe trade and scientific literature available on this subject, appear to be contradictory andconfusing, because the people involved (e.g., industry suppliers, engineers, productioneconomists, practicing aquaculturists) all have different interests and agendas. For example,suppliers of aeration equipment are interested in making sales, and quite understandably havetechnical data that present their product in the best possible light. Engineers, in turn, areprimarily interested in the physical or mechanical efficiency of aeration equipment andsystems, as well as capital, power, and other direct operating costs often with relatively littleattention given to potential maintenance costs or operational flexibility. Economists often startwith engineering efficiency and direct cost assessments, adding estimates of interest,depreciation, inventory or property tax costs, etc. Practicing aquaculturists want costeffectiveness, durability and minimum maintenance, and operational flexibility.
Misunderstandings and conflicting ideas about operational flexibility and the exactpurpose for which a particular type of equipment was initially designed are major sources ofconfusion when considering mechanical aeration in ponds. To clarify matters, it should beunderstood that there is no single "best" method of mechanical aeration for all ponds under allsituations. Some types of equipment are best for emergency aeration, while others are betterfor intermittent or sustained supplemental aeration. Pond area and depth, oxygen demand,cultured species, and life history stage are all factors that should be considered when makingdecisions about buying, and how best to employ various types of aeration equipment. Formore detailed information on the different types of aeration equipment and technologies

available, and their uses and comparative merits, see the publications listed below, or contactyour nearest aquaculture extension or outreach professional.
References
Boyd, C.E. 1990. Water quality in ponds for aquaculture. Alabama Agricultural ExperimentStation, Auburn University, Alabama. 482p.
Engle, C.R. 1991. Economics of aeration. Cooperative Extension Service, University ofArkansas at Pine Bluff, Arkansas. 3p.
Jensen, G.L., and J.D. Bankstone. 1989. Guide to oxygen management and aeration incommercial fish ponds. Louisiana State University Agricultural Center, Louisiana. 26p.
Jensen, G.L., J.D. Bankston, and J.W. Jensen. 1989. Pond aeration. Southern RegionalAquaculture Center Publication Number 370. 3p.
Jensen, G.L., J.D. Bankston, and J.W. Jensen. 1989. Pond aeration: types and uses of aerationequipment. Southern Regional Aquaculture Center Publication Number 371. 4p.

morris.doc
PLANKTON MANAGEMENT FOR FISH CULTURE PONDS
J. E. MorrisDepartment of Animal Ecology
Iowa State University
Introduction
In the culture of larval fish of various species, e.g., walleye (Stizostedion vitreum),hybrid striped bass (Morone saxatilis X M. chrysops) and sunfish (Lepomis sp.), managementof the zooplankton forage base is critical to successful transition of larvae to the fingerlingstage. In addition, information regarding the relative status of plankton (zooplankton andphytoplankton) communities gives insight into water quality parameters and the possiblesuccess or failure of the culture season.
The dynamic characteristics of zooplankton populations have led researchers to useparticular fertilization techniques and species-specific zooplankton inoculations in cultureponds (Colura and Matlock; Geiger 1983a; Farquhar 1984; Turner 1984; Geiger et al. 1985).The intent of these management techniques was to maintain high densities of desirablezooplankton species in culture ponds until fish were harvested or able to consume commercialfeeds.
Population Characteristics of Zooplankton Prey
Zooplankton are classified as either rotifers, cladocerans (water fleas) or copepods.The ability of rotifers and cladocerans to reproduce parthenogenetically (asexually) enablesthem to react quickly to unfavorable and favorable environmental conditions (Pennak 1978).
Rotifers have the shortest life span (12 days) and can reach their peakreproductive level in about 3.5 days (Allan 1976). At 20O C (68.0O F), the egg-to-egg span is 2-3 days with the total young per adult lifespan being 15-25 days.
Cladocerans and copepods have similar life spans of approximately50 days, but with different peak reproductiveperiods. To reach their peak reproductivecapacity, cladocerans require 14-15 days whilecopepods require 24 days, (Allan 1976). Copepods,
which have only sexual reproduction, require longer periods to increase their populationlevels.
Cladocerans are desirable fish prey since they have high energetic caloric value and arereadily consumed by most fry. However, cladoceran populations usually decline rapidly whensubjected to predation in culture ponds (Geiger 1983b; Geiger et al. 1985). On the other hand,copepods, because they are swift, powerful swimmers, are better able to maintain theirpopulations during the later stages of a culture season (Geiger and Turner 1990).

morris.doc
Egg-to-egg generation times are slower than for cladocerans (13-15 days for copepodscompared to 7-8 days for cladocerans at 20O C), but life spans are similar (approximately 50days at 20O C) (Allan 1976). The total young per adult lifespan is 400-600 for cladoceranscompared to 250-500 for copepods at this temperature.
Although rotifers are the first zooplankters to reach large numbers in newly filledculture ponds, they are soon out competed by both cladocerans and copepods for the availablefood resources. There is also a difference in filtering rates for these animals. Cladoceranshave the highest filtering rates, followed by copepods and then by rotifers (Allan 1976). Thehigh filtering rates and total young per adult lifespan give cladocerans a definite ecologicaladvantage over rotifers and copepods. However, increased predation by fish uponcladocerans does decrease these ecological advantages.
Models of zooplankton succession patterns and species composition in large reservoirsand lakes may not be applicable to intensively fertilized culture ponds (Parmley and Geiger1985). In a study of fertilized culture ponds without fish, Parmley and Geiger (1985) foundthat copepod adults and nauplii, and the Daphnia sp. populations reached maximum meandensities in an average of 23.5 days. Rapid population declines of copepod adults and naupliioccurred in 5.3 days, respectively, while Daphnia sp. and Bosmina sp. populations decreasedsignificantly within 7.3 days after reaching maximum densities.
Researchers have differed in their recommendations concerning the time betweenfilling the ponds and fry stocking. Geiger (1983b) recommended that culture ponds be filled2-3 weeks prior to hybrid striped bass (Morone saxatilis X M. chrysops) fry stocking to allowtime for maturation of zooplankton populations. However, Cross (1984) found that hybridstriped bass fry stocked into ponds filled the shortest time before stocking had the greatestsurvival rate. The discrepancy may relate to Geiger's ponds being filled with well water, whileCross's study ponds were filled with water from the Pearl River, Mississippi. Culver et al.(1992) also compared filling ponds seven days before fry stocking to ponds filled for 30 days.The ponds filled seven days before stocking had 64% survival while those filled 30 daysbefore stocking had 14.5% survival of walleye and saugeye (S. vitreum X S. canadense).
Not all fish species require the same size of prey at the onset of feeding. For instance,reciprocal cross hybrid striped bass (Morone chrysops X M. saxatilis) have very small mouthsthat require them to consume small prey, such as rotifers and early instars of cladocerans.Improved production may be achieved by stocking these fry into culture ponds filled only 2-3days before stocking.
Predator and Prey InteractionsDirect relationships between ingestion rates, fish larval size, or fish larval density to
prey density appear to exist (Eldridge et al. 1981). Also, several studies have documented thesize-selectivity of fish for their invertebrate prey (Brooks and Dodson 1965; Dodson 1974;Zaret 1980; O'Brien 1987). Fish have been observed to consume increasingly larger prey asfish length increases. Size selectivity of prey was demonstrated for small bluegills (L.macrochirus), 70-80 mm (2.8-3.2 in) TL, presented with four size classes of Daphnia sp.(Werner and Hall 1974).
Zaret (1980) noted that prey size selectivity generally was not displayed by most fish,except during the youngest stages. In these fish, their mouth gape restricts them toconsuming appropriately size prey. Miller et al. (1988) noted the similarities among differentfish concerning the importance of fry size upon feeding, starvation, activity and searchingability, and risk of predation.
morris.doc
Zaret (1980) showed that planktivorous fish were highly discriminate feeders ofparticulate matter, and that filter feeding was rare. Drenner and McComas (1980) noted thecorrelation between gill raker spacing and size of prey consumed. In addition to size of prey,predators also key in on different visual cues such as eyespots and pigmentation patterns(Zaret 1980; O'Brien 1987).
Zooplankton have a multitude of different ways by which they attempt to escapecapture. Zaret (1980) noted the effectiveness of vertical migration as one type of escapebehavior. Additionally, different levels of ornamentation have evidently evolved asanti-predator mechanisms. Brachionus calyciflorus populations may develop various levels ofposterolateral spines that decrease predation by Asplancha sp. (Gilbert 1967). Drenner andMcComas (1980) concluded that the impact of predators upon zooplankton stocks varies withthe zooplankter's ability to escape predation, as well as the degree of size selection of prey.
Zooplankton Characteristics as Environmental IndicatorsZooplankton, namely cladocerans, which are colored a deep red are often indicators of
low dissolved oxygen conditions (Pennak 1978). This coloration is based on the increasedamount of hemoglobin that these animals have to compensate for low oxygen levels in theenvironment; however, this increased amount of hemoglobin comes at an energetic cost.Landon and Stasiak (1983) found that D. pulex quickly become clear when placed into well-oxygenated waters.
Another indication of poor environmental conditions is also indicated by the increasednumber of diapause eggs in cladocerans. These diapause eggs are often quite large and darkand are produced when these animals are forced to undergo sexual reproduction inpreparation of unfavorable environmental conditions (Pennak 1978).
When a cladoceran is food-limited, it matures at a smaller size and produces smalleroffspring (total number being similar). The main response of D. pulex to low food levels wasa reduction in size specific food intake and egg size (Lynch 1989). However, foodconcentration did not affect length/weight relationships, instar duration and weight-specificinvestment of energy in reproduction.
Cladoceran populations also consist of smaller individuals in water bodies with largepopulations of vertebrate predators. Large-bodied species, e.g., D. pulex, tend to be fewer inponds with large predator bases (Zaret 1980). In these situations, smaller species or smallerindividuals within a given species have improved chances of escaping predation than largerindividuals (based on prey visibility). However, smaller animals can also be selected whenpredators are other invertebrates, such as midge larvae, Chaoborus sp., or backswimmers,Notonecta sp.
Fertilization
Concerning the food resources available to zooplankters, culturists often usefertilization to improve their food base. Fertilizers may be either inorganic or organic based.Inorganic fertilizers are those that take the form of granular or liquid fertilizers having a highphosphorus content and, to a smaller degree, nitrogen (phosphorus is often the limitingnutrient in freshwater). The premise behind using inorganic fertilizers is that by applyingneeded nutrients, phytoplankton populations increase. These increased populations ofphytoplankton, often called a 'bloom', will then increase the number of zooplankton in thepond, which then eat the phytoplankton. However, it has been shown that large

morris.doc
phytoplankton populations alone do notnecessarily increase zooplanktonpopulations; zooplankters will eatmore fungi and bacteria associated withdecaying organic substances thanphytoplankton directly. In fact, these large populations of phytoplankton often lead to lowerwater quality through increased pH and low morning dissolved oxygen levels.
Some researchers have had considerable success in managing zooplankton populationsthrough phytoplankton management. Culver et al. (1992) were able to successfully increasewalleye and saugeye production by maintaining the nitrogen:phosphorus ratio (N:P) to 20:1.Improvements in both production and fish survival were obtained by weekly restoration of theculture ponds to 600 ug N/l (NH4
+ + NO3-) and 30 ug P/l (PO4
-3) levels. This combination offertilizers allowed for improved species composition of phytoplankton that, in turn, improvedthe zooplankton forage base. The most important diet component of these animals have beenshown to be small algae (1-25 um)(Lampert 1987). Algae larger than 50 um or algae withspines or in colonies were usually rejected. Bluegill algae in the preferred size range are oftentoxic and not eaten (Porter and Orcutt 1980). Blue-green algae are often favored inenvironments where nitrogen becomes a limiting nutrient (low N:P ratios); blue-green algaecan 'fix' atmospheric nitrogen.
Organic fertilizers are often used to promote desirable zooplankton species. Organicfertilizers may be animal manures, alfalfa hay (ground or meal), or soybean meal. Organicfertilizers should have low carbon:nitrogen ratios and have fine particle sizes to allow rapiddecomposition (Geiger and Turner 1990). As previously indicated, zooplankters will consumefungi and bacteria associated with decaying organic material. However, the use of organicfertilizers may cause dissolved oxygen and ammonia problems during the initialdecomposition. Clouse (1991) found that organic fertilizers based on biomass were moreeffective in producing walleye fingerlings than applications based solely on nitrogen content.
Sampling
While culturing larval fish, the culturist needs to periodically check zooplanktonpopulations in culture ponds. Sampling equipment ranges from the use of plankton nets beingtowed at oblique angles to pumps.Sampling tows are often easy to do;however, the main disadvantage is theproblem of obtaining goodrepresentative samples when the pondsare heavily infested with filamentous algaeor vascular plants. Techniques that haveshown promise has been the use of pumpsand tube samplers. Pumps, such as the onedescribed by Farquhar and Geiger (1984), are often cumbersome and expensive but do givegood quantitative samples. Tube samplers may be made of 2.5-cm (1-in) PVC pipe fittedwith a 2.5-cm check valve. This tube is then lowered into the water column and the water isremoved and filtered through the plankton net. Graves and Morrow (1988) showed that thistechnique yielded similar results as those used in the more traditional techniques.
morris.doc
Irrespective to sampling technique, zooplankton samples should be obtained in avariety of locations in the pond and at the same time of the day. The reasons for this are thatzooplankters are often in clumped numbers throughout the pond and do migrate verticallyduring the day. Consistency in sampling is paramount to obtaining good quantitative samples.
The number of zooplankton needed for successful culturing of larval fish is affected bythe number, age and species of larvae stocked. In general terms, zooplankton populationsshould be approximately 100 to 500 animals per liter (500-2000/gal). Specific constituents ofthe zooplankton samples, e.g., size and species, are best determined by the species and the lifestage of fish being cultured.
Literature Review
Allan, J. D. 1976. Life History patterns in zooplankton. American Naturalist 110:165-180.
APHA (American Public Health Association), American Water Works Association, and WaterPollution Control Federation. 1989. Standard methods for the examination of water andwastewater, 17th edition. American Public Health Association, Washington, DC.
Brooks, J. L. and S. I. Dodson. 1965. Predation, body size, and composition of the plankton. Science150:28-35.
Buddington, R. K. and J. P. Christofferson. 1985. Digestive and feeding characteristics of thechonondrostreans. In North American Sturgeons: Biology and Aquaculture Potential. F. P.Binkowski and S. I. Doroshov (Editors). Dr. W. Junk Publishers, Dordrecht, Netherlands.
Clouse, C. P. 1991. Evaluation of zooplankton inoculation and organic fertilization for pond-rearingwalleye fry to fingerlings. M. S. Thesis, Iowa State University.
Colura, R. L. and G. C. Matlock. 1983. Comparison of zooplankton in brackish water fertilized withcotton seed meal or chicken manure. Annual Proceedings Texas Chapter American FisheriesSociety 6:68-83.
Conklin, D. E., K. Devers, and R. A. Shleser. 1975. Initial development of artificial diets for thelobster, Homarus americanus. World Aquaculture Society 6:237-248.
Cross, T. 1984. Turcotte Laboratory ponds fish production. Mississippi D-J project F-68 AnnualReport, Mississippi Department Wildlife Commission. 37 pp.
Culver, D. A., J. Qin, S. P. Madon, and H. A. Helal. 1992. Daphnia production techniques forrearing fingerling walleye and saugeye. Federal Aid in Fish Restoration Project F-57-R.
Dodson, S. I. 1974. Adaptive change in plankton morphology in response to size-selective predation:a new hypothesis of cyclomorphosis. Limnology and Oceanography 19:721-729.
Drenner, R. W. and S. R. McComas. 1980. The roles of zooplankter escape ability and fish sizeselectivity in the selective feeding and impact of planktivorous fish. Evolution and Ecology of

morris.doc
Zooplankton Communities. Special Symposium, American Society of Limnology andOceanography 3:587-593.
Eldridge, M.B., J. A. Whipple, D. Eng, M. J. Bowers, and B. M. Jarvis. 1981. Effects of food andfeeding factors on laboratory-reared striped bass larvae. Transactions of the American FisheriesSociety 110:11-120.
Farquhar, B. W. 1984. Evaluation of fertilization techniques used in striped bass, Florida largemouthbass, and smallmouth bass rearing ponds. Proceedings Annual Conference SoutheasternAssociation Game and Fish Commissioners 37:346-368.
Farquhar, B. W. and J. G. Geiger. 1984. Portable zooplankton sampling apparatus for hatcheryponds. Progressive Fish-Culturist 46:209-211.
Fitzmayer, K. M., J. I. Broach, and R. D. Estes. 1986. Effects of supplemental feeding on growth,production, and feeding habits of striped bass in ponds. Progressive Fish-Culturist 48:18-24.
Geiger, J. G. 1983a. A review of pond zooplankton production and fertilization for the culture oflarval and fingerling striped bass. Aquaculture 35:353-369.
Geiger, J. G. 1983b. Zooplankton production and manipulation in striped bass rearing ponds.Aquaculture 35:331-351.
Geiger, J. G., C.J. Turner, K. Fitzmayer, and W. C. Nichols. 1985. Feeding habits of larval andfingerling striped bass and zooplankton dynamics in fertilized rearing ponds. Progressive Fish-Culturist 47:213-223.
Geiger, J. G. and C. J. Turner. 1990. Pond fertilization and zooplankton management techniques forproduction of fingerling striped bass and hybrid striped bass. In Culture and Propagation ofStriped Bass and its Hybrids. R. M. Harrell, J. H. Kerby and R. V. Minton (Editors).Striped BassCommittee, Southern Division, American Fisheries Society, Bethesda, MD. 323 pp.
Gilbert, J. J. 1967. Asplancha and posterolateral spine production in Brachionus calyciflorus.Archives Hydrobiologia 64:1-62.
Graves, K. G. and J. C. Morrow. 1988. Tube sampler for zooplankton. Progressive Fish Culturist50:182-183.
Jennings, T., B. Adair, G. Ackerman, W. Jorgensen, D. Marolf, M. Mason, M. McGee, J. Spykermanand B. Strunk. 1992. 1992 Fish Culture Section Completion Report. Iowa Department of NaturalResources.
Lampert, W. 1987. Feeding and nutrition in Daphnia. In Predation: Direct and Indirect Impacts onAquatic Communities. W. C. Kerfoot and A. Sih (Editors). University Press of New England,Hanover, New Hampshire.

morris.doc
Landon, M. S. and R. H. Stasiak. 1983. Daphnia hemoglobin concentration as a function of depthand oxygen availability in Arco Lake, Minnesota. Limnology and Oceanography 28:731-737.
Lynch, M. 1989. The life history consequences of resource depression in Daphnia pulex. Ecology70:246-256.
Miller, T. J., L. B. Crowder, J. A. Rice. and E. A. Marschall. 1988. Larval size and recruitmentmechanisms in fishes: toward a conceptual model. Canadian Journal of Fisheries and AquaticSciences 45:1657-1670.
Morris, J. E. 1988. Role of artificial diets and feeding regimes on the culture of hybrid striped bassfry. Doctoral dissertation. Mississippi State University, Starkville, MS.
Morris, J. E., P. V. Zimba and R. J. Muncy. 1988. Chlorophyll a determination in aquaculture ponds.Mississippi Academy of Sciences. 52nd. Annual Meeting, Biloxi, MS.
O'Brien, W. J. 1987. Planktivory by freshwater fish: thrust and parry in the pelagic. In Predation:Direct and Indirect Impacts on Aquatic Communities. W. C. Kerfoot and A. Sih (Editors).University Press of New England, Hanover.
Parmley, D. C. and J. G. Geiger. 1985. Succession patterns of zooplankton in fertilized culture pondswithout fish. Progressive Fish-Culturist 47:183-186.
Pennak, R. W. 1978. Freshwater invertebrates of the United States. 2nd edition. John Wiley, NewYork. 803 pp.
Porter, K. G., and J. D. Orcutt. 1980. Nutritional adequacy, manageability, and toxicity as factors thatdetermine the food quality of green and blue-green algae for Daphnia. American Society ofLimnology and Oceanography Special Symposium 3:268-281.
Turner, C.J. 1984. Striped bass culture at Marion Hatchery. In The Aquaculture of Striped Bass. J. P.McCraren (Editor) Publication Um-Sg-Map-84-01. University of Maryland Extension Service.College Park, Maryland. 259 pp.
Werner, E. E. and D. J. Hall. 1974. Optimal foraging and the size selection of the bluegill sunfish(Lepomis macrochirus). Ecology 55:1042-1052.
Whitney, D. E. and W. M. Darley. 1979. A method of determination of chlorophyll a in samplescontaining degradation products. Limnology Oceanography 24:183-186.
Zaret, T. M. 1980. Predation and freshwater communities. Yale University Press. 187 pp.

appendix.doc
APPENDIX ACONFERENCE SPEAKER ADDRESSES
Jim BradleyAqua-MannaR. R. 2, Box 342Ladoga, IN 47954
Larry SharpRust Construction, Inc.PO Box 100Seymour, IN 47274
Carole LembiBotany and Plant PathologyPurdue UniversityWest Lafayette, IN 47907
LaDon SwannIllinois-Indiana Sea Grant ProgramPurdue University1026 Poultry Science BuildingWest Lafayette, IN [email protected]
Rich LintonDepartment of Food SciencesPurdue UniversityWest Lafayette, IN 47907
Christopher BidwellPurdue University1026 Poultry Science BuildingWest Lafayette, IN 47907-1026
Kerry W. TudorDepartment of AgricultureCampus Box 5020Illinois State UniversityNormal, IL 61790-5020
Christopher KohlerFisheries Research LaboratorySouthern Illinois University-CarbondaleCarbondale, IL 62901-6511
Jean R. RiepeDepartment of Agriculture EconomicsPurdue UniversityWest Lafayette, IN 47907
Jeffrey MalisonUniversity of Wisconsin-Madison103 Babcock Hall1605 Linden DriveMadison, WI 53706
Norma TurokSouthern Illinois Small Business Incubator150 E. Pleasant Hill RoadCarbondale, IL 62901
Mark Griffin6481 Jackson St.Indianapolis, IN 46241
Paul BrownForestry and Natural ResourcesPurdue UniversityWest Lafayette, IN 47907
David KellumIndiana Department of Natural Resources6013 Lakeside Blvd.Indianapolis, IN 46278

appendix.doc
APPENDIX ACONFERENCE SPEAKER ADDRESSES
(continued)
Don G. GarlingDept. of Fisheries & WildlifeMichigan State University9A Natural Resources BuildingEast Lansing, MI 48824-1222
Joe MorrisAquaculture SpecialistDept. of Animal EcologyIowa State University124 Science IIAmes, IA 50011-3221
Konrad DabrowskiSchool of Natural ResoursesOhio State University2021 Coffey RoadColumbus, OH 43210
Bob SummerfeltDept. of Animal EcologyIowa State University124 Science IIAmes, IA 50011-3221
Chad Nunley1795 West Shore Dr.Martinsville, IN 46151
John HochheimerPiketon Research & Extension Center1864 Shyville RoadPiketon, OH 45661-9749
Randy WhiteAnimal Disease Diagnostic LaboratoryPurdue UniversityWest Lafayette, IN 47907
Terry KayesDept. of Forestry, Fisheries & WildlifeUniversity of Nebraska-Lincoln12 Plant Industry BuildingEast Campus MallLincoln, NE 68583-0814

appendix.doc
APPENDIX BNCRAC AQUACULTURE EXTENSION CONTACTS BY STATE
WisconsinMr. Fred P. BinkowskiCenter for Great Lakes StudiesUniversity of Wisconsin-Milwaukee600 E. Greenfield AvenueMilwaukee, WI 53204(414) 382-1723(414) 382-1700FAX: (414) [email protected]
MinnesotaMr. Jeffrey L. GundersonMinnesota Sea Grant Extension ProgramUniversity of Minnesota-Duluth2305 East 5th StreetDuluth, MN 55812
(218) 726-8715FAX: (218) [email protected]
OhioDr. John HochheimerPiketon Research & Extension Center1864 Shyville RoadPiketon, OH 45661-9749(614) 289-2071FAX: (614) [email protected]
NebraskaDr. Terrence B. KayesDept. of Forestry, Fisheries & WildlifeUniversity of Nebraska-Lincoln12 Plant Industry BuildingEast Campus MallLincoln, NE 68583-0814(402) 472-8183FAX: (402) [email protected]
MichiganMr. Ronald E. KinnunenMSU - Upper Peninsula702 Chippewa SquareMarquette, MI 49855-4886(906) 228-4830FAX: (906) [email protected]
KansasMr. Charles LeeDepartment of Animal Science and IndustryKansas State UniversityCall HallManhattan, KS 66506(913) 532-5734FAX: (913) [email protected]
IowaDr. Joseph E. MorrisDepartment of Animal EcologyIowa State University124 Science IIAmes, IA 50011-3221(515) 294-4622FAX: (515) [email protected]
MissouriMr. Robert A. Pierce IISchool of Natural ResourcesUniversity of Missouri-Columbia1-25 Agriculture BuildingColumbia, MO 65211(573) 882-4337FAX: (573) [email protected]

appendix.doc
APPENDIX BNCRAC AQUACULTURE EXTENSION CONTACTS BY STATE
(continued)
North DakotaMr. Brian StangeCarrington Research Extension CenterNorth Dakota State UniversityBox 219Carrington, ND 58421(701) 652-2951FAX: (701) [email protected]
Illinois and IndianaMr. LaDon SwannDepartment of Animal SciencePurdue University1026 Poultry BuildingWest Lafayette, IN 47907(317) 494-6264FAX: (317) [email protected]
South DakotaMr. Larry TidemannCooperative ExtensionSouth Dakota State UniversityAgriculture Hall 154, Box 2207Brookings, SD 57007(605) 688-4147FAX: (605) 688-6065
appendix.doc
APPENDIX CAQUATIC HERBICIDE FORMULATIONS AND APPLICATION METHODS
Copper sulfate: (granular crystals, diamond form, powder)The granular form is best applied by putting it in a burlap sack and towing it by boat aroundthe pond until it is dissolved. The powder form is best used by dissolving it in water andspraying directly onto the algae mats and into the water. Copper sulfate is highly corrosive tometals so that plastic, enameled, or copper-lined containers and fittings might be needed formixing and applying the algicide. Sprayers should be thoroughly cleaned and rinsed out afterevery operation to prevent damage.
Cutrine Plus, A & V-70, Algimycin, Aquatrine, K-Tea, Stocktrine and other chelatedcopper compounds: (liquid, granules) Mix liquid with water in a container and spray orinject into infested area. Granular formulations can be broadcast into the water. Both liquidand granular formulations can be used as spot treatments. Much less corrosive to metals thancopper sulfate.
Hydrothol and Aquathol: (liquid, granules; active ingredient is endothall) Hydrothol liquid isrecommended for use only by commercial applicators. It can cause fish kills and severe skinburns. Also use caution in handling Aquathol liquid, but it is much safer than Hydrothol liquidwhere fish are present. Spray or inject liquid-water mix into infested area. Liquid and granulescan be used as spot treatments.
Reward, Diquat, Weedtrine-D: (liquid; active ingredient is diquat) Spray or inject liquid-watermix into infested area. The mix can be used as a spot treatment. Spray is used for duckweedcontrol.
Sonar: A.S. [(aqueous solution), SP (soluble pellet), SRP (slow release pellet); activeingredient is fluridone] Spray or inject liquid-water mix into infested area. Must be applied toentire surface area of ponds. In lakes and reservoirs should be applied to areas greater than 5acres to prevent dilution. Not satisfactory as a spot treatment. Takes 30-90 days to seeresults. May get 2-years activity.
Aquakleen, Weed Rhap Low Volatile Granular-D herbicide, Weedtrine II Granules;(active ingredient is 2,4-D ester; all are granules) Distribute evenly over infested area. Withfew exceptions, 2,4-D liquid formulations are not currently registered for in-water use. Onlyamine formulations of 2,4-D liquid can be used for vegetation control around water (forexample, drainage ditchbanks); liquid ester formulations are highly toxic to fish and should notbe used around water.
Rodeo: (liquid; active ingredient is glyphosate) Rodeo requires addition of a surfactant toliquid-water mix. Spray directly on foliage. Can be used as a spot treatment or as a wipe-onapplication.

appendix.doc
APPENDIX DAQUATIC HERBICIDE RECOMMENDATIONS AND USE RESTRICTIONS
Aquatic weed Herbicide1 Typical product rate2 Restrictions3
Algae (microscopic,filamentous, Chara)
Copper sulfate
Copper chelates
Endothall (Hydrothol191)
2.7 lb./A-ft.
Rate varies withformulationCan also be used forsubmersed weedcontrol
Do not use in trout waters
Do not use in trout waters
3 - 11 lb./A-ft 0.6 to 2.2 pt/A-ftF=3 days; I, L, D = 7-25 daysdepending on dosage.
Submersed plants(pondweeds, naiads,elodea)
Submersed plants(Eurasian watermilfoilcoontail)
Endothall (Aquathol K)
Diquat (Reward)
Fluridone (Sonar)
2,4-D (Aquakleen)
Fluridone (Sonar)
27 lb./A-ft, 0.6gal/A-ft.
1-2 gal./SA
Rate varies withformulation
100 -200 lb/SA
As above
Sw = 1 day F = 3 days; L, I4, Sp,D = 7-25 days depending ondosage
I = 1-5 days D = 1-3 daysdepending on the dosage L= 1day
I = 7-30 days depending ondosage; do not apply within 1/4mile of potable water intakes
Do not apply to waters for I, D,dairy animals.
As above
Free-floating plantsplants (duckweed,watermeal)
Diquat (Reward)
Sonar (AS formulationonly; for duckweedonly)
1 gal/SA; addsurfactant
1 qt/SA
I = 1-5 daysD = 1-3 days dependingL = 1 day
As above
Rooted-floating plants(waterlilies spatterdock)
Glyphosate (Rodeo +surfactant)
Consult label Do not apply within 1/2 milepotable water intakes
Emergent plants(Cattails and otherperennial plants)
Glyphosate (Rodeo +surfactant)
Some 2,4-D amineformulations may beused for broadleafcontrol.
Consult label As above
Do not contaminate water.Check the label.
1Trade names are given only as examples. For other available products, see page 4-5.2SA= surface acre; A-ft = acre-feet. These rates are given only as an indication of amount to use and will varyaccording to target species, recommended dosage, state restrictions, etc. Please read the label to determineactual rate.3Additional restrictions can be imposed by states. Check with local and state regulatory agencies. F = fishing;I = irrigation; L = livestock; D = domestic use; Sw = swimming, Sp = as spray for crops.

appendix.doc
4Liquid formulation only: treated water can be used for sprinkling bent grass immediately.

appendix.doc
APPENDIX EQUESTIONNAIRE TO ANALYZE YOUR STRENGTHS AND WEAKNESSES TO
DETERMINE IF YOU HAVE "ENTREPRENEURIAL QUALITIES."Yes No
1. Do I like experimenting with new ideas? ___ ___
2. Am I good at making decisions promptly? ___ __
3. Do I feel insecure when taking risks? ___ ___
4. Do I often get frustrated when things do not go as planned? ___ ___
5. Am I willing to work hard for something I really want? ___ ___
6. Am I willing to work overtime without extra pay? ___ ___
7. Do I keep records of my income and expenses? ___ ___
8. Am I managing my personal finances so that I livewithin my income and still save some money? ___ ___
9. Do I borrow money when I have a chance to gain by doing so? ___ ___
10. Is being independent very important to me?
Yes No
11. Am I motivated to get things done without havingto be urged by someone else? ___ ___
12. Do I enjoy working without supervision? ___ ___
13. Do I enjoy participating in community affairs? ___ ___
14. Would I rather "do things myself" than let others help me? ___ ___
15. Am I willing to sacrifice and wait for somethingI really want? ___ ___
16. Do I consider myself a patient person? ___ ___
17. Would I rather be known as an entrepreneur morethan an executive of a well-known corporation? ___ ___
18. Do I often let others talk me out of a decisionI have made? ___ ___
19. When I have an important decision to make, doI always try to gather as much information as possible? ___ ___
20. Do I maintain self-confidence in the faceof disappointment? ___ ___
21. Am I willing to risk my personal propertyfor this venture? ___ ___
22. Do I cope well with stress? ___ ___