Embed Size (px)
Citation preview


PROCEEDINGS OF ELECTRICAL ENGINEERING CAPSTONE SHOWCASE
(EECS 2020)
SMART INFRASTRUCTURE

ii
PROCEEDINGS OF ELECTRICAL ENGINEERING CAPSTONE SHOWCASE 2020
SMART INFRASTRUCTURE 2021
First Edition 2021
Hak cipta terpelihara. Tiada dibenarkan mengeluar ulang mana-mana bahagian artikel, ilustrasi dan isi kandungan buku ini dalam apa juga bentuk dan cara apa jua sama ada dengan cara elektronik, fotokopi, mekanik, atau cara lain sebelum mendapat keizinan bertulis dari Pengerusi, Sekolah Kejuruteraan Elektrik, Universiti Teknologi Malaysia, 81310 UTM Johor Bahru, Johor Darul Ta’zim, Malaysia. Perundingan tertakluk kepada perkiraan royalti atau honorarium. All rights reserved. No part of this proceedings may be reproduced, or transmitted in any form or by any means, electronic or mechanical including photocopying, recording, or any information storage and retrieval system, without permission of Chair, School of Electrical Engineering, Universiti Teknologi Malaysia, 81310 UTM Johor Bahru, Johor Darul Ta’zim, Malaysia. Negotiation is subjected to royalty or honorarium estimation. Published by: School of Electrical Engineering, Universiti Teknologi Malaysia, 81310, Johor Bahru, Malaysia. eISBN 978-967-2615-32-3

iii
CONTENTS
Preface
Page
Paper 1
Smart Mosquito Killer Muhammad Rabbani Bin Razali, Adlin Mastura Binti Mohd Ali Napia, Muhammad Syaqir Hannan Bin Roslin, Lok Shun Zhi, Mun’im Zabidi
1-12
Paper 2 Spot Me : A Smart Surveillance Headcount Device with ESP32-CAM Joyce Ng Ting Ming, Lim Yi Xian, Mohamad Faizul Ali, Sherrwin Raj s/o Murugiah, Norhafizah Ramli
13-34
Paper 3 Smart Streetlight System Robinson Kong, Tung Yeong Feng,, Nurul Nabilah binti Mohd Rizal, Arif Raihan Tanvir, Amirjan Nawabjan
35-45
Paper 4 IoT-based Health Monitoring Device for Smart Healthcare Infrastructure Muhamad Amirul Hakimi bin Ramli, Muhamad Fadhli bin Mohamed, Ng Soo Tin, Wong Kin Joe, Eileen Su Lee Ming.
46-54
Paper 5 CroTracker: Smart Premise Occupancy and Crowd Tracking Maisarah Abdullah, Nur Irdina Mohd Shahrir, Abdelrahman Hamdy Mohamed Ahmed Abdelaziz, Ahmad Fikrie Ahmad Saidi, Shaharin Fadzli Abd Rahman
55-67
Paper 6 Safe-Sensing Pineapple Peeling and Coring Machine Zairee bin Muhamad, Wan Ahmad Nazlee Bin W Hassan, Siti Nur Halijah Binti Mohamed Yusof, Raja Muhd Farhan Bin Raja Abdul Rahman, Suhana Mohamed Sultan
68-77

iv
PREFACE The capstone design project in the School of Electrical Engineering is a compulsory course for final year undergraduate students. This course is offered to produce community-cognizant individuals who are able to address community or industry based problems using appropriate techniques, skills, and modern engineering tools. In addition, elements such as project management and teamwork in diverse teams are included and assessed throughout the study. This publication consists of all the work presented during the Electrical Engineering Capstone Showcase (EECS 2020), which was held on 25th January 2021 organized by the School of Electrical Engineering, Universiti Teknologi Malaysia. The EECS 2020 was the platform for more than 300 students to share and exhibit their ideas and projects which they have worked on for that semester. Panels who evaluated their work consist of academicians and industrial representatives who faithfully had provided valuable insights to further improve the students’ work. The projects reported in the Proceedings of Electrical Engineering Capstone Showcase 2021: Smart Infrastructure could serve as motivation and valuable information for future collaborative projects and for the betterment of the society. Editor Dr. Suhana Mohamed Sultan EECS Technical/ ECE Publication/Sub-Editors Team Assoc. Prof. Ts. Dr. Eileen Su Lee Ming Dr. Shaharin Fadzli bin Abdul Rahman Dr. Mohd Azhar bin Abdul Razak Dr. Amirjan bin Nawabjan Dr. Lim Cheng Siong Dr. Musa Mohd Mokji Dr. Rashidah Arsat Dr. Zulkarnain Ahmad Noorden

PROCEEDINGS OF ELECTRICAL ENGINEERING CAPSTONE SHOWCASE 2020 (EECS2020): SMART INFRASTRUCTURE
eISBN 978-967-2615-32-3
SMART MOSQUITO KILLER
Muhammad Rabbani Bin Razali Adlin Mastura Binti Mohd Ali Napia
Muhammad Syaqir Hannan Bin Roslin Lok Shun Zhi
Mun’im Zabidi* School of Electrical Engineering,
Universiti Teknologi Malaysia *[email protected]
Abstract - The goal of this project is to design and implement a product that will minimise mosquito breeding grounds while also assisting in maintaining a downward trend in dengue fever cases. The ESP32 is utilised as the main control board in this project. The board is linked to the Blynk as a long-distance controller.
Keywords: health; mosquitoes; dengue; ESP32; IoT Introduction
Smart infrastructure intelligently links energy systems, transportation, buildings and industries in order to improve our lifestyle. Internet-of-Things (IoT) devices are connected to the cloud and big data analytics to acquire real-time data and improve service delivery. Smart infrastructure is a fantastic example of what the future may look like. Smart infrastructure is envisioned to serve as the backbone of a city.. One example is smart traffic control systems, which can cut traffic delays. It not only saves time, but it also saves money because it reduces gasoline usage [1].
Smart infrastructure, on the other hand, is not limited to cities. This approach can also be used in rural and suburban areas. These technologies may be used to reduce operational expenses while also improving citizen quality of life. A smart water quality system is one type of smart infrastructure that might be used in rural regions. This gadget can help people acquire a high-quality water supply. To prevent falling behind, rural communities, small towns, and suburbs must invest in smart infrastructure.
We can deploy smart infrastructure to help avoid, prevent, and minimise the number of diseases in order to improve healthcare in the country. In the long run, a healthy population with fewer chronic problems would be the solution, and public health has received increased attention in recent years. The greatest option is to keep a close eye on people's health and intervene before they deteriorate into failure. We can also cut down on the number of emergency room visits [2].
Project Introduction
Before beginning work, the problem statement was defined in order to gain a better understanding and describe the main aspects of the project. Customers or users who had issues were also identified. A study was conducted to explore how mosquito aerosol sprays or repellents were used to prevent and kill mosquitoes.
Based on the given issue, the targeted user is one of the hotel managers looking for a solution to customer complaints about the presence of mosquitos in hotel rooms. A Google form questionnaire was created to ask about the characteristics of a product that they preferred, as well as any improvements from their previous method of killing and preventing mosquitoes.
Responses and information from the questionnaire were gathered and classified as the main problem as well as the suggested criteria for the project. A team meeting was held to analyse the STEEP analysis (Table 1) and to provide a brief overview of the conceptual prototype and product development.
Table 1: The STEEP Analysis for Smart Mosquito Killer project. STEEP Analysis S-Social Reduce the cases of dengue fever T-Technology IoT system to monitor the presence of mosquito E-Economic Reduce cost from fogging activity E-Environment Prevent environmental pollution by reduce the chemical effect P-Political Exchange this technology with other countries that are suffering from mosquito-borne disesases

2
Personas represent various types of users that will also use a service or product based on the research. The persona for our product is as follows:
● Age is 30 years old and above ● Busy hotel manager ● Passionate in his work
Table 2: The user’s profile paint points and needs
Pain Points Needs Received complaints from customers Locate rooms with mosquitoes and immediately kill them Customers felt irritated with mosquitoes in room Eliminate the breeding ground of mosquitoes Hard to monitor all the room at the hotel Monitor easily the rooms with an app
A problem statement has been created based on this user's profile, summarized in Table 2, which will assist in locating and eliminating mosquitoes in specific hotel rooms.
Project Planning
At the planning stage, we discussed the product's conception, design, implementation, and operation. We prepared a conceptual sketch (Figure 1) that includes all the components used in order to get a good overview of the design and process of the Smart Mosquitoes Killer product.
Figure 1: The conceptual sketch for the Smart Mosquito Killer
Scheduling (Figure 2) is crucial for project management because it aids in achieving the project's objectives and goals. To keep track of the project's progress, we used a Gantt chart. All of the tasks required to complete this product are depicted in the Gantt chart. The start date for the project is 2nd November 2020 and the end date is 7th February 2021.

3
Figure 2: Gantt chart for the Smart Mosquito Killer project
Our product's budget has also been discussed in order to produce a cost-effective and efficient product. The cost of our product is estimated to be RM89.87. Because all of the components were ordered from an online shop, this cost also included postage. However, the product's exact cost is RM59.86, we saved RM30.11 off the original estimate, as shown in Table 3.
Table 3: The financial planning for the project

4
Engineering Design
The Internet of Things (IoT) is a fairly simple concept that involves connecting all of the world's devices (or things) to the Internet. When a device is connected to the Internet, it can send or receive information, or both [3].
The three main components of Internet of Things architecture are devices, gateways, and IoT clouds. Sensors and actuators are used in the devices. The three components must be defined, and each has its own set of features and functions.
Figure 3: The IoT architecture
The product is called Smart Mosquito Killer, and it can immediately kill the surrounding mosquitos with an aerosol spray or repellent. The spraying mechanism is operated via the Blynk app on a smartphone. Figures 4 to 8 depicts the Smart Mosquito Killer's conceptual design and schematic circuit.
Figure 4: Conceptual sketch of Smart Mosquito Killer

5
Figure 5: Conceptual sketch of Smart Mosquito Killer (side view)
Figure 6: Conceptual sketch of Smart Mosquito Killer (front view)

6
Figure 7: Conceptual sketch of Smart Mosquito Killer (top view)
Figure 8: Schematic diagram of circuit connection
This project is made up of both software and hardware components. Each part requires the inclusion of specific components or tools in the final product.

7
Figure 9: Flowchart of program development
Some components or tools were tested based on the flowchart in Figure 9 to ensure that they would function properly. The Arduino IDE was used to programme the INMP441 microphone, Blynk app, and MG902 servo motor. We were able to develop the software thanks to extensive searching of information from the Internet.
The descriptions for each component or tool involved are as follows:
1. UV LED
UV LED has many applications that depend on wavelength and output power. It is able to draw mosquitoes to fly approaching Smart Mosquito Killer.

8
Figure 10: UV LED
2. INMP441 I2S Microphone
The INMP441 is a digital MEMS omnidirectional microphone. It has a flat frequency response from 60Hz to 15 kHz. The INMP441 is compatible with ESP32 and was able to pick up the mosquito sound signal. The frequency range of interest is between 427 Hz and 726 Hz [4].
Figure 11: INMP441 microphone
3. ESP32 Module
The ESP32 (Figure 12) was chosen for its interesting capabilities [6]. It has Bluetooth and Wi-Fi built in, and also a good number of GPIO pins and communication protocols for quite a low price. Most importantly, the ESP32 can be programmed using the familiar Arduino Integrated Development Environment (IDE).
Figure 12: ESP32 module
4. MG90S Servo Motor
A servo motor is a type of motor that has a high degree of precision in rotation. It's a common method for rotating an object at a specific angle. The MG90S servo motor is compact and can be used in a variety of applications (Figure 13). In this project, servo motor MG902 controls the aerosol spraying mechanism [5,6].
Figure 13: MG90S servo motor

9
5. ARDUINO IDE
The Arduino IDE is used to develop the system's software for the ESP32. This open-source platform includes a text editor for coding. The available libraries allow a user to create appropriate instructions, allowing the ESP32 and other components in this project to function properly after they have been programmed.
6. BLYNK APP
Blynk is a platform that uses iOS and Android apps to control and monitor a hardware project [8]. On the smartphone screen, a project dashboard with buttons and other widgets can be created. In this project, the user connects to Blynk to receive notifications about the presence of mosquitoes and to control the servo motor.
Product Realization
After the programme development went smoothly, the connections between each component were implemented. The ESP32 was connected to other components such as the INMP441 microphone and the MG90S servo motor using a breadboard and jumper wires. The servo motor was also attached to the top of the aerosol can (Figure 14). A black box served as a casing to keep the circuit in place (Figure 15).
Figure 14: Attached servo motor on aerosol can
Figure 15: A black box holds the circuit
Using the Blynk library, a program for the Blynk app was created in Arduino IDE. To control the servo motor, the SLIDER widget was chosen in the Blynk app (Figure 16). During the testing, the app would send a notification indicating the presence of mosquitoes. At the same time, the user should be able to control the servo motor using the SLIDER widget.

10
Figure 16: Blynk app feature
The Arduino code for initialising INMP441, Blynk, and the servo motor is determined for programming (Figure 17).. The mosquito buzzing audio was also subjected to the Fast Fourier Transform (FFT) [9]. There is a password to access the coding for the system's security, and this will ensure that all data stored is safe.
Figure 17: The coding for the project
By collecting sounds from real mosquitos, researchers determined the frequency of mosquito wing beats (Figure 18). Several frequencies, including 427Hz, 474Hz, and 726Hz indicate the presence of dangerous mosquitoes [4]. Our system works by detecting any frequency in the range of 427Hz to 726Hz.

11
Figure 18: Spectral analysis showing the frequency range of mosquitoes.
Discussion
The Smart Mosquito Killer is installed in places like rooms, offices, and homes. Sound acquisition, signal processing, and hardware action are the three critical steps in the operation of SMK. Mosquito detection is improved by locating the SMK higher up, and its chemical should be dispersed more widely to kill the mosquito. There is also a black box and a UV light that attracts mosquitoes.
The fundamental idea behind Smart Mosquito Killer is to warn users about the existence of mosquitos in their selected location via Blynk apps and provide users with a quick way to dispose of them. The following are the functions of SMK:
● Provide real time mosquito detection ● To prevent the presence of mosquitoes in a room ● To kill the mosquito remotely
To begin, the microphone acquires all sound signals. The signal processing phase detects mosquitoes if frequencies in the range of 427 to 726 Hz are present. The Bluetooth capability of the MCU32 will notify the threshold of mosquito presence, and the notification will be sent to the Blynk application.
The user will be notified via Blynk and then will decide what to do next. When the user slides the button in the Blynk, the servo motor rotates 180 degrees and pushes the spray button at the mosquito killer chemical, which is the hardware action.
Technology integration in hardware and some IoT applications helps to maintain a sustainable environment. Smart Mosquito Killer's features provide a new platform for users to live a healthy lifestyle and maintain their health without having to spend a lot of time doing so.
Conclusion
Our team began the project by conducting a survey to determine the needs of potential end-users, developing potential solutions, conducting a feasibility study of the mosquito killer system in various aspects such as social, technical, cultural, environmental, and political impacts (using the STEEP analysis), and finally developing a prototype.
This project uses IoT specifications to effectively eliminate the presence of mosquitos in the surrounding area. This prototype is ideal for use in a closed area to kill mosquitoes with a single click. Both hardware and software were connected to each other through an application. As this system is only a prototype, some improvements, such as noise sensitivity, product cost, and product appearance, must be made before it can be marketed to make it more attractive to users.
References

12
1. Ogie, R. I., Perez, P., & Dignum, V. (2017). Smart infrastructure: an emerging frontier for multidisciplinary
research. Proceedings of the Institution of Civil Engineers - Smart Infrastructure and Construction, 170(1), 8–
16. https://doi.org/10.1680/jsmic.16.00002
2. KPMG, Smart infrastructure improving healthcare, White Paper (2017). 3. What is IoT?A Simple Explanation of the Internet of Things. (2020). Retrieved from
https://www.iotforall.com/what-is-iot-simple-explanation 4. Mukundarajan, H., Hol, F. J. H., Castillo, E. A., Newby, C., & Prakash, M. (2017). Using mobile phones as
acoustic sensors for high-throughput mosquito surveillance. Elife, 6, e27854. 5. Servo Motor S MG90S (Metals Gears, Digital). (n.d.). Retrieved from https://www.smart-
prototyping.com/MG90S-9g-metal-gear-digital-servo.html 6. Servo Motor Controlled With BLYNK Over WiFi. (n.d.). Retrieved from https://www.instructables.com/Servo-
Motor-Controlled-With-BLYNK-Over-WiFi
7. ESP32 DevKitC Pinout, Overview, Features & Datasheet. (n.d.). Retrieved from https://components101.com/microcontrollers/esp32-devkitc
8. How to Remotely Control an Arduino with the Blynk App. (2018). Retrieved from
https://maker.pro/arduino/projects/how-to-remotely-control-an-arduino-with-the-blynk-app
9. Smart Door Bell and Noise Meter Using FFT on ESP32. (2020). Retrieved from https://iotassistant.io/esp32/smart-door-bell-noise-meter-using-fft-esp32/

PROCEEDINGS OF ELECTRICAL ENGINEERING CAPSTONE SHOWCASE 2020 (EECS2020): SMART INFRASTRUCTURE
eISBN 978-967-2615-32-3
Spot Me: A Smart Surveillance Headcount Device with ESP32-CAM
Joyce Ng Ting Ming Lim Yi Xian
Mohamad Faizul Ali Sherrwin Raj s/o Murugiah
Norhafizah Ramli School of Electrical Engineering
Universiti Teknologi Malaysia [email protected]
Abstract: Social distancing, also known as “physical distancing”, plays a pivotal role in breaking the chain of COVID-19 transmission. This project aims to introduce a device named “Spot Me” that enables, encourages, and enforces social distancing practice among the society. The solution complements the MySejahtera application by monitoring the number of ins and outs at a premise, while being user friendly and providing near real-time access to headcount data. The proposed system consists of a ESP32-CAM hardware module, main program, and webpage. The ESP32-CAM functions as an input to the main program where an image detection and tracking algorithm in OpenCV is employed to detect humans and their movement to update the headcount. The headcount data is displayed at the webpage via Blynk cloud. The product is proven to detect humans appearing in the sight of a camera accurately and forward the headcount data to webpage in near-real time. Future works could include multi-camera support to cover a wider area and optimization of the processing speed. Keywords: Social distancing; COVID-19; Graphical User Interface (GUI); Image Processing; Blynk; Webpage Introduction
COVID-19 has been the main focus of the world since its first discovery in Wuhan, China in December 2019 (WHO, 2020). It has affected every country in the world since its introduction due to asymptomatic transmission through the air. Therefore, social distancing is widely regarded as an effective non-pharmaceutical way that can cut the transmission of COVID-19 (Nguyen, 2020). Social distancing refers to the practice of keeping distance between people, especially among non-family members, which means avoiding mass gatherings and overcrowd in closed spaces.
This practice is adopted by most small to medium business owners in Malaysia. It is common for a shop owner to limit the number of customers in a shop by setting up a single entrance and have employees responsible for regulating the number of customers. MySejahtera application, which is developed by the government of Malaysia for contact tracing, is also compulsory for all businesses in Malaysia to adopt. However, MySejahtera application mainly focuses on tracing the history location of individuals that have been to a particular place. It does not keep track of the ins and outs of a shop nor is the data available for general viewing in near real-time. This project introduces a solution that complements the MySejahtera application by monitoring the number of ins and outs in near real time. Although these measures may cause inconveniences, they are crucial in controlling the spread of the disease. Project Objectives
The objectives of this project are:
1. To implement a user friendly and interactive interface.
2. To provide an accurate head counting system.
3. To allow accessibility of headcount device remotely.
4. To allow easy near real-time access to headcount data.

14
Survey Analysis
Figure 1: Response to the necessity of social distancing during COVID-19
Figure 2: Response on limiting the number of people as an effective measure to carry out social distancing
Figure 1 shows most of the community agrees that social distancing is effective in tackling the COVID-19 pandemic. Figure 2 shows that generally people agree that limiting the number of people in a vicinity is an effective way of social distancing. Other information found are shops usually draw lines or put-up markings to ensure distance is maintained and limit the number of people entering a shop at a time.
This survey conducted also discovered a few challenges arose due to the efforts of limiting the number of people entering the shop. The business owners might risk losing their customer base due to a long queue before entering the shop. They also found difficulty in regulating the number of customers entering the shops due to the shortage of workers. Sometimes, they are in a tough spot where some disobedient and stubborn customer does not want to adhere and follow the instructions.
The existing MySejahtera developed by the Malaysia government is good at tracing people whereabout for contact tracing purposes but does not track the number of customers within premises. A real-time head counter is generally regarded as a good idea that is practical in small shops, and helpful for customers and workers. The survey also found that most people agree that knowing the occupancy status of a shop before queuing for entry is convenient with the opinion that it prevents overcrowding and not wasting customer’s time. In short, the survey found that a real-time head counter would be helpful in optimizing the daily operation of a shop. The complete questionnaire is provided in the appendix A.
Design Statement Efforts in carrying out social distancing aroused the problem where the business owners have to deviate extra manpower in implementing these measures. There may be errors aroused from human performance in recording ins and outs at premises. Customers may be facing a long queue, which is a turn-off for some. Therefore, the proposed solution should be able to reduce manpower, aids in carrying out social distancing while reducing the queueing time.
Methodology
This project design consists of five main blocks as illustrated in the Figure 1. The endpoint devices are ESP32-CAM module and client devices such as smartphones or laptops. ESP32-CAM module functions as a camera that provides scene video feed to the main program for processing. The main program consists of a graphical user interface (GUI) for user interaction and an image processing algorithm that detects people and counts them based on their

15
walking direction. Results are sent to the cloud and subsequently displayed at the webpage, for access by any client device that is connected to the internet.
Figure 3: Design Block Diagram
ESP32-CAM Module
ESP32-CAM module is a full-featured microcontroller module with a camera integrated into it while being low-cost. It is used in this project as the camera that provides the video feed to the image processing module. When in use, it will be placed at a suitable location with a view over the entrance. The video feeds are sent for processing via wifi network, combined with flexible power options such as power bank or direct power, makes this a suitable option for many kinds of scenarios. The module is shown in Figure 4.
Figure 4: ESP32-CAM Module
Graphical User Interface (GUI)
GUI, short term for Graphical User Interface allows users to interact with electronic devices such as computers, laptops, smartphones, and tablets. GUI provides visual representations of the available commands of an operating system or software program. The visual representation includes graphical icons, widgets, menus and pointers. The existence of GUI makes the system more user friendly and attractive.
Implementation of GUI in the product is to replace the command line: python people_counter.py -p mobilenet_ssd/MobileNetSSD_deploy.prototxt -m mobilenet_ssd/MobileNetSSD_deploy.caffemodel -l limit -i video} -o output/output_01.avi that may seem complicated and confusing to the customer. It is replaced with a “Run” button instead of manually typing in a long command line on the terminal. A few features are also introduced to make the product more interesting and marketable. Details of GUI implementation can be found under the product development session.
Image Processing
Implementation of the image processing module requires knowledge of Python programming. There are three fundamental phases in implementing a people counter system: object detection, object tracking, and people counter system.

16
Object detection algorithms are the combination of image classification and image localization. Image classification involves assigning a class label to an object detected. Image localization involves drawing a bounding box around the object detected. Examples of popular object detection algorithms include Haar cascades, deep learning-based detectors such as R-CNNs, YOLO, and SSDs. In this product, we will be using Single Shot Detectors (SSD) for human detection.
Object tracking is a process of locating moving objects around the frames using a camera. It will accept the bounding box coordinates of the detected object and assign a unique ID for each detection. There are a few useful object tracking algorithms built into Open-source Computer Vision (OpenCV) such as CSRT Tracker, Median Flow Tracker, and MOSSE Tracker. An algorithm called centroid tracking algorithm is introduced along with dlib in implementing the human tracking process.
Lastly, the product can discern the direction of movement and subsequently keep updating the people counter. General flow and integration of each process was introduced in the flowchart in Figure 5. Details of image processing implementation can be found under the product development session.
Flowchart - GUI, Image Processing and Blynk
The flowchart in Figure 5 shows the relationship between GUI, Image processing, Blynk cloud
Users will be interacting with the system using GUI. Users are required to fill in people limits and video links before running the application. The people limits will be sent to Blynk cloud for processing. For experimental purposes, this project uses ESP32 Cam to retrieve live video streams. To retrieve the streaming video, the system has to first ensure the PC is connected to the same network as the module through WiFi. In the waiting state, the system waits for people to be detected and tracked. During the detecting phase, the system is actively in the process of detecting people using object detection algorithms. During the tracking phase, people are being tracked in the frame on the direction they are moving ahead to. The system will then update the people counter by increasing or decreasing the count simultaneously. Lastly, the system will deregister the old people's IDs when the human is appeared to be “lost” or disappeared from the frame. The system sent the people’s count as output data to Blynk Cloud for processing. Details of flow implementation can be found under the product development section.

17
Figure 5: Flow Chart
Cloud The cloud module mainly deals with data flow in the system. The data flow flowchart is shown in Figure 6. Services used in this module are Ngrok, Blynk, and Cloudflare Workers (not shown in flowchart). The core service used is Blynk, an internet of things (IoT) platform, which is used to forward data from the main program to the webpage. Blynk is chosen because other platforms such as CloudMQTT do not offer a free tier while platforms like MyQttHub is limited to 10000 messages per day for the free tier. In more detail, Virtual Pins in Blynk are used to send any data from the microcontroller to the Blynk App and back. From there, Blynk HTTP RESTful API can be used to update the data via GET requests. In the webpage, the display of data can be updated through the JavaScript Fetch API which gets the pin value from Blynk cloud.
Ngrok is optional in this system in which it will only be used if the ESP32-CAM module is not in the same local area network with the main program. Ngrok is a service that allows the exposure of a webserver running on a local machine to the internet. In this case, it exposes the MJPEG streaming webserver that is running on the ESP32-CAM module, allowing the main program to access it from elsewhere. It generates a link in the subdomain of ngrok.io and the link can be used as input to the main program.
Cloudflare Workers is a serverless application platform that runs scripts on Cloudflare’s servers. It uses NodeJS framework and scripts can be deployed immediately. In this project, it is used to host a CORS proxy. A CORS proxy modifies the headers to a request, such as the GET requests mentioned above. It operates in between the webpage and Blynk server which provides the data. This is needed as browsers nowadays blocks requests that did not come from the same server that hosts the webpage. A CORS proxy solves this problem. The code used in this project is a version of Rob. W’s Cors-Anywhere proxy, which is a NodeJS proxy that adds CORS headers to the proxied request.

18
The last component in this module are JavaScript scripts on the webpage that fetch data from Blynk in JSON format. This data is processed and displayed on the webpage accordingly. This method is chosen as the webpage is hosted on GitHub, which only hosts static pages without a full database system.
Figure 6: Cloud Module
Webpage
The webpage used in this project is hosted using Github Pages. The main reason is that it is open-source, and this project only requires a webpage to display data. Github Pages is a feature of Github where the webpage is directly hosted from the Github repository and is intended for projects. It is also stable compared to most free website hosting where there is limited bandwidth and downtime. The main drawback of this approach is the lack of a database which poses limitations on data processing. However, this is acceptable for the scale of this project as data are obtained from Blynk Cloud. The data processing can be done directly in the browser as it is very simple and lightweight.
Product Development
1. ESP32-CAM Module Figure 7 shows the connection between the Serial-TTL converter and the module during programming. The converter also functions as a voltage regulator for the module. A MJPEG streaming webserver code is programmed into the module via the Arduino IDE. Upon successful flashing, the address can be read through the serial monitor of the IDE, in this case it is http://192.168.0.108/mjpeg/1, note the mjpeg http get request method in the URL. A MJPEG streaming webserver is used for its ability to stream through the HTTP protocol. This is needed to stream through the internet or wide area network (WAN), thus ESP32-CAM module does not need to be in the same local area network (LAN) with the PC that runs the main program. The code for the webserver is available at the appendix B.
Figure 7: ESP32-CAM Connection with TTL Converter

19
A casing is built for the module. Figure 8 below shows the prototype design plan and the actual prototype. The case houses the ESP32-CAM module and converter module that functions as the voltage regulator.
Figure 8: Prototype Design
Figure 9: Prototype

20
2. Graphical User Interface (GUI) These are the layout design of our GUI that will be presented to the end user of our product. The goal of designing GUI is to make the product more user friendly and attractive.
Required Python Libraries These are several different Python libraries needed to Graphical User Interface (GUI), including:
a. Tkinter - Provides a powerful object-oriented interface to the Tk GUI toolkit.
b. Os - Provides functions to interact with the operating system. It comes under Python’s standard utility modules.
Main Frame
● This layout is the home page that will be presented to our customers.
● As shown in Figure 10, new users are required to register themselves by clicking the “Sign Up” button before they are allowed to use our product. This action will lead the users to “Sign Up Frame”.
● Registered users may log in to our system by clicking the “Spot Me” button and this action will lead them to “Log in Frame”.
Mainframe Coding is as shown below:
class MainScreen (tk.Frame): def __init__(self, parent, controller): tk.Frame.__init__(self,parent) #background image for an app self.logo = tk.PhotoImage(file=r'queue1.png') tk.Label(self, image=self.logo).pack() #main title label widget style = ttk.Style() style.theme_use('alt') style.configure('TButton', background='white', foreground='black', width=20, borderwidth=1, focusthickness=3, focuscolor='none', font=("Comic Sans MS", 13)) style.map('TButton', background=[('active', '#ffbc94')]) tk.Label(self, text="").pack() tk.Label(self, text="Welcome to Spot Me!", font=("Bauhaus 93", 25)).pack() tk.Label(self, text="").pack() ttk.Button(self, text= "Spot Me", command=lambda:controller.show_frame(Login)).pack() tk.Label(self, text="").pack() ttk.Button(self, text= "Sign Up", command=lambda:controller.show_frame(Register)).pack() tk.Label(self, text="").pack()
Figure 10: Main Frame

21
Sign Up Frame
● New users are required to fill in the personal information such as username and password to register as in Figure 11.
● After clicking the “Register” button, it will show the status “Registration success” if the filled-in information is valid.
● The user may proceed to log in by clicking the “Proceed to Login” button.
● The user may return to the home page by clicking the “Return to Home” button. Sign Up frame Coding is as shown below:
class Register(tk.Frame): def __init__(self, parent, controller): tk.Frame.__init__(self, parent) global username global password username = tk.StringVar() password = tk.StringVar() self.logo = tk.PhotoImage(file=r'reg.png') logo_label = tk.Label(self, image=self.logo).pack() tk.Label(self, text="Please enter details below", font=("Bodoni MT", 30)).pack() tk.Label(self, text="").pack() tk.Label(self, text="Username", font=(10)).pack() self.username_entry = tk.Entry(self, textvariable=username, width=40, borderwidth=5) self.username_entry.pack() tk.Label(self, text="Password", font=(10)).pack() self.password_entry = tk.Entry(self, textvariable=password, show= "*", width=40, borderwidth=5) self.password_entry.pack() tk.Label(self, text="").pack() ttk.Button(self, text="Register", command=lambda:self.register_user()).pack() tk.Label(self, text="").pack() ttk.Button(self, text="Proceed to Login", command=lambda:[self.destroy_label(), controller.show_frame(Login)]).pack() tk.Label(self, text="").pack() ttk.Button(self, text="Return to Home", command=lambda:[self.destroy_label(), controller.show_frame(MainScreen)]).pack()
Figure 11: Sign Up Frame
Database The user’s username and password will be stored in the database in the format of the text file as shown in Figure 12.
22
Figure 12: Data base
Login Frame
● As shown in Figure 13, Users are required to fill in the personal information such as username and password to log in.
● After clicking the “Login” button, it will lead the user to “Application Frame”.
● The user may reset his/ her password by clicking the “Reset Password” button if he/she forgot his/her password.
● The user may return to the home page by clicking the “Return to Home” button.
Login frame Coding is as shown below: class Login(tk.Frame): def __init__(self, parent, controller): tk.Frame.__init__(self, parent) global username_verify global password_verify username_verify = tk.StringVar() password_verify = tk.StringVar() self.controller = controller self.logo = tk.PhotoImage(file=r'login.png') tk.Label(self, image=self.logo).pack() tk.Label(self, text="Please enter details below to login", font=("Bodoni MT", 25)).pack() tk.Label(self, text="").pack() tk.Label(self, text="Username", font=(10)).pack() self.username_entry = tk.Entry(self, textvariable=username_verify, width=40, borderwidth=5) self.username_entry.pack() tk.Label(self, text="Password", font=(10)).pack() self.password_entry = tk.Entry(self, textvariable=password_verify, show="*", width=40, borderwidth=5) self.password_entry.pack() tk.Label(self, text="").pack() ttk.Button(self, text="Login", command=lambda:[self.login_verify()]).pack() tk.Label(self, text="").pack() ttk.Button(self, text="Reset Password", command=lambda: controller.show_frame(Reset)).pack() tk.Label(self, text="").pack() ttk.Button(self, text="Return to Home", command=lambda:controller.show_frame(MainScreen)).pack() tk.Label(self, text="").pack()

23
Figure 13: Login Frame
Reset Password Frame
● The user may enter the new password to reset the password as shown in Figure 14.
Reset password frame Coding is as shown below:
class Reset(tk.Frame):
def __init__(self, parent, controller): tk.Frame.__init__(self, parent) global username2 global password2 username2 = tk.StringVar() password2 = tk.StringVar() self.logo = tk.PhotoImage(file=r'reset.png') logo_label = tk.Label(self, image=self.logo).pack() tk.Label(self, text="Please enter details below", font=("Bodoni MT", 30)).pack() tk.Label(self, text="").pack() tk.Label(self, text="Username", font=(10)).pack() self.username_entry = tk.Entry(self, textvariable=username2, width=40, borderwidth=5) self.username_entry.pack() tk.Label(self, text="Password", font=(10)).pack() self.password_entry = tk.Entry(self, textvariable=password2, show= "*", width=40, borderwidth=5) self.password_entry.pack() tk.Label(self, text="").pack() ttk.Button(self, text="Reset Password", command=lambda:self.reset_user()).pack() tk.Label(self, text="").pack() ttk.Button(self, text="Proceed to Login", command=lambda:[self.destroy_label(), controller.show_frame(Login)]).pack() tk.Label(self, text="").pack() ttk.Button(self, text="Return to Home", command=lambda:[self.destroy_label(), controller.show_frame(MainScreen)]).pack()

24
Figure 14: Reset Password Frame
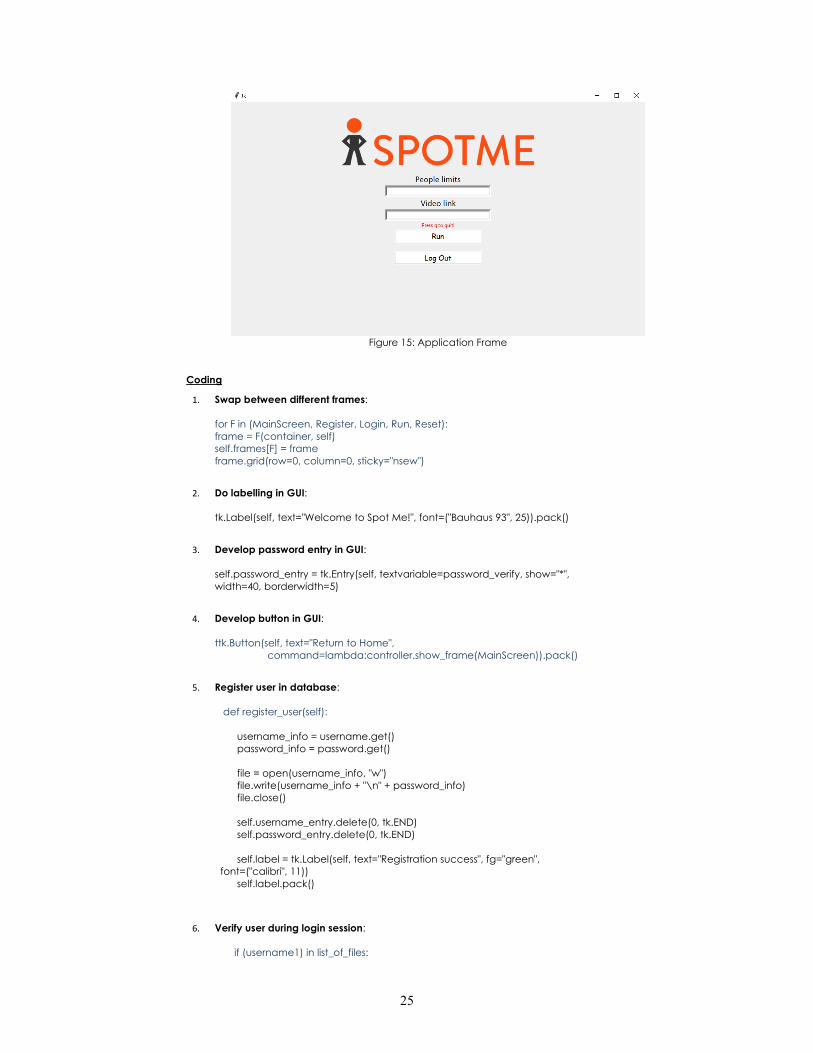
Application Frame
● To run the application, user must enter people limits indicating the maximum number of people are allowed to present in a shop as shown in Figure 15.
● The user also must enter the video link of the camera. This feature provides flexibility to the user where he can run the application even though he is not present in the shop.
● The user can click the “Logout” button to log out. Application frame Coding is as shown below:
class Run (tk.Frame): def __init__(self, parent, controller): tk.Frame.__init__(self,parent) global ppl_limits global video_links ppl_limits = tk.StringVar() video_links = tk.StringVar() self.logo = tk.PhotoImage(file=r'spotme.png') tk.Label(self, image=self.logo).pack() tk.Label(self, text="People limits", font=("Calibri", 15)).pack() tk.Entry(self, textvariable=ppl_limits, width=40, borderwidth=5).pack() tk.Label(self, text="Video link", font=("Calibri", 15)).pack() tk.Entry(self, textvariable=video_links, width=40, borderwidth=5).pack() tk.Label(self, text="Press q to quit!", fg="red").pack() ttk.Button(self, text="Run", command=self.onButton).pack() tk.Label(self, text="").pack() ttk.Button(self, text="Log Out", command=lambda:controller.show_frame(MainScreen)).pack() tk.Label(self, text="").pack() def onButton(self): limit = ppl_limits.get() video = video_links.get() string = "python people_counter.py -p mobilenet_ssd/MobileNetSSD_deploy.prototxt -m mobilenet_ssd/MobileNetSSD_deploy.caffemodel -l {} -i {} -o output/output_02.avi".format(limit, video) os.system(string)
25
Figure 15: Application Frame
Coding
1. Swap between different frames:
for F in (MainScreen, Register, Login, Run, Reset): frame = F(container, self) self.frames[F] = frame frame.grid(row=0, column=0, sticky="nsew")
2. Do labelling in GUI:
tk.Label(self, text="Welcome to Spot Me!", font=("Bauhaus 93", 25)).pack()
3. Develop password entry in GUI:
self.password_entry = tk.Entry(self, textvariable=password_verify, show="*", width=40, borderwidth=5)
4. Develop button in GUI:
ttk.Button(self, text="Return to Home", command=lambda:controller.show_frame(MainScreen)).pack()
5. Register user in database:
def register_user(self): username_info = username.get() password_info = password.get() file = open(username_info, "w") file.write(username_info + "\n" + password_info) file.close() self.username_entry.delete(0, tk.END) self.password_entry.delete(0, tk.END) self.label = tk.Label(self, text="Registration success", fg="green", font=("calibri", 11)) self.label.pack()
6. Verify user during login session: if (username1) in list_of_files:
26
file = open(username1, "r") verify = file.read().splitlines() if password1 in verify: self.controller.show_frame(Run) else: self.mylabel = tk.Label(self, text="Password not been recognised", fg="red", font=("calibri", 11)) self.mylabel.pack() self.mylabel2 = tk.Label(self, text="") self.mylabel2.pack() else: self.mylabel = tk.Label(self, text="Opps, user not found!", fg="red", font=("calibri", 11)) self.mylabel.pack() self.mylabel2 = tk.Label(self, text="")
self.mylabel2.pack()
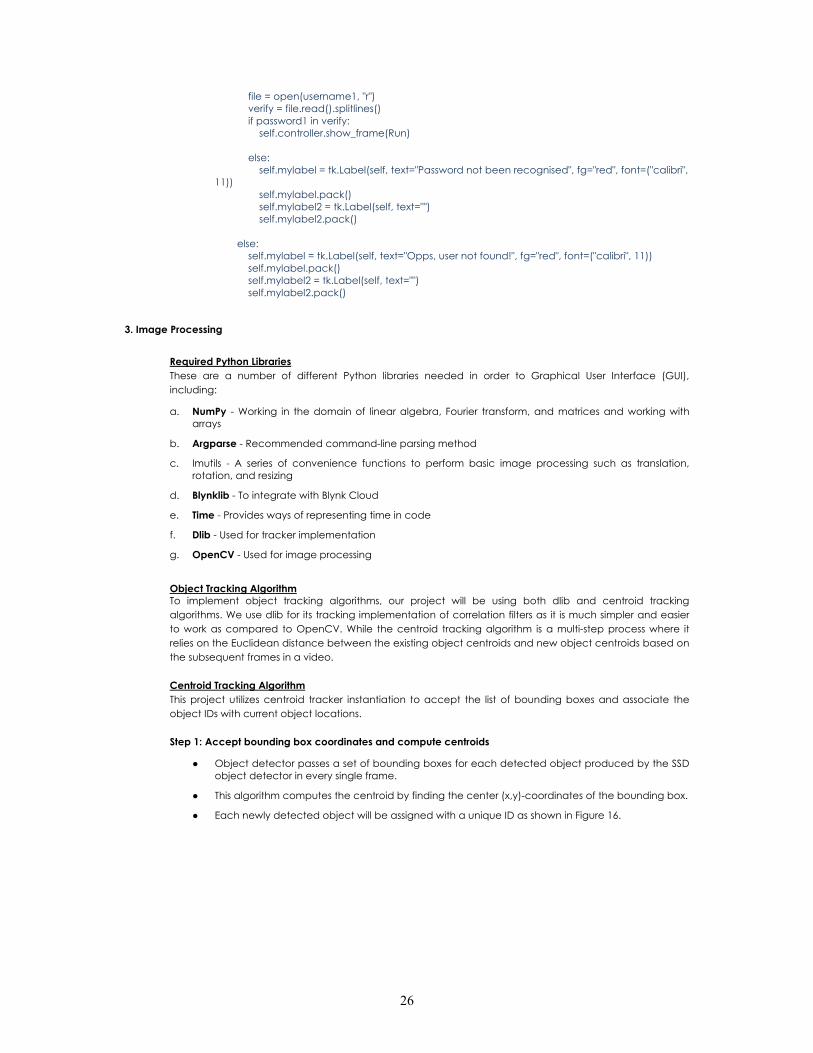
3. Image Processing
Required Python Libraries These are a number of different Python libraries needed in order to Graphical User Interface (GUI), including:
a. NumPy - Working in the domain of linear algebra, Fourier transform, and matrices and working with arrays
b. Argparse - Recommended command-line parsing method
c. Imutils - A series of convenience functions to perform basic image processing such as translation, rotation, and resizing
d. Blynklib - To integrate with Blynk Cloud
e. Time - Provides ways of representing time in code
f. Dlib - Used for tracker implementation
g. OpenCV - Used for image processing
Object Tracking Algorithm To implement object tracking algorithms, our project will be using both dlib and centroid tracking algorithms. We use dlib for its tracking implementation of correlation filters as it is much simpler and easier to work as compared to OpenCV. While the centroid tracking algorithm is a multi-step process where it relies on the Euclidean distance between the existing object centroids and new object centroids based on the subsequent frames in a video. Centroid Tracking Algorithm This project utilizes centroid tracker instantiation to accept the list of bounding boxes and associate the object IDs with current object locations. Step 1: Accept bounding box coordinates and compute centroids
● Object detector passes a set of bounding boxes for each detected object produced by the SSD object detector in every single frame.
● This algorithm computes the centroid by finding the center (x,y)-coordinates of the bounding box.
● Each newly detected object will be assigned with a unique ID as shown in Figure 16.

27
Figure 16: Bounding Boxes around object
Step 2: Compute Euclidean distance between new bounding boxes and existing objects
Figure 17: Distance between Centroids
Step 3: Update (x,y)-coordinates of existing objects
● The foundation assumption of the centroid tracking is the object will potentially move in between the subsequent frames.
● The main program builds the object tracker by associating the existing object centroids with input object centroids with minimum distances between them in subsequent frames as shown in the arrow lines in Figure 17.

28
Figure 18: Update Coordinates of Objects
Step 4: Register new objects
● The centroids without pair, as in Figure 18, will be registered as new objects in our list by: i. Assigning it with new objects ID ii. Storing the centroid of the bounding box coordinates for the new objects
● The process will then go back to step 2 and repeat the pipeline of steps for every frame in the video stream.
Figure 19: Assign IDs to Object
Step 5: Deregister old objects
● When an object has been lost or disappeared from the view for a total of N subsequent frames, we will deregister the old objects.
Dlib Correlation Tracker
Construct a dlib rectangle object from the bounding box coordinates and then start the dlib correlation tracker. Coding:
tracker = dlib.correlation_tracker() rect = dlib.rectangle(startX, startY, endX, endY)
tracker.start_track(rgb colour, rect)

29
Object Detection with Deep Learning & OPENCV
OpenCV is used for image processing functions, along with the deep learning object detector for people counting. The coding is shown below:
Step 1: Initialize the list of class labels MobileNet SSD was trained to detect
CLASSES = ["background", "aeroplane", "bicycle", "bird", "boat",
"bottle", "bus", "car", "cat", "chair", "cow", "diningtable", "dog", "horse", "motorbike", "person", "pottedplant", "sheep",
"sofa", "train", "tvmonitor"] Step 2: Load the serialized model from the disk
net = cv2.dnn.readNetFromCaffe(args["prototxt"], args["model"])
Step 3: Grab a reference to the video path
vs = cv2.VideoCapture(args["input"])
Step 4: Convert the frame to a blob and pass the blob through a network to obtain detection blob = cv2.dnn.blobFromImage(frame, 0.007843, (W, H), 127.5) net.setInput(blob)
detections = net.forward() Step 5: Filter out the weak results and those object does not belong to the “person” class by looping over the detected blob for i in np.arange(0, detections.shape[2]): # extract the confidence (i.e., probability) associated # with the prediction confidence = detections[0, 0, i, 2] # filter out weak detections by requiring a minimum # confidence if confidence > args["confidence"]: # extract the index of the class label from the # detections list idx = int(detections[0, 0, i, 1]) # if the class label is not a person, ignore it if CLASSES[idx] != "person":
continue

30
Identify a person is moving up or down
The object tracking algorithm computes the direction of a person by taking the difference between the y-coordinate value of the current centroid location and the mean of y-coordinates from all the previous centroid locations. The negative value indicates the ‘up’ direction while the positive value indicates the ‘down’ direction. The reason for taking the mean of all previous centroid locations is to ensure the direction tracking is more accurate and stable. We have to take the possibility of false prediction in direction counting into consideration. Coding: to = TrackableObject(objectID, centroid)
y = [c[1] for c in to.centroids] direction = centroid[1] - np.mean(y) to.centroids.append(centroid) if not to.counted:
if direction < 0 and centroid[1] < H // 2: totalUp += 1 to.counted = True
elif direction > 0 and centroid[1] > H // 2: totalDown += 1
to.counted = True
Writing to video with OPENCV
The main program draws some information on the frame for visualization:
● Object ID and the centroid of the object
● Up, Down, Present, and Status information
Coding:
text = "ID {}".format(objectID) cv2.putText(frame, text, (centroid[0] - 10, centroid[1] - 10), cv2.FONT_HERSHEY_SIMPLEX, 0.5, (0, 255, 0), 2) cv2.circle(frame, (centroid[0], centroid[1]), 4, (0, 255, 0), -1) info = [ ("Up", totalUp), ("Down", totalDown), ("Status", status), ] for (i, (k, v)) in enumerate(info): text = "{}: {}".format(k, v) cv2.putText(frame, text, (10, H - ((i * 20) + 20)),
cv2.FONT_HERSHEY_SIMPLEX, 0.6, (0, 0, 255), 2)
4. Blynk Normally, Blynk is a IoT platform that connects IoT devices such as microcontrollers to its smartphone application. Nevertheless, to send data through the Blynk platform, the set-up process is similar which consists of creating an account, adding projects, configuring modules, and obtaining the authentication token. For this project, only two modules that display values are needed, which is used to display the headcount and people limit. The auth token is needed to send and get data from the Blynk cloud. The interface of Blynk Application is shown below. To access the data, Blynk has HTTP RESTFul API that allows easy read and write values to/from pins of microcontrollers. The API is accessed through the link: http://blynk-cloud.com/auth_token/get/pin. The auth_token and pin are replaced by project token and pin.

31
Figure 20: Blynk connection set up
At the main program, the values are sent to Blynk using the Blynk library in Python named blynklib. A sample coding:
import blynklib BLYNK_AUTH = 'YeaI5w0Tqlrr4wfL3YdAZ_GcUqCYs9le' blynk = blynklib.Blynk(BLYNK_AUTH) blynk.run() blynk.virtual_write(0, value)
The BLYNK_AUTH defines the auth token of the account. The blynk.virtural_write() writes the value to the virtual pins defined.
5. Ngrok
The setup of Ngrok is simple as it only requires two commands. Only one command is needed to use it. After creating an account, an authentication token will be assigned. After downloading the application, the command: ngrok authtoken <AUTH_TOKEN> is used to install the auth token to the computer. To forward the local server to the internet, the command: ngrok http <link> is used. Figure 21 shows Ngrok running with the forwarded links.
Figure 21: Ngrok setup commands
6. Cloudflare Workers - Cors Proxy
Cloudflare Workers is used to set up a CORS Proxy. The code for the proxy can be found at appendix. The figure below shows the interface of Cloudflare Workers where the left is the code for the proxy. To use the proxy after deployment, append the link to be proxied to the following URL: https://ancient-lab-fced.egcapstone.workers.dev/?<link>. This proxy link is used in fetching the Blynk API as shown in Figure 22.

32
Figure 22: Cloudfire Workers deployment
7. Webpage
Github pages are created with repositories. To create a webpage, create an index.html file in the root directory of Github repository. The relevant css and javascript files are also located here. The index.html file contains the main HTML code of the webpage. Bootstrap 4 css framework is used for the styling of the webpage. For the data fetching and processing, the script is in a separate JavaScript file in a folder called js which also contains the styling scripts. Figure 23 shows the Github directory.
Figure 23: Github directory
For the data fetching, the JavaScript fetch function is used. A snippet of code is shown below:
fetch('URL').then(function(response){ return response.json(); }).then(function(data){ textLimit.textContent = data; }).catch(function(error){ console.log(error); }) The fetch() function fetches the JSON file, which is a type of data file from the URL provided. Next, the content of the json file is stored in a variable called ‘data’ and further processing can be done. In the

33
example above, the content of data is assigned to the text content of a class called ‘textLimit’. The view of the webpage is shown Figure 24. It contains a dummy shop name as the webpage is dedicated to a particular shop where the data for that shop will be displayed. It will show the head count, people limit and status after the user clicked the ‘Start Tracking’ button. It also contains a ‘about covid’ and ‘promotions’ sections as add-ons.
Figure 24: Sample of a shop’s Webpage
Product Testing and Evaluation The product can successfully detect humans that are within the sight of the ESP32-CAM camera module. It
can discern the direction of movement and subsequently keep a record of the number of people in the shop. The product also successfully sends the headcount data to cloud. The headcount limit is 1023 due to Blynk limitations, however it is sufficient for a small to medium business. Anyone with the link can access the data through the webpage in near real-time.
However, the product has some limitations where it cannot detect humans for every consecutive frame. This is because a deep learning detector is very computationally expensive, especially when the system is running on a personal computer (PC). It will greatly slow down the tracking process if the system runs the object detector on every frame. To avoid that, the solution is to speed up the tracking pipeline by skipping every N frame when processing the video. Hence, the product may miss some human detection and the percentage of error increases especially if there is a big crowd. The performance degrades in detecting the crowd. However, this constraint can be overcome or further optimized by implementing video stream decode in separate processing thread.
Impact Analysis
The impact of the product is analyzed from four different aspects, social, technological, economic and
political. The social impact is that our product helps to maintain social distancing by preventing overcrowding, at the same time promoting contactless service among customers. From a technological point of view, our product uses machine vision to detect humans, resulting in a more accurate detection of human movement. This is further enhanced by the real-time transmission of data that brings convenience to our user. This product is also economical, as it is mainly software based. The user has the flexibility to use any camera as the sensing device and run the software on any machine available to him/her. The use of this product would help shop owners to reduce manpower while reducing hardware and operating cost. The last aspect of politics, our product is a complement to MySejahtera App which is deployed by the Malaysian Government; therefore, this product is well aligned with the current situation.

34
Financials
The product received subsidies from the School of Electrical Engineering with a total amount of RM300.00. While the total expenses of the product only cost around RM100.00. The purchased items include 2 ESP32-Cam Module, 2 DC Power Supply Module with Breadboard and connecting wires. The low cost is because our product is mainly software-based, and we strive to lower the cost of our product by providing the flexibility of using any camera as input.
Conclusion
The product is successfully developed within the required time and budget. This product is able to satisfy the objectives of promoting contactless services and social distancing. This project helps business owners in saving human resources with repetitive work. Besides that, the product is able to improve visitors’ experience in reducing the queueing time before entering the shop. However, due to time constraints, we are unable to produce a very accurate product in detecting human appeared in the sight. Future works may include the addition of multi-camera support for human detection in a wider area. Acknowledgement The project is supported by the School of Electrical Engineering, Universiti Teknologi Malaysia. Some parts of the project components was financially supported by UTM Encouragement Grant PY/2019/02334.
References Adrian, R. (2018). OpenCV People Counter. https://www.pyimagesearch.com/2018/08/13/opencv-people-counter/ (Last accessed:
26 December 2020) Adrian, R. (2016). Writing to video with OpenCV. https://www.pyimagesearch.com/2016/02/22/writing-to-video-with-opencv/ (Last
accessed: 26 December 2020) Adrian, R. (2018). Simple object tracking with OpenCV. https://www.pyimagesearch.com/2018/07/23/simple-object-tracking-with-
opencv/ (Last accessed: 26 December 2020) Adrian, R. (2017). Object detection with deep learning and OpenCV. https://www.pyimagesearch.com/2017/09/11/object-
detection-with-deep-learning-and-opencv/ (Last accessed: 26 December 2020)
Creating a GitHub Pages site. Github Documentation. https://docs.github.com/en/free-pro-team@latest/github/working-with-github-pages/creating-a-github-pages-site (Last accessed: 12 January 2021)
Documentation. Ngrok. https://ngrok.com/docs (Last accessed: 12 January 2021)
Dumanskiy D. (n.d.). Blynk HTTP RESTful API. Blynk Documentation. https://blynkapi.docs.apiary.io/#reference/0/get-project (Last
accessed: 12 January 2021)
Nguyen, C. T., Saputra, Y. M., Van Huynh, N., Nguyen, N. T., Khoa, T. V., Tuan, B. M., ... & Ottersten, B. (2020). A comprehensive survey of enabling and emerging technologies for social distancing—Part I: Fundamentals and enabling technologies. IEEE Access, 8, 153479-153507.
Rob, W. (2020). CORS Anywhere. Github. https://github.com/Rob--W/cors-anywhere (Last accessed: 12 January 2021) Santos, R. (n.d.). ESP32-CAM Troubleshooting Guide: Most Common Problems Fixed. Random Nerd Tutorials.
https://randomnerdtutorials.com/esp32-cam-troubleshooting-guide/ (Last accessed: 12 January 2021)
World Health Organization. (Dec. 14, 2020). Timeline: WHO’s COVID-19 Response. https://www.who.int/emergencies/diseases/novel-coronavirus-2019/interactive-timeline (Last accessed: 11 January 2021)
Zibri. (2019). Cloudflare-Cors-Anywhere. Github. https://github.com/Zibri/cloudflare-cors-anywhere (Last accessed: 12 January 2021)
PROCEEDINGS OF ELECTRICAL ENGINEERING CAPSTONE SHOWCASE 2020 (EECS2020): SMART INFRASTRUCTURE
eISBN 978-967-2615-32-3
Smart Streetlight System
Robinson Kong
Tung Yeong Feng Nurul Nabilah binti Mohd Rizal
Arif Raihan Tanvir Amirjan Nawabjan*
School of Electrical Engineering, Universiti Teknologi Malaysia
Abstract: This capstone project introduces an automated streetlight system based on the Internet of Things (IoT) approach. The initiation of the design was done by analyzing the responses received from the community on their current streetlight system in their living area. This streetlight system combines few different smart approaches including timer, moisture and light detection function using sensors to turn on the streetlight on predetermined condition. Additionally, application called ‘Blynk’ which uses WIFI connection was used, enabling the remote monitoring of the streetlight system from anywhere in the world. The working prototype was successfully developed demonstrating the potential to be used in real application. Keywords: IoT; smart streetlight; sensors Introduction
Broken streetlight, slow response from the technician, and poor maintenance of the current streetlight system in neighborhoods in Malaysia created a need to an advanced and feasible solution. Streetlight system, which is smart, energy-efficient, and utilizes the Internet of Things (IoT) approach is crucial. The strong impact of this smart streetlight system can be seen especially on the social and economic aspect, where it can provide better public safety from improved streetlight maintenance and create faster response to reduce further damage of the system. Literature showed that streetlight system in Malaysia which uses HPSV bulbs has a failure rate of 15% [1]. Survey shows that in case of current streetlight failure, it took a week or two for technicians to come and fix it. Hence by introducing this smart streetlight system, the technician will be notified immediately. Which in turn will speed up the maintenance time. From economical aspect, this smart streetlight system is very energy efficient since it uses a solar panel as energy storage. Hence, reducing the cost of electricity consumption of the streetlight. In terms of the political aspect, it can reduce the accident and crime rates. Technology aspect, this smart streetlight system is considered new innovation in terms of automated features to detect streetlight failure. Finally, in terms of the environmental aspect, this streetlight system uses natural resources such as sunlight for sustainable development. Hence, the consumption of on-grid electricity from coal can be reduced which reduces the emission of greenhouse gases. The aspect considered was simplified and shown in Table 1.
Table 1: The STEEP analysis of the developed prototype
Aspect Discussion
Sociological Improving the safety of the public
Technological New innovation in terms of automated feature to detect failure
Economic Long term cost effectiveness
Environmental Use natural resources for sustainability development
Political Reduces the accident and crime rates
Conceive-Design-Implement-Operate Approach Conceiving
The design was started by collecting a quick survey on the community to get information about the
streetlight system that is currently available in their neighborhood. The survey showed that the most important factor
36
considered is the safety purposes, because in a dark area it is very hard to be alert toward the surroundings and burglary can happen anytime. Through the survey, the community also suggested a few improvements that can be added to the current streetlight system including (1) to use natural resources such as sunlight so that it is more energy-efficient, (2) A system where the streetlight technicians can be notified automatically when the streetlight failed and (3) An automated streetlight system that turns on based on certain conditions.
From the survey done, it can be concluded that the current streetlight system has some limitations since it is a manual system which leads to delays in repairing faulty lights. To solve this problem our group proposes a streetlight system that utilizes the Internet of Things (IoT) approach. This includes implementing a timer function to turn on the streetlight automatically during nighttime (7pm – 7am), a moisture and light detection function that turns on the streetlight when the surroundings become dark during rainy day. The design also comes with an application that is connected to the streetlight system that can send a notification to the technicians immediately for quick maintenance action.
Designing
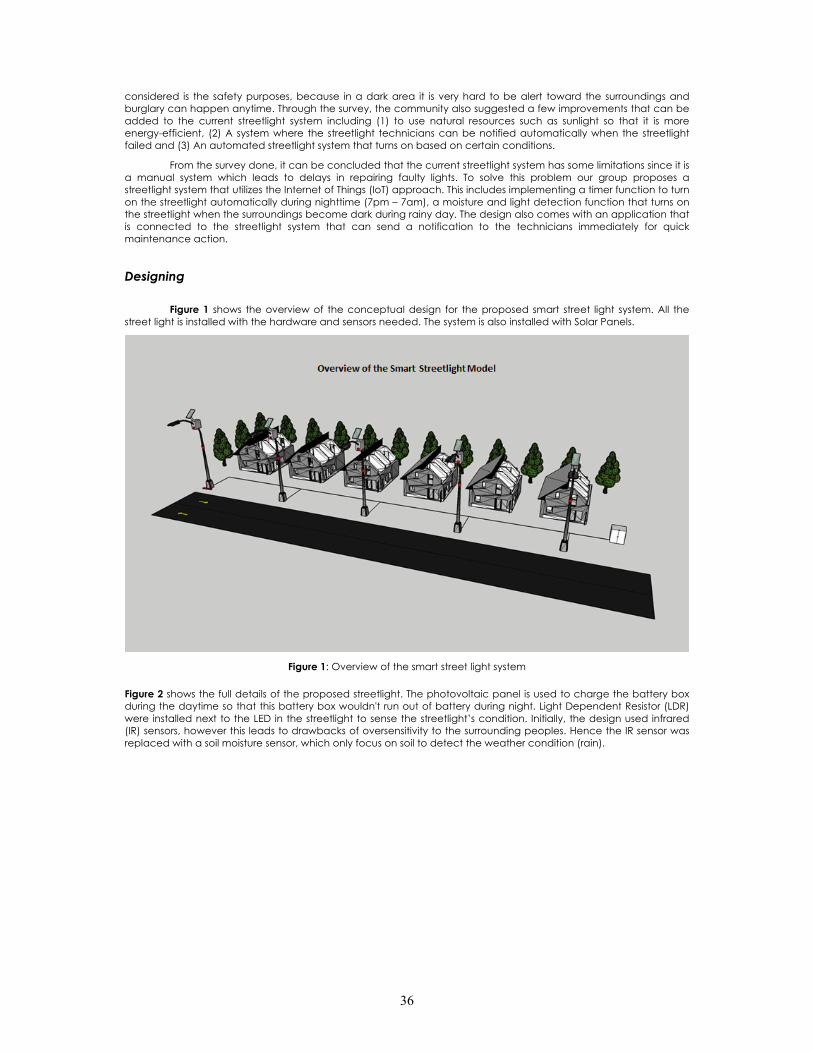
Figure 1 shows the overview of the conceptual design for the proposed smart street light system. All the street light is installed with the hardware and sensors needed. The system is also installed with Solar Panels.
Figure 1: Overview of the smart street light system
Figure 2 shows the full details of the proposed streetlight. The photovoltaic panel is used to charge the battery box during the daytime so that this battery box wouldn't run out of battery during night. Light Dependent Resistor (LDR) were installed next to the LED in the streetlight to sense the streetlight’s condition. Initially, the design used infrared (IR) sensors, however this leads to drawbacks of oversensitivity to the surrounding peoples. Hence the IR sensor was replaced with a soil moisture sensor, which only focus on soil to detect the weather condition (rain).

37
Figure 2: Details of a smart street light
To further simplify and speed up the works of the maintenance technician, maintenance box as shown in Figure 3 was also designed. The maintenance box comprises of Mega 2560 (CH340) and ESP 8266 WiFi module.
Figure 3: Maintenance box.
In this smart street light system, 5 main components which are Mega 2560, ESP8266-01 WiFi module, soil moisture sensors, LDR and LEDs was used. Figure 4 shows the schematic circuit for the solar system. Solar panel is used as the power source. During daytime, TP4056 battery charger is powered on and charges the lithium battery. Due to the voltage to power on the Mega 2560 board is 5V, the output voltage from TP4056 needs to be boosted to 5V.

38
Figure 4: The schematic circuit for solar system
Each LDR in the Figure 5 was used to detect the light intensity from the particular source. The LDR connected to A5 is used to detect the surrounding light intensity and the other two is used to detect the LED light intensity. ESP8266-01 WiFi module is used to connect the Mega 2560to the Internet as the board itself doesn't have a built-in WiFi module.
Figure 5: The schematic circuit for the system
Figure 6 shows the flowchart of the smart street light system. The system was designed so that the streetlight will turn on based on two condition. In first condition, the streetlight will turn on between 7PM to 7AM. In second condition, whenever there are during heavy rain that leads to poor visibility and dark surrounding, street light will be turned on. This will help the people by providing better visibility during rainy days, especially when the surrounding becomes cloudy and dark. Besides, this system also has an automated notification feature. It will automatically notify the technicians when the street light is broken/faulty.

39
Figure 6: Flowchart of smart streetlight Implementing
Figure 7 shows the prototype developed in this project. Prototype consist of two streetlights with one soil moisture sensor installed in each streetlight. The solar station provides input power for the street light, which is installed with full solar panels system.
Figure 7: Prototype of smart streetlight
Blynk was used as the software application to observe the system. The data obtained from the board was
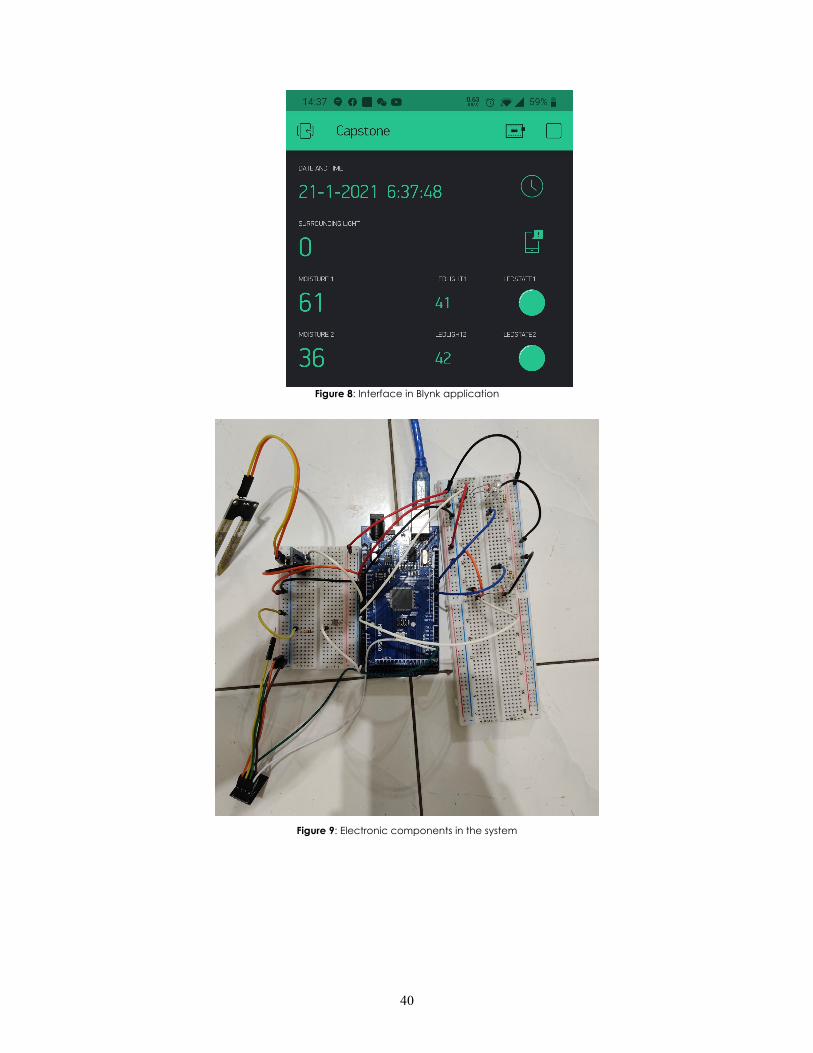
uploaded into Blynk server and observed through the application. The user interface is shown in Figure 8. Using this application, the technician can check the condition of streetlight from time to time.
40
Figure 8: Interface in Blynk application
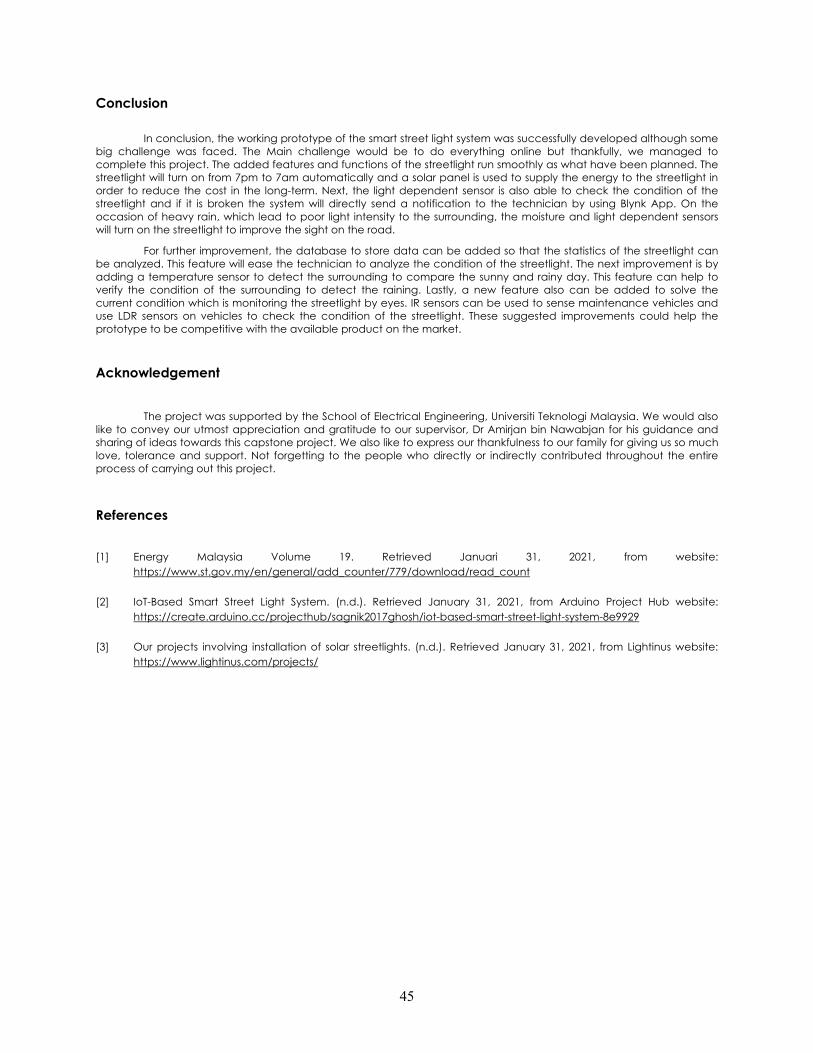
Figure 9: Electronic components in the system

41
Table 2: The pins connection of electronic components
Mega 2560 Pin Number Component Pin
A7 Soil moisture sensor 1
A8 Soil moisture sensor 2
TX1 ESP8266-01 RX PIN
RX1 ESP8266-01 TX PIN
A5 LDR (Surrounding light)
A0 LDR (LED1)
A15 LDR (LED2)
D11 LED1
D31 LED2
Figure 9 shows the electronic connection used in the system. As mentioned before, 5 main components which are Mega 2560, ESP8266-01 WiFi module, soil moisture sensors, LDR and LEDs was used for this prototype development. The connection with other hardware is shown in Table 2.
Operating
The streetlight is automatically turned on from 7PM to 7AM, as shown in Figure 10. The light was turned on at
6:59AM. The streetlight will then turn off automatically when it is 7:00AM.
Figure 10: Street light turn on at 6:59AM
Moreover, the light will also turn on during rainy days, and the light intensity is low. This weather condition
only occurs during heavy rain. The moisture value above 45 means the soil is being moistened and the light intensity is 11 only which is very low. Hence, the streetlight is being turned on.

42
Figure 11: Street light turn on during heavy rain
All the streetlight was flagged with different identity for the identification purpose. By using this flag, using if
else condition, condition of the streetlight can be checked either it is in good condition, or faulty. When the LED is turned on, the LDR value is usually around 50. If the value detected drops below 20, it means that the street light LED is broken/faulty. Hence the virtual LED will turn RED as shown in Figure 12, and notification will be sent to the technician for further action.
Figure 12: Automated notification

43
Result and Analysis
At the beginning of the project, data regarding issues on streetlight from different people was collected through the survey conducted. The problems that faced by the user was identified, and solution was proposed accordingly. Hence, the developed prototype was based on the problems faced by people. The smart streetlight was designed to solve problems regarding the needs. The problems, needs and effective solutions are tabled below.
Table 3: Problems, solutions.
Problems and needs Solution
· Breaking into houses. · Streetlight so that people can see if there is any unwanted person near the house.
· Streetlight that will operate even if there is a power cut.
· Solar panel
· Unfixed streetlight for days. · Smart streetlight that will detect faulty lighting.
· During heavy rain, the streets become dark.
· Light turns on when there is high moisture in the surrounding environment.
· Technician does not know if there is a broken streetlight.
· Automated Iot based street light that sends notification on damaged light.
Based on the problems and needs, the prototype was designed and tested. For the first problem stated the smart streetlight is a good solution to have a durable light that will turn on automatically at night. An effective solution to the power cut is using a solar panel to power the lights. And the streetlight is connected to a cloud that will eventually send notification to the authority if there is failure. Overall, the smart streetlight is well effective in solving the problems stated.
Innovation
A comparison study was done to compare developed prototype with other similar products in terms of the features and innovativeness. Table 4 lists the comparison of the developed prototype with available similar products. There are four projects that are being analysed which are IoT-Based Smart Street Light, Automatic Street Light, DIY Smart LED Street Light and Solar Street Light. From the table, some of the features are the same but the products are costlier than the developed prototype. Our prototype provides the same features such as using solar panels but with affordable price.

44
Table 4: Comparison with similar products
Projects IoT-Based Smart Street Light System Lightinus Smart Street Light Developed prototype
Features
Automatic switching Solar to utilize energy from sun Turn on from 7pm to 7am
automatically
Maintenance cost reduction Latest LED light technology Solar panel system
Energy saving Kinetic to capture energy from
footsteps Moisture and light intensity
Reduction of manpower Remote management control Checking the condition of the
street light
Wireless communication Motion sensor to optimizing light
performance based on motion detection
Send notification of the broken street light
and connected to Blynk App
45
Conclusion
In conclusion, the working prototype of the smart street light system was successfully developed although some big challenge was faced. The Main challenge would be to do everything online but thankfully, we managed to complete this project. The added features and functions of the streetlight run smoothly as what have been planned. The streetlight will turn on from 7pm to 7am automatically and a solar panel is used to supply the energy to the streetlight in order to reduce the cost in the long-term. Next, the light dependent sensor is also able to check the condition of the streetlight and if it is broken the system will directly send a notification to the technician by using Blynk App. On the occasion of heavy rain, which lead to poor light intensity to the surrounding, the moisture and light dependent sensors will turn on the streetlight to improve the sight on the road.
For further improvement, the database to store data can be added so that the statistics of the streetlight can be analyzed. This feature will ease the technician to analyze the condition of the streetlight. The next improvement is by adding a temperature sensor to detect the surrounding to compare the sunny and rainy day. This feature can help to verify the condition of the surrounding to detect the raining. Lastly, a new feature also can be added to solve the current condition which is monitoring the streetlight by eyes. IR sensors can be used to sense maintenance vehicles and use LDR sensors on vehicles to check the condition of the streetlight. These suggested improvements could help the prototype to be competitive with the available product on the market.
Acknowledgement
The project was supported by the School of Electrical Engineering, Universiti Teknologi Malaysia. We would also like to convey our utmost appreciation and gratitude to our supervisor, Dr Amirjan bin Nawabjan for his guidance and sharing of ideas towards this capstone project. We also like to express our thankfulness to our family for giving us so much love, tolerance and support. Not forgetting to the people who directly or indirectly contributed throughout the entire process of carrying out this project.
References [1] Energy Malaysia Volume 19. Retrieved Januari 31, 2021, from website:
https://www.st.gov.my/en/general/add_counter/779/download/read_count [2] IoT-Based Smart Street Light System. (n.d.). Retrieved January 31, 2021, from Arduino Project Hub website:
https://create.arduino.cc/projecthub/sagnik2017ghosh/iot-based-smart-street-light-system-8e9929
[3] Our projects involving installation of solar streetlights. (n.d.). Retrieved January 31, 2021, from Lightinus website: https://www.lightinus.com/projects/

PROCEEDINGS OF ELECTRICAL ENGINEERING CAPSTONE SHOWCASE 2020 (EECS2020): SMART INFRASTRUCTURE
eISBN 978-967-2615-32-3
IoT-based Health Monitoring Device for Smart Healthcare Infrastructure
Muhamad Amirul Hakimi bin Ramli Muhamad Fadhli bin Mohamed
Ng Soo Tin Wong Kin Joe
Eileen Su Lee Ming School of Electrical Engineering,
Faculty of Engineering, Universiti Teknologi Malaysia
Abstract: This project aims at developing an IoT-based point-of-care health monitoring device for smart healthcare infrastructure. The device is envisioned to help the community have easier access to specialist consultation, obtain earlier screening, improve the overall efficiency of healthcare delivery through decentralization of healthcare services and to facilitate the telemedicine infrastructure in Malaysia, especially for the rural areas. This device could monitor 4 standard patient parameters, which are ECG, SpO2, HR, and TEMP. The patient data is then stored in the cloud for further analysis. The IoT feature allows the data to be accessed from any computer or mobile phones for faster interpretation.
Keywords: Smart Infrastructure, IoT, Health Monitoring Device, Healthcare Infrastructure, Telemedicine Infrastructure, Telehealth Infrastructure
Introduction
Despite the fast advancement in healthcare facilities and expertise, in many parts of the world, the people living in the rural areas are left out from accessing these medical facilities, services and specialized help. In Malaysia for example, basic clinics are set up in the smaller villages but these clinics still lack specialized healthcare experts, medical equipment as well as preventative care and treatment programs. The lack of specialized medical facilities in a rural area caused delayed treatment and often led to heightened severity of cases, including deaths. The long-distance travel, and its associated costs, from the rural area to a city hospital also discouraged the rural community to seek timely help and access medical services before their symptoms got worse.
One of Malaysia's health service goals is to provide care and services at home or close to home settings and community centers, especially in rural areas. Technological progress achieved in telemedicine, communication systems and multimedia network made it possible to extend the benefits of modern health infrastructure to deliver virtual services for the rural communities [1], without too much increase in resources and relative costs. Health infrastructure can be defined as the physical structures, supporting systems and services that constitute the fundamental operating platform needed to provide care. Smart healthcare infrastructure is accomplished through the evolvement of telemedicine that connects the medical services to commercial gadgets to facilitate an unprecedented range of accessibility. With the advancement of IoT technologies, we can now monitor a patient's health in real-time, out of hospital settings on a telemedicine platform [2]. Telemedicine, also known as telehealth, is the remote delivery of healthcare services that allows us to efficiently deliver consultations, send data or diagnostic reports and even monitor patient’s condition with improved service quality, especially for rural areas, at a fraction of the costs as compared to conventional methods [3].
Hence, the main focus of this project was to develop an internet-of things (IoT)-based health monitoring device that can provide point-of-care (POC) services for people living in the rural areas. In this project, the developed POC health monitoring device will form the data acquisition node within a smart healthcare infrastructure that can be used to acquire patient data and store, then transmit, patient data in the cloud server. The potential is huge - the data can be accessed from anywhere in the world; specialist consultations can be given promptly and even automated analysis using artificial intelligence algorithm can be deployed on the cloud for faster pre-screening. However, to enjoy the optimum benefits from IoT and the telemedicine health platfoms, the area must at least have internet connectivity. In Malaysia, most areas have cellular communication towers that can be used for this purpose although more extensive network coverage is still needed.

47
1.2 Conceive-Design-Implement-Operate
The project implementation followed the Conceive-Design-Implement-Operate (CDIO) approach. To conceive the right direction for the project, a survey was conducted to gauge the needs among our student peers with regards to health devices. From the research finding, we found out that fever is a common symptom of many infectious diseases such as COVID-19, Dengue, Ebola, gastroenteritis, HIV and influenza as body temperature is an early warning sign of infection. However, a good loT based health monitoring device should include four standard parameters which are body temperature, heart rate, oxygen saturation, and electrocardiograph (ECG signal graph). We decided to include temperature monitoring and other standard patient parameters in our project. Additionally, we include telemedicine feature to allow healthcare providers to evaluate, diagnose and treat patients without the need for an in-person visit.
Next, in the design stage, the requirements for the project were taken in to account to deliver the conceptual prototype as shown in Figure 1. A STEEP analysis was also done to assess the impact and risk of the project.
Figure 1: Concept sketch of the IoT-based Health Monitoring Device
The engineering design specifications of mechanical, electrical and software are listed below:
1. The mechanical design of the casing was based on three main factors, durability, functionality and optimization. The edges of the casing are curved so that when it fell, the impact will be lower, reducing the probability of the casing to break.
2. The placement of the sensors, OLED display, and charger port was organized by considering user-behaviour and neatness.
3. The size was kept optimal to avoid material and space wastage.
4. In terms of electronic capabilities, the sampling rates of patient data was set to 250Hz for ECG reading and 1Hz for temperature, oxygen saturation, and heart rate readings.
5. The display on the OLED screen was divided into four portions to show the four patient data.
6. On the Ubidots dashboard that can be accessed from the web, 4 widgets are used to display the four patient data at one glance.
The mechanical casing (Figure 2) was designed in Tinkercad software. To produce the casing, we used the stl
file from Tinkercad design and then, printed the casing using a 3D printer with filament pla 1.75mm as the material. Total of the time taken to print all the parts was almost 24 hours and the total weight of the casing was 190g. Ultimaker Cura 4.8 software to identify the time that needs to be printed and the weight of the product. After the casing was printed, all the parts was assembled. The final product is shown in Figure 3.

48
(a) (b) Figure 2: The 3D drawing of the casing (a) side view and (b) front view
Figure 3: Final product of the casing
The electrical part consists of all the electronic components which is the sensor, microcontroller, breadboard and OLED display, as shown in Figure 4. For this project, there are three sensors that need to be used, which is a pulse oximeter sensor (MAX30100) to measure oxygen saturation, a temperature sensor (MLX90614) to measure body temperature and an ECG sensor (AD8232) to detect electrocardiograph. Instead of using node MCU ESP8266, we choose to use the ESP32 model because it has a faster Wi-Fi connection, a CPU core, more GPIOs, and supports Bluetooth. It also features touch-sensitive pins, a built-in hall effect sensor and a temperature sensor. To display all the data that has been read from the sensor, OLED displays are used. Figure 5 shows the schematic diagram connecting all the electronic parts and the circuit is shown in Figure 6.
(a) Node MCU (b) Pulse oximeter (c) ECG sensor (d) Temperature sensor
Figure 4 Sensors in the IoT-based health monitoring device.

49
Figure 5: The schematic diagram for the device
Figure 6: Electronic components in the system
The software algorithm for the prototype was divided into two portions, which are using Arduino Integrated Development Environment (IDE) and Ubidots IoT platform. The flow of the algorithm is shown in Figure 7. For the setup using the Arduino code, at first, we need to set 115200 data rate in bits per second (baud) for high-speed serial data transmission [4]. All the connection pins were configured to behave either as an input or an output. In order to use the I2C sensors, the Wire library was initialized and the I2C bus was joined as a master or slave [5], [6]. After the WiFi connection was established, we established a connection between the microcontroller and the Ubidots server. All the sensors must be initialized to begin their readings continuously.
The ECG reading was uploaded continuously to the Ubidots and also the OLED display to display a continuous ECG graph [7]. The readings for pulse oximeter, heart rate and temperature were set to be uploaded at lower frequency every 1 second continuously to the Ubidots and also the OLED for display. This Arduino code was uploaded to the NodeMCU ESP32 microcontroller via the Arduino IDE to conduct all the required tasks as mentioned. We send or retrieve data from our hardware devices using Ubidots protocol called MQTT [8], [9]. MQTT is a subscribe / publish messaging protocol to receive the sensor data sent by the hardware or sending the message from Ubidots to hardware for controlling the hardware. With MQTT, the device will "listen" to the cloud and be alerted only when the variable changes. The data moves between the computer and the cloud only when needed. A data point or "dot" is generated every time a device updates a sensor value in the variable. Ubidots stores dots that come from our devices inside variables and these stored dots have corresponding timestamps. Timestamp used to track the dots' time of the received data from the hardware of seconds running.

50
Figure 7: Flowchart of IoT-based health monitoring device
1.3 Result and Analysis
The final product of this IoT-based health monitoring device is shown in Figure 8. The operation of this IoT-based health monitoring device depends on the availability of power supply and WiFi hotspot. This device is designed to be used anywhere and anytime whenever the users want, provided that they have WiFi connectivity.

51
Figure 8: Final look of the prototype
To use the device, the user would attach the ECG electrodes on the body and the pulse oximeter would be clipped on the finger. In order to ensure that all the electrode attachments are correct, the person can observe the OLED display screen of the device to check whether the sensor reading is transmitting correctly. Since the temperature sensor is an infrared thermometer for non-contact temperature measurements, the temperature sensor only needed to be placed near to the user’s skin to get an accurate temperature reading. This device will start to keep reading all the sensors’ data consistently until the power supply is turned off.
While reading all the sensors’ data continuously, this device will also upload the data onto the Ubidots IoT platform and also the OLED display screen. The sensors’ data will be kept and stored on this platform continuously for every single data point. The user and the related authorities such as the hospital, doctor and the user’s family members can be given access to log into the Ubidots personal account to monitor the ECG graph and other sensors’ data, which are being published on the Ubidots Dashboard. So now, the guardians and clinicians can even help to monitor the health condition of the user from time to time remotely using this device.
The OLED display, UBIDOTS dashboard and various notifications are shown in Figure 9 to Figure 13. When the patient data reading is abnormal as shown in Table 1.1, the cloud server will send immediate notification during the first moment of emergency. From the event logs in Ubidots as shown in Figure 1.11, the immediate notifications are sent through email and SMS as shown in Figure 12 and Figure 13 respectively, so that immediate help can be rendered to the user.
Table 1: Abnormal Readings from sensors
Sensors Abnormal Readings
Heart Rate, HR (bpm) less than 60 bpm or more than 100 bpm
Oxygen Saturation Level, SpO2 (%) less than 80%
Temperature, TEMP (°C) greater or equal to 37.6°C
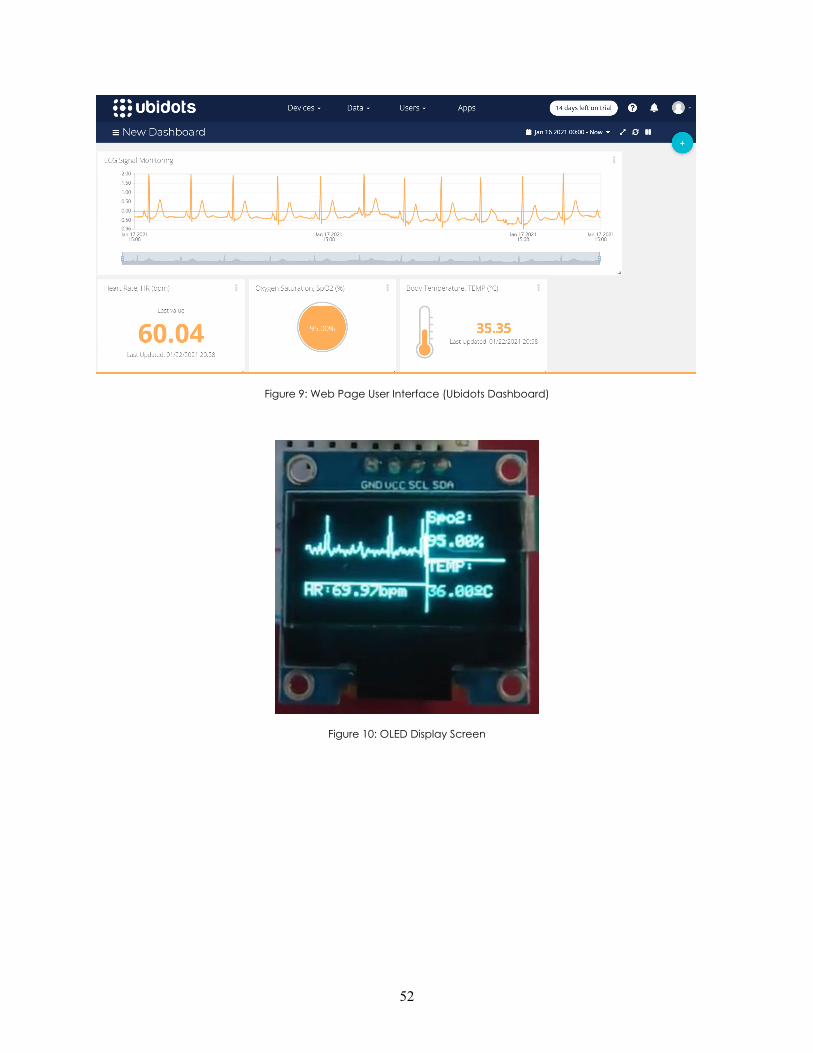
52
Figure 9: Web Page User Interface (Ubidots Dashboard)
Figure 10: OLED Display Screen

53
Figure 11: Event Logs in Ubidots
Figure 12: Email notification from Ubidots

54
Figure 13: SMS notification from Ubidots
1.4 Conclusion
Our POC prototype has worked successfully to acquire patient data, transmit and display data to the Ubidots web platform and to acquire immediate notification when the patient data is out of normal range. However, the performance and quality of this device still needs much improvements, particularly in terms of product reliability and sensor accuracy. The IoT-based health monitoring device was designed as a point-of-care device for smart healthcare infrastructure. With the implementation of telemedicine infrastructure in rural and remote areas, the remote community would have easier, faster and more economical access to specialized consultation as they no need to travel a very long distance to city hospitals to receive care. Doctors could access the data from the cloud and they are able to track the historical patient data. This could help them in diagnosing diseases based on symptoms at an early stage before the disease develops in severity. It is hoped that in the very near future, the healthcare organisations can achieve telemedicine operability, especially for the rural areas.
Acknowledgment
The project is partly supported by the School of Electrical Engineering, Universiti Teknologi Malaysia.
1.6 References
[1] Mat Som, Mohd Hanafi & Norali, Ahmad Nasrul & Ali, Megat. (2010). Telehealth in Malaysia—An overview. 10.1109/ISIEA.2010.5679384.
[2] Usha rani, Shola & Ignatious, Antony & Hari, Bhava & Balavishnu, V. (2017). Iot Patient Health Monitoring System. Indian Journal of Public Health Research & Development. 8. 1329. 10.5958/0976-5506.2017.00519.8.
[3] Sathya, M. & Madhan, S. & Jayanthi, K.. (2018). Internet of things (IoT) based health monitoring system and challenges. International Journal of Engineering and Technology(UAE). 7. 175-178. 10.14419/ijet.v7i1.7.10645.
[4] "EVERYTHING YOU NEED TO KNOW ABOUT ARDUINO CODE", Retrieved from https://www.circuito.io/blog/arduino-code/#:~:text=What%20language%20is%20Arduino%3F,and%20compiled%20to%20machine%20language.
[5 "ESP32 - I2C Scanner using Arduino IDE (working)", Retrieved from https://www.esp32.com/viewtopic.php?t=4742
[6] "ESP32 I2C Communication: Set Pins, Multiple Bus Interfaces and Peripherals (Arduino IDE)", Retrieved from https://randomnerdtutorials.com/esp32-i2c-communication-arduino-ide/
[7] “IoT based Low-cost ECG & Heart monitoring system with ESP32 and Ubidots Platform”, Retrieved from https://electronicsinnovation.com/iot-based-low-cost-ecg-heart-monitoring-system-with-esp32-and-ubidots-platform/
[8] "Connect a NodeMCU ESP8266 to Ubidots over MQTT", Retrieved from https://help.ubidots.com/en/articles/513324-connect-a-nodemcu-esp8266-to-ubidots-over-mqtt
[9] “Ubidots Basics: Applications, Organizations, and Users Explained” viewed 4 December 2020 https://help.ubidots.com/en/articles/887328-ubidots-basics-applications-organizations-and-users-explained
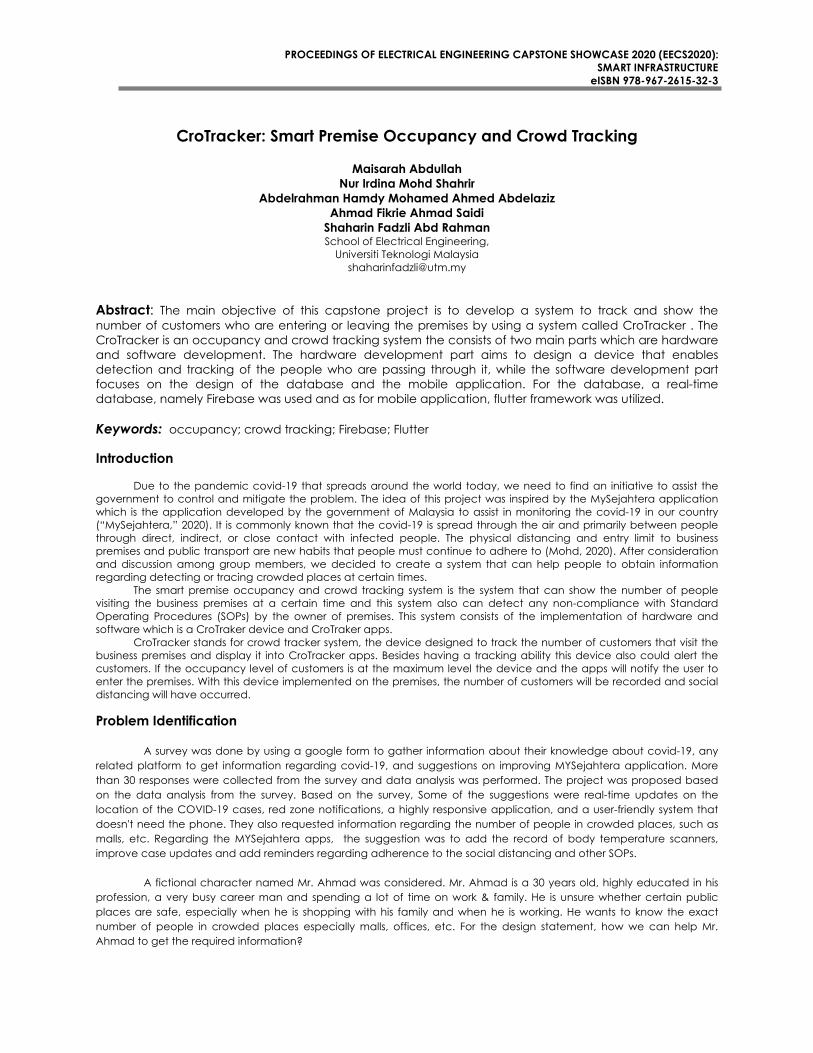
PROCEEDINGS OF ELECTRICAL ENGINEERING CAPSTONE SHOWCASE 2020 (EECS2020): SMART INFRASTRUCTURE
eISBN 978-967-2615-32-3
CroTracker: Smart Premise Occupancy and Crowd Tracking
Maisarah Abdullah Nur Irdina Mohd Shahrir
Abdelrahman Hamdy Mohamed Ahmed Abdelaziz Ahmad Fikrie Ahmad Saidi
Shaharin Fadzli Abd Rahman School of Electrical Engineering,
Universiti Teknologi Malaysia [email protected]
Abstract: The main objective of this capstone project is to develop a system to track and show the number of customers who are entering or leaving the premises by using a system called CroTracker . The CroTracker is an occupancy and crowd tracking system the consists of two main parts which are hardware and software development. The hardware development part aims to design a device that enables detection and tracking of the people who are passing through it, while the software development part focuses on the design of the database and the mobile application. For the database, a real-time database, namely Firebase was used and as for mobile application, flutter framework was utilized. Keywords: occupancy; crowd tracking; Firebase; Flutter Introduction
Due to the pandemic covid-19 that spreads around the world today, we need to find an initiative to assist the government to control and mitigate the problem. The idea of this project was inspired by the MySejahtera application which is the application developed by the government of Malaysia to assist in monitoring the covid-19 in our country (“MySejahtera,” 2020). It is commonly known that the covid-19 is spread through the air and primarily between people through direct, indirect, or close contact with infected people. The physical distancing and entry limit to business premises and public transport are new habits that people must continue to adhere to (Mohd, 2020). After consideration and discussion among group members, we decided to create a system that can help people to obtain information regarding detecting or tracing crowded places at certain times.
The smart premise occupancy and crowd tracking system is the system that can show the number of people visiting the business premises at a certain time and this system also can detect any non-compliance with Standard Operating Procedures (SOPs) by the owner of premises. This system consists of the implementation of hardware and software which is a CroTraker device and CroTraker apps.
CroTracker stands for crowd tracker system, the device designed to track the number of customers that visit the business premises and display it into CroTracker apps. Besides having a tracking ability this device also could alert the customers. If the occupancy level of customers is at the maximum level the device and the apps will notify the user to enter the premises. With this device implemented on the premises, the number of customers will be recorded and social distancing will have occurred. Problem Identification
A survey was done by using a google form to gather information about their knowledge about covid-19, any related platform to get information regarding covid-19, and suggestions on improving MYSejahtera application. More than 30 responses were collected from the survey and data analysis was performed. The project was proposed based on the data analysis from the survey. Based on the survey, Some of the suggestions were real-time updates on the location of the COVID-19 cases, red zone notifications, a highly responsive application, and a user-friendly system that doesn't need the phone. They also requested information regarding the number of people in crowded places, such as malls, etc. Regarding the MYSejahtera apps, the suggestion was to add the record of body temperature scanners, improve case updates and add reminders regarding adherence to the social distancing and other SOPs.
A fictional character named Mr. Ahmad was considered. Mr. Ahmad is a 30 years old, highly educated in his
profession, a very busy career man and spending a lot of time on work & family. He is unsure whether certain public places are safe, especially when he is shopping with his family and when he is working. He wants to know the exact number of people in crowded places especially malls, offices, etc. For the design statement, how we can help Mr. Ahmad to get the required information?

56
System Design
The proposed solution for Mr. Ahmad’s problem was premises crowd occupancy recording by a system called CroTracker. The CroTracker functions to count people coming in and out of the premises and send the data to a cloud database which is a firebase. Then, the user will get the notification from their CroTracker app on the phone. Figure 1 shows the block diagram of the overall system. Nodemcu and sensor are used to detect the entry and exiting of the premise’s customers. The overall flow of system operation is shown in Figure 2.
Figure 1: Design of CroTracker system
Figure 2: Flow of system operation
The circuit schematic of this detection system is shown in Figure 3. The system is powered by a 5 V battery supply. The connected LED blinks when the number of customers reached the set maximum number. The casing of the detector system was designed, Figure 4 shows the concept sketch of the detector system.
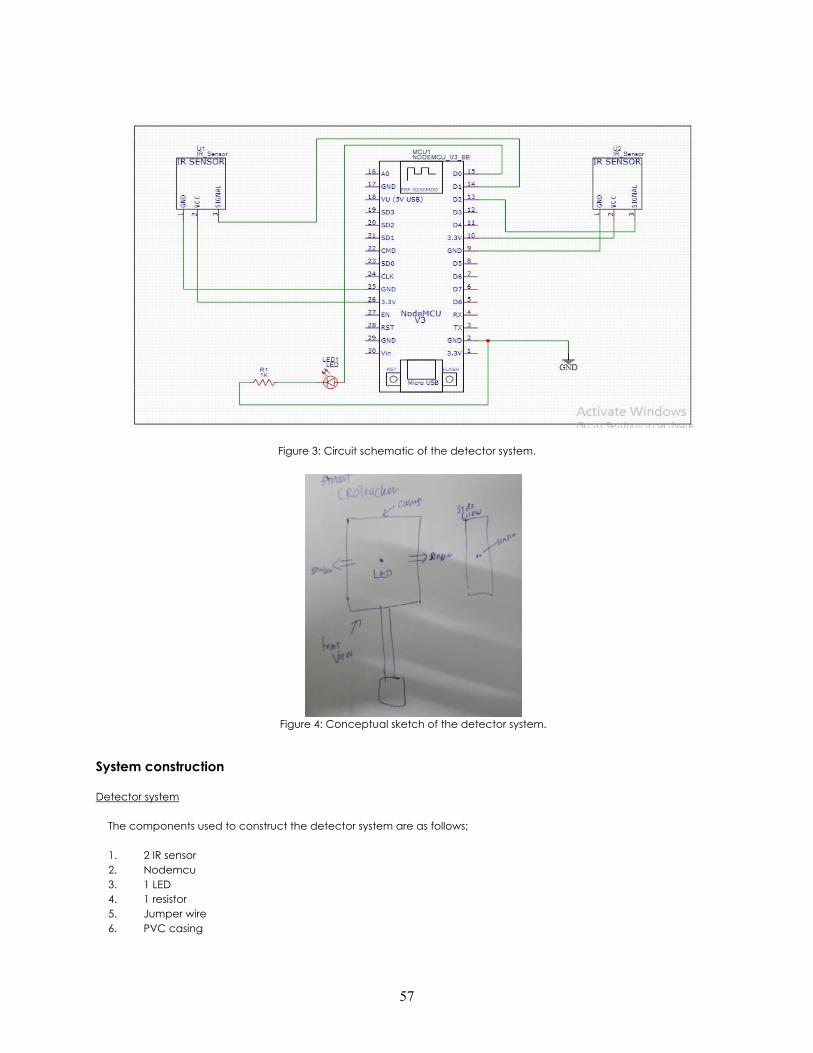
57
Figure 3: Circuit schematic of the detector system.
Figure 4: Conceptual sketch of the detector system.
System construction Detector system
The components used to construct the detector system are as follows; 1. 2 IR sensor 2. Nodemcu 3. 1 LED 4. 1 resistor 5. Jumper wire 6. PVC casing
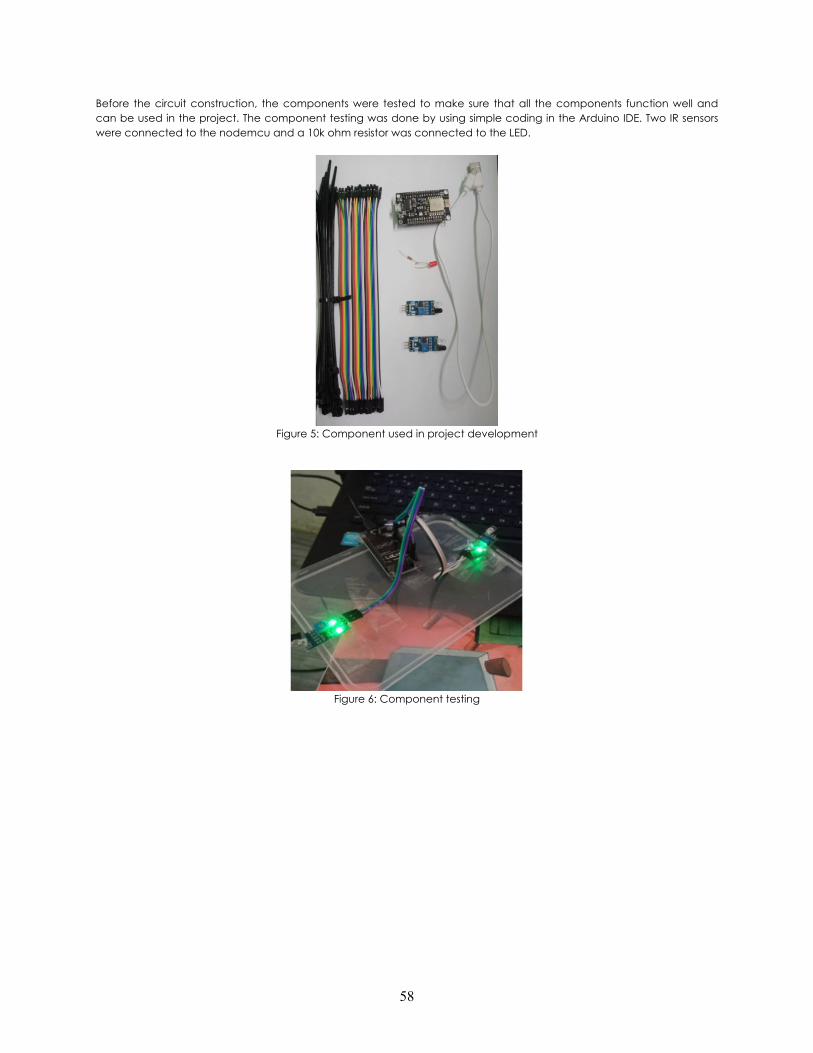
58
Before the circuit construction, the components were tested to make sure that all the components function well and can be used in the project. The component testing was done by using simple coding in the Arduino IDE. Two IR sensors were connected to the nodemcu and a 10k ohm resistor was connected to the LED.
Figure 5: Component used in project development
Figure 6: Component testing

59
Figure 7: PVC casing
Cloud database
We set up a real-time database as a platform to receive the data from the NodeMCU of the detector and to send the data to the mobile app. The database we used is the real-time database in Firebase provided by Google. The figure below shows the interface of the real-time database.
Figure 8: The interface of the real-time database
Mobile app
In this project, the coding language chosen was Flutter language. When using it, 90% of the code becomes compatible with multiple platforms and it only needs to be updated once. Besides, it is a convenient SDK (software development kit) that allows you to craft an app straightforwardly on both Android and iOS. By utilizing flutter language the software pages were created using coding and the app was compiled and tested by the android studio program Figures below show the coding for each page.
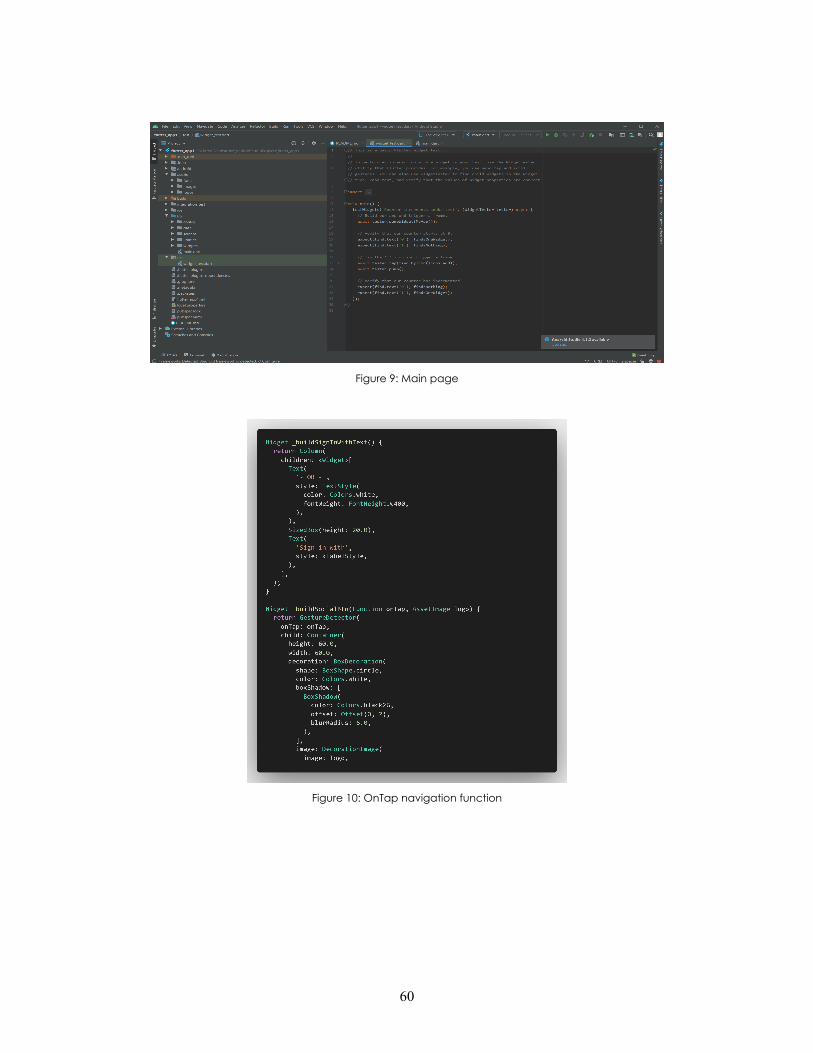
60
Figure 9: Main page
Figure 10: OnTap navigation function

61
Figure 11: Feedback coding
The CroTracker mobile application is used to monitor the number of customers on the premises and to give warning signs to the user when a limited number of customers is reached. The figures below show the user interface of the mobile application.

62
Figure 12: The user interface of the mobile application
Based on the figures, the login screen will be displayed when launching the mobile application on the user’s phone. The user needs to log in using the registered account before they can use the app. Next, the user will see the store list in the mobile application after the login attempt. The user will press any of the stores on the store list page and later, will lead the user to the next page consisting of the number of customers on the premises, the warning sign, and the latest time update.
System operation
The system operates at the entrance of the premises and the CroTracker system is located between the entrance and exit lanes. This system is applicable for premises that use the same entrance and exit door. When a customer comes into the premises, the system will count and will send the data to the database and then display it in the user interface in the CroTracker application. When the customer exits from the premise the system will detect and minus the current count and display it in the application. While handling this pandemic, there is some limit for the number of customers entering the premises. For this system, 15 people are the maximum. When people count reaches 15, red LED lights will light up as an indicator to show the premises is full, no one can enter the premises. The warning also displays in the application. But, when a customer exits from the premises, the count will become 14 and the red LED will turms off. New customers can enter the premises.

63
Figure 13: The red LED lights up and a warning appears in the app when the number of customers exceeds the limit
Figure 14: Page of the app displaying the current customer’s number.
Project Management Table 1 shows the Gantt chart of the project. For the first four weeks, we were planning and identifying the product and the systems for this project. During this period, we conducted surveys for finding the best solution for the implementation of the smart system. After finding the best solution we divided the task among the group members. In week 5 and 6 we were doing the study and research on the assigned task. The assigned tasks were hardware development, apps development, and database development. From week 6 until week 12, the process of implementing the design. At this

64
period, we also need to change several types of equipment due to the obstacles that we faced. From week 13 until week 14, the integration of the system was conducted and the prototype was completed.
Table 1: Gant chart of the project
The total expense for this project is RM75.90 including one unit Node MCU, two units of IR sensor, jumper wire, casing, BCD 7 segment, and soldering tools. Table 2 is the bill of material.
Table 2: Bill of material of the developed prototype.
Result and analysis
This system is applicable for premises that use the same entrance and exit door. When the customer passes by the sensor, the sensor will start counting up. The figure below shows the result of the counting when the customer enters the premises,
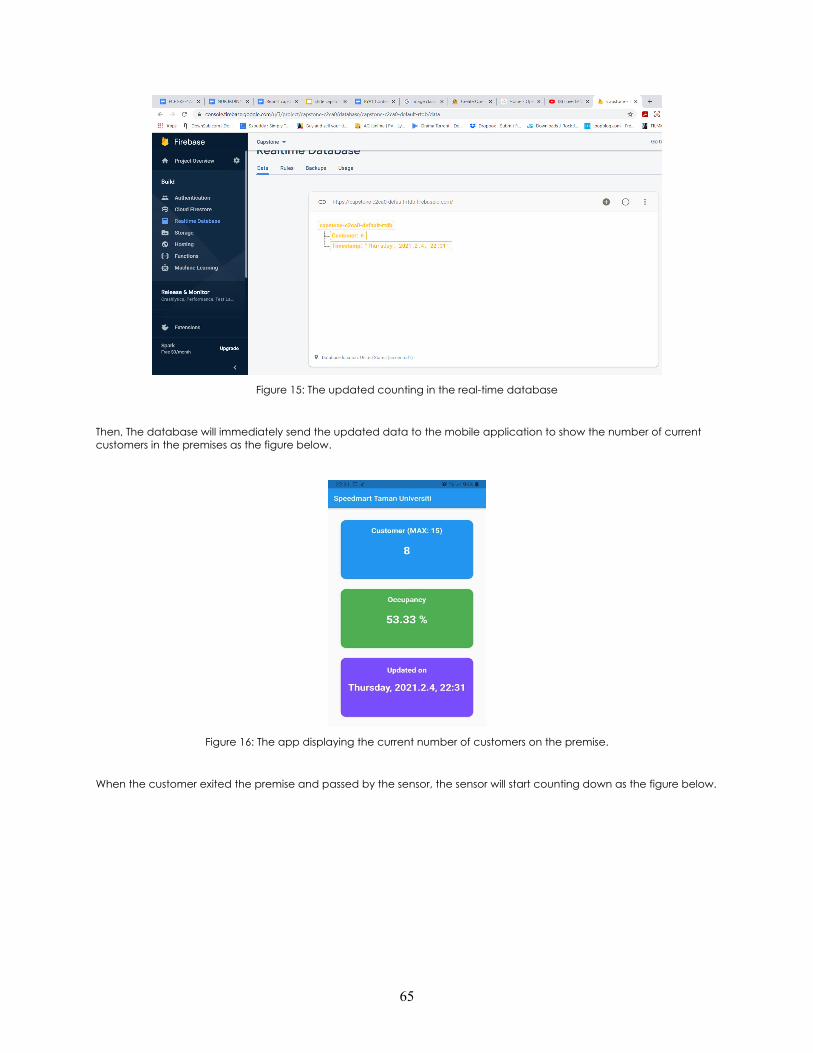
65
Figure 15: The updated counting in the real-time database
Then, The database will immediately send the updated data to the mobile application to show the number of current customers in the premises as the figure below.
Figure 16: The app displaying the current number of customers on the premise.
When the customer exited the premise and passed by the sensor, the sensor will start counting down as the figure below.
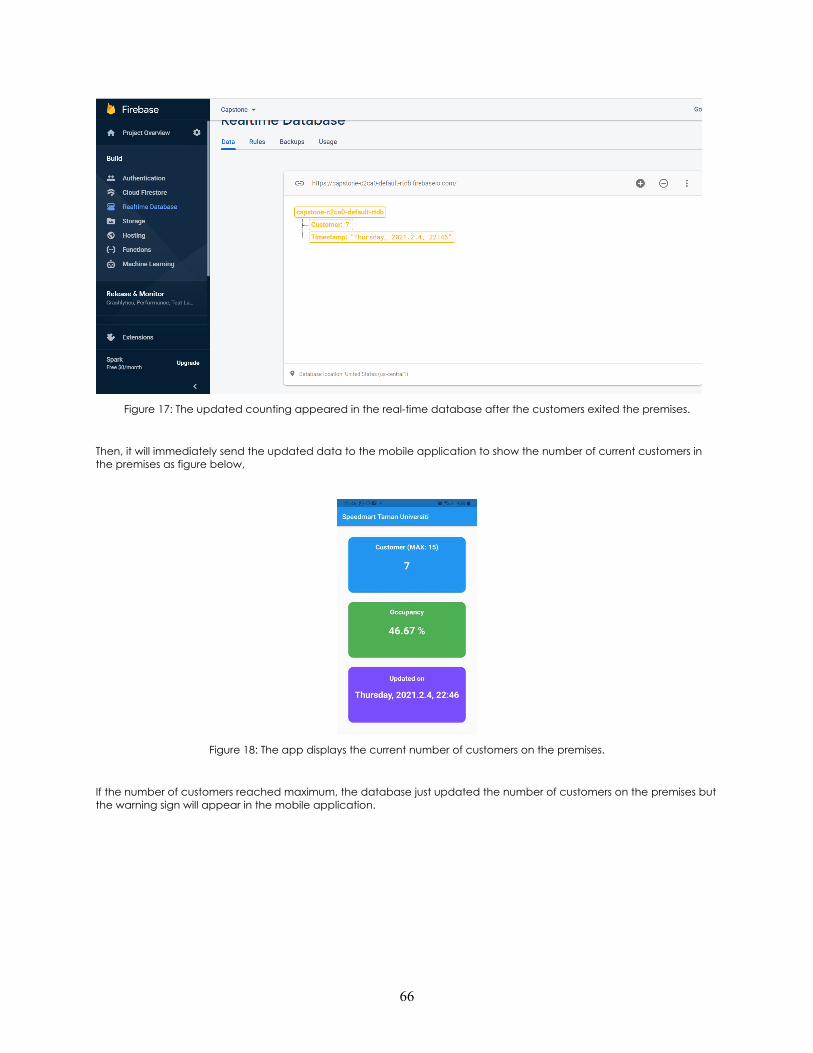
66
Figure 17: The updated counting appeared in the real-time database after the customers exited the premises.
Then, it will immediately send the updated data to the mobile application to show the number of current customers in the premises as figure below,
Figure 18: The app displays the current number of customers on the premises.
If the number of customers reached maximum, the database just updated the number of customers on the premises but the warning sign will appear in the mobile application.

67
Figure 19: The updated counting appeared in the real-time database after the number of customers reached the maximum number.
Figure 20: LED lights up and the app gives a warning when the number of customers exceeds the limit.
The benefit of our products is it will update the latest number of customers without any significant delay in the database and the mobile application as well. This is because we use a real-time database which is a suitable solution to solve our current problem statement.
Table 3: Speed performance analysis of the system
Test Sending and receive data speed
Counting up No delay
Counting down No delay
Limit reached (Warning sign) No delay
The STEEP analysis of the proposed system is shown in Table 4. The proposed system was compared with the MySejahtera app. Table 5 summarizes the difference. The possible benefit of the system was analyzed by comparing the

68
situation before and after using the system (Table 6). By using the system, the premise does not need to assign a worker to monitor the entrance. This indirectly increases productivity.
Table 4: The STEEP analysis of the developed prototype
Aspect Discussion Sociological Less face-to-face interaction and keep social distancing. Technological Implement the Internet of Things (IoT) and create creative innovation Economic Develop an affordable application in crowd tracing Environmental Bring on a healthy and safe environment Political Follow standard operating procedure (SOP)
Table 5: Comparison with similar products
Features MySejahtera CroTracker
Display the current number of customers on the premises
×
The login interface for the user
Table 6: The comparison before and after the usage of the mobile application.
Before After
The workers in the premises must calculate the number of customers inside the premises and make sure it does not reach the maximum number of people in the premises.
With the mobile application, it shows the current number of customers inside the premises and if it reaches the limit, the LED will light up and immediately send a warning to the mobile application to inform the user.
Conclusion
In conclusion, the project is functioning according to the design. It can collect the data, and can display it on the app. In the prototype development process, the prototype facing some problem which is the LCD should be placed in the prototype. Due to limited time for troubleshooting, the LCD was removed. The current prototype can be improved by adding the LCD that displays the current update of the customer numbers. Besides, other relevant improvements are also needed to make the prototype more competitive with the available product on the market.
References MySejahtera. (2020). Retrieved February 4, 2021, from Malaysia.gov.my website:
https://mysejahtera.malaysia.gov.my/intro_en/ Mohd. (2020, June 8). COVID-19: “Asas SOP ialah penjarakan sosial.” Retrieved February 4, 2021, from Berita Harian
website: https://www.bharian.com.my/berita/nasional/2020/06/697933/covid-19-asas-sop-ialah-penjarakan-sosial

PROCEEDINGS OF ELECTRICAL ENGINEERING CAPSTONE SHOWCASE 2020 (EECS2020): SMART INFRASTRUCTURE
eISBN 978-967-2615-32-3
Safe-Sensing Pineapple Peeling and Coring Machine
Zairee bin Muhamad Wan Ahmad Nazlee Bin W Hassan
Siti Nur Halijah Binti Mohamed Yusof Raja Muhd Farhan Bin Raja Abdul Rahman
Suhana Mohamed Sultan* School of Electrical Engineering
Universiti Teknologi Malaysia *[email protected]
Abstract: Safe-sensing pineapple peeling and coring machine is a machine developed to have safety features which also have an automated characteristic during operation. This idea arises when MARDI Johor Bahru had been using the old and manual machine operation before the peeling and coring of the pineapple process took place. In this project, the design of the pineapple peeling and coring machine is embedded with three intelligent sensors for safety which are proximity sensor, counter sensor and infrared (IR) sensor. As compared to the existing machine, this machine does all the pineapple pre peeling and coring process automatically that may help to solve the problem faced by Small and Medium Enterprise Industries. The machine developed can contribute to reduce the time taken for pineapple peeling and coring processed. This project uses the Arduino UNO as a microcontroller because it is an open-source electronics prototyping platform based on flexible, easy-to-use hardware and software that is easily programmed. Keywords: Safe-sensing; Peeling and Coring, safety; automatically; intelligence sensors Introduction
The Malaysia pineapple industry is one of the industries under the Agro-Food sector which play an important role in the development of the country including the socio economy of entrepreneurs now. The pineapple industry plays an important role in meeting the country’s pineapple demand which has increased by 3.8% with the growth rate of pineapple production since the last 10 years. Its growth has shown a positive trend until 2020. Through National Agro-Food Policy, the growth of the Agro-Food industry will be driven by the private sector and agricultural entrepreneurs in meeting the domestic and international markets mainly from the aspects of productivity and quality.
The government has planned various initiatives and frameworks in order to improve the efficiency of the pineapple industry along the value chain so that the development of agriculture becomes more productive and competitive. In 2017, the world’s major pineapple crop acreage was from Nigeria (18%), India (10%), Thailand (8%), China (7%), Philippines (6%). The area of pineapple cultivation in Malaysia is 10,131 hectares and ranked Malaysia to 23rd in the world out of 89 countries. Meanwhile, Malaysia’s pineapple production recorded 340,722 metric tons, only 1.0% of total world pineapple production[1]. Figure 1 shows the production trend and yield of Malaysia pineapple compared to the world.
Figure 1: Production Trend of Pineapple in Malaysia [2]
From the chart it shows the world demand for pineapple is increasing every year with an average change of 4% per annum. Nevertheless, the pineapple industry in Malaysia has shown a fluctuating trend over the past 10 years.
The growing export of pineapple products in Malaysia needs to be supported by continuous production of pineapple regardless if it's a fresh pineapple product or processed pineapple such as canned pineapple, pineapple juice and others. Pineapple crop expansion approach with oriented wider commercialization allows the agencies to seize market space by seeking the opportunities of pineapple products to grow internationally. Various

70
proactive measures were introduced and expanded as a pineapple crop of high quality and high value by approaching the technologies to accommodate the pineapple export demand and meet the needs of the domestic market. To ensure high and continuous pineapple production, the emphasis is on R&D intensified with various modernization as well as up to date methods in ensuring production costs which are more effectively grazed by pineapple entrepreneurs.
Nevertheless, in order to ensure that the pineapple industry remains competitive with quality of pineapple productions and meeting the market supply and high demand domestically and globally, Malaysian government has offer great opportunities focusing on technologies and R&D’s in order to increase the productivity of pineapple. This having a safe and quality operating machine, increasing the area of pineapple cultivation, initiatives toward reducing operating costs, complete infrastructure developments as well as initiatives to expand market space inside and outside of the country.
In order to support the government initiatives and commitments, an innovative product named Safe-Sensing Pineapple Peeling and Coring Machine is designed in order to help the end user from agricultural sectors in this case MARDI Johor Bahru (Malaysian Agricultural Research and Development Institute). The safe-sensing pineapple peeling and coring machine is a machine that developed to have safety features which also have an automated characteristic during operation. Obviously, the automation and safety elements is the main key that will lead to producing a better product at lower cost and high quality in terms of manufacturing since some of the production machines are manual and labour intensive. Project Objectives
1. To enhance the safety features of the existing pineapple peeling and coring machine by sensors installation.
2. To produce an automated system by moving conveyor.
3. To produce high productivity of peeled and cored pineapples.
Data Collection
Prior to the commencement of this project, an interview session has been conducted by selecting the relevant agencies. There were several agencies selected such as FELDA, RISDA, MARDI and also farmer and rancher, where the interview session aimed to get to know and dig into the problem encountered by the respective agencies. Ultimately, the chosen agency was MARDI Johor Bahru. All the problems and needs of potential users have been pointed out from the interview questions constructed. In order to create the design statement, the interviewees from MARDI had undergone an interview session as part of the data clustering process. From this process, all data was collected from the respondents, identified and analysed in order to solve the problems faced by them. Appendix 1 shows the interview scripts and the answers given by the MARDI officer.
From the analysis of the answers given, personification is constructed which includes the profile , pain points and the needs. In designing the personalities, all the details in the routine and issues of daily life are taken into consideration. The user’s profile is as follows
● Target user: MARDI Trainers, Trainees & Pineapple SME’s ● Gender : Male/Female ● Age: 20 - 60 years old ● Field of Work: ○ Working in environment that involves in operating of pineapple peeling and coring machine ○ Feeding pineapples into the machine for peeling and coring process ○ Highly importance to mitigate risk/ potential incident may occur during operating the machine
The pain points and needs for the target user is given in Table 1.
Table 1: Pain points and the needs of the end user
Pain Points Needs
The machine has no safety features/ elements Enhance the safety features of the machine by sensors installation
Manual intervention in feeding pineapples into the machine
Automated system by moving conveyor
Low productivity of peeling and coring process To gain high productivity of peeled and cored pineapples
Figure 2 shows the existing peeling and coring machine. The pictures were taken during the visit to MARDI Johor Bahru.

71
Figure 2: Existing pineapple peeling and coring machine
Design Statement Next, a design statement was formulated which can help the target user to gain all the needs that have been identified with the help of technology and innovative ideas without disturbing their daily operations. How to improvise the manual operation while feeding the pineapple into the existing peeling and coring machine by adding the safety features at the same time in order to gain high productivity for the entire process of the machine. Methodology A prototype conceptual design was proposed which consists of;
● Proposed sensor 1 - to trigger the pineapple on the conveyor to START the peeling process. ● Proposed sensor 2 - to trigger the pineapple finished and to STOP the conveyor ● Proposed sensor 3 - to add photo and counter sensor in order to track productivity of the pineapples
Figure 3 illustrates the prototype development and conceptual design that was proposed initially.
Figure 3: Proposed prototype and conceptual design
A project planning was also being executed by allocating tasks of work that will be done in the assigned time frame as planned so that this project can be carried out entirely and meet the requirement as desired. This can be illustrated by the Gantt Chart in Figure 4.

72
Figure 4: Project Gantt Chart Product Development
The design of the system is aimed at upgrading the security system to a pineapple peeling machine in Mardi, Johor bahru. Among the safety aspects that were added to this machine is to be able to insert the pineapple automatically by adding a conveyor and motor system. In the beginning a few things were proposed to be added i.e. adding a conveyor as an important platform for inserting pineapples automatically. However, the conveyor alone is not enough, so a few more features were added to make sure the conveyor process moved better. Among them is to include some sensors to our initial design as shown in Figure 5. The main tools and components that were used in the project development were listed in Table 2.
Figure 5: Conceptual proposal sketching
Table 2: Main components used for the project development
No. Component
1. Arduino UNO Compatible Atmel DIP ATMEGA328P UNO R3
2. PVC Conveyor Belt
3. IR Photo Sensor
4. Proximity Sensor
5. DC Motor (260 RPM)
6. 4-Channel Relay Board
7. Relay 12VDC
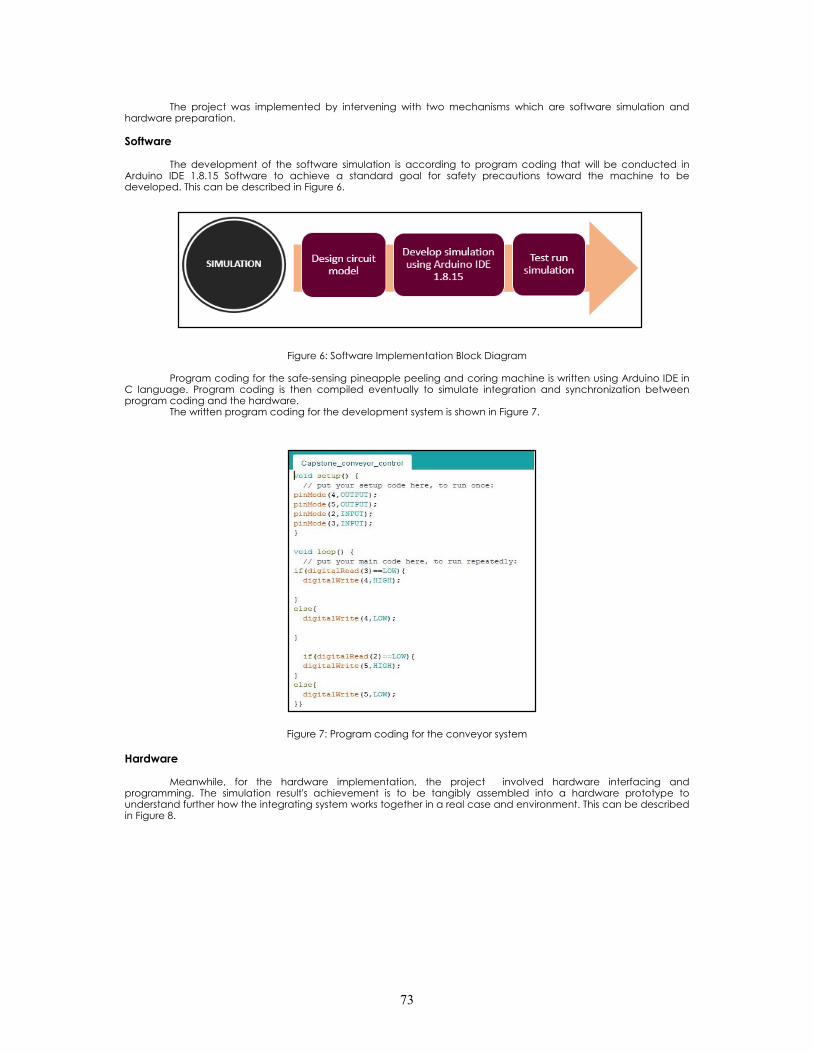
73
The project was implemented by intervening with two mechanisms which are software simulation and
hardware preparation.
Software
The development of the software simulation is according to program coding that will be conducted in Arduino IDE 1.8.15 Software to achieve a standard goal for safety precautions toward the machine to be developed. This can be described in Figure 6.
Figure 6: Software Implementation Block Diagram
Program coding for the safe-sensing pineapple peeling and coring machine is written using Arduino IDE in C language. Program coding is then compiled eventually to simulate integration and synchronization between program coding and the hardware.
The written program coding for the development system is shown in Figure 7.
Figure 7: Program coding for the conveyor system Hardware
Meanwhile, for the hardware implementation, the project involved hardware interfacing and programming. The simulation result's achievement is to be tangibly assembled into a hardware prototype to understand further how the integrating system works together in a real case and environment. This can be described in Figure 8.

74
Figure 8: ardware Implementation Block Diagram
Control circuits were built as schematic drawings and model circuits as shown in Figure 9 and Figure 10 .
This control circuit consists of several components, such as:
● Power Supply 240VAC to 12VDC ● 4-Channel Relay Board ● Relay 12VDC ● DC Motor Speed Controller ● DC motor (260 RPM) ● DC-DC buck converter (12VDC to 5VDC) ● IR Photo Sensor and Display Counter ● IR Photo sensor (single unit) ● Proximity Sensor ● Pull-up Resistor ● 12VDC Indicator Light (green) ● 12VDC Indicator Light (red)
All components were combined and connected to complete the final circuit of the project.
Figure 9.: The schematic drawing circuit for the system
Figure 10: The schematic model circuit for the system
(a)
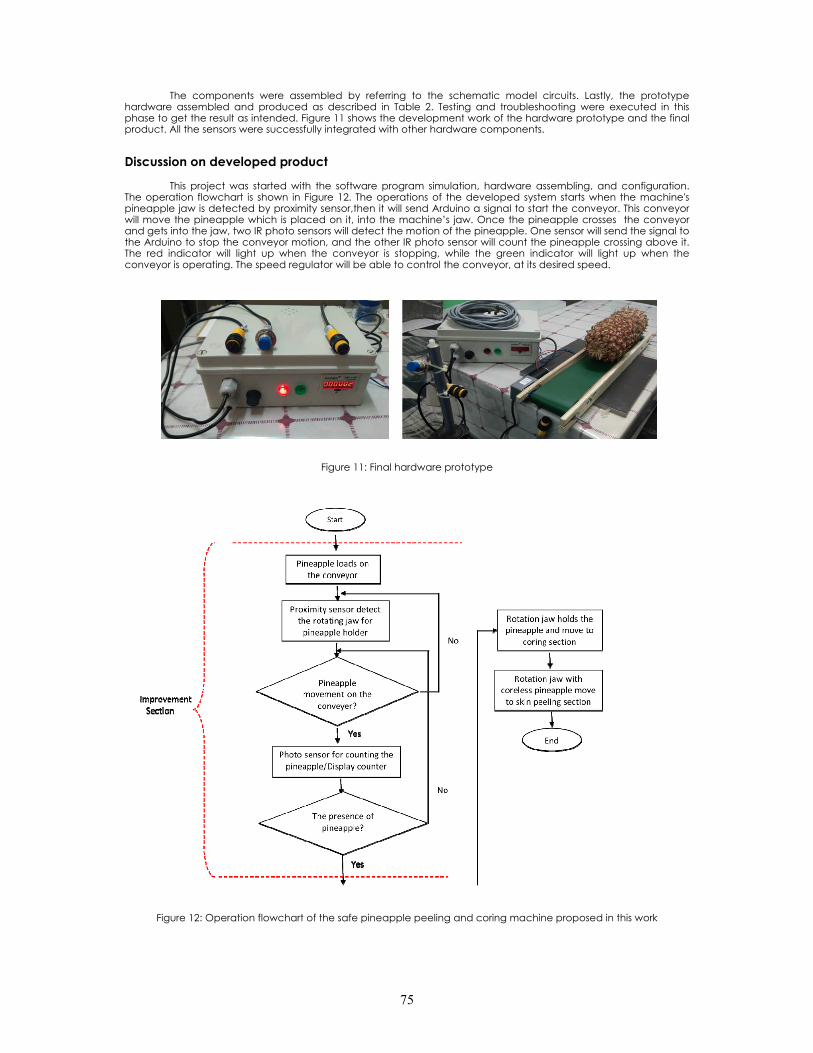
75
The components were assembled by referring to the schematic model circuits. Lastly, the prototype hardware assembled and produced as described in Table 2. Testing and troubleshooting were executed in this phase to get the result as intended. Figure 11 shows the development work of the hardware prototype and the final product. All the sensors were successfully integrated with other hardware components.
Discussion on developed product
This project was started with the software program simulation, hardware assembling, and configuration. The operation flowchart is shown in Figure 12. The operations of the developed system starts when the machine's pineapple jaw is detected by proximity sensor,then it will send Arduino a signal to start the conveyor. This conveyor will move the pineapple which is placed on it, into the machine’s jaw. Once the pineapple crosses the conveyor and gets into the jaw, two IR photo sensors will detect the motion of the pineapple. One sensor will send the signal to the Arduino to stop the conveyor motion, and the other IR photo sensor will count the pineapple crossing above it. The red indicator will light up when the conveyor is stopping, while the green indicator will light up when the conveyor is operating. The speed regulator will be able to control the conveyor, at its desired speed.
Figure 11: Final hardware prototype
Figure 12: Operation flowchart of the safe pineapple peeling and coring machine proposed in this work

76
Figure 13 shows the final hardware prototype that was successfully assembled. By design it was also fully functioning as desired but given the current situation that does not allow the installation of final hardware prototype to be done on-site, operational simulations can only be carried out at the student premise. As a result of this conceptual design function, it can fulfill the objective of this design and meet the safety requirement. The safety features are to avoid any accidents during feeding the pineapple into the jaw of the machine. The operator only needs to place the pineapples on the conveyor and does not have to feed it manually. As an additional feature, a pineapple counter is placed to help users count the pineapples that have crossed the conveyor .
Figure 13: Final hardware prototype and the sensor's position Conclusion
The aim of this project which is to enhance the safety features of this pineapple coring & peeling machine is achieved. Based on the features of the existing machine at MARDI Johor Bahru, the operator of the machine is exposed to danger during the manually process of inserting the pineapple. Therefore, MARDI has raised the issue for us to solve. With discussions with group members and supervised by our facilitator, Dr. Suhana Binti Mohamed Sultan, the existing process of inserting pineapples manually by replacing them automatically was proposed. This was successfully executed by using some electronic components such as motors, sensors, conveyors and so on. In this way, it can avoid danger to the operator of the machine. However, this prototype could not be installed on site because it was still in restricted movement control order.
Acknowledgement The project is supported by the School of Electrical Engineering, Universiti Teknologi Malaysia. The authors would also like to convey our utmost appreciation and gratitude to MARDI Johor Bahru, especially Puan Humairah as the deputy director of MARDI Johor Bahru for helping us in completing this capstone project. Some parts of the project was supported by Fundamental Research Grant Scheme (FRGS/1/2018/TK04/UTM/02/41) with UTM cost centre R.J130000.7851.5F053
References
[1] FAO. 2017. The future of food and agriculture – Trends and challenges. Rome.
[2] http://www.mpib.gov.my/en/publication/?lang=en;Laporan Tahunan 2018, accessed on 6th July 2021
[3] https://www.felda.gov.my
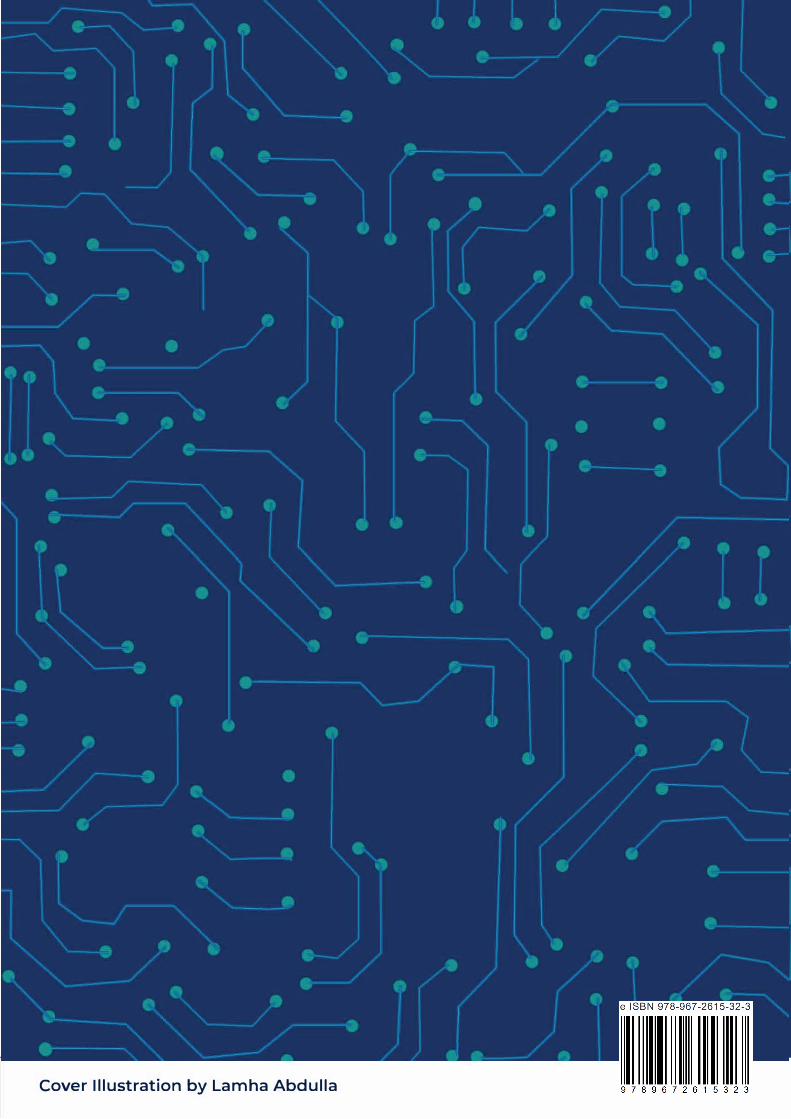
Cover Illustration by Lamha Abdulla