Embed Size (px)
Citation preview

MARCH 1993 ECN-RX--93-030
PROCEDURES TO DETERMINE THE FATIGUELIFE FOR LARGE SIZE WIND TURBINES
H.J. VAN GROLB.H. BULDER
THIS PAPER HAS BEEN PRESENTED AT THE ECWEC~93 CONFERENCE, TRAVEM~JNDE, 8-12 MARCH, 1993

/~t~RCH 1993 ECN-RX--93-030
PROCEDURES TO DETERMINE THE FATIGUELIFE FOR LARGE SIZE WIND TURBINES
H.J. VAN GROLB.H. BULDER
THIS PAPER HAS BEEN PRESENTED AT THE ECWEC’93 CONFERENCE, TRAVEM~NDE, 8-12 MARCH, 1993

- 2 -

3
PROCEDURES TO DETERMINE THE FATIGUE LI~E FOR LARGE SIZEWIND TURBLNES
H.J. van GroI and B.H. Bulder (Editors)Netherlands Energy Research Foundation ECNP.O. Box 1, I755 ZG Petten, The Netherlands
ABSTRACTThe project "Reference procedure to establish fatigue stresses for large sizeframework of the European Wind Energy R&D programme JOULE-I and is carried out with
Centre de lnvestigaciones Energedcas Medioambientales y Tecnolgicas [CIEMAT] :Garrad Hassan and PartnersNetherlands Energy Research FoundationRiso National LaboratoryStork Product EngineeringTechnical University of DelftTeknikgruppen ABTechnical University of Denmark
wind turbines" (REFSTRESS) is performed within thethe following partners:E. Sofia Lascorz
[GH] : M.A. Wastling[ECN] : B.H. Bulder, H.L van Grol and C. Lfudenburg[RNL] : J.T. Petersen[SPE] : M. Caganan and F. Hagg[TUD] : D. van Delft[TAI : H. Ganander[TUDk] : K.S. Hansen, B. Maribo Pedersen
The Tjaerborg 2 MW three bladed wind turbine at Esbjerg has been used as the reference machine. To arrive at the estimated life time alarge number of steps have to be completed, viz.: establishment of design load conditions; descfiptiodimodeEing of wind input, in particularthe stochastic part (turbulence); execution of load calculations, with proper interpretation of the criteria and on basis of sufficiently advancedaerodynamic and structural dynamic modelling; stress calculations; fatigue analyses, ending up with fatigue stress factors FSF and specificdamage factor (SDF). Though not complete a large number of load cases have been considered: "production", "start & stops" and "idling"and two faulted conditions on yaw and pitch. Azimuthal binned values of load, load and stress spectra nd FSF-values have been calculatedfor two typical cross-sections of the rotor blade and at the front bearing of the rotor shaft. The results are presented in terms of:recommendations regarding design load conditions criteria; qualifications of methodologies, in particular of describing wind turbulence byeither deterministic or stochastic methods; comparison of calculation results, on the basis of load and stress range and level crossing spectraand in particular FSF and SDF.
1. INTRODUCTION
GeneralThe present ~vork on "Reference procedures to establishfatigue stresses for large size wind turbines (REFSTRESS)",is part of the "Programme Joule 1989-1992; Wind EnergyR&D" of the Commission of the European Communities.The Commission financed 50% of the estimate. The remain-der was funded by the participating organizations and/ortheir national agencies.
ScopeA more substantial penetration of wind energy in the electri-city production is to a large extent dependent on the abilityto perform reliable design life calculations in particular ofmedium to large size wind turbines, viz. in the category of0.5 + 2.0 MW. This is especiatiy true for the rotor and drivetrain which are designed for "safe life" and which are at thesame time difficult, i.e. relatively very costly, to maintain,contrary to for instance helicopter or airplane structureswhich can be maintained indoor.As meanwhile comparatively much effort has been spent onthe development of national design criteria as well as on theharmonization of these criteria (see [1] up to [4] inclusive)and the determination of the maturity of models and codesfor load calculations (see [5] through [8]) it is indeedappropriate to investigate the strength and weakness ofdesign life predictions of modern large size wind turbines.The present REFSTRESS project serves as an embarianentof this investigation, attempting to cover most of the aspectsfrom specifying load conditions down to the calculation oflocal stress fatigue margins; see figure I. It is further notedthat from the early beginning of the work, wind farm as-pects were not to be included as part of the project.ObjectiveThe objective of the REFSTRESS project is:"To assess procedures and methodologies by means ofwhich the design life of main components of wind turbinescan be determined". In particular emphasis was put on:
FIG. I: BREAKDOWN OF REFSTRESS ACTIVITIES
- An attempt to establish the relative importance of designload conditions, which has been specified in standards, onload and/or stress spectra;
- The effects of methodologies/procedures on load andfatigue stress spectra, provided a standard has beenchosen;
- The search for an engineering measure to quantify thefatigue endurance margin.
2. WORK ORGANISATION, TASK AND OUTPUT
Work organJsationThe following main types of work were distinguished andcarried out:

-4-
- computational work : eight parties, see abstract;- wind turbine data supply : one party, see section 5;- technical management : one party, ECN.Though there were eight separate parties, the computationalwork was carried out by all these parties except for TUDwho joined ECN as the "joint NL party".
Tasks and outputsThe tasks and corresponding output, in which the proposedproject was itemized, are summarized below.Task 1: Load conditions
- Inventory of formally specified load conditions fordesign life calculations.
- Selection of a limited number of, preferablynationally accepted, reference load conditions.
Task lI: Wind input- Inventory of wind models used for the fatigue design
of medium to large size wind turbines.Selection of an appropriate wind model in order toobtain a basis for comparing results.
Task 1li: Wind turbine- Selection of wind turbine.
Task IK. Load calculations- Calculation of internal load spectra. Participants are
flee to perform these calculations on basis of a timeand/or frequency domain methodology.Selection of internal reference load spectra forreasons of comparison.Establishing c_ombinations of i_nternal r_eference to_.adspecu’a (CIRLO-spectra) to be used for stresscalculations.
Task V: Stress calculationsS~ress calculations to be performed on basis of theslender beam theory approximation.Perform stress calculations for at least one rotor bladestation and possibly for one other major component,like gear box, tower, etc.
Task VI: Fatigue damage model and design safety factor(s)- Establish fatigue model, including fatigue data of
concerned materials.- Establish design safety factors.
Task VII: Design life analyses- Estimation of "fatigue life" for the concerned
components.The actual execution of the work took place in accordancewith the above mentioned, except for the following:(i) The participants performed all their calculations with
their own description of the wind (wind models),contrary to the intended item two of task I;
(ii) Ibid, but now with regard to the toad spectra (or timeseries), contrary to the intended items two and three oftask IV.
3. SELECTION OF WIND TURBINE
The main requirements for a candidate wind turbine werespecified as:- power : in the range of 1 to 2 MW;- status : in operation;- measurement: available.Although the use of measurements was not required as man-datory in the firm proposal, it was decided to do so in orderto be able to qualify the results to some extent. The surveyconcerned the following machines:- DK : ESBJERG 1;- E : AWEC-60;- GB : HOWDEN 100/55 or WEG LS1;- NL : NEWECS-45;- S : MAGLARP or NASUDDEN.
In order to make a proper choice which wind turbine wasmost suited for the project, additional data was collected onbasis of completed questionnaires, with emphasis on:- measured quantities, in particular loads;- operating and faulted conditions;- accuracy of measured data;- output formatting.Finally it was unanimously decided to use the ESBJERGmachine as the reference wind turbine for the REFSTRESSproject. For the main characteristics of this wind turbine seetable I.
TABLE I: MAIN CHARACTERISTICS OF ESBJERG 1WIND TURBINE [Data supplied by TUDk]
- Rated electrical power- Rated shaft power- Synchronous rotor speed- Rated power rotor speed- Wind speed: cut in
rated
- Number of blades
- Cone angle
- Pitch angle: operational
stop- Hub : height
type
- Tower diameter: at h = 56 mat h=28m
- Gear box: support
- Operation- Frequencies: blade fiat
blade edge
shaft rotation- Blade: material
type
2.0 MW2.2 MW21.93 rpm22.36 rpm5.0m!s (~ i3.96)l~-.3m/s (~ 5.0)25.0m/s (?~= 2.86)three (upwind)61.1 m (incl. tip cap)0°3°
full span’pitch0-35°
4.PROCEDURE TO ACHIEVE THE OBJECTIVE
GeneralThe work procedure to achieve the objective, apart from theselection of the wind turbine, was based on the followinggeneral approach:(i) Mutaal comparisons of load conditions and criteria;(ii) Mutual comparisons of calculation results obtained by
the participants;(iii) Comparison of calculation results with measure-
ments.
SpecificMore specifically the following technical terms were chosen,along which the REFSTRESS project was carried out:(iv) Questionnaire inquiry on design load conditions and
criteria;(v) Selection of a common standard to which the
calculations should comply;(vi) Calculated quantities to be compared with
measurements should be loads or strongly related toloads, like CK(?0 and
(vii) Considered internal loads and stress spectra were, forreasons of comparison, of the following type:

- cumulative load range spectra;- cumulative above level crossing peak spectra;
cumulative below level crossing trough spectra.(viii) Calculated and, if available, measured results refer to:
- rotor blade inner (near root: =9%) cross-section;- rotor blade middle (~51%) cross-section;- rotor shaft cross-section at float bearing.
(ix) Questionnaire inquiries were performed xvith regard tothe following items:- wind input modelling;- wind turbine modelling;- applied load factors and effective fatique stress
quantity.
ClassificationThe calculation rounds were arranged as:A. Preliminary calculations;B. Load calculations;C. Fatigue calculations.
Preliminary calculations (set A)The preliminary calculations served among others as jobfamiliarization, in particular with respect to items such as:- input transfer;- output formatting;- methods of comparison and presentation of results.In order to reduce the number of different influences(parameters) througli which results might be diffused thepreliminary calculations are kept relatively straight-forward.Main assumption ou the input side were:- Load condition: "Normal-Production", limited to one wind
speed interval above and one wind speed iuterval below
- Use of measured and modelled (unsteady) wind input data;- Prescribed deterministic vertical wind shear in those cases
where the wind input was simulated (modelled).The set A calculations are, apart from job familiarization,focussed on:- Qualification of calcdiated resuks by comparing them with
measurements, through:* aerodynamic performance coefficients: CK(~.);* axial rotor trust coefficient: C.r(~);* pitch angle above Vr~t~;* fiat- and edgewise bending moment at rotor blade inner
cross-section.- Methodology assessment on basis of the analysis of
azimuthal binned values and range, peak and troughspectra of different loads supported by wind turbine andwind model comparisons. The latter included thecomparison of wind spectra as well.
Load calculations (set B)As the actual project was aimed at the establishment of a"complete" load spectrum it took some time to fiud areasonable balance between "complete" and "availablebudget". This was in particular the case for the followingsubjects:- what standard(s) shall be applied for the load conditions;- which load conditions shall be incorporated as generic,
~vhieh shall only serve as examples and which ones shall
be deleted altogether.The outcome of the first question was that all participantsshould use the "Recommendation for a European DesignStandard" [1] with the "Preliminary Regulations for theCertification of Wind Energy Conversion Systems" of theGermanischer Lloyd [3] as a back up. Regarding theextensiveness of the load conditions emphasis was put onthe load condition "NORMAL". For the faulted conditionsonly an uncontrolled pitching and yawing case were to beconsidered as examples. Other load conditions were notconsidered at all. As to the main conditions assumed for theload spectra calculations, these were as follows:- the average wind speed distribution is described by
Weibull’s distribution function;- other aspects of the wind input modelling (or description)
were free;- structural flexibility and wind turbine control actions shall
be accounted for.Finally, the activities regarding the outcome of the loadspectra calcdiations were focussed on:- applicability and applied standard(s) on load conditions,
among others by means of a questionnaire inquiry;- determination of range, peak and trough spectra of loads in
view of getting insight in the relative importance ofdifferent load conditions on the fatigue life.
Fatigue calculations (set C)As the calculation of the local stress distribution in itselfwas not an objective of the REFSTRESS project, the slenderbeam theory was applied as being acceptable for thecalculation of stresses. This is also the ease for the materialfatigue damage accumulation model and material fatigueproperties. For this reason the linear damage summation ruleof Phimgren-Miner was applied straightforward. The set Ccalculations were focussed on the fdilowing items:- stress spectra calculations in a number of pre-selected
locations per cross-section;- determination of relevant engineering fatigue quantities;- comparison of these quantities in order to obtain:
* a feeling for the degree of maturaty of the performedlife time predictions based on the spread in calculationresults;
* insight in the relative importance of the different loadconditions on the life time.
5. RESULTS ON LOAD CONDITIONS
(0i) It was generally felt that a comparison of load spectra,merely brought about by different regulations, wouldshow such large discrepancies, that a free choice onthis matter was abandoned viz. less appropriate tocover in the REFSTRESS project.
(02) During the time that this part of the work was cardedour (1991) no clear position on the application ofmandatory standards could be established, even if theparticipants were grouped to their countries, viz.:DenmarkThere existed a national drafr standard [4] used as ageneral approach (RNL and TUDk) but there was alsopreference for using the standard of the GermanischeLloyd [3], in particular by TUDk;SpainNo formal national document existed, neither a fLrmposition on the standard to be used (CIEMAT);SwedenNo unique requirement was in force. Tlie applied
fication body";

-6-
The NetherlandsOfficial approach on basis of a national standard ofCIWI [2] (SPE and ECN), but with exceptions onwind input modelling (ECN);United KingdomNo formal national document was in force. Preferencefor the standard of the Germanische Lloyd wasexpressed (GH).
Normal operating condition: "production"(03) Four basic different ways were applied to describe/
model the wind input; see section 6 for furtherinformation.
(04) Lateral turbulence and misalignmem gave rise tomixed up load cases. This can be avoided if thestandards on load conditions more clearly requiredistinguished analysis for:- stationary misalignment caused by kind of control;- stochastic misalignment due to horizontal wind
turbulence;- misalignment as a result of improper system
function (faultud condition);the proper act of yawing as such.
(05) Vertical turbulence and instutionary vertical windshear are not really accounted for.
(06) The information on grid failure was rather dis-appointing; ranging fi’om no information to differencesas much as a factor 5.
ofloads and number of cycles show differences due
one, two or maybe three different wind speeds on
~ V~).
implications and not so for fatigue.
Faulted conditions(09) All faulted, conditions are assumed to occur at V >_
(10) The classification of faulted conditions, and moreoverload cases in general, as contributing to only strengthor only fatigue, shows arbitrariness. Reason for this isthe absence of a rationale on this matter. For furtherdis- cussion ECN proposed a recommendation; seebelow.
Design frequency ofoccurrence per designlife of wind turbine
u&0.01 ] 0 not applicable
(11) The frequency of occurrence of a failed system can beestimated by means of the "event tree" methodo- togyand "fault tree" analyses; see [7] and [9]. Only one ofthe participants (ECN) mentioned this possibility.
Installation and maintenance(12) Only one participant (SPE) supplied some data on
loading conditions related to installation andmaintenance.
6. RESULTS OF PRELIMINARY CALCULATIONS
6,1. Summary of results on wind modelling
Turbulence modelling (approach)Four different approaches have been used by the participantsto discribe the stochastic wind behaviour viz.:- Measured data base CIEMAT- Dutch Handbook Method (ECN-CN), JNL and
SPE- Power density spectra approach ECN, GH, RNL, SPE
and TUDk- Wind Data Matrix : TAA survey of the turbulence characterization is given intable E.
TABLE n TURBULENCE CHARACTERIZATION
Aspect GH
(+) +
+ +....
Measured data baseThe approach, applied by CIEMAT is empirical. Turbulenceis not modelled but described by means of site specific 10rain time series for wind speed and direction at hub height.These data are used as coherent longitudinal and lateralwind fluctuations. As a matter of fact this method is only oflimited value for design purposes.
Dutch Handbook Method [10]The poim of departure is to design by role and not byanalyses, in so far as it concerns the description oftorbulence. Basically each wind speed interval of 2 m/s isdivided in two main groups: one on gust duration and theother on gust amplitude. In turn each group is subdivided inthree subcases. Thus per wind speed interval nine (3 * 3)deterministic gusts are prescribed in shape and frequency ofoeeurrence. The method is empirical in the sense that it istuned to measured results and becked-up with PDS calcula-tions. A basic disadvantage of the method is that resultingrotor blade loads on the rotor shaft are far from realistic.
Power density spectra method [11]This method is semi empirical, based on measured powerspectral densities of stochastic (turbulent) wind speeds;issued by ESDU (Engineering Sciences Data Unit). In so farthe PSD method was used only the longitudinal turbulencecomponent was modelled, however including the spatialdependency over the rotor plane. In other words alsoincoherent gust (eddy slicing effects of rotating rotor blades)are taken into account. This is implemented trough thespatial coherence function of the exponential type of ESDU.In practice only the following parameters need to be knownfor the turbulence quantification:- average wind velocity at hub height;- turbulence imensity at hub height;- terrain roughness length.

The method is well suited for design calculations, viz. windturbulenco modelling. A practical shortcoming of the methodis that low frequency gusts are not modelled, i.e. absent dueto the low frequency cut-off of the PDS.
Wind data matrix [12]The wind turbulence simulation developed by TA isbasically an engineering approach. It is empirically directedtowards obtaining essentials for the designer on gustamplitude and duration including the frequency ofoccurrence. The method is implemented along the so-calledwind data matrix, abbreviated as WDM. Ongoing windturbulenco measurements (campaigns) at different sitesconstitute the data base. Presantly only the longitudinalturbulence component is considered. The (spatial) turbulencedistribution over the rotor plane is accounted for by non-stationary vertical one dimensional wind shear, being eithersynrmetric with reference to the hub height or asymmetric.As a matter of fact the maturity of the method depends onthe amount of collected data in the WDM, as in particularfor design purposes site specifications might differ inturbulence intensities while at the same time information onlow frequency gusts asks for long measuring campaigns.
Calculated wind speed range spectraIn the figs. U (case A) and IE (case B) measured andcalculated wind speed range spectra are depicted. Comparedto the measured results fig. II (based on only one ~ 10 ruthcampaign) the general tendency is that all participantsoverestimate the turbulence,and that these quite differmutually also. Looking to figure II/ again the calculatedresults show large differences. It can be summarized:
The results based on measurements (CIEMAT) show anincreasing absence of low cycle ranges with increasingwind speed. Evidently the used data base suffers from alack of large gust campaigns. Note that it concernscoherent wind speed ranges;The DHM method (ECN & TUD and SPE) show in parti-cular large low cycle ranges, which is conceivable inview of the inclusion of rare occurrence gusts. Also inthis case the gusts are coherent;The resuks based on the PDS approach ECN, GH, RNLand TUDk) show less agreement than expected. Ratherclose is the agreement between ECN and TUDk (fig. III)apart at low cycles. The reason for this is that TUDksupplemented the PDS approach with "V~v - from - to"changes as well. Depicted wind speed ranges are pointvalues;The WDM (TA) method, for which only data over theentire wind speed interval exist, seems to beunconservative, notwithstanding the fact that also in thiscase the wind speed ranges are of a coherent nature. Thisunconservatism is however not refiectud in thecorresponding load spectra.
Cumulative number of cycles N
22
20
8
5
2
0100
Cumulative number of cycles N
Cumulative number of cycles N
6.2. Summary of results on wind turbine modelling
Comparing the questionnaire results with former resultscarded out within the framework of the "Wind TurbineBenchmark Exercise on Mechanical Loads" (WTBE-ML)[5], yields the following conclusions:
(i) The basic approach (conservation of axial andtangential momentum combined with blade elementtheory on uncoupled tubular flow) and modelling hasnot been changed since the completion of the WTBE-ML. This implies that all participants used the so-called "first generation rotor code". Or in other wordsno account, in terms of "routine" design calculations,has been given yet to such phenomena as:
three dimensional aerodynamic effects along thespan of the rotor blade;instationary aerodynamics, either wake effects(dynamic inflow through the non-stationarydevelopment of wakes; see [13]) or boundary layerthickness effects (delayed stall);
(ii) Contrary to what was the case during the execution ofthe WTBE-ML there were no participants who appliedthe frequency domain methodology. It is noted herethat GH and RNL who also participated in the formerbenchmark exercise, used the frequency domainmethodology at that time. As there is still some"competition" between the two methods, one maywonder why this is the case. The reason is in fact amix of practical and theorectical considerations. Forinstance transients and stall effects can only beassessed on basis of the time domain methodology.Further the fact that only rotor blade loads can easier

-8-
be handled by the frequency domain codes than loadson the nacelle or rotor shall, is a plea for the timedomain approach. The frequency domain approachhowever is a very fast tool for say sensitivity studies.In concluding the frequency domain methodology isused for scopingdpre-design studies while the timedomain approach for final (accurate) designcalculations.
(iii) The implementation of the number of structuraldeformation degrees of freedom still shows a largespread, maybe too large. Note that most participantsapplied the method of modal expansion. Neverthelessthe calculated and measured namrel frequenciesshowed good agreement, see table IlL
TABLE nI CALCULATED AND MEASURED NATURAL FREQUENCIES
First
774 (20 P)8,20 (22 P)
6.3.Aerodynamic power coefficient, axial rotor Wastcoefficient and rotor blade pitch angle
Aerodynamic power coefficient (Eee fig. IV)By definition the agreement above Vr~~ (below Z.~t~) mustbe perfect as Ck(~) follows from:
The spread in the results below V~d (+-.8% it, Ck(k) at ~ =12) must be expected to increase for increasing values of k,because of the net results of the competing quantities Qsth0pvereus C#es@ and the increasing influence of the use ofdifferent turbulent wake state models; see also [5].The poor agreement between calculated and measured Ctvalues is likely to be attributed to the increasing importanceof inaccurately measured wind speeds and drive train losses.
tip speed ratio % [-]
Axial rotor trust coefficient (see fig. IV)For the same reason as mentioned above the agreement atlow values of 2, should be good and that at below V~t~ less.From elementary rotor aerodynamics, Ck = 4a(1-a)z and C-r =4a(1-a) it follows that: C,r = Cdl-V~C~(I+V~C0}k The calcu-lated values are higher than the estimated because of theassumption tha~ a~ = 0 and Cd = 0.
~7’ o.s
0.30.2
0.0
tip speed ratio k [-]
Rotor blade pitch angle (see fig, V)The agreement between measured and calculatad results isgood: the spread in the pitch angle is ±1° approxi-mately.This might be a good reason for the manufacturer always tobe able to adjuat the pitch angle to +_FA dog at the approvaltest. The decrease of the pitch angle with an increasing tipspeed ratio is conceivable. However the rather completelinear dependency is not evidenrAtraightforward.25
2O
3.0 3.5 4.0 4.5 5.1) S.5
tip speed ratio % [-]
6.4. Tvpiea| measured and calculated results
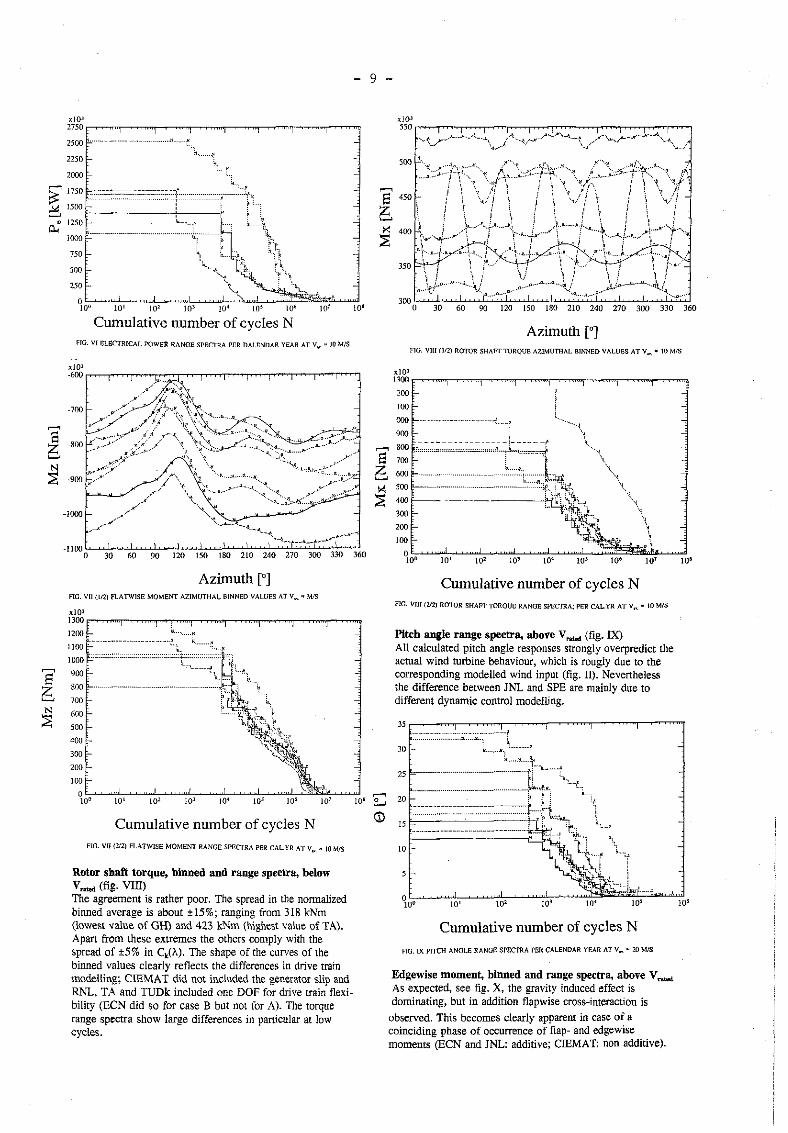
Electrical power range spectra below V~d (fig. VI)Differences between calculated and measurd results can betraced back as due to differences in the wind input; see fig.I~. But the disagreement is striking.
Flatwise moment, binned mad range speetru, belowThe agreement, see fig. VII, is reasonable ill particular ifnormalized to the same average wind speed. Within achosen wind speed interval the average design wind speedmay be differant due to regulatory requirements. The spreadin the averaged normalized flatwise moment is about _+6%,while that in the peak value (= minimum-average) is muchlarger: ranging from 109 kNm (lowest value of CIEMAT)and 145 kNm (highest value of ECN), or in other wordsshowing a spread of +_.15%.
9
2750
2500
2250
20O0
75O
500
Cumulative number of cycles N
0 30 60 90 120 150 180 210 240 270 300 330 360
Azimuth [°]
600
500
400300
200
100
010° l0t l0z IO3 10~ 10s 106 101
Cumulative number of cycles N
500
450
350
3090 30 60 90 120 150 180 210 240 270 300 330 360
Azimuth [o]
Cumulative number of cycles NF]~. VIII (~21 ROTOR SHAFI" TORnIJE RANGE SPECTRA; PER CAL.YR AT V~ ~ 10 M/S
Pitch angle range spectra, above V,~ (fig, IX)All calculated pitch angle responses strongly overpredict theactual wind turbine behaviour, which is rougly due to thecorresponding modelled wind input (fig. U). Neverthelessthe difference between JNL and SPE are mainly due todifferent dynamic control modelling.
Rotor shaft torque, binned and range spectra, belowV,,~ (fig. VII!)The agreement is rather poor. The spread in the normalizedbinned average is about _+15%; ranging from 318 kNm(lowest value of GH’) and 423 kNm (highest value of TA).Apart from these extremes the others comply with thespread of -+5% in C~(~-). The shape of the curves of thebinned values clearly reflects the differences in drive trainmodeffmg; CIEMAT did not included the generator slip andRNL, TA and TUDk included one DOF for drive train flexi-bility (ECN did so for case B bat not for A). The torquerange spectra show large differences in particular at !owcycles.
Cumulative number of cycles N
Edgewise moment, binned and range spectra, above V~t~As expected, see fig. X, the gravity induced effect isdominating, but in addition flapwise cross-interaction is
observed. This becomes clearly apparent in case of acoinciding phase of occurrence of flap- and edgewisemoments (ECN and JNL: additive; CIEMAT: non additive).

- 10-
This dtiblet-effect is also reflected in the edgewise rangespectrum. The reason for this effect is that ECN and JNLdid not include structural damping in their calculations.
30 60 90 120 150 180 210 240 270 300 330 360
Azimuth [°]
16(30
1400
200
Cumulative number of cycles N(2/2) EDGEWISE MOMENT RANGE SPECTRA PER CALENq)AR YEAR
7. LOAD CALCULATIONS AT Vm~ = 20 M/S
GeneralReferring to section 4 under "load calculations" it suffices tomention that only a limited set of load conditions was con-sidered. Thus the complete set of load conditions so asdiscussed in 5, was deliberated put aside. Applied were:
Class I : "Normal operating conditions", with thesubclasses: pmduntlon, starts/stops and idling.
Class II : "Faulted conditions", only for the purpose ofdemonstration: faulted pitch and faulted yaw.
The set of B calculations were structured as follows:B.01 : Load condition I, pmduntlon : Va < V~;B.02 : Load condition I, production : Vn >- V~t~;B.03 : Load condition I, start & stop : VH < Vr~,~;B.04 : Load condition I, start & stop : V~ _> Vr~;B.05 : Load condition I, idling : V~t < Vt~;B.06 : Load condition I, idling : Vn > Volt;B.07 : Combination of (B.01) and (B.02);B.08 : Combination of (B.01) up to and including (B.06);B.09 : Load condition IL uncontrolled pitching;BA0 : Load condition II, uncontrolled yawing;B.11 : Combination of (B.08), (B.09) and (B.10).
The calculation matrix is given below as table IV.
xxx
xx
not considered
notconsldered
not¢onsld*r~d
ResultsAll participants were asked to classify the components inorder to establish the partial safety factors for loads (PLSF).According to [1] the following classification is applicable:- Good access & high failure consq.: class 1; PLSF = 1.35;- Poor access & high failure consq. : class 2; PLSF = 1.20.All participants responded (RNL and TUD excepted). Theyclassified all three locations as diass 1, however with oneexception (TUDk) who classified RBCSi and RSCS as class2. This indicates that the regulatory requirements on thismatter are in need of a better specification of what is mentby good/poor accessibility.The internal loads were all calculated as time sefies for eachload case B. Both cases B.01 and B.02 were subsequentlysubdivided in 2 m/s wind speed intervals, except for TA. Ncfurther results are given here in view of the space neededtherefore; see for the relative importance of methods andload cases on fatigue: the following section.8. FATIGUE CALCULATIONS
For the basic approach see section 4 under "fatiguecalculations". In addition the following is mentioned. Thematerial fatigue data were supplied by TUDk. It sufficeshere to note that for RBCSi, RBCSo-Shail and RSCS thenumber of cycles to failure (N) is only a function of thestress/strain range while for RBCSo-spars both the mean andamplitude come into play. Concerning the effective fatiguequantity it turned out that all participants (no informationfrom RNL and TUD) used the cross-sectional normal stress/strain (for steel and GRP) with the exception that for RSCSboth CffiMAT and ECN used the yon Mises stressequivalent (for ECN: ~~~ = SC(~2+3O-’)~ in which:gc~/l~/).
Fatigue stress factorIf the calculated life time of a component of a wind turbinediffers from the design life time the question ~ises whetherthis difference is straightforward to interpret. This is not thecase as the problem of estxmating the life time is not alinear problem. Or to put things otherwise if two load orstress spectra intersect each other it is generally notimmediately clear which spectra is most severe, in order toovercome this problem there are different modes ofcomparisons, viz.:- life time factor;- fatigue stress factor (F~F);- equivalent one cycle per revolution fatigue stress;- equivalent one cycle stress.

- 11-
The use of the FSF-facmr (proposed by ECN) proved to bea very effective engineering quantity. It is defined as themultipllcetiou factor of the fatigue stress so that L~¢. = Ld~.;thus:
Note that if N is a function of o~.. and Aof than two FR-factors might be introduced one with regard to g~,. and theother with regard to ,’,o-f, viz.:
N(~g~ a, FSFArrr~)The fatigue stress factor is an effective engineering quantityto evaluate the amount of conservatism in terms of materialthicknesses or e~rurs in eitber the prevailing stress or thenumber of stress cycles. For thin shells for instance the FSF-vafue is a direct measure for the shell thickness margin. Forexample FSF ffi 1.30 means that the shell thickness can bereduced by about 30%. For a shaft however the FSF value isproportional to diam.3; thus FSF = 1.30 implies that thediamtor can be r~duced by at most 10%.
ResultsThe calculated FSF at different locations for three concernedcross-sections are compiled in the tables V through VII.From these data it appears that the lowest value of the FSFshow the following spread:- rotor inner cross-see0on : ~- 1.77 to 2.98- rotor outer cross-section : = 0.86 to 1.69- rotor sha~ : ~ 0.83 to 1.20
ECN JNL RNL SPE I TA "[UDk
1.74 5.27 2.I8 2.58 3.S5 4.762 2,23 2.55 2.68 3.66
31.65 1.36 0.96 1.02 1.70
5 1.22 1.77 0.94 0.90 1.786 3.27 2.50 1.45 2.I2 3.177 1.39 0.86 !.33 1.35
9 Log 1.72 0.97 1.752.2I [.72
/ o, ! ECN JNL { RNL SPE TA
IERC inn ] ECN [JNL RNL SPE TA TUDg
0.91 0.83 0.99 1.21 0.89 0.870.92 0,83 I07 1.21 0.89
0.83 0.86 1.20 0.890.92 0.83 0.88 1.22 0.S9
~0.880,870.88
0.84 1.20 0.89
As a preliminary conclusion it may be said that the sl)read
in FSF for the outer RBCS is too large (FSF -- 1.3 + 30%)and for both other cross-sections reasonable (both about± 25%) and in anyway not larger than the margin impliedby the application of the safety factor of 1.35. As anexample of the relative importance of the different loadcases and of the relative importance of damage related toenergy production (SDF values) see below and [141respectively.
* For location see end of paper
ROTOR BLADE INNER CROSS-SECTION: LOCATION 6
Case B01 B.02 B.03 B.04 B.0S 8.06 B,07 B.08 B.09 a.io
9. CONCLUSIONS AND RECOMMENDATIONS.
As the REFSTRESS project is not yet finished the followingconclusions are of a preliminary nature.
(01) It is for that if present available certification rules ateapplied to one and the same wind turbine the outcomeof tlae estimated life will differ too much.
(02) The firm adoption of one European standard isemphasized; the use of a recommended standard isdiscouraged. The European standard might be anadopted existing standard, supplemented with specificuetiouel]sim requirements.
(03) The state of the art of load spectra calculationsregarding the normal load condition "pmducfiun" ismore developed than that of start & stops, idlingandYur parking and certainly that of faulted andextreme conditions. In particuler for the faultadconditions the event tr~e and fault tree analyses can beused, but were hardly mentioned.
(04) A clear rationale sh~i1 be adopted on whether a loadcase is to be included in fatigue calculations or not. Arecommendaf, on has been given as a start off.
(05) In order to reduce the change that a wrong (too low)value of the partial load safety factor is chosen, theregnlato~ requirements on the matter "poor versusgood accessibility" must be improved.
(06) Compared to the maturity by means of which cress-sectional loads can be calculated, that regarding themodel0ng/deseription of turbulence seems to belacking, in particular in the low cycle wind speedranges. In fact three clearly different wind inputapproaches were appliad, viz.: that based on the powerdensity spectrum of the turbulence, a deterministicapproach (Dutch Handbook Method) and finally thatbased on a continuous "growing" wiud data matrix.Presently it is to early to draw fwm conclusions on thebest approach, though that based on PDS in itself hasthe best potential for further developments.
(07) In so far as measured data were available all calculatedresults were conservative, for example: C~ (Z.) showingbetter pefformanee than calculated; edgewise andflapwise range spectra showing smaller and for lessfrequent loads; ibid for pitch angle range and electricalpower range spectra;
(OS) Calculated natural frequencies show good agreementmutually as well as with measured data. Neverthelessdynamic responses of in particular the edgewisemoment and rotorshafl torque may differ too much.
(09) Presently the normal cross-sectional stresses (strain) isused 0,s the effective fatigue stress (strain). Hardly anyaccount is given to the effect of shear stresses.
(10) During the execution of the project two engineeringdesign quantities have been introduced, viz. the so-called fatigue stress factor (FSF) being directly relatedto the geometry of the concerned component. Forexample: FSF = 1.35 for a shell location means thatthe local shell thickness can be reduced by
(11) The overall spread in the minimum FSF valueswas large if not too large: "- 25% to _+ 30%.
(12) For the considered loading conditions that ofproduction below V,~ is most damaging and that ofabove V~t~ thereafter, the faulted conditions on yawand pitch are about of equal importance as that of"idiing~ below

- i2 -
{13) N summary from the designers’ poim of view the"Reference Procedure to Establish Fatigue Stresses forLarge Size Wind Turbines’~ shall be based on analyses.The analysis shall be structured on basis of loadconditions (as is presently the case). The amount ofdetail of the calculated Ioad spectra can best bevalidated by means of the so-called fatigue stressfactor. For values close to one (1.0 _+ 0.1) it must beconsidered whether sensitivity calculations have to becarried out.
10. REFERENCES
[1] V~ Hutle, F.J.L. (editor) Reconamendat~on for a European NthdTurbine Design Standard; Load cases and loads. Commission of theEuropean Commtmtty Directorate Gene~’al of El~ergy DG XVII. Fthal
Rotor blade inner cross section
Z
Rotor blade outer cross section
Rotor shaft at first bearing