Embed Size (px)
Citation preview
1
PROCEDURE FOR RESOLVING DIFFERENCES IN TEST RESULTSPROCEDURE FOR RESOLVING
DIFFERENCES IN TEST RESULTS
Olga Puzic
ETG Meeting09 15 2003Las Vegas

2
Tk 57
Tk 123
Sources of variability
= σm2 σo
2 σs2 σt
2+ + +
σtest2σo
2σm2
σs2
2σσσσTVariability is here to stay

3
The true value of a measured property can never be established exactly
All we ever get is an estimate of the true value
The test results always show some scatter as defined by
Repeatability and Reproducibility limits
xxxx
x
xxxx
Spec (min)
x

4
A dispute between supplier and receiver may arise whenever receiver’s result fails the specification value
XR= 0.98 kPaXS = 1.16 kPa Tk 123
SUPPLIER RECEIVER
DSRo Spec:1.00 kPa min

5
ASTM D3244
“Standard Practice for Utilization of Test Data to
Determine Conformance with Specification”
PROPOSAL
Define an AASHTO standard procedure for test results dispute resolution
Based on:
Reproducibility limitsfrom AASHTO precision tables
orRegional proficiency testing results

6
Condition Acceptable Range of TwoTest Results (d2s%)
Single operator PrecisionDSRo 9.5DSRr 11.0DSRp 22.4BBR-S 9.1BBR-m 4.0
Multi-laboratory PrecisionDSRo 29.1DSRr 31.3DSRp 56.1BBR-S 26.9BBR-m 13.0
DSR and BBR testing precision estimates
FromAASHTO T315
& AASHTO T313
precision tables
2.77 !!!! σσσσX_ !!!! 100
d2s%

7
“duplicate results obtained by the same operator should not be considered suspect unless their differenceexpressed as a percent of their mean exceeds the values in Column 2”
x1 -x2ave ×××× 100 <<<< 9.5%
x1 = 1.18 kPa
x2 = 1.05 kPa
x1-x2 = 0.13Ave = 1.115
Both results are unacceptable
Significance of repeatability (single-operator precision)
x1 -x2ave ×××× 100 = 11.7 %
Condition Acceptable Range of TwoTest Results (d2s%)
Single operator Precision (repeatability)DSRo 9.5
DSRr 11.0
DSRp 22.4
BBR-S 9.1
BBR-m 4.0
Application

8
“two test results obtained by two different operators testing the same material in different labs should not be considered suspect unless the difference expressed as a percent of their mean exceeds the values in Column 2”
XS -XRave ×××× 100 <<<< 29.1%
XS = 1.16 kPaXR= 0.98 kPa
XS - XR = 0.18Ave = 1.07
Both results are acceptable
XS -XRave ×××× 100 = 16.8 %
Significance of Reproducibility (multi-lab precision)
Condition Acceptable Range of TwoTest Results (d2s%)
Multi-lab Precision (Reproducibility)DSRo 29.1
DSRr 31.3
DSRp 56.1
BBR-S 26.9
BBR-m 13.0

9
Putting Reproducibility to work
10
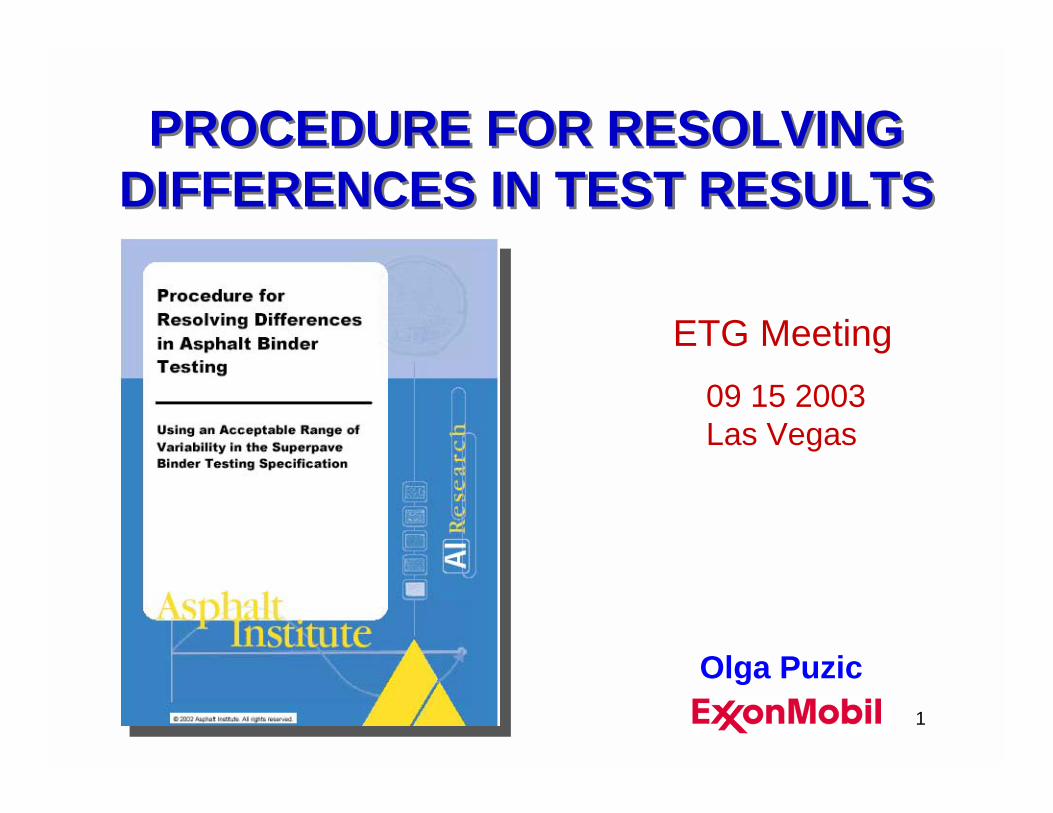
Executive Summary
The procedure described in ASTM D 3244 provides a logical approach to solving
disputes between suppliers and receivers based on the reproducibility of the test procedure. It is important for all parties
involved in specification testing to agree how to settle disputes before they occur.
For more information, contact:Asphalt Institute
Phone: (859) 288-4960Fax: (859) 288-4999
web address: www.asphaltinstitute.org
For more information, contact:Asphalt Institute
Phone: (859) 288-4960Fax: (859) 288-4999
web address: www.asphaltinstitute.org
Asphalt Institute Technical Bulletin
11
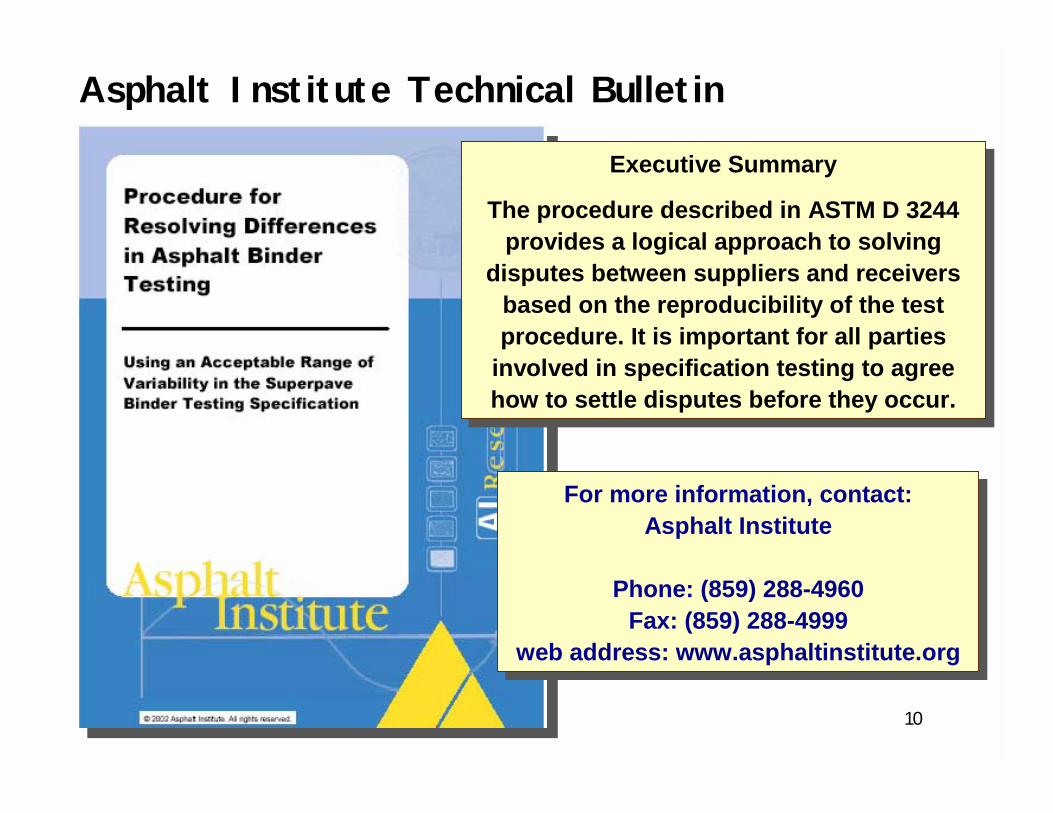
XS = 1.16 kPa XR= 0.98 kPa
All anybody ever gets is an estimate of the true value...
A better estimate of the true value
XS - XR <R
XS + XR
2ASSIGNED TEST VALUE
ATV

12
Calculate ATV
XS & XRwithin R
?Y
N RejectBOTH results
ATV within spec
?
ACCEPT
Y
N ATV within AL ?
ACCEPT
N
Y
REJECT
Obtain XS & XR(same sample)
START

13
* ASTM D3244“Standard Practice for Utilization of Test Data to Determine Conformance with Specification”
a numerical value that divides the regions of acceptable and unacceptable test results
Acceptance Limit *, AL
AL = Smin - 0.419 ×××× R
AL = Smax + 0.419 ×××× R
AASHTO Acceptable Range of two test results (d2s%) Specification Acceptance Limit
(measurement units)DSRo 29.1 1.00 min 0.88
DSRr 31.3 2.20 min 1.91
DSRp 56.1 5000 max 6175.30
BBR-S 26.9 300 max 333.81
BBR-m 13.0 0.300 min 0.28
AASHTO Acceptable Range of two test results (d2s%) Specification Acceptance Limit
(measurement units)DSRo 29.1 1.00 min 0.88
DSRr 31.3 2.20 min 1.91
DSRp 56.1 5000 max 6175.30
BBR-S 26.9 300 max 333.81
BBR-m 13.0 0.300 min 0.28

14
WCTG 2003 Acceptable
Range of two test results (d2s%)
Specification Acceptance Limit (measurement units)
DSRo 16.5 1.00 min 0.93DSRr 17.7 2.20 min 2.04DSRp 52.7 5000 max 6104BBR-S 22.7 300 max 329BBR-m 5.7 0.300 min 0.293DTT Stress 24.2 - naDTT Strain 130.6 1.00 max 1.55
WCTG 2003 Acceptable
Range of two test results (d2s%)
Specification Acceptance Limit (measurement units)
DSRo 16.5 1.00 min 0.93DSRr 17.7 2.20 min 2.04DSRp 52.7 5000 max 6104BBR-S 22.7 300 max 329BBR-m 5.7 0.300 min 0.293DTT Stress 24.2 - naDTT Strain 130.6 1.00 max 1.55
Acceptance Limits based on regional Reproducibility
(Rocky Mountain states)

15
In closing• The supplier should ship product only
if there is confidence that each property meets specification value.
• Individual measurement is only an estimate of the true value
• ATV is a better estimate of the true value
• If the two labs have no bias, ATV approach will resolve 99% of disputes
• A standard practice for resolving testing differences based on ASTM D3244 and established R is needed...
16
If time permits...If time permits...
AMRL PERFORMANCE

17
0
5
10
15
20
25
30
150 160 170 180 190
DSRoDSRr
'94 '97 '00 '03
COV% of AMRL samples 155 - 192
Significant improvement in DSR precision since ‘94 - ‘952003 sample COV% higher than expected

18
0
5
10
15
20
25
30
150 160 170 180 190
DSRoDSRrDSRp
'94 '97 '00 '03
G*sin δδδδ (PAV) (in)precision still a challenge...
COV%
COV% of AMRL samples 155 - 192
19
0
5
10
15
20
25
30
150 160 170 180 190
Creep Sm-value
'94 '97 '00 '03
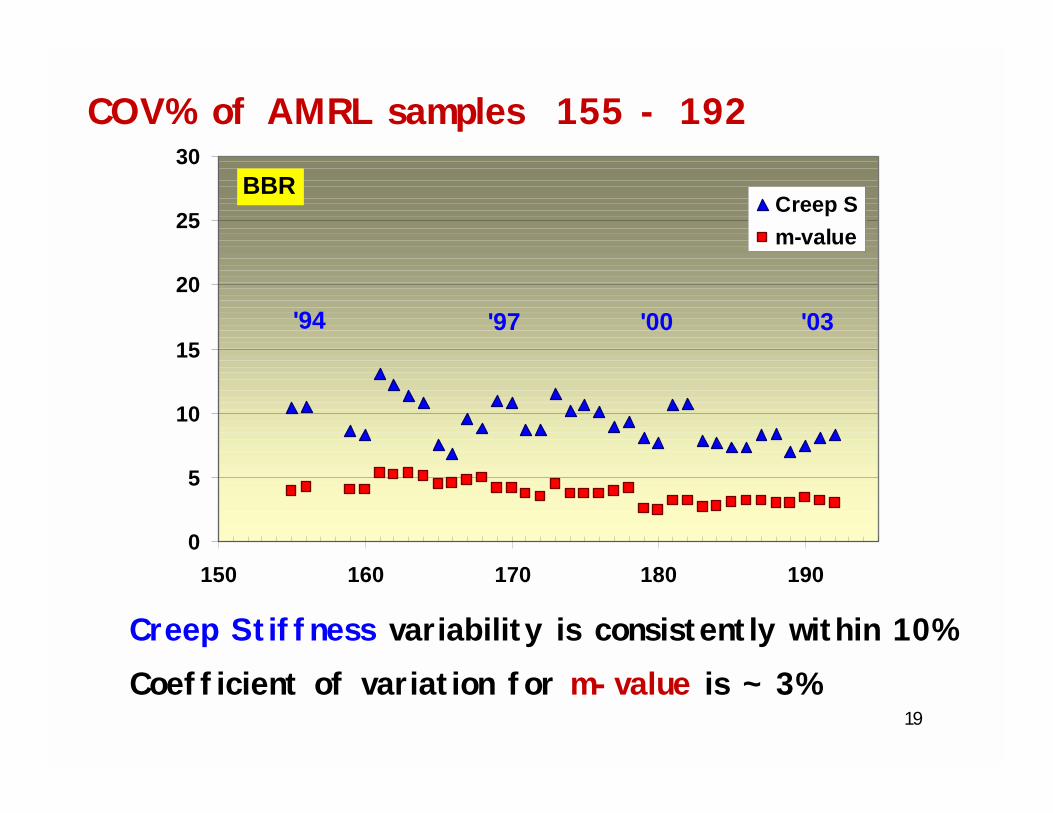
BBR
Creep Stiffness variability is consistently within 10%Coefficient of variation for m-value is ~ 3%
COV% of AMRL samples 155 - 192
20
010
2030
405060
7080
90100
150 160 170 180 190
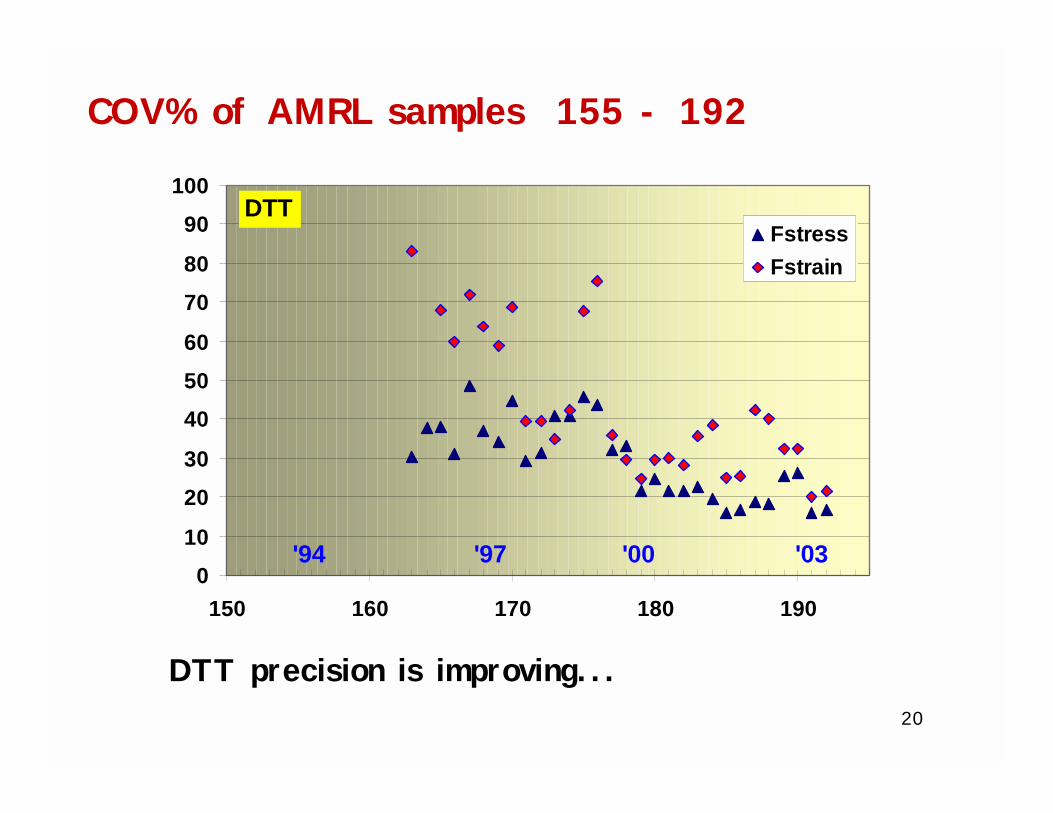
FstressFstrain
DTT
'94 '97 '00 '03
COV% of AMRL samples 155 - 192
DTT precision is improving...

21
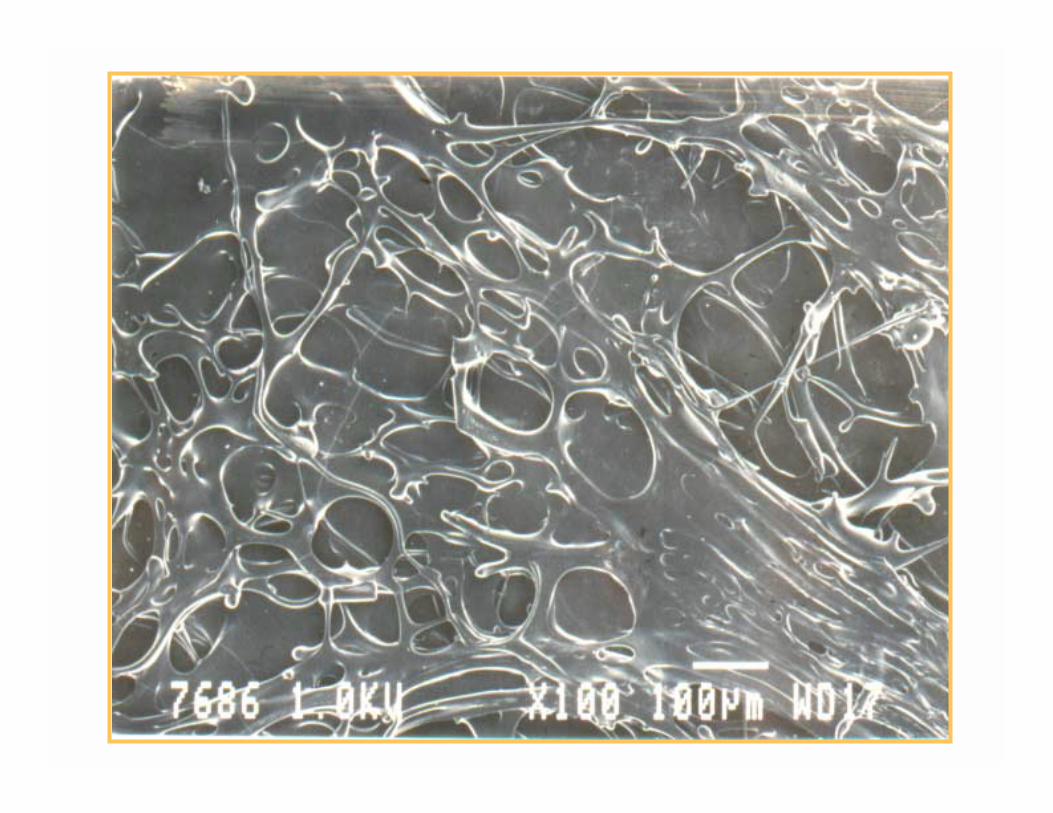
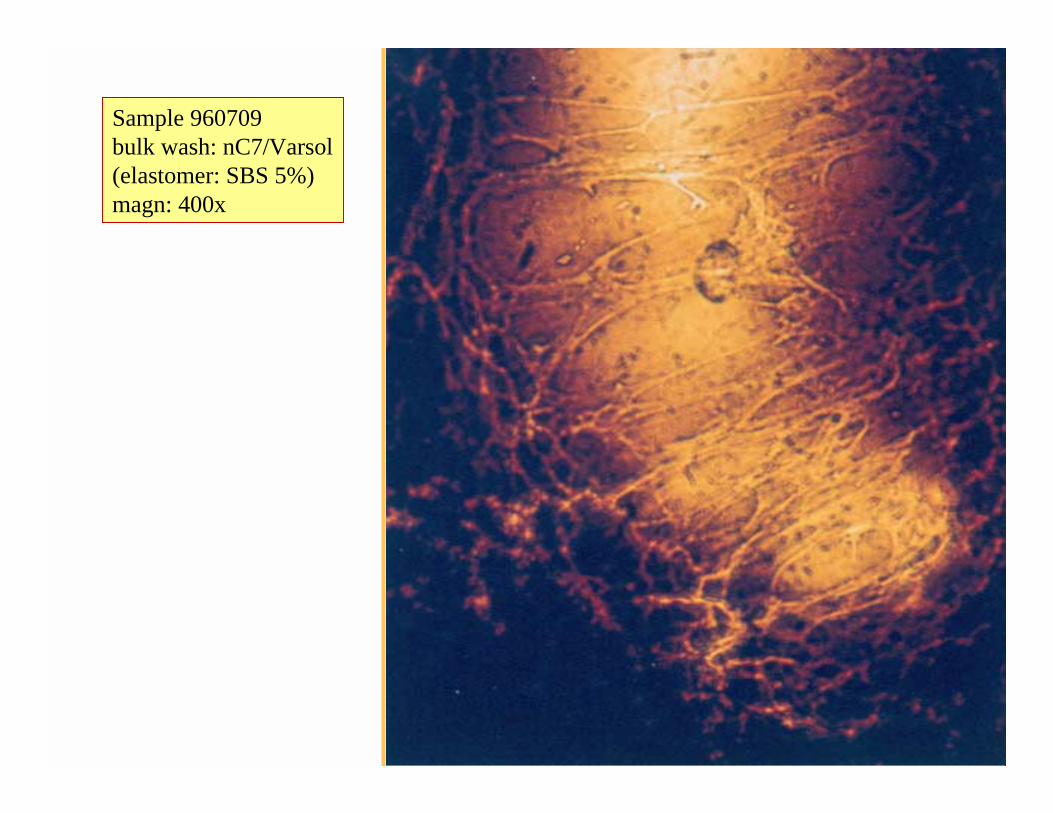
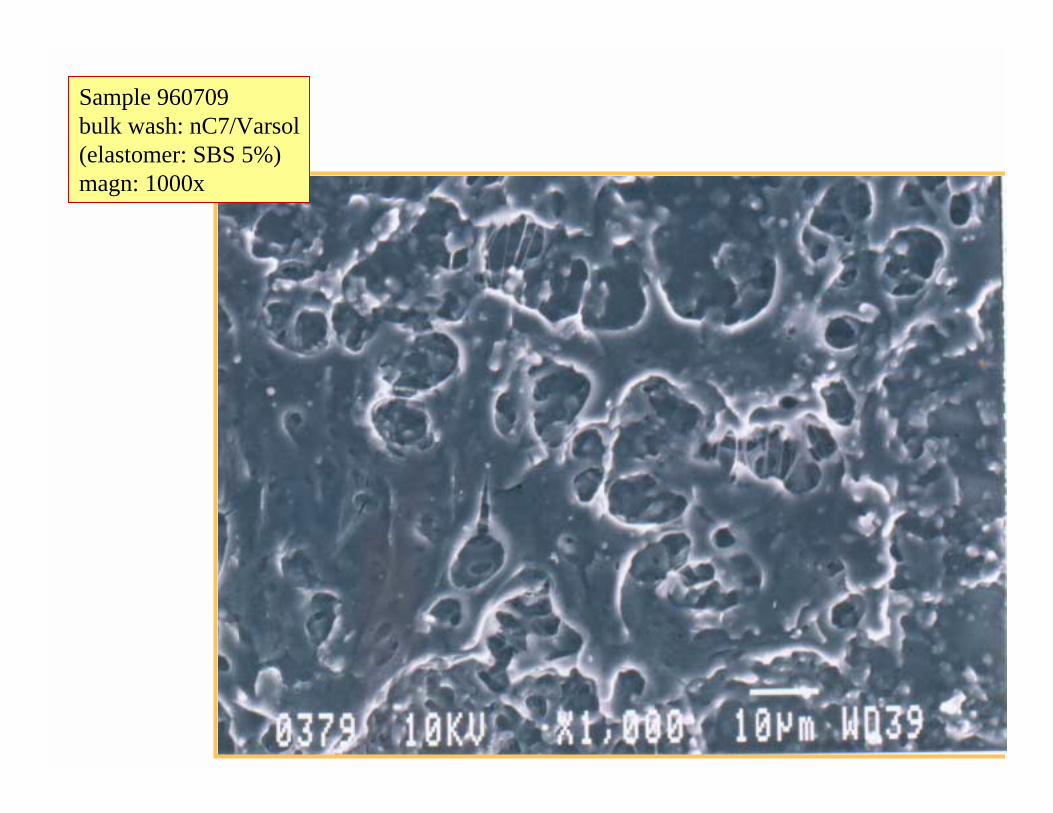
PMA MORPHOLOGY

22Sample: M93134
center of pen tin (40x)Sample: M93134
side of pen tin (40x)

23
Sample 920313 bulk: TCE wash

24
25

26

27
Sample 930316 bulk TCE wash
(plastomer: 4.5MI, low shear)magn: 50x
28
Sample 960709 bulk wash: nC7/Varsol(elastomer: SBS 5%)magn: 400x
29
Sample 960709 bulk wash: nC7/Varsol(elastomer: SBS 5%)magn: 1000x

30
Sample 960709 bulk wash: nC7/Varsol(elastomer: SBS 5%)magn: 5000x

31
PMApoured fresh,quench cooled
After 48h(@163 C)

32
Testing variability

330.00
1.00
2.00
3.00
4.00
5.00
6.00
7.00
46 52 58 64 70 76 82
Pour, 100°C, desc
Pour, 100°C, asc
10 Minute Pill, 100°C, desc
10 Minute Pill, 100°C,asc
Pour, 135°C, asc
Pour, 135°C, desc
10 Minute Pill, 135°C, asc
10 Minute Pill, 135°C, desc
4 Hour Pill, 135°C, desc
10 Minute Pill, 145°C, desc
Pour, 145°C, asc
DSR variability
PG 64-22

340.00
0.20
0.40
0.60
0.80
1.00
1.20
1.40
1.60
58 64 70 76 82
Pour, 100°C, desc
Pour, 100°C, asc
10 Minute Pill, 100°C, desc
10 Minute Pill, 100°C,asc
Pour, 135°C, asc
Pour, 135°C, desc
10 Minute Pill, 135°C, asc
10 Minute Pill, 135°C, desc
4 Hour Pill, 135°C, desc
10 Minute Pill, 145°C, desc
Pour, 145°C, asc
DSR variability
PG 64-22

350.00
0.50
1.00
1.50
2.00
2.50
64 70 76 82 88
DSRo Pour, 100°C, ascDSRo 1h Pill, 100°C, ascDSRo Pour, 135°C, ascDSRo 10 Min Pill, 135°C, ascDSRo Pour, 145°C, ascDSRo Pour, 145°C, descDSRo Pour, 160°C, ascDSRo Pour, 160°C, disc
DSRo variabilityPG 70-28 (PMA)

36
0
10
20
30
40
50
60
70
80
A (1h HS) B (1h HS + 1h LS) C (B+o/n LS)
Max
PG
Tem
p
DSRo (LW)DSRr (LW)
5% SBS in MBH
PG 70-XX
PG 28-XX
180 oC (356 oF)

37
PG Lines

38
46
52
58
64
70
76
-40 -34 -28 -22 -16
Min PG Temp, °C
Max
PG
Tem
p, °C
PG 64-22
PG 58-28
PG 52-34
Performance Grades
39
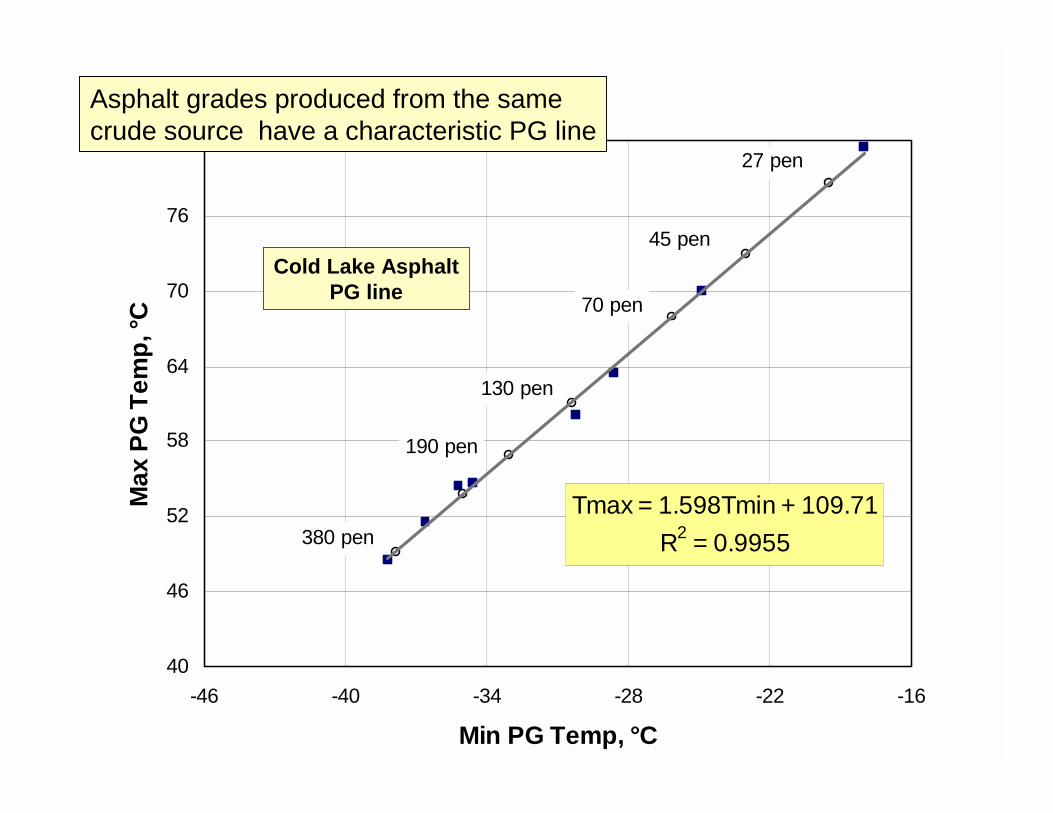
Tmax = 1.598Tmin + 109.71R2 = 0.9955
40
46
52
58
64
70
76
82
-46 -40 -34 -28 -22 -16
Min PG Temp, °C
Max
PG
Tem
p, °C
27 pen
45 pen
70 pen
130 pen
190 pen
380 pen
Asphalt grades produced from the same crude source have a characteristic PG line
Cold Lake AsphaltPG line

40
PG Lines for crudes
Tmax CB= 1.4038 Tmin + 105.33R2 = 0.9984
Tmax CA = 1.598 Tmin + 109.71R2 = 0.9955
Tmax CD= 1.4925 Tmin + 102.82R2 = 0.9993
40
46
52
58
64
70
76
82
-46 -40 -34 -28 -22 -16 -10
Min PG Temp, °C
Max
PG
Tem
p, °C
CA CB CD
41
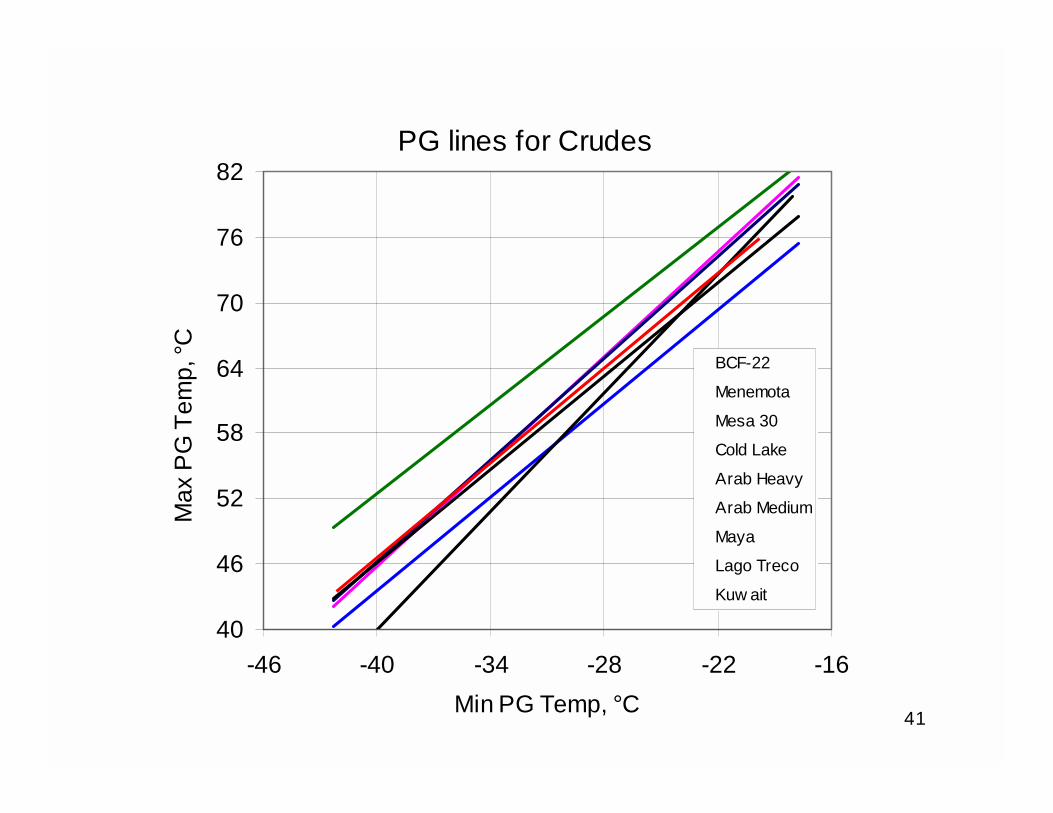
PG lines for Crudes
40
46
52
58
64
70
76
82
-46 -40 -34 -28 -22 -16Min PG Temp, °C
Max
PG
Tem
p, °C BCF-22
Menemota
Mesa 30
Cold Lake
Arab Heavy
Arab Medium
Maya
Lago Treco
Kuw ait
42
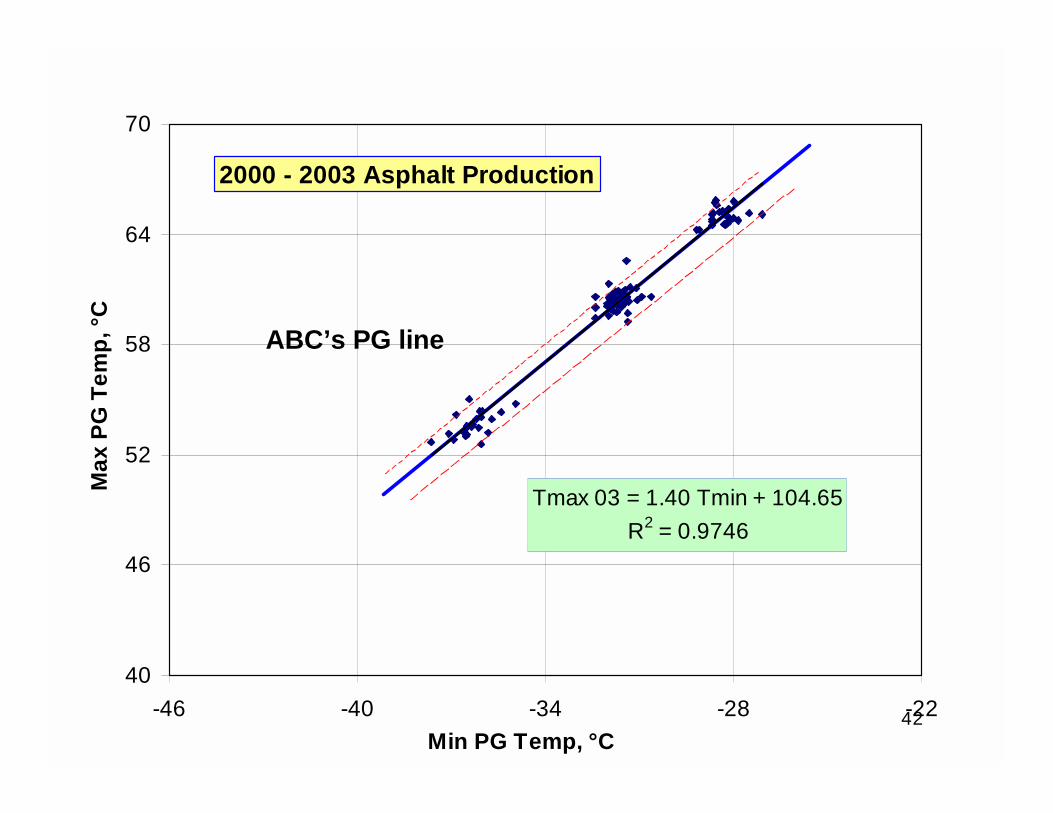
Tmax 03 = 1.40 Tmin + 104.65R2 = 0.9746
40
46
52
58
64
70
-46 -40 -34 -28 -22Min PG Temp, °C
Max
PG
Tem
p, °C
2000 - 2003 Asphalt Production
ABC’s PG line

43
Tmax 03 = 1.40 Tmin + 104.65R2 = 0.9746
40
46
52
58
64
70
-46 -40 -34 -28 -22
Min PG Temp, °C
Max
PG
Tem
p, °C
2000 - 2003 Asphalt Production