Embed Size (px)
Citation preview

Problem of Salinity in Coastal Aquifers of Tunisia
DR. MOHAMED FETHI BEN HAMOUDA
Fulbright Visiting Scholar Division of Earth and Ocean Sciences
Duke University, NC, USA
CNSTN, Isotope Hydrology and Geochemistry Unit, Tunisia
Kelibia Beach, Tunisia
University of Hawaii, Manoa Honolulu, April 2, 2015
1
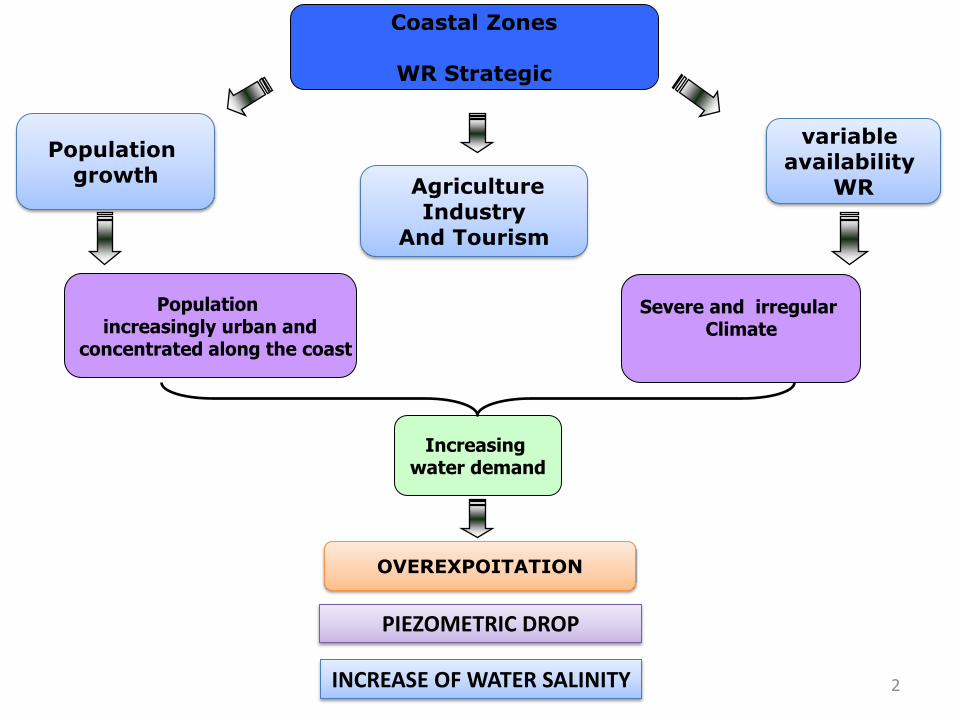
Agriculture Industry
And Tourism
Population growth
Severe and irregular Climate
Coastal Zones
WR Strategic
Population increasingly urban and
concentrated along the coast
variable availability
WR
Increasing water demand
OVEREXPOITATION
PIEZOMETRIC DROP
INCREASE OF WATER SALINITY 2
3
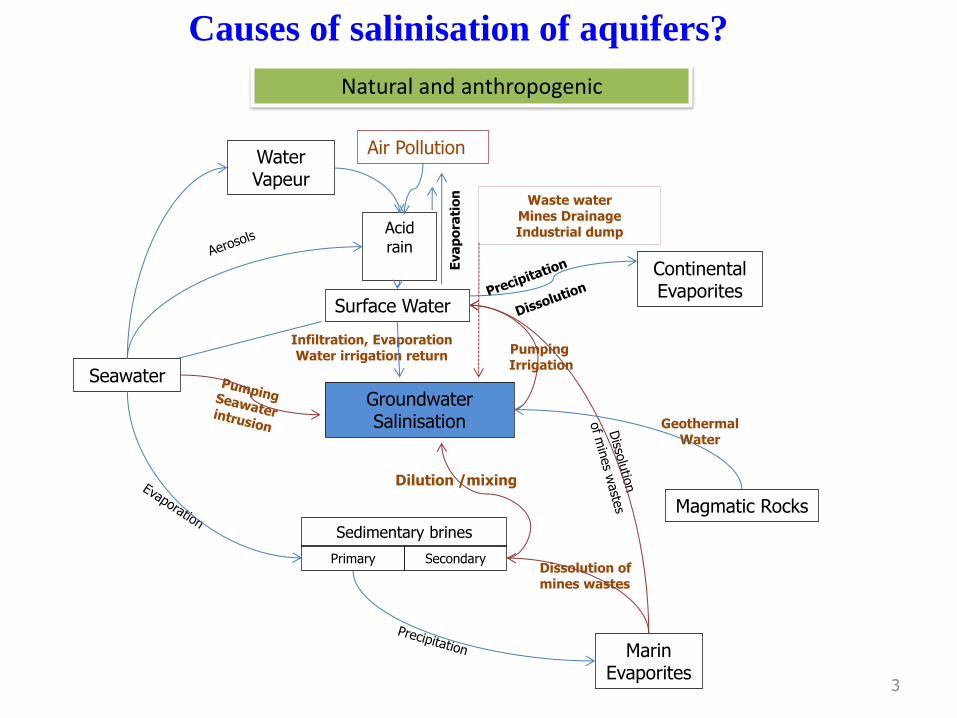
Seawater
Water Vapeur
Air Pollution
Waste water Mines Drainage Industrial dump
Groundwater Salinisation
Eva
po
rati
on
Surface Water
Marin Evaporites
Sedimentary brines
Primary Secondary
Dilution /mixing
Acid rain
Continental Evaporites
Pumping Irrigation
Dissolution of mines wastes
Geothermal Water
Infiltration, Evaporation Water irrigation return
Magmatic Rocks
Causes of salinisation of aquifers?
Natural and anthropogenic

4
What are the Consequences?
Environment: Loss of biodiversity: replacement by halotolerant species
Human health: inorganic pollutants:
Nitrates, Arsenic, Selenium, Boron and radioactivity
Immigration, exodus to the cities
Loss of fertile soils
Collapse of agricultural
Loss of fresh water: water-quality degradation
Economic and social

5
Geochimical and et Isotopic tools Tracers of salinity
Cations (Ca, Mg, Na, K) Anions (Cl, SO4, Br, NO3)
stable and radioactive Isotopes
18O, 2H, 13C, 3H, 14C

6
Sampling and measurement
Djeffara: 29 Sousse: 30 Côte orientale: 47 El Haouaria :35
Problem of salinity in four coastal aquifers

7
Climate and Hydrology
ETP = 1100, 1750, 1300 mm/a
P= 570, 440, 320, 180 mm/a
Sub humid to Semi arid and arid climate Mediterranean
(30°C )summer Hot (16°C ) Mild winter
• No perennials rivers
• Small rivers carry water
• Intense storm cause surface
runoff
• O. Laya and wadi akarit major wadis reaching the coast
• The wadis discharge into salty lakes
Hydrographic network and
Isohyetes Map of Tunisia

8
Evolution of exploitation
El Haouaria plain
Eastern Coastal
La Nappe profonde de la Côte Orientale0
20
40
60
80
100
120
1989
1990
1991
1992
1993
1994
1995
1996
1997
1998
1999
2000
2001
2002
2003
2004
(Nb
de f
ora
ge)
01
23
45
6
(Mm
3)
Nb de forages
Exploitation
La Nappe profonde d'El Haouaria
010
20
30
40
50
60
1989
1990
1991
1992
1993
1994
1995
1996
1997
1998
1999
2000
2001
2002
2003
2004
(Nb
de f
ora
ge)
01
23
45
6
(Mm
3)
Nb de forages
Exploitation
2000
2500
3000
3500
4000
4500
19
50
19
52
19
54
19
56
19
58
19
60
19
62
19
64
19
66
19
68
19
70
19
72
19
74
19
76
19
78
19
80
19
82
19
84
19
86
19
88
19
90
19
92
19
94
19
96
19
98
20
00
20
02
Déb
it (
l/s
)
Exploitation of Djeffara aquifer (1950-2003)
Expl-Djeffara 1950-2003 (l/s)
Djeffara-Gabès
Djeffara plain

9
0
2
4
6
8
10
12
14
16
18
juin-72 juin-77 juin-82 juin-87 juin-92 juin-97 juin-02 juin-07
Années
N.P
(m
)
P41
P42
Evolution of piezometry in El Haouaria plain
This decrease ranges from 1 to more than 14 m according to the location of the well
Average: 3.38 m
11 %
-8
-6
-4
-2
0
2
4
juin-72 juin-77 juin-82 juin-87 juin-92 juin-97 juin-02 juin-07
Années
N.P
(m
)
8862
8894
average: 2.83 m
5 %
Continued decline of piezometry 1 to over 11m
20
21
22
23
24
25
26
19
60
19
63
19
66
19
69
19
72
19
75
19
78
19
81
19
84
19
87
19
90
19
93
19
96
NP
(m
)
Métouia 6 (N°IRH )
Reducing artesian pressure Depletion wells Springs dry

10
0
1
2
3
4
5
6
1960 1965 1970 1975 1980 1985 1990 1995 2000 2005
Années
RS
(m
g/l
)8684 P19 9 892 8315
Temporal evolution of the salinity (g / l) at the Eastern coastal aquifer
Consequences

11
Geological block diagram at the Cap Bon (Ben Hamouda et al, 2011)
Quaternary covers the plain of El Haouaria
Miocene and Oligocene outcrop in Jebel Sidi Abderrahmane
Geological and Hydrogeological setting
Pliocene and Quaternary outcrop near the coast at the Eastern shallow aquifer

12
Hydrogeologic cross section SW-NE (Ben Hamouda et al, 2013)
Shallow unconfined
Deep confined

Hydrogeologic cross section in Djeffara aquifer (Ben Hamouda et al, 2013)
Four aquifers levels
13
Djeffara
Continental Intercalaire
Shallow: Quaternary (Pontien)
Miocene sands
Senonian limestone

Great
Oriental
Erg
14
North-western Sahara Aquifer System NWSAS
2.5 billion 3m in 2000 to 7,8 billion 3m in 2050

15

1200 km
The « Continental Intercalaire » (C.I.) aquifer
0 m
-1 km
-2 km
16

17

18
Plio-quaternary aquifer
Piezometric Maps
Main flow: O-E Alongside wadis and towards the sea
Nabeu
l
Korba
Kelibia
Mer
Méditerranée
Sidi Daoud
Azmour
El
Haouaria
Mer
Méditerranée
Dar
Allouch
0 2 4
Km
Flow south and north toward the center of the plain and moves towards the east and west
Quaternary aquifer
Characterized by a grounwater divide

19
Oued Laya Aquifer
Groundwater flow towards the sea
Groundwater flow towards the sea Groundwater is recharged by rain and runoff and from a vertical leakage (up flow) from Djeffara
Djeffara aquifer

Continental intercalaire Main flowpaths under the Great Oriental Erg
20
21
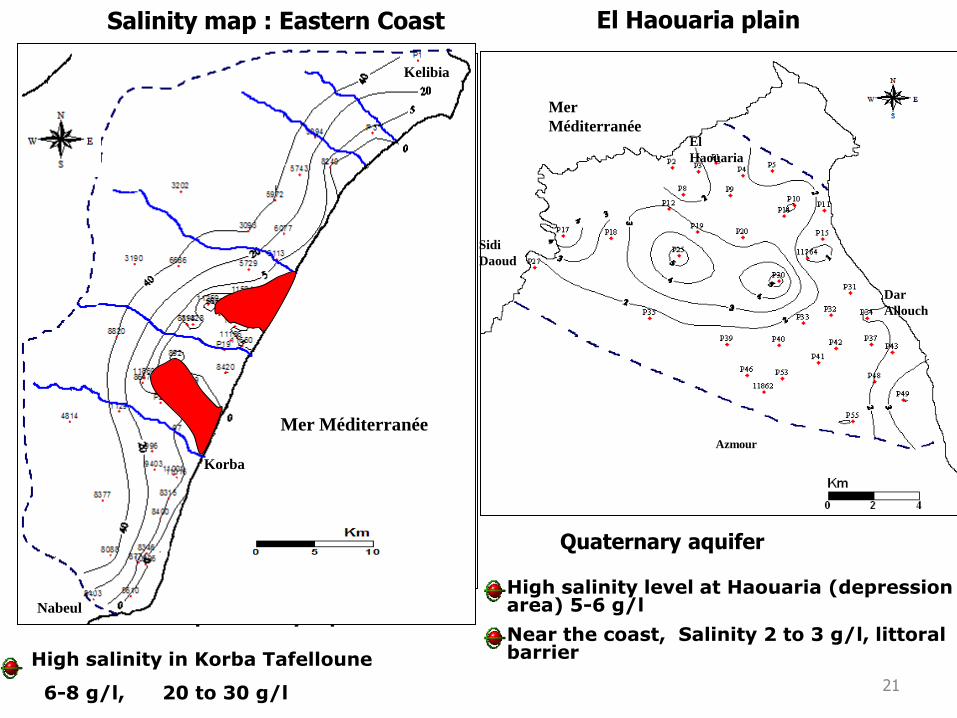
Salinity map : Eastern Coast
High salinity in Korba Tafelloune
6-8 g/l, 20 to 30 g/l
Plio-quaternary aquifer
10
8
Mer Méditerranée
Kelibia
Nabeul
Korba
Tafelloune
Menzel Horr
Menzel Temime
Béni Khiar
Nabeul
Korba
Kelibia
Mer Méditerranée
El Haouaria plain
High salinity level at Haouaria (depression area) 5-6 g/l
Sidi
Daoud
Azmour
El
Haouaria
Mer
Méditerranée
Dar
Allouch
Quaternary aquifer
Near the coast, Salinity 2 to 3 g/l, littoral barrier

22
Salinity map O. Laya
Salinity varies from 3 to 8 g/l
Salinity map nothern Djeffara
Salinity varies from 2 to 10 g/l

23
Estimation of the mixing with seawater
F sea is fraction of Seawater (0<F<1)
(Barbecot, 1999)
freshsea
freshsample
ClCl
ClClF
using chloride as a conservative tracer

24
Map of Estimation of mixing with seawater (%)
Max of SW is 70 % (13143/2)
Heterogeneity of processus Of salinisation
3 % in the 11829/2
66 % in the 11186/2
H: P 31 & P34, F< 1 % Confirmation absence of Seawater intrusion
the % SW 1 à 30 %
Mer Méditerranée
Kelibia
Nabeul
Korba

25
Mixted chemical profile
Anions: Cl> SO4 et HCO3
Cations: Na> Mg et Ca
Wells whose waters are contaminated by seawater are turning into Ca-chloride
water, different from seawater (NaCl water type).
Na-Cl and Ca-Cl water type
Piper Diagram

26
2 parallel trends
0
20
40
60
80
100
120
140
0 20 40 60 80 100
Na (
meq
/l)
Chloride (meq/l)
marine ratio Halite Djeffara
Sousse Haouaria Côte Orientale
Indicates contribution of Halite dissolution to the mineralisation GW
WRI Ion exchange Na –Ca Clay minerals + O.M
Na/Cl > 1 reflecting Income of Na to GW system
The [Na+]/[Cl-] relationship
Seawater intrusion: Na/Cl<sw
Na is retained and Ca is released

Sea spray Influence on the infiltrated rain water
0.0E+00
2.0E-03
4.0E-03
6.0E-03
8.0E-03
1.0E-02
0 10 20 30 40 50 60 70 80 90 100
Br/
Cl
(mo
lar)
Chloride (meq/l)
Seawater
Haouaria
Côte Orientale
Sousse
Relationship not distinctive
The [Br-]/[Cl-] relationship
Br/Cl=sw Seawater intrusion
A distinctive geochemical fingerprint
Brine contamination
27

28
-2
-1.8
-1.6
-1.4
-1.2
-1
-0.8
-0.6
-0.4
-0.2
0
0.2
0.4
0.6
0.8
1
0 10 20 30 40 50 60 70 80 90 100
SI G
yp
su
m
SO4 (meq/l)
Djeffara
Sousse
Haouaria
Côte Orientale
The SI gypsum / SO4 relationship
Precipitation, disolution and Ion exchange
Water is unsaturated Vs. gypsum and anydrite
Progressive Saturation Vs increase in SO4

29
High salinity linked to the geology : presence of gypsum
XRD Spectrum of gypsum found in the geologic formations

Isotopes Stables (2H, 18O) 1st group: -1 ‰ < 18O < -4 ‰ Probable seawater intrusion
2nd group: -4 ‰ < 18O< -5 ‰ Recharge from rainwater
-60
-50
-40
-30
-20
-10
0
-8 -7 -6 -5 -4 -3 -2 -1 0
d 2
H (
‰)
V-S
MO
W
d18O (‰) V-SMOW
Shallow Eastern Coast
Global meteoric water line GMWL
Local meteoric line of Tunis Carthage
Deep Eastern Coast
Djeffara
Shallow Haouaria
Deep Haouaria
SoussePaleowater
Recent Water
Mixing line with sea water
Old water
3rd group : -4.9 < 18O< -6 Fingerprint of old water.
4th group: Paleowater from CI and Djeffara
Plot of d2H ‰ Vs. d18O ‰ (V-SMOW)
30

31
Old water (100, 400 mg/l)
Seawater (SMOW, 19500)
Recent water (300, 2000 mg/l)
Sal: SWI + Evap.
Sal: WRI + C. Exch
Relation entre Cl- et d18O ‰ (V-SMOW)
1
10
100
1000
10000
100000
-8 -7 -6 -5 -4 -3 -2 -1 0
Ch
lori
des
(m
g/l
)
d18O (V-SMOW)
Shallow Eastern Coast
Deep Eastern Cost
Sea water
Tunis-Carthage rain
Shallow Haouaria
Deep Haouaria
Sousse
Djeffara
Marine pole
Tunis-Carthage rain pole
Old water
Recent water Paleowater
Relation 18O/[Cl-]
Paleowater (1000, 3000 mg/l)
Diss. Halite
Rain water (-4.4 ‰,10)

32
Plot of Tritium Vs Chlorides
0,0
2,0
4,0
6,0
8,0
10,0
12,0
0 500 1000 1500 2000 2500 3000 3500 4000
Chlorures (mg/l)
Tri
tiu
m (
U.T
)
Plio quaternaire
Miocène
Oligocène
Eau ancienne
Eau récente
Eau post-nucléaire
Group post-nuclear
Recharge durind last decade
Group recent water
Group Old water
0.0
2.0
4.0
6.0
8.0
10.0
12.0
0 500 1000 1500 2000 2500 3000
Chlorures (mg/l)
Tri
tiu
m (
UT
)
Quaternaire
Pliocène
Eau ancienne
Eau récente
Eau post-nucléaire
Le 3H identify
differents water types :
Low content in Cl Fast infiltration in the rivers
High salinity
3H (<1 UT)

0.0
1.0
2.0
3.0
4.0
5.0
6.0
-8.00 -7.00 -6.00 -5.00 -4.00 -3.00 -2.00
Oxygen-18 )‰(
3H
(T
U)
GAB 4
GAB 10a
GAB 14
GAB 15
GAB 21
all others
10
100
1000
0.1 1 10
Tritium (TU)
MR
T (
years
)
Map of distribution corrected ages in Oued Laya aquifer
(3H et 14C)
indicator of recent recharge
Correlation between tritium and δ18O in Djeffara aquifer
The coastal zone is an area of recent and renewable water. While the area located in S.O is that of older waters that exceeds 5000 years
33

Isotope contents in “deep” groundwaters –
Northern Africa mapping fossil groundwater
34

35
Rr (%)
Recharge
(Api)
Discharge
(Ani)
3H et 14C
(Ani)
Variation of reservoir (∑ Hn) (-5 to -11 %)
Conceptual schema of estimating of renewal rate is a simple model of vertical mixing. The model assumes an uniform isotopic facies throughout the thickness of the aquifer and a constant water storage, that is to say a discharge of water exactly compensated by infiltration of rain
Radioactive isotopes (3H et 14C) modeling of renewal rate
Leduc, (1996, 2000), Favreau, (2000, 2002), Le Gal La Salle, (2001) et Cartwright, (2007)

36
with : An i: Activity in groundwater for the year i Rr: Annual renewal rate of groundwater, An i-1 : Activity in groundwater for the year i -1, Pe : Period of radioisotope (14C or 3H), Api : Activity in rain for the year i.
(1)
(Leduc, 1996) )(1 /2ln
1 i
Pe
ii ApRreAnRrAn
(3H et 14C): Renewal rate estimation
1
1
1
1
/2ln
1 1/)(11i
n
ni
i
n
n
Pe
ii HApRrHeAnRrAn

37
110
100
1000
10000
1950
1960
1970
1980
1990
2000
Tri
tiu
m P
luie
s T
un
is C
art
hage(
UT
)
100
150
200
250
300
14C
Tro
posp
hèr
iqu
e (P
MC
)
Tritium (UT)
Tritium mediane
14C
14C: (Nydal et al, 1996)
Chronic reconstructed and extrapolated from annual levels of 3H in rain and from annual tropospheric levels for 14C since 1950

38
0,1
1
10
100
1000
0,01 0,1 1 10 100
Taux de renouvellement annuel Tr (%)
Tri
tiu
m d
an
s la n
ap
pe (
U.T
)
2001
1980
Annuel Renewal rate estimated from Tritium
0,1
1
10
100
0,01 0,1 1Taux de renouvellement annuel Tr (%)
Tri
tiu
m d
an
s la n
ap
pe (
U.T
)
2001
1980
3H= 4.4 TU (2001) et 20 TU (1980)
Rr = 0.2 % (2001) et 0.3 % (1980)
Lassoued, (1980)

39
The determination of renewal rate of the aquifer to estimate the recharge rate R = T . p . Rr
Avec: R : Recharge in mm/year Rr : renewal rate P : Porosity T : Thikness of the aquifer in m
H: T= 30 m, P= 14% R= 12 mm/y
Leduc, (1996, 2000) et Cartwright, (2007)
C.O: T= 43 m, P= 12% R= 10 en mm/an

40
Salinisation
Hydrochemical isotopic Data
Hydrogeologic information
Origin of salinity
Dissolution Of salts
(Halite+Gypsum)
Seawater Intrusion
1-70 % (CO) < 1% (H)
•Irrigation return flow • Sea spray
Semi Arid Coastal zone
Prevailing wind Mediterranean Sea
Recharge (rain) WRI
Cations exchange
•Piezo drop • Salinity map •Na/Cl Ratio •Br/Cl Ratio •isotopes 18O,2H
Evaporation
Near the salty lake

Thank you !
41

3000
4000
5000
6000
7000
8000
9000
10000
11000
12000
13000195
5196
0196
5197
0197
5198
0198
5199
0199
5200
0200
5201
0201
5202
0202
5203
0203
5204
0204
5205
0205
5206
0206
5
Evolution of the Tunisian population (1000.hab) source : Prévisions Démographiques Nationales, Institut National des Statistiques, Août 2005
42

43
Drinking Water: 300 Mm3
(30 m3/Cap/year) Industrial Water: 100 Mm3 ≈ (10 m3/Cap/year)
Tourist Water: 20 Mm3 ≈ (2 m3/Cap/year)
Agriculture : 2100 Mm3 ≈ (210 m3/Cap/year)

44
• is limited ~ 400 m3 /Cap/year • is non uniformly distributed In space & In time • is largely exploited (~ 80 %)

données : FAO www.fao.org/countryprofiles & INS Tunisie
In Tunisia, from 600 to 1400 m3/year/hab
500
700
900
1100
1300
1500
1960 1970 1980 1990 2000
m3/an/hab
45

Overexploited Aquifers in red (in 2000) source: Annuaires d’exploitation des nappes profondes & phréatiques, DGRE
46

< 1.5 g/L
1.5 to 3 g/L
> 3 g/L
Salinity of shallow aquifers (< 1.5 g/L; 1.5 to 3; > 3 g/L) 47