Embed Size (px)
Citation preview

Probable maximum precipitation and climate change
Kenneth E. Kunkel,1,2 Thomas R. Karl,2 David R. Easterling,2 Kelly Redmond,3
John Young,4 Xungang Yin,5 and Paula Hennon1,2
Received 13 February 2013; revised 4 March 2013; accepted 7 March 2013; published 12 April 2013.
[1] Probable maximum precipitation (PMP) is the greatestaccumulation of precipitation for a given durationmeteorologically possible for an area. Climate changeeffects on PMP are analyzed, in particular, maximizationof moisture and persistent upward motion, using bothclimate model simulations and conceptual models ofrelevant meteorological systems. Climate modelsimulations indicate a substantial future increase in meanand maximum water vapor concentrations. For the RCP8.5scenario, the changes in maximum values for thecontinental United States are approximately 20%–30% by2071–2100. The magnitudes of the maximum water vaporchanges follow temperature changes with an approximateClausius-Clapeyron relationship. Model-simulated changesin maximum vertical and horizontal winds are too small tooffset water vapor changes. Thus, our conclusion is thatthe most scientifically sound projection is that PMP valueswill increase in the future due to higher levels ofatmospheric moisture content and consequent higher levelsof moisture transport into storms. Citation: Kunkel, K. E.,T. R. Karl, D. R. Easterling, K. Redmond, J. Young, X. Yin, andP. Hennon (2013), Probable maximum precipitation and climatechange, Geophys. Res. Lett., 40, 1402–1408, doi:10.1002/grl.50334.
1. Introduction
[2] Climate change can be described in terms of the tem-poral evolution of the full probability density function(pdf) of variables that characterize the state of the atmo-sphere and the climate system. An important set of these var-iables have been designated as essential climate variables[GCOS, 2009]. Changes in the tails of the pdfs of some ofthese variables receive particular attention for climatechange impacts and risk assessment.[3] Increases in heavy precipitation events have been doc-
umented in many regions of the globe [IPCC, 2012] withsubstantial variations in the spatial distribution of statisti-cally significant trends [Bonin et al., 2011; Kunkel et al.,2013]. Similarly, most areas of the U.S. are projected tosee increases through the 21st century [IPCC, 2012],
including areas that did not have statistically significanttrends in the 20th century. Given these observed andprojected changes, precipitation-sensitive information andapplications would benefit from incorporation of best esti-mates of future changes, based on observed trends, modelprojections, or a combination of these.[4] One informational product used for planning, probable
maximum precipitation (PMP), is defined as the greatest ac-cumulation of precipitation for a given duration meteorolog-ically possible for a design watershed or a given storm areaat a particular location at a particular time of year [WMO,2009]. A better term for this concept might be potential max-imum precipitation (PMP) to avoid any confusion that suchan amount is probable, but instead, is potentially possible.A principal application for PMP values is the design of infra-structure for water retention (dams) or routing, where failurewould be catastrophic.[5] PMP values translate into a return period verymuch lon-
ger than the longest return periods traditionally used in appliedclimatology products, such as the 100 year return periodamount (the amount that in a stationary climate has a 1%chance of occurring any given year or on average once in ev-ery 100 years). For example, the 24 h, 100 year return periodamount for Urbana, IL, is about 175 mm, but the 24 h PMPamount ranges from about 225 mm for a 51,800 km2 area toover 900 mm for a 26 km2 area [Schreiner and Riedel, 1978].[6] The long lifetimes of dams and similar structures ensure
that they will experience the impacts of future climate change.We contend that in any future assessment of dam safety risk orother infrastructure where failure can lead to catastrophic con-sequences, ignoring climate change–induced new probabili-ties of extreme events, is likely to lead to a false sense ofsecurity. In this paper, we discuss the factors influencingPMP estimates for a range of time and space scales andwhether any statements can be made about future changes inthese factors.
2. Estimation of PMP
[7] PMP values are, in principle, most dependent upon at-mospheric moisture, transport of moisture into storms, persis-tent upward motion, and strong winds where orographic upliftis important [WMO, 2009; Trenberth et al., 2003]. The generalapproach, using data and physical judgment, is to estimate theprecipitation that would occur if all the relevant factors in aparticular place and situation achieved their optimum valuessimultaneously and remained in place for the specified dura-tion over the basin area. We review the factors below.
a. Convergence and vertical motion
[8] In past analyses, estimation of the maximum value ofhorizontal low-level wind convergence and upward motion
All supporting information may be found in the online version of thisarticle.
1NOAA Cooperative Institute for Climate and Satellites, NorthCarolina State University, Raleigh, North Carolina, USA.
2NOAA National Climatic Data Center, Asheville, North Carolina, USA.3Desert Research Institute, Reno, Nevada, USA.4University of Wisconsin-Madison, Madison, Wisconsin, USA.5ERT, Inc., Asheville, North Carolina, USA.
Corresponding author: K. E. Kunkel, National Climatic Data Center,151 Patton Avenue, Asheville, NC 28801, USA. ([email protected])
©2013. American Geophysical Union. All Rights Reserved.0094-8276/13/10.1002/grl.50334
1402
GEOPHYSICAL RESEARCH LETTERS, VOL. 40, 1402–1408, doi:10.1002/grl.50334, 2013

was not considered to have a robust theoretical basis. In-stead, the lengthy and numerous data records of precipitationhave been used to identify historical extreme observed stormprecipitation (Pstorm). Pstorm values serve as indirect mea-sures of maximum low-level moisture convergence and per-sistent upward motion.[9] Schreiner and Riedel [1978] developed the most recent
estimates of PMP values for much of the U.S. east of theRocky Mountains. They based their analysis on a set of 55extreme storms occurring at scattered locations during theperiod 1878–1972 whose precipitation totals constitute thePstorm set. These storms are assumed to approximate a maxi-mum for precipitation and vertical motion lasting for a givenduration. This set of the most extreme precipitation eventswas gleaned from the pooled data of the entire observingnetwork representing hundreds of thousands of station-yearsof data. As such, the implied return period of events of thismagnitude for any individual location is much longer than the95 years over which these events occurred. All of the stormsused in this eastern U.S. analysis were warm season events.The western U.S. is different, as most of the most extremeevents occur during fall or winter [e.g., Corrigan et al., 1999].
b. Atmospheric water vapor
[10] A second component entering into the empirical esti-mation of PMP is the maximum atmospheric total columnwater vapor (precipitable water, PW) that is possible for agiven location and season. The maximum possible value,PWmax, is estimated as the observed maximum historicalprecipitable water [Schreiner and Riedel, 1978].[11] A U.S. climatology of extreme PW values from
50 years of radiosonde observations (www.crh.noaa.gov/unr/?n=pw), representing a first-order approximation and adistribution of 50-year recurrence interval value, indicatesmaximum PW values of nearly 75 mm are found in summerfor stations near the Gulf Coast. Since the radiosonde net-work is relatively sparse in space (400 km mean spacing)and time (12 h interval between observations) and the periodof record is short in duration (only 50 years), these extremePW values probably underestimate PWmax, even in a station-ary climate. Although transient values within the cores ofstorms may be higher than the atmospheric conditions sam-pled by the radiosonde network [Holloway and Neelin,2010], such transient values are most likely not representa-tive of the inflow regions of storms.[12] The observed record of precipitation, extending back
to the late 19th century, is considerably longer than therecord of radiosonde observations. Thus, the PW estimatefor a climatology of maximum observed “storm events,”PWstorm, has previously been based upon the climatologyof maximum surface dewpoint temperatures persisting fora minimum duration of 12 h. Since the atmosphere duringtorrential rains of several hours duration (such as in tropicalcyclones) typically approaches a pseudoadiabatic tempera-ture state, this temperature-humidity profile has been as-sumed as a limiting extreme for PWmax [Schreiner andRiedel, 1978]. We believe this is an appropriate equilibriumassumption for linking PWmax to PMP. A criticism of thisassumption was presented by Chen and Bradley [2006],whose analysis of extreme events in the central U.S. indi-cated a 7% overestimate of PWmax using the above criteria.Their conclusion could be a result of surface humidity,
upper-level dryness, or storm dynamics peculiar to that geo-graphical region or undersampling by the short-term data re-cord. But any current overestimates would apply equally tofuture changes and our interest in this study is in changes rel-ative to current values.[13] Given the durations (6–72 h) for which PMP estimates
are made, sustained high moisture flow into storms is neces-sary. One meteorological type is “open” precipitating systemsfed by persistent large-scale winds and oceanic moisturesources far upwind. For example, on the west coast of the U.S., atmospheric rivers of deep tropical moisture from the PacificOcean [Dettinger, 2011] can extend inland and create intenseprecipitation over the upwind slopes of the mountain ranges.For the eastern half of the U.S., the major source of moistureis the Atlantic Ocean/Caribbean Sea/Gulf of Mexico.[14] Some extreme rains over days are associated with
“closed” precipitating systems which depend on more local-ized sources of water. The best example is a stationary tropicalcyclone over a coastline next to a warm ocean; such eventshave produced historic PMP events, reflecting a strong posi-tive feedback system involving surface wind, evaporativemoisture supply, and precipitation and condensational heatingto sustain the energy of the winds [Price, 1981]. However,these isolated storms also experience negative feedbackslimiting the supply of moisture and the lifetime of the system,including subsidence of dry air around the storm periphery,and wind-induced evaporative cooling of the ocean beneath,reducing the oceanic source moisture [Schade, 2000].[15] For shorter time scales and smaller basins, some me-
soscale convective systems may be relevant to PMP. Thesesystems are normally propagating and are partially “open”as they traverse humid air masses. Their lifetime is oftenlimited by the negative feedback of subsidence of cooled,dry air to the surface. Such systems may be sustained in aregion of weak (or negative) upper-level inertial stability,which encourages the divergent branch of the convectivecirculation [Coniglio et al., 2010].
c. Physical synthesis: Linking PMP and atmosphericwater vapor
[16] Traditionally, the calculation of PMP assumes a statisticalequilibrium relationship between PMP and PWmax linking the“storm event” data (i.e., Pstorm) with estimates of extreme values:
PMPest=PWmax ¼ Pstorm=PWstorm ¼ Ncycles (1)
indicating that PMPest increases proportionately to PWmax asinferred from dewpoint temperature, for a given storm cli-matology. Ncycles is the number of water replacement cyclesfor the column during the duration of precipitation, and theunderlying assumption is that Ncycles is the same for thePMP calculation as for the storm data.Expression (1) can al-ternatively be expressed as the ratio of time scales
Ncycles ¼ tdurð Þ= trepl� �
(2)
where (trepl) is the replacement time scale for the water in thecolumn and (tdur) is duration time over which the totalprecipitation is accumulated. Since air rises over the depth ofthe rain system H in time (trepl), its average vertical velocity isW=H/(trepl). Hence, we can further rewrite any of the above as
W=H ¼ Prate=PW (3)
KUNKEL ET AL.: PMP AND CLIMATE CHANGE
1403

where Prate =P/(tdur) is the average precipitation rate(intensity) over the duration (tdur). Thus, these relationshipsreflect the underlying assumption in PMP estimation that theaverage vertical motion for the equilibrium assumption is as-sumed to be the same for the PMP case as for the storm data.Thus, W, as calculated here, is an “efficiency” parameterrepresenting the estimate of maximum persistent upwardvertical motion (Wmax) consistent with the column waterbudget in an extreme precipitation event. Over topographywith slope S, one expectsW to be proportional to the productof upstream wind and S.[17] For the aforementioned example of the point 24 h
PMP at Urbana, IL, the maximum PW at this site is roughly64 mm. This leads to a value of Ncycles of about 15, an ap-proximate replacement time scale of slightly less than 2 h,and an average vertical velocity of about 1.5 m s�1. Thevalues of PMP for basins decrease with increasing basin sizebecause Pstorm values decrease as the size of the area overwhich precipitation is averaged increases. For the locationof Urbana, the 24 h PMP value for an area of 51,800 km2
(the largest area estimated by Schreiner and Riedel [1978]is about 230 mm, about ¼ the point value, andW is similarlyreduced to about 0.4 m s�1.
3. Possible Effects of Climate Change on ExtremePrecipitation
[18] The radiative energy imbalance caused by increasesin greenhouse gas concentrations is highly likely to continuethe increases in ocean heat storage and a rise in sea surfacetemperatures (SSTs) that have already been observed[Trenberth et al., 2007]. The warming ocean will in turn leadto a rise in evaporation and atmospheric water vapor content,following the Clausius-Clapeyron relationship for saturationwater vapor pressure. A probable consequence is the intensi-fication of the hydrologic cycle and PMP over land andocean. The effect of this intensification on changes in PWmax
values over land was investigated by analyzing future(2041–2070 and 2071–2100) and control (1971–2000) sim-ulations from the Coupled-Model Intercomparison Projectphase 5 (CMIP5) archive. Seven GCM simulations were ex-amined (listed in supplementary online material). The modeldata were first regridded to a common grid of 2� latitude by2.5� longitude, comparable to the largest basin sizes forPMP applications. For each grid point, the maximum valueover the entire 30 year period of the 12 h persisting PW(PWmax) was identified. Finally, a multimodel mean mapwas produced. The analysis was performed for two represen-tative concentration pathways (RCP), the RCP4.5 and theRCP8.5.[19] Figure 1 shows the global pattern of maximum PW
(top) and its projected percentage changes for 100 years inthe future (middle). The analysis reveals projected increasesacross all grid cells, indicating general global moistening ofthe atmosphere. The overall global patterns of contemporaryPWmax (top) and the absolute magnitudes of the future dif-ferences (supplementary online material) are very similar:moisture increases are a maximum in regions where theyare currently large. These changes in PW content representchanges in the pattern of latent energy content and are fo-cused in the tropical belt of latitudes, particularly the oceanicITCZs, western Pacific warm pool, and adjacent Asianmonsoon regions.
[20] The patterns of fractional percentage changes (middle)are quite different from that of absolute changes, indicatingsomewhat larger changes toward the poles. Over large partsof the Northern Hemisphere, the percentage increases are inthe range of 20%–30% by 2071–2100. At high latitudes andover some land areas, particularly Eurasia, the increases aremore than 30% by the end of the 21st century. For NorthAmerica and surrounding ocean areas, there are increases of20%–30% by 2071–2100 with the greatest increases overthe western U.S. (where the actual PWmax values remainrelatively low).[21] The results for 2041–2070 and for the RCP4.5 simula-
tions (supplementary online material) indicate increases for2041–2070 of roughly half of the 2071–2100 results and forRCP4.5 about half of the results of the RCP8.5 simulations,in approximate correspondence to the difference in green-house radiative forcing. The fractional changes in mean watervapor concentrations (not shown) are larger, but only by asmall amount, than the changes in the maximum values shownin Figure 1. The maximum values of PW typically occur inJuly or August in most of the contiguous U.S., except alongthe west coast, where a fall (either September or October)maximum is simulated (results not shown).[22] The increases in PWmax are a robust result in the model
simulations and have a strong theoretical basis, the Clausius-Clapeyron equation, linking the increases to increasing tem-perature. The PWmax increases are large and, if incorporatedinto PMP estimates, would have major implications for designof dams and other long-lived and critical runoff control struc-tures. An important question then is whether any other meteo-rological factors may change in ways that offset, or add to, theexpected changes in PMP attributed to an increase in PW. Thekey issue is whether the vertical motion “efficiency” variableW changes in the future. From equation (3), logarithmic differ-entiation equates the difference in fractional changes of PWand PMP to that of W. Over resolved sloping topography,the fractional change of W would be proportional to that ofthe upslope wind component.[23] Although previous assessments of PMP assumed that
there is no theoretical basis for determining a maximumvalue of vertical motion, there are conceptual simplificationsfor the space and time scales of PMP. Spatially, the scales ofPWmax and PMP are rather large away from sharp topogra-phy. The relatively long durations of PMP applications(several hours to days) are also long compared to the timescale of transient convective elements. It follows that anidealized subsynoptic scale model of intense, persistent rainevents can consist of a steady state, two-dimensional flow ofsaturated (moist adiabatic) atmosphere columns convergingtoward the precipitation zone.[24] Following the discussion in section 2b, these examples
illustrate the type of situations that may result in PMP events:
• Radial inflow of high PW air into a slow-moving tropicalcyclone and ascent in the inner wall rainband (e.g., the U.S. 24 h rainfall record of 1092 mm at Alvin, TX, duringHurricane Claudette in July 1979 [Hebert, 1980]; thisvalue is close to the 24 h PMP value of approximately1200 mm).
• Flow of moist air toward an extratropical cyclone front thatis stationary as a result of synoptic-scale flow (e.g. Illinoisstate record 24 h rainfall of 430 mm at Aurora on 18 July1996) [Changnon and Kunkel, 1999].
KUNKEL ET AL.: PMP AND CLIMATE CHANGE
1404

• Sustained low-level jet sustaining a mesoscale convectivesystem (e.g., the Nashville, TN flood of 1–2 May 2010 with48 h rainfall exceeding 400 mm) [Moore et al., 2012].
• Upslope advection of moist air masses by synoptic-scalewinds encountering mountainous topography (e.g., the6–7 November 2006 event in Washington and Oregon,where 3 day rainfall exceeded 700 mm) [Neiman et al.,
2008]. The persistence of topographically forced PMPevents is then due to the synoptic-scale wind system.
[25] How will climate warming affect these types of mete-orological phenomena? Knutson et al. [2010] assessed thestate of knowledge regarding future projections of tropicalcyclones. They indicated rainfall rates were likely to
Figure 1. Fractional changes (%) ofmaximum precipitable water (PWmax) and upwardmotion (omin) projected by seven CMIP5climate models. These are multimodel mean differences (future minus present) in the 30 year maximum values under the RCP8.5scenario, for 2071–2100 relative to the 1971–2000 reference value for (middle) 12 h precipitable water and (bottom) 6 h upwardmotion. (top) The 30 year maximum precipitable water for 1971–2000 (mm), averaged over the same seven climate models.
KUNKEL ET AL.: PMP AND CLIMATE CHANGE
1405

increase due to the general increase in water vapor concen-trations based on theoretical considerations and high-resolution climate models. They estimated increases of+20% near the tropical cyclone center by the late 21st
century under the A1B emissions scenario. For stationaryfronts, studies of extratropical cyclones in the CMIP5models find mixed changes [Colle et al., 2013] in the easternU.S. with roughly equal areas of increases and decreases;thus, there does not appear to be a compelling reason toexpect large changes in the maximum vertical motionproduced by extratropical cyclones. Regarding atmosphericrivers, Dettinger [2011] finds that extreme atmospheric riverepisodes in the western U.S. actually increase in amultimodel ensemble from CMIP3.
[26] To further explore these characteristics in the CMIP5simulations, fractional changes (%) in three relevantmodeled variables were analyzed: the 30 year maximumvalues of (a) 6 h upward motion (omin where o= dP/dt andP= pressure), (b) 6 h horizontal wind speed, and (c) dailyprecipitation. The results for omin for RCP8.5 for 2071–2100are shown in Figure 1 (bottom). Note that these values are rel-evant to the largest scales for which PMP estimates are pro-vided, as the model resolution is not sufficient to resolvesmall-scale upward motion and intense precipitation. The dif-ferences between 2071–2100 and 1971–2000 over the contig-uous U.S. are mostly positive, and both the positive andnegative magnitudes are mostly less than 10%, considerablysmaller than the water vapor increases. Thus, the model
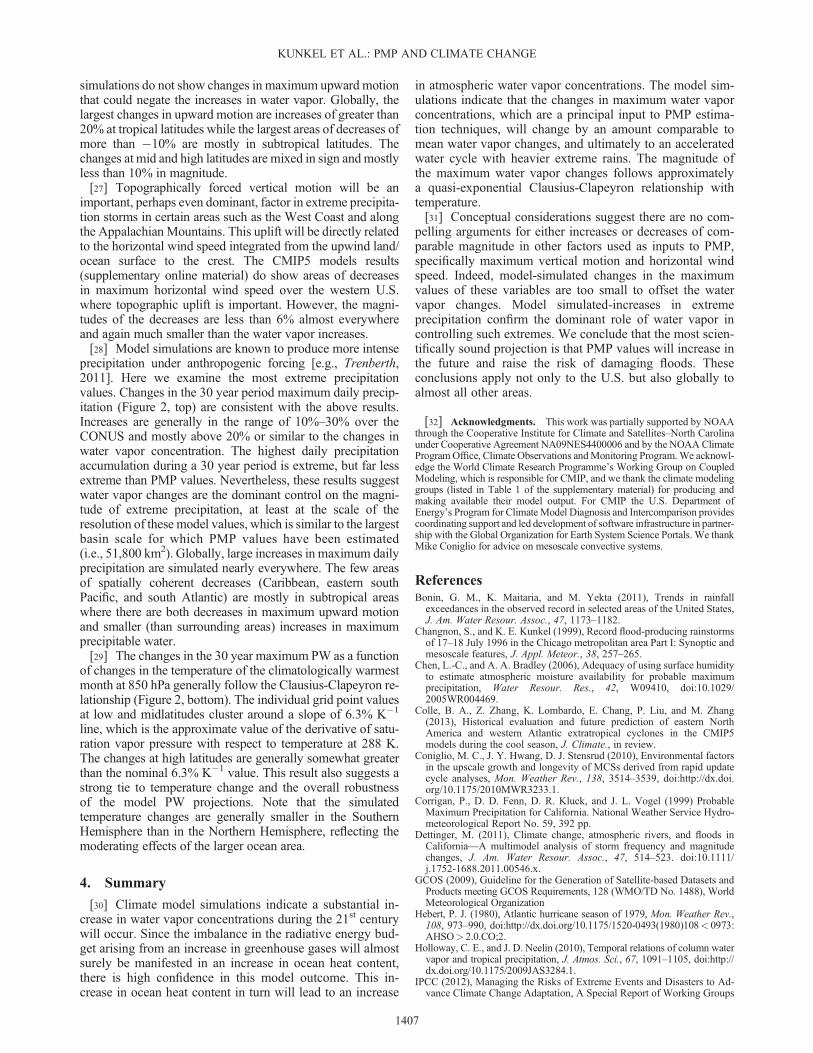
Figure 2. Fractional changes (%) of precipitation and PWmax projected by seven CMIP5 climate models. (top) These aremultimodel mean differences (future minus present) in the 30 year period maximum daily precipitation for 2071–2100 underthe RCP8.5 scenario, relative to the 1971–2000 reference value. (bottom) A scatterplot of grid point differences (future minuspresent) of the 30 year maximum precipitable water versus 30 year average temperature of the climatologically warmest monthat 850 hPa for 2071–2100 with respect to 1971–2000 for the RCP8.5 scenario. The straight line represents a slope of 6.3% K�1,the approximate value of the derivative of the saturation vapor pressure with respect to temperature at 288 K.
KUNKEL ET AL.: PMP AND CLIMATE CHANGE
1406
simulations do not show changes in maximum upward motionthat could negate the increases in water vapor. Globally, thelargest changes in upward motion are increases of greater than20% at tropical latitudes while the largest areas of decreases ofmore than �10% are mostly in subtropical latitudes. Thechanges at mid and high latitudes are mixed in sign andmostlyless than 10% in magnitude.[27] Topographically forced vertical motion will be an
important, perhaps even dominant, factor in extreme precipita-tion storms in certain areas such as the West Coast and alongthe Appalachian Mountains. This uplift will be directly relatedto the horizontal wind speed integrated from the upwind land/ocean surface to the crest. The CMIP5 models results(supplementary online material) do show areas of decreasesin maximum horizontal wind speed over the western U.S.where topographic uplift is important. However, the magni-tudes of the decreases are less than 6% almost everywhereand again much smaller than the water vapor increases.[28] Model simulations are known to produce more intense
precipitation under anthropogenic forcing [e.g., Trenberth,2011]. Here we examine the most extreme precipitationvalues. Changes in the 30 year period maximum daily precip-itation (Figure 2, top) are consistent with the above results.Increases are generally in the range of 10%–30% over theCONUS and mostly above 20% or similar to the changes inwater vapor concentration. The highest daily precipitationaccumulation during a 30 year period is extreme, but far lessextreme than PMP values. Nevertheless, these results suggestwater vapor changes are the dominant control on the magni-tude of extreme precipitation, at least at the scale of theresolution of these model values, which is similar to the largestbasin scale for which PMP values have been estimated(i.e., 51,800 km2). Globally, large increases in maximum dailyprecipitation are simulated nearly everywhere. The few areasof spatially coherent decreases (Caribbean, eastern southPacific, and south Atlantic) are mostly in subtropical areaswhere there are both decreases in maximum upward motionand smaller (than surrounding areas) increases in maximumprecipitable water.[29] The changes in the 30 year maximum PW as a function
of changes in the temperature of the climatologically warmestmonth at 850 hPa generally follow the Clausius-Clapeyron re-lationship (Figure 2, bottom). The individual grid point valuesat low and midlatitudes cluster around a slope of 6.3% K�1
line, which is the approximate value of the derivative of satu-ration vapor pressure with respect to temperature at 288 K.The changes at high latitudes are generally somewhat greaterthan the nominal 6.3% K�1 value. This result also suggests astrong tie to temperature change and the overall robustnessof the model PW projections. Note that the simulatedtemperature changes are generally smaller in the SouthernHemisphere than in the Northern Hemisphere, reflecting themoderating effects of the larger ocean area.
4. Summary
[30] Climate model simulations indicate a substantial in-crease in water vapor concentrations during the 21st centurywill occur. Since the imbalance in the radiative energy bud-get arising from an increase in greenhouse gases will almostsurely be manifested in an increase in ocean heat content,there is high confidence in this model outcome. This in-crease in ocean heat content in turn will lead to an increase
in atmospheric water vapor concentrations. The model sim-ulations indicate that the changes in maximum water vaporconcentrations, which are a principal input to PMP estima-tion techniques, will change by an amount comparable tomean water vapor changes, and ultimately to an acceleratedwater cycle with heavier extreme rains. The magnitude ofthe maximum water vapor changes follows approximatelya quasi-exponential Clausius-Clapeyron relationship withtemperature.[31] Conceptual considerations suggest there are no com-
pelling arguments for either increases or decreases of com-parable magnitude in other factors used as inputs to PMP,specifically maximum vertical motion and horizontal windspeed. Indeed, model-simulated changes in the maximumvalues of these variables are too small to offset the watervapor changes. Model simulated-increases in extremeprecipitation confirm the dominant role of water vapor incontrolling such extremes. We conclude that the most scien-tifically sound projection is that PMP values will increase inthe future and raise the risk of damaging floods. Theseconclusions apply not only to the U.S. but also globally toalmost all other areas.
[32] Acknowledgments. This work was partially supported by NOAAthrough the Cooperative Institute for Climate and Satellites–North Carolinaunder Cooperative Agreement NA09NES4400006 and by the NOAAClimateProgramOffice, Climate Observations andMonitoring Program.We acknowl-edge the World Climate Research Programme’s Working Group on CoupledModeling, which is responsible for CMIP, and we thank the climate modelinggroups (listed in Table 1 of the supplementary material) for producing andmaking available their model output. For CMIP the U.S. Department ofEnergy’s Program for Climate Model Diagnosis and Intercomparison providescoordinating support and led development of software infrastructure in partner-ship with the Global Organization for Earth System Science Portals. We thankMike Coniglio for advice on mesoscale convective systems.
ReferencesBonin, G. M., K. Maitaria, and M. Yekta (2011), Trends in rainfallexceedances in the observed record in selected areas of the United States,J. Am. Water Resour. Assoc., 47, 1173–1182.
Changnon, S., and K. E. Kunkel (1999), Record flood-producing rainstormsof 17–18 July 1996 in the Chicago metropolitan area Part I: Synoptic andmesoscale features, J. Appl. Meteor., 38, 257–265.
Chen, L.-C., and A. A. Bradley (2006), Adequacy of using surface humidityto estimate atmospheric moisture availability for probable maximumprecipitation, Water Resour. Res., 42, W09410, doi:10.1029/2005WR004469.
Colle, B. A., Z. Zhang, K. Lombardo, E. Chang, P. Liu, and M. Zhang(2013), Historical evaluation and future prediction of eastern NorthAmerica and western Atlantic extratropical cyclones in the CMIP5models during the cool season, J. Climate., in review.
Coniglio, M. C., J. Y. Hwang, D. J. Stensrud (2010), Environmental factorsin the upscale growth and longevity of MCSs derived from rapid updatecycle analyses, Mon. Weather Rev., 138, 3514–3539, doi:http://dx.doi.org/10.1175/2010MWR3233.1.
Corrigan, P., D. D. Fenn, D. R. Kluck, and J. L. Vogel (1999) ProbableMaximum Precipitation for California. National Weather Service Hydro-meteorological Report No. 59, 392 pp.
Dettinger, M. (2011), Climate change, atmospheric rivers, and floods inCalifornia—A multimodel analysis of storm frequency and magnitudechanges, J. Am. Water Resour. Assoc., 47, 514–523. doi:10.1111/j.1752-1688.2011.00546.x.
GCOS (2009), Guideline for the Generation of Satellite-based Datasets andProducts meeting GCOS Requirements, 128 (WMO/TD No. 1488), WorldMeteorological Organization
Hebert, P. J. (1980), Atlantic hurricane season of 1979, Mon. Weather Rev.,108, 973–990, doi:http://dx.doi.org/10.1175/1520-0493(1980)108< 0973:AHSO> 2.0.CO;2.
Holloway, C. E., and J. D. Neelin (2010), Temporal relations of column watervapor and tropical precipitation, J. Atmos. Sci., 67, 1091–1105, doi:http://dx.doi.org/10.1175/2009JAS3284.1.
IPCC (2012), Managing the Risks of Extreme Events and Disasters to Ad-vance Climate Change Adaptation, A Special Report of Working Groups
KUNKEL ET AL.: PMP AND CLIMATE CHANGE
1407

I and II of the Intergovernmental Panel on Climate Change edited byC. B. Field, V. Barros, T. F. Stocker, D. Qin, D. J. Dokken, K. L. Ebi,M. D. Mastrandrea, K. J. Mach, G.-K. Plattner, S. K. Allen, M. Tignor,and P. M. Midgley, pp 582 Cambridge University Press, Cambridge,UK, and New York, NY, USA.
Knutson, T. R., J. L. McBride, J. Chan, K. Emanuel, G. Holland,C. Landsea, I. Held, J. P. Kossin, A. K. Srivastava, and N. Surgi (2010),Tropical cyclones and climate change, Nat. Geosci., 3, 157–163,doi:10.1038/ngeo779.
Kunkel, K. E., et al. (2013), Monitoring and understanding changes inextreme storms: State of knowledge, Bull. Am. Meteorol. Soc.,doi:10.1175/BAMS-D-12-00066.1, in press.
Moore, B. J., P. J. Neiman, F. M. Ralph, and F. E. Barthold (2012), Physicalprocesses associated with heavy flooding rainfall in Nashville, Tennes-see, and vicinity during 1–2 May 2010: The role of an atmospheric riverand mesoscale convective systems, Mon. Weather Rev., 140, 358–378,doi:http://dx.doi.org/10.1175/MWR-D-11-00126.1.
Neiman, P. J., F. M. Ralph, G. A. Wick, Y.-H. Kuo, T.-K. Wee, Z. Ma,G. H. Taylor, and M. D. Dettinger (2008), Diagnosis of an intense atmo-spheric river impacting the Pacific Northwest: Storm summary and off-shore vertical structure observed with COSMIC satellite retrievals,Mon. Weather Rev., 136, 4398–4420, doi:10.1175/2008MWR2550.1.
Price, J. F. (1981), Upper ocean response to a hurricane, J. Phys. Oceanogr.,11, 153–175, http://dx.doi.org/10.1175/1520-0485(1981)011< 0153:
UORTAH> 2.0.CO;2 doi:10.1175/1520-0485(1981)011%3C0153:UORTAH%3E2.0.CO;2.
Schade, L. R. (2000), Tropical cyclone intensity and sea surface temperature,J. Atmos. Sci., 57, 3122–3130, http://dx.doi.org/10.1175/1520-0469(2000)057< 3122:TCIASS> 2.0.CO;2.
Schreiner, L. C., and J. T. Riedel (1978), Probable Maximum PrecipitationEstimates, United States East of the 105th Meridian (HMR No. 51),National Weather Service, National Oceanic and Atmospheric Adminis-tration, United States Department of Commerce, Washington, DC.
Trenberth, K. E. (2011), Changes in precipitation with climate change,Clim. Res., 47, 123–138, doi:10.3354/cr00953.
Trenberth, K. E., A. Dai, R. M. Rasmussen, D. B. Parsons (2003), Thechanging character of precipitation, Bull. Am. Meteorol. Soc., 84,1205–1217, doi:http://dx.doi.org/10.1175/BAMS-84-9-1205.
Trenberth, K. E., et al. (2007), Observations: Surface and AtmosphericClimate Change, In: Climate Change 2007: The Physical Science Basis.Contribution of Working Group I to the Fourth Assessment Report ofthe Intergovernmental Panel on Climate Change, edited by S. Solomon,D. Qin, M. Manning, Z. Chen, M. Marquis, K. B. Averyt, M. Tignor,and H. L.Miller, 235–336, Cambridge University Press, Cambridge, UnitedKingdom and New York, NY, USA.
World Meteorological Organization (2009), Manual on Estimation of Prob-able Maximum Precipitation (PMP), World Meterological Organization,WMO-No. 1045, 259 pp.
KUNKEL ET AL.: PMP AND CLIMATE CHANGE
1408