Embed Size (px)
Citation preview

Probability & Statistics for ISChapter 2: Test Procedures
Lecturers
Dr. Ghandi ManasraDr. Monjed H. Samuh
Palestine Polytechnic University([email protected], [email protected])
Term 191
Manasra & Samuh – PPU Probability & Statistics for IS – Term 191 2019/2020 1 / 35
Table of Contents
1 Learning Objectives
2 Introduction
3 Hypothesis Testing: A Single Population Mean
4 Hypothesis Testing: The Difference Between Two Population Means
5 Hypothesis Testing: A Single Population Proportion
6 Hypothesis Testing: The Difference Between Two Population Proportions
Manasra & Samuh – PPU Probability & Statistics for IS – Term 191 2019/2020 2 / 35

Learning Objectives
After studying this chapter, the student will:
Understand how to correctly state a null and alternative hypothesis and carry out astructured hypothesis test.
Understand the concepts of type I error, and type II error.
Be able to calculate and interpret t test statistics for making statistical inference.
Understand how to calculate and interpret p-values.
Manasra & Samuh – PPU Probability & Statistics for IS – Term 191 2019/2020 3 / 35

Introduction
In hypothesis testing, we test a certain claim about a population parameter. Wemay want to find out, using some sample information, whether a given claim (orstatement) about a population parameter is true or not.
A hypothesis test is a process that uses sample statistics to test a claim aboutthe population parameter.
As an example, a soft-drink company may claim that, on average, its cans contain12 ounces of soda. A government agency may want to test whether such cans docontain, on average, 12 ounces of soda or not.
Suppose we take a sample of 100 cans of the soft drink under investigation. Wethen find out that the mean amount of soda in these 100 cans is 11.89 ounces.Based on this result, can we state that, on average, all such cans contain less than12 ounces of soda and that the company is lying to the public?
Not until we perform a test of hypothesis can we make such an accusation.
Manasra & Samuh – PPU Probability & Statistics for IS – Term 191 2019/2020 4 / 35

Introduction
The reason is that the mean, ounces, is obtained from a sample.
The difference between 12 ounces (the required average amount for thepopulation) and 11.89 ounces (the observed average amount for the sample) mayhave occurred only because of the sampling error.
Another sample of 100 cans may give us a mean of 12.04 ounces.
Therefore, we perform a test of hypothesis to find out how large the differencebetween 12 ounces and 11.89 ounces is and to investigate whether this differencehas occurred as a result of chance alone or not.
Now, if 11.89 ounces is the mean for all cans and not for just 100 cans, then we donot need to make a test of hypothesis. Instead, we can immediately state that themean amount of soda in all such cans is less than 12 ounces.
We perform a test of hypothesis only when we are making a decision about apopulation parameter based on the value of a sample statistic.
Manasra & Samuh – PPU Probability & Statistics for IS – Term 191 2019/2020 5 / 35
Steps in hypothesis testing
(1) State the statistical hypotheses.
(2) Collect the data and calculate the proper test statistic for the problem at hand.
(3) Identify the distribution of the test statistic and find the critical value using apreassigned level of significance α.
(4) Make decision and draw conclusion.
Manasra & Samuh – PPU Probability & Statistics for IS – Term 191 2019/2020 6 / 35
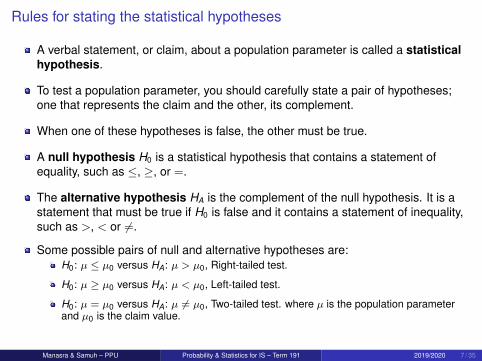
Rules for stating the statistical hypotheses
A verbal statement, or claim, about a population parameter is called a statisticalhypothesis.
To test a population parameter, you should carefully state a pair of hypotheses;one that represents the claim and the other, its complement.
When one of these hypotheses is false, the other must be true.
A null hypothesis H0 is a statistical hypothesis that contains a statement ofequality, such as ≤, ≥, or =.
The alternative hypothesis HA is the complement of the null hypothesis. It is astatement that must be true if H0 is false and it contains a statement of inequality,such as >, < or 6=.
Some possible pairs of null and alternative hypotheses are:H0: µ ≤ µ0 versus HA: µ > µ0, Right-tailed test.
H0: µ ≥ µ0 versus HA: µ < µ0, Left-tailed test.
H0: µ = µ0 versus HA: µ 6= µ0, Two-tailed test. where µ is the population parameterand µ0 is the claim value.
Manasra & Samuh – PPU Probability & Statistics for IS – Term 191 2019/2020 7 / 35
Rules for stating the statistical hypotheses
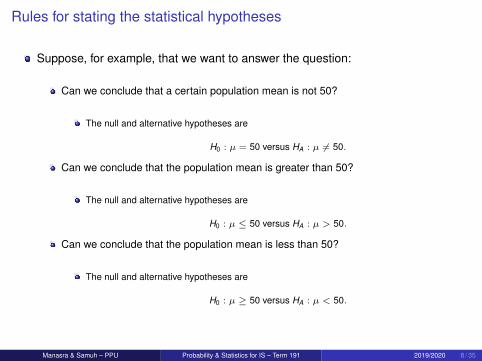
Suppose, for example, that we want to answer the question:
Can we conclude that a certain population mean is not 50?
The null and alternative hypotheses are
H0 : µ = 50 versus HA : µ 6= 50.
Can we conclude that the population mean is greater than 50?
The null and alternative hypotheses are
H0 : µ ≤ 50 versus HA : µ > 50.
Can we conclude that the population mean is less than 50?
The null and alternative hypotheses are
H0 : µ ≥ 50 versus HA : µ < 50.
Manasra & Samuh – PPU Probability & Statistics for IS – Term 191 2019/2020 8 / 35

Test Statistic
A test statistic is a value, determined from sample information, used to determinewhether to reject the null hypothesis or not.
If the test statistic falls within a range of values called acceptance region, thenthe null hypothesis is not rejected.
In hypothesis testing for the mean µ when σ is known or the sample size is large,the test statistic is computed by:
Zcal =X̄ − µ0
σ/√
n.
Manasra & Samuh – PPU Probability & Statistics for IS – Term 191 2019/2020 9 / 35
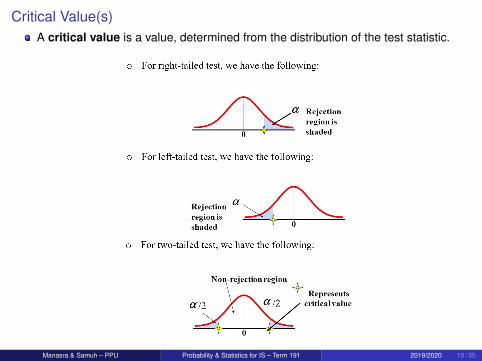
Critical Value(s)A critical value is a value, determined from the distribution of the test statistic.
Manasra & Samuh – PPU Probability & Statistics for IS – Term 191 2019/2020 10 / 35

Decision Rule
Reject the null hypothesis if the test statistic (ex. Zcal ) falls in the rejectionregion; otherwise, do not reject the null hypothesis.
Notes:We should emphasize that if the null hypothesis is not rejected on the basis of thesample data, we can’t say that the null hypothesis is true.
To put in another way, failing to reject the null hypothesis does not prove that H0 is true,it means we have failed to disprove H0.
When you perform a hypothesis test, you make one of two decisions: Reject the nullhypothesis or fail to reject the null hypothesis.
Manasra & Samuh – PPU Probability & Statistics for IS – Term 191 2019/2020 11 / 35
Types of Error
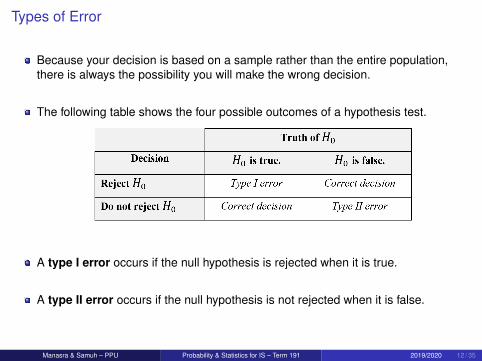
Because your decision is based on a sample rather than the entire population,there is always the possibility you will make the wrong decision.
The following table shows the four possible outcomes of a hypothesis test.
A type I error occurs if the null hypothesis is rejected when it is true.
A type II error occurs if the null hypothesis is not rejected when it is false.
Manasra & Samuh – PPU Probability & Statistics for IS – Term 191 2019/2020 12 / 35

Types of Error
Because there is variation from sample to sample, there is always a possibility thatyou will reject a null hypothesis when it is actually true.
You can decrease the probability of doing so by lowering the level of significance.
In a hypothesis test, the level of significance is your maximum allowable probabilityof making a type I error. It is denoted by α.
By setting the level of significance at a small value, you are saying that you wantthe probability of rejecting a true null hypothesis to be small.
Three commonly used levels of significance are α = 0.10, α = 0.05, α = 0.01.
Manasra & Samuh – PPU Probability & Statistics for IS – Term 191 2019/2020 13 / 35

In this chapter
We will study the following problems:
1 Hypothesis Testing: A Single Population Mean.
2 Hypothesis Testing: The Difference Between Two Population Means.
3 Hypothesis Testing: A Single Population Proportion.
4 Hypothesis Testing: The Difference Between Two Population Proportions.
Manasra & Samuh – PPU Probability & Statistics for IS – Term 191 2019/2020 14 / 35

Hypothesis Testing: A Single Population Mean
Sampling from Normally Distributed Population: Population Variance Known
The formula for the test statistic is
Zcal =X̄ − µ0
σ/√
n.
Manasra & Samuh – PPU Probability & Statistics for IS – Term 191 2019/2020 15 / 35

Hypothesis Testing: A Single Population Mean
ExampleA research team is willing to assume that systolic blood pressures in a certainpopulation of males are approximately normally distributed with a standard deviation of16. A simple random sample of 64 males from the population had a mean systolicblood pressure reading of 133. At the 0.05 level of significance, do these data providesufficient evidence for us to conclude that the population mean is greater than 130?
Manasra & Samuh – PPU Probability & Statistics for IS – Term 191 2019/2020 16 / 35

Hypothesis Testing: A Single Population Mean
ExampleThe management of Priority Health Club claims that its members lose an average of 10pounds or more within the first month after joining the club. A consumer agency thatwanted to check this claim took a random sample of 36 members of this health club andfound that they lost an average of 9.2 pounds within the first month of membership. Thepopulation standard deviation is known to be 2.4 pounds. Test the claim at α = 0.01.
Manasra & Samuh – PPU Probability & Statistics for IS – Term 191 2019/2020 17 / 35

p-Value Method for Hypothesis Testing
If the null hypothesis is true, a p-value (or probability value) of a hypothesis test isthe probability of obtaining a sample statistic with a value as extreme or moreextreme than the one determined from the sample data.
To calculate the p-value for a test of hypothesis:
If the test is right-tailed, then p-value= P(Z > Zcal ).
If the test is left-tailed, then p-value= P(Z < Zcal ).
If the test is two-tailed, we have two cases:
If Zcal > 0 then p-value= 2P(Z > Zcal ).
If Zcal < 0 then p-value= 2P(Z < Zcal ).
If the p-value< α, the null hypothesis H0 is rejected.
Manasra & Samuh – PPU Probability & Statistics for IS – Term 191 2019/2020 18 / 35
p-Value Method for Hypothesis Testing
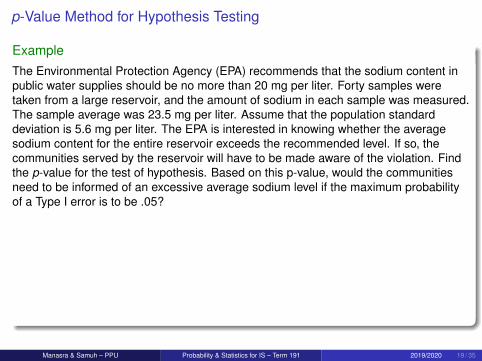
ExampleThe Environmental Protection Agency (EPA) recommends that the sodium content inpublic water supplies should be no more than 20 mg per liter. Forty samples weretaken from a large reservoir, and the amount of sodium in each sample was measured.The sample average was 23.5 mg per liter. Assume that the population standarddeviation is 5.6 mg per liter. The EPA is interested in knowing whether the averagesodium content for the entire reservoir exceeds the recommended level. If so, thecommunities served by the reservoir will have to be made aware of the violation. Findthe p-value for the test of hypothesis. Based on this p-value, would the communitiesneed to be informed of an excessive average sodium level if the maximum probabilityof a Type I error is to be .05?
Manasra & Samuh – PPU Probability & Statistics for IS – Term 191 2019/2020 19 / 35

One-Sample Z test in R
Manasra & Samuh – PPU Probability & Statistics for IS – Term 191 2019/2020 20 / 35

One-Sample Z test in R
Manasra & Samuh – PPU Probability & Statistics for IS – Term 191 2019/2020 21 / 35

Hypothesis Testing: A Single Population Mean
Sampling from Normally Distributed Population: Population Variance Unknown
The formula for the test statistic is
tcal =X̄ − µ0
S/√
n.
The degrees of freedom are df = n − 1.
Manasra & Samuh – PPU Probability & Statistics for IS – Term 191 2019/2020 22 / 35

Hypothesis Testing: A Single Population Mean
ExampleA psychologist claims that the mean age at which children start walking is 12.5 months.Dr. Samuh wanted to check if this claim is true. He took a random sample of 18children and found that the mean age at which these children started walking was 12.9months with a standard deviation of .80 month. It is known that the ages at which allchildren start walking are approximately normally distributed.
1 Do these data provide sufficient evidence for him to conclude that the mean age atwhich all children start walking is different from 12.5 months? Use α = 0.01.
2 Find the p-value for the test that the mean age at which all children start walking isdifferent from 12.5 months.
Manasra & Samuh – PPU Probability & Statistics for IS – Term 191 2019/2020 23 / 35

One-Sample T test in R
Manasra & Samuh – PPU Probability & Statistics for IS – Term 191 2019/2020 24 / 35
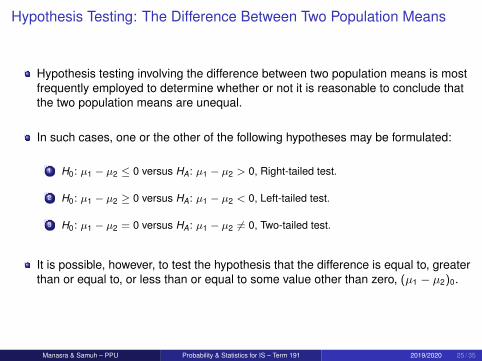
Hypothesis Testing: The Difference Between Two Population Means
Hypothesis testing involving the difference between two population means is mostfrequently employed to determine whether or not it is reasonable to conclude thatthe two population means are unequal.
In such cases, one or the other of the following hypotheses may be formulated:
1 H0: µ1 − µ2 ≤ 0 versus HA: µ1 − µ2 > 0, Right-tailed test.
2 H0: µ1 − µ2 ≥ 0 versus HA: µ1 − µ2 < 0, Left-tailed test.
3 H0: µ1 − µ2 = 0 versus HA: µ1 − µ2 6= 0, Two-tailed test.
It is possible, however, to test the hypothesis that the difference is equal to, greaterthan or equal to, or less than or equal to some value other than zero, (µ1 − µ2)0.
Manasra & Samuh – PPU Probability & Statistics for IS – Term 191 2019/2020 25 / 35
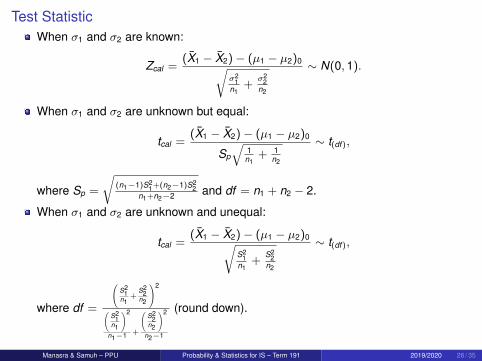
Test StatisticWhen σ1 and σ2 are known:
Zcal =(X̄1 − X̄2)− (µ1 − µ2)0√
σ21
n1+
σ22
n2
∼ N(0, 1).
When σ1 and σ2 are unknown but equal:
tcal =(X̄1 − X̄2)− (µ1 − µ2)0
Sp
√1n1
+ 1n2
∼ t(df ),
where Sp =
√(n1−1)S2
1 +(n2−1)S22
n1+n2−2 and df = n1 + n2 − 2.
When σ1 and σ2 are unknown and unequal:
tcal =(X̄1 − X̄2)− (µ1 − µ2)0√
S21
n1+
S22
n2
∼ t(df ),
where df =
(S2
1n1
+S2
2n2
)2
(S2
1n1
)2
n1−1 +
(S2
2n2
)2
n2−1
(round down).
Manasra & Samuh – PPU Probability & Statistics for IS – Term 191 2019/2020 26 / 35

Hypothesis Testing: The Difference Between Two Population Means
ExampleThe average length of "short hospital stays" for men is slightly longer than that forwomen. A random sample of recent hospital stays for 32 men revealed a mean of 5.5days, and for 30 women revealed a mean of 4.2 days. At α = 0.01, is there sufficientevidence to conclude that the average hospital stay for men is longer than the averagehospital stays for women? Assume the population standard deviation for men is 1.2days and for women is 1.5 days. Report the p-value.
Manasra & Samuh – PPU Probability & Statistics for IS – Term 191 2019/2020 27 / 35

Hypothesis Testing: The Difference Between Two Population MeansExampleTwo competing headache remedies claim to give fast-acting relief. An experiment wasperformed to compare the mean lengths of time required for bodily absorption of brandA and brand B headache remedies. Twelve people were randomly selected and givenan oral dosage of brand A. Another 12 were randomly selected and given an equaldosage of brand B. The lengths of time in minutes for the drugs to reach a specifiedlevel in the blood were recorded. For brand A: the mean is 21.8 min and the standarddeviation is 8.7 min. For brand B: the mean is 18.9 min and the standard deviation is7.5 min. Past experience with the drug composition of the two remedies permitsresearchers to assume that both distributions are approximately normal with equalvariances. Let us use a 5% level of significance to test the claim that there is nodifference in the mean time required for bodily absorption. Also, find or estimate thep-value of the sample test statistic.
Manasra & Samuh – PPU Probability & Statistics for IS – Term 191 2019/2020 28 / 35
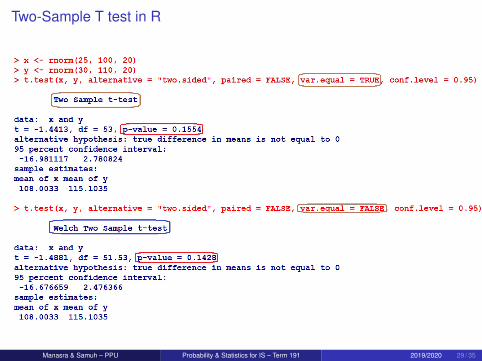
Two-Sample T test in R
Manasra & Samuh – PPU Probability & Statistics for IS – Term 191 2019/2020 29 / 35

Two-Sample T test in R
Manasra & Samuh – PPU Probability & Statistics for IS – Term 191 2019/2020 30 / 35

Paired T test in R
Manasra & Samuh – PPU Probability & Statistics for IS – Term 191 2019/2020 31 / 35

Hypothesis Testing: A Single Population Proportion
Many situations arise that call for tests of proportions or percentages rather thanmeans.
Some possible pairs of null and alternative hypotheses are:
H0: p ≤ p0 versus HA: p > p0, Right-tailed test.
H0: p ≥ p0 versus HA: p < p0, Left-tailed test.
H0: p = p0 versus HA: p 6= p0, Two-tailed test. where p is the population proportionand p0 is the claim value.
The value of the test statistic is computed as:
Zcal =p̂ − p0√
p0(1−p0)n
∼ N(0, 1).
Manasra & Samuh – PPU Probability & Statistics for IS – Term 191 2019/2020 32 / 35
Hypothesis Testing: A Single Population Proportion
ExampleA dietitian claims that 60% of people are trying to avoid trans fats in their diets. Sherandomly selected 200 people and found that 128 people stated that they were tryingto avoid trans fats in their diets. At α = 0.05, is there enough evidence to reject thedietitian’s claim?
Manasra & Samuh – PPU Probability & Statistics for IS – Term 191 2019/2020 33 / 35

Hypothesis Testing: The Difference Between Two PopulationProportions
Some possible pairs of null and alternative hypotheses are:
H0: p1 − p2 ≤ 0 versus HA: p1 − p2 > 0, Right-tailed test.
H0: p1 − p2 ≥ 0 versus HA: p1 − p2 < 0, Left-tailed test.
H0: p1 − p2 = 0 versus HA: p1 − p2 6= 0, Two-tailed test.
The value of the test statistic is computed as:
Zcal =(p̂1 − p̂2)√
p̄(1−p̄)n1
+ p̄(1−p̄)n2
∼ N(0, 1),
where p̄ is the pooled sample proportion, and is calculated by using one of thefollowing two formulas:
p̄ =x1 + x2
n1 + n2or p̄ =
n1p̂1 + n2p̂2
n1 + n2.
Manasra & Samuh – PPU Probability & Statistics for IS – Term 191 2019/2020 34 / 35
Hypothesis Testing: The Difference Between Two PopulationProportions
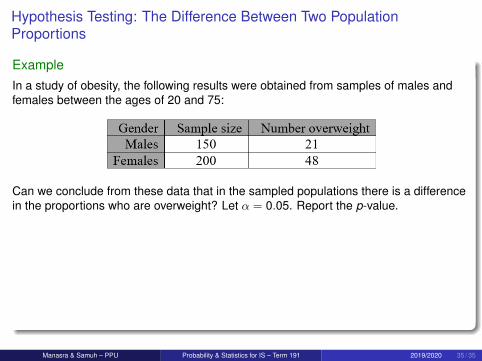
ExampleIn a study of obesity, the following results were obtained from samples of males andfemales between the ages of 20 and 75:
Can we conclude from these data that in the sampled populations there is a differencein the proportions who are overweight? Let α = 0.05. Report the p-value.
Manasra & Samuh – PPU Probability & Statistics for IS – Term 191 2019/2020 35 / 35