Embed Size (px)
Citation preview

Probabilistic Uncertainty Identification Modelling in USV Obstacle Detection
Chiemela Onunkaa, Glen Bright
b, Riaan Stopforth
c
Received 4 February 2013, in revised form 15 April 2013 and accepted 13 May 2013
R & D Journal of the South African Institution of Mechanical Engineering 2013, 29, 36-43 http://www.saimeche.org.za (open access) © SAIMechE All rights reserved.
36
Uncertainty and false alarms exist in the
operational environment of autonomous marine
robots. This paper presents the investigations on
obstacle detection and avoidance model of an
autonomous marine vehicle using ultrasonic
sensors and probabilistic techniques in uncertainty
identification in the development of an unmanned
surface vehicle (USV). Probabilistic techniques
were used in modelling the realistic environmental
uncertainties of the autonomous marine vehicle.
Coherence and non-coherence of sonar signals
were investigated and its functions simplified to
address the deterministic and un-deterministic
modelling variables that were identified in the
realistic domain of the USV. The results obtained
from the models were adapted into the control
algorithm of the USV to reduce the uncertainties
present in the guidance and control of the USV.
Additional Keywords: Sonar, Probability, USV,
Uncertainty, Obstacle Detection
1. Introduction
The development of marine robots has its focus on different
types of missions [1] which range from carrying payloads,
warfare, surveillance, to search and rescue activities. These
types of autonomous marine robots are at different
developmental stages in various research centres [2] such
as the Defence Advanced Research Projects Agency (DARPA), REFAEL Armament Development Authority,
Elbit Systems, Systems Centre San Diego (SPAWAR),
General Dynamics Robotic Systems and Marine and
Industrial Analysis Research Group (MIDAS) [3]. The
importance of autonomous marine robots for military
applications and commercial applications has driven the
various aspects of autonomous marine vehicle development
to a state that is appreciable to the common man. In recent
years, obstacle avoidance has become an area of research
interest in marine vehicle autonomous motion [4]. Marine
robots operate in an environment that is inherent with
uncertainties. The uncertainties are as a result of the way
the environment is perceived and modelled. In as much as
stability of marine vehicle is of paramount importance, its autonomous motion is highly dependent on the obstacle
avoidance architecture and motion planning strategy [5].
Different sensory architecture provides information on
different levels and it is classified into a hierarchy of
importance in facilitating the autonomous motion of the
marine vehicle [6]. Single sensory architectures are limited
in their capacity to provide complete information and
interpret known and unknown autonomous motion
environments. This capacity limitation has introduced
limitations on attempts to model the autonomous motion
environment using a single data source from the environment. Different imaging sensors provide navigation
map and path, obstacle detection and avoidance for
autonomous robots. The sole function of these sensors is to
provide marine robots a means of detecting other vessels,
humans, aquatic animals, entering into and finding their
way around their environments [7]. Visibility conditions
are usually not in favour of autonomous motion of marine
robots as their operational environments are usually poorly
illuminated. The poor robot motion path illuminations are
as a result of changes in day and night visibility conditions.
Changes in weather pattern and characteristics such as rain,
fog, snow and cyclones inhibit the visual perception of marine robots. In spite of the various efforts which are put
in place to arrest the uncertainties that exist as a function of
changes in environmental conditions, the data acquired
from a single sensor in a multisensory architecture is partial
and uncertain and may be geometrically incomparable with
another sensor’s data. It is a known fact that a multisensory
architecture is capable of resolving the difficulties that are
faced in using a single sensory system for mobile robot
obstacle detection and navigation [8].
Sonar and ultrasonic systems are capable of detecting
both stationary and moving targets at different proximities. The sonar cross section (SCS) and the signal-to–noise ratio
(SNR) are functions of the probability of detection of the
sonar system. The sonic system used in the modelling the
marine vehicle obstacle detection system produces
continuous wave which is software controlled. The sonar is
a common sensor in the field of robotics used for obstacle
detection [7]. Its advantage lies in the fact that it is not
affected by any visual restrictions that may be present in
the marine vehicle environment. The sonar has a
disadvantage in that it receives echoes reflected from
surfaces or from similar devices. The limitation results in
poor resolution and accuracy of received data. The continuous wave in conjunction with millimetre-wave
a School of Mechanical Engineering, Mechatronics and Robotics Research Group (MR2G), University of
KwaZulu Natal
b School of Mechanical Engineering, Mechatronics and
Robotics Research Group (MR2G), University of
KwaZulu Natal
c School of Mechanical Engineering, Mechatronics and
Robotics Research Group (MR2G), University of
KwaZulu Natal

Probabilistic Uncertainty Identification Modelling in USV Obstacle Detection
R & D Journal of the South African Institution of Mechanical Engineering 2013, 29, 36-43 http://www.saimeche.org.za (open access) © SAIMechE All rights reserved.
37
(MMW) characteristic function was used in the model
development [11]. The millimetre-wave configuration
allows the sonic system to have fine resolution for target
detection within short ranges and also for stationary target
detection. The use of embedded systems in acquiring data
from sonar is used resolve the problem in that the firing
sequence of the sonar are managed internally using
software techniques[15].
The automation of marine vehicles and obstacle detection has been reported in various studies: In [17], the
use of a speed controller and nozzle controller incorporated
in a fuzzy controller was proposed in changing the USV
angle of divergence while avoiding obstacles. The use of
USB camera vision to track and avoid obstacles while
guiding automated vehicles was reported in [18]. Gal in
[19] used probabilistic velocity obstacle technique derived
from ocean wave velocity in determining an optimal
motion planning for USV. The use of probability
Hypothesis Density Bayes filter was proposed in [20] for
USV multi-target tracking. The use of monocular vision and stereo vision were proposed in [21] for USV real-time
obstacle detection. The various studies showed that there
are different possibilities which can be implemented in a
USV obstacle detection algorithm. Marine vehicle
autonomous motion key property was identified as the
effects of uncertainty and its characteristic association with
unmanned surface vehicle navigation in the presence of
multiple targets. The contributions made included the
identification and modelling of uncertainty in the
autonomous motion of the USV. False targets, limited
range resolution and changing environmental conditions
affected the acquiring, interpretation and usage of sonar data. The emanating model can be ambiguous, inaccurate
and inconsistent with the real world information. The
accurate interpretation of sensory data, information and
knowledge was a determining factor in the efficiency of the
obstacle detection and avoidance architecture. The Sensory
knowledge of the USV provided the capacity to use
information found within the dynamic environment of the
USV and it is environment dependent as it requires the
understanding and the derivation of intelligent information
procedures [5]. The inappropriate use of sensory
knowledge on autonomous marine navigation can result to fatal consequences. Information and knowledge in marine
vehicle autonomous motion formed the integral part of the
marine vehicle autonomous motion cognition process.
Figure 1 [9] illustrates the relationship that exists between
sonar sensory data, information and knowledge. The
resolution and reliability of perception in obstacle
avoidance models of the USV are adversely affected by the
sonar propagation characteristics. Eclectic sonar beams
have grater effects and they merge echoes of multiple
targets. The presence of false targets is introduced through
the use of side lobe which can be included in the design of
sonar system and it increases the complexities that are associated with false targets thereby degrading the
performance of the scanning angle of the sonar as its gain is
adjusted or changes. The combined limitations found in
these sensors created the fundamental problem of
incompleteness and the direct consequence resulted in
uncertainty present in autonomous navigation system.
In this paper, we describe the probabilistic uncertainty
identification from a sonar obstacle detection model. The
system model comprises of five ultrasonic sonars used for
autonomous navigation of an unmanned surface vehicle
(USV). The modelling of the marine vehicle obstacle
architecture encompassed the uncertainty that is
experienced in marine vehicle autonomous motion, the
autonomous decision making algorithm of the marine
vehicle and the probabilistic characteristic nature of the
autonomous motion of the marine vehicle. The sonar
system is arranged such that it can provide data on obstacles that are in the far-field region and also provides
data on obstacles that are in the near-field region. The
detection of near-field and far-field obstacles is crucial to
the successful completion of autonomous motion mission
of a marine vehicle. Sensor development and integration
into autonomous and intelligent systems affects the overall
performance of the autonomous system. As such, the ability
of the sonar and ultrasonic sensors to detect targets at
considerable range with perfect resolution and accuracy is
the ideal that was sought after in the development and
implementation of the sonar obstacle detection architecture.
2. The Methodology The use of probabilistic techniques in modelling the
realistic environmental domains of the autonomous marine vehicle was proposed. The USV functions required that
simplifications be made to contain the deterministic and un-
deterministic modelling variables that were identified in the
realistic domain. We used preliminary data as it provided
clues as to what is expected from the sensors in modelling
the obstacle detection and avoidance architecture. The
hidden variables which were reflected in the modelling
process were contained in the raw data as measured from
the ultrasonic sensors and they showed the various
complexities that existed between the unmanned surface
vehicle and the environment. Probabilistic methods were used to determine the coherent view on the performance of
the intelligent system embedded in the obstacle avoidance
structure especially in the presence of partial or uncertain
data. The inclusion of the unique probabilistic method
provided the ability to process and analyse the sonar data
within context-sensitive views which were required to
facilitate the computation of context dependencies that
were manipulated by local propagation of the sonar data
[10].
The dynamic environment illustrated in figure 2 and 3
was modelled and represented in the obstacle detection architecture through the use of the five ultrasonic sensors.
The raw range data acquired from the sonar were used as
the starting points for reactive obstacle detection and
avoidance systems for targets within the near-field region
of the USV. The position and orientation of the USV are
illustrated in figure 2 and were defined as follows:
2.1 Modelling Obstacle Detection with Sonar r: The distance from the USV origin to the ultrasonic
sensor,
γ: The angle from the USV axis to the ultrasonic sensor,
: The orientation of the ultrasonic sensor with respect to the USV.
The autonomous control algorithm of the USV was
developed using the data from the sonar while data from
the sonar was used to project the distance D, for each of the

Probabilistic Uncertainty Identification Modelling in USV Obstacle Detection
R & D Journal of the South African Institution of Mechanical Engineering 2013, 29, 36-43 http://www.saimeche.org.za (open access) © SAIMechE All rights reserved.
38
ultrasonic sensors to the external frame of reference of the
USV (xs,ys) while incorporating the position of the USV
(x,y,α) as illustrated in figure 2. The dynamic environment
was modelled using equations 1 and 2.
xs = x + rcos(γ + ) + Dcos( + α) (1)
ys = y + rsin(γ + ) + Dsin( + α) (2)
The angles α, and γ were approximated; hence an
absolute angle for the sonar was defined as:
= α + + γ (3)
Echoes from the ultrasonic range finders within an arc
shaped region were defined by the USV uncertainty region,
and uncertainty distance, D and were approximated in the Cartesian coordinates as represented in equation 4
[ ] [
] (4)
Figure 1: Sonar Data, Information and Knowledge Relationship
The transformation of the system covariance from
circular to Cartesian coordinates was illustrated as:
| [
]
[
] (5)
The transformation of the uncertainty region having an
elliptical profile to Cartesian coordinates was given by:
[
]
[
] (6)
Figure 2: Projection of Sonar Data to USV Dynamic Environment
The crucial point to note in this model is that the
criterion required for sonar uncertainty in the USV local
modelling was that the uncertainty be larger than any true
errors that may be associated with the data. Each of the
measured data from the ultrasonic sensors was represented
as xs, ys and Cs expressed in the dynamic environment of
the USV. In modelling the movement of the unmanned
surface vehicle, the Bayesian programme was formulated
using the Generic Bayesian Program (GBP) [11] for autonomous motion. The GBP was used to model and
develop the near-field obstacle avoidance algorithm. The
ultrasonic sensors returned values that were between 3cm
and 400cm. These values were stored in variable P1, P2, P3,
P4 and P5. The USV was controlled through a servo motor
attached to the rudder shown in figure 4. The forward
motion of the USV was controlled through the propeller.
The values for the rudder and propeller were stored in
variables Mservo and Mpropeller respectively. These variables
were used to derive three extra variables (Dir, Prox) and
Vrot. Dir which represented the approximate bearing of
targets from the USV with values ranging from -40 to +40 in degrees. Prox represented the approximate distance of
the closest target between 3cm and 400cm. These gave rise
to the following models illustrated in equations 7 and 8.
While keeping the variable OceanSurf constant, Vrot took
values ranging from -40 to +40. The setup is illustrated in
figure 3.
(
) (7)
(
) (8)
Vprop = Mprop (9)
Vrot = Mservo (10)
SONAR Data
Information
Knowledge
Dynamic
Environment
Limited predefined
data associations
Assigned data associations
with limited logical
relationships between data
Storage and
organization of
information
Intelligent
process
Modelling and
intelligence
Ultrasonic
sensors
D
Propeller Centre of
rotation
Position
uncertainty

Probabilistic Uncertainty Identification Modelling in USV Obstacle Detection
R & D Journal of the South African Institution of Mechanical Engineering 2013, 29, 36-43 http://www.saimeche.org.za (open access) © SAIMechE All rights reserved.
39
Figure 3: Diagram of the USV Indicating the Position of the Five Ultrasonic Sensors
Figure 4: The USV Steering Setup
The model definitions which were implemented on the
USV are summarised as follows in equations 11, 12 and 13.
This is illustrated in figure 5.
{ }⟨ ⟩ (11)
{ }⟨ ⟩ (12)
{ }⟨ ⟩ (13)
Figure 5: Sonar Model Descriptions in USV Dynamic Environment
2.2 Obstacle Detection/Avoidance Algorithm The probabilistic algorithm as described in the
methodology section and implemented in USV obstacle
detection program is given figure 6 [22]:
Figure 6: Probabilistic Pseudo code
Ultrasonic
Sensor Data
Descriptions
Ultrasonic
Sensor Data
Descriptions
Match
Position
Correction
Update
system
Composite
Local Model
Pre-Stored
Global Model
Predict
Sensory
Data
Servo
Bracket
Sprocket Servo
Chain
USV
Ultrasonic
sensors
Obstacle
1
2
3
5
4
Dir = 0
Dir
Dir = +40 Dir = -40
+ -
Vrot
Prox
Vprop
Program Start
reactiveavoid
tt dirproxVrotP
QuestionnDescriptio
|(
:/
ModeControl
ionIdentifiationSpecificat :/
End
DiroxDiroxG
DiroxVrotP
UniformoxP
UniformDirPFormsParametric
DirproxVrotP
proxPDirP
VrotoxDirP
ionDecomposit
VrotoxDir
Variables
reactiveavoid
reative
reactive
reactiveavoid
reactiveavoidreactiveavoid
reactiveavoid
)),(Pr),,(Pr(
)Pr|(
)|(Pr
)|(:
)|(
)|()|(
)|Pr(
:
,Pr,
:

Probabilistic Uncertainty Identification Modelling in USV Obstacle Detection
R & D Journal of the South African Institution of Mechanical Engineering 2013, 29, 36-43 http://www.saimeche.org.za (open access) © SAIMechE All rights reserved.
40
2.2 System normalization with the CW radar Furuno marine radar was used as a control in modelling the
obstacle detection and avoidance sonar system. The radar
system generated continuous wave (CW) forms and has a
resolution range of 16 meters with a minimum range of 22
meters. The bearing discrimination is 6.7 degrees, bearing
accuracy is within 1 degree, the horizontal beam width is less than 6.2 degrees, the vertical beam width is 25 degrees,
the side-lobe attenuation is less than -20dB, the transceiver
frequency is 9410MHz in X-band. It has a peak power
output of 2.2 kW with an intermediate frequency of
60MHz. The front receiver has a bandwidth of 15MHz
short pulse and 5 MHz medium and long pulse. The CW
sonar system extracted the radial velocity of the targets
within the dynamic environment of the USV by measuring
the difference in frequencies of the reflected signals.
Interruptions on the continuous emission of sonar signals
were avoided by using the inbuilt software controlled system as illustrated in figure 7. The sonar detection model
in the dynamic environment included the sonar echo signal
s(t), additive zero mean Gaussian noise n(t), variance 2,
band pass filter IF signal v(t) and the threshold value VT.
The threshold value was the basis and hypotheses from
which the radar obstacle detection and avoidance decisions
were made. Similar variables can also be used for the radar
system in providing system check for the sonar system.
v(t) = r(t) cos (t) cos 0t + r(t) sin (t) sin 0t (14)
The threshold hypotheses were illustrated as:
{
(15)
Figure 7: CW Sonar/Radar Block Model [13]
The sonar false alarm was also investigated. It is the
sonar probability of detection within the given dynamic
environment of the USV and it is maximised for each
probability of false alarm given that there is a target in the
environment in the presence of noise. The probability of
false alarm Pfa was defined as the probability that a group
of targets R, in the dynamic environment of the USV
having the signal r(t) will exceed the threshold voltage in the presence of noise alone at any given sonar scan [12].
This was expressed as:
∫
(
)
(
) (16)
√ (
) (17)
The probability of detecting targets given that the signal
from the sonar has a sinusoidal wave from with amplitude
A and power, A2/2 has a signal-to-noise ratio (SNR)
expressed as:
and
(
) (18)
The probability of detection expressed as:
∫
(
) (
)
(
)
√
√ (
)
(19)
where Q is known as Marcum’s Q-function [13, 14] and
expressed as:
[ ] ∫
(20)
Where I0 represents the in-phase radar frequency
presented as the modified Bessel Function of the zero
order [16]:
∫
(21)
and α 0, n > 10p for p 3.
The probability of detection is then approximated [15]
as:
(√ √ ) (22)
The complementary error function erfc is expressed as:
N
BF
Det.
STALO
Detector
A / D
N
BF
N
B
F
Indicator /Screen
Det. Det
.
Mixer
IF Amplifier
Mixer
CW
Transmitter
Probabilistic Uncertainty Identification Modelling in USV Obstacle Detection
R & D Journal of the South African Institution of Mechanical Engineering 2013, 29, 36-43 http://www.saimeche.org.za (open access) © SAIMechE All rights reserved.
41
√ ∫
(23)
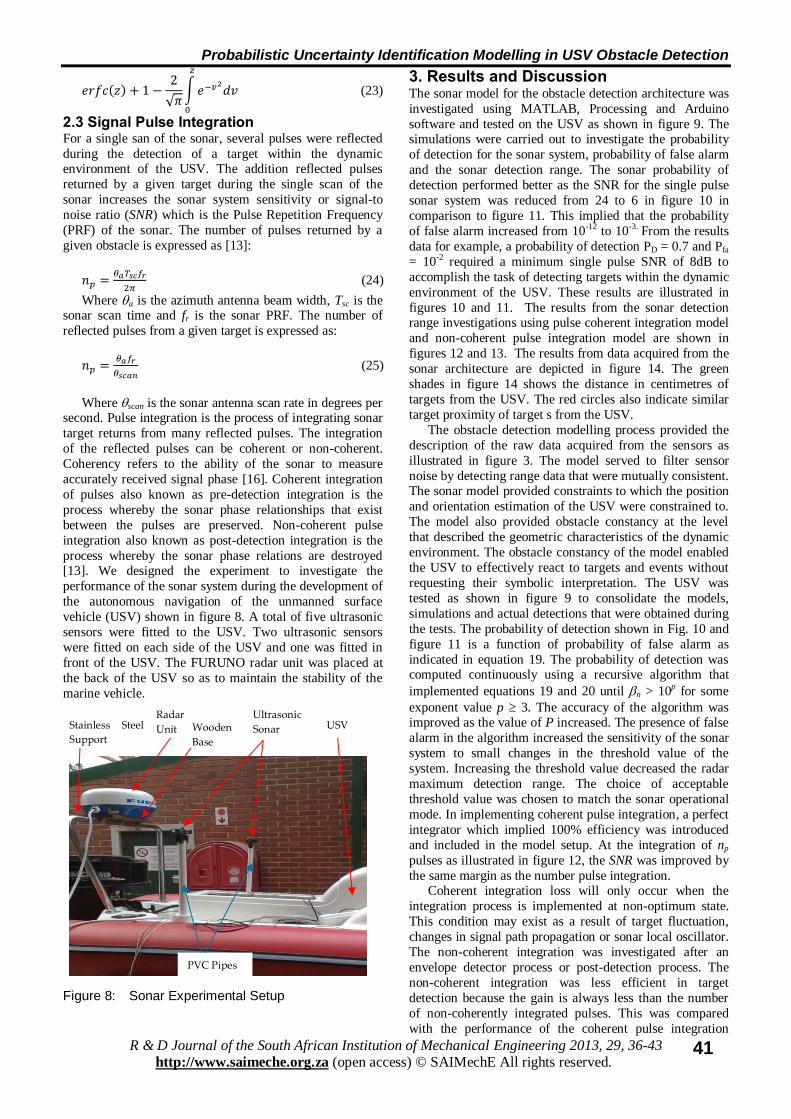
2.3 Signal Pulse Integration For a single san of the sonar, several pulses were reflected
during the detection of a target within the dynamic environment of the USV. The addition reflected pulses
returned by a given target during the single scan of the
sonar increases the sonar system sensitivity or signal-to
noise ratio (SNR) which is the Pulse Repetition Frequency
(PRF) of the sonar. The number of pulses returned by a
given obstacle is expressed as [13]:
(24)
Where a is the azimuth antenna beam width, Tsc is the sonar scan time and fr is the sonar PRF. The number of
reflected pulses from a given target is expressed as:
(25)
Where scan is the sonar antenna scan rate in degrees per second. Pulse integration is the process of integrating sonar
target returns from many reflected pulses. The integration
of the reflected pulses can be coherent or non-coherent.
Coherency refers to the ability of the sonar to measure
accurately received signal phase [16]. Coherent integration
of pulses also known as pre-detection integration is the
process whereby the sonar phase relationships that exist
between the pulses are preserved. Non-coherent pulse
integration also known as post-detection integration is the
process whereby the sonar phase relations are destroyed [13]. We designed the experiment to investigate the
performance of the sonar system during the development of
the autonomous navigation of the unmanned surface
vehicle (USV) shown in figure 8. A total of five ultrasonic
sensors were fitted to the USV. Two ultrasonic sensors
were fitted on each side of the USV and one was fitted in
front of the USV. The FURUNO radar unit was placed at
the back of the USV so as to maintain the stability of the
marine vehicle.
Figure 8: Sonar Experimental Setup
3. Results and Discussion The sonar model for the obstacle detection architecture was
investigated using MATLAB, Processing and Arduino
software and tested on the USV as shown in figure 9. The simulations were carried out to investigate the probability
of detection for the sonar system, probability of false alarm
and the sonar detection range. The sonar probability of
detection performed better as the SNR for the single pulse
sonar system was reduced from 24 to 6 in figure 10 in
comparison to figure 11. This implied that the probability
of false alarm increased from 10-12 to 10-3. From the results
data for example, a probability of detection PD = 0.7 and Pfa
= 10-2 required a minimum single pulse SNR of 8dB to
accomplish the task of detecting targets within the dynamic
environment of the USV. These results are illustrated in
figures 10 and 11. The results from the sonar detection range investigations using pulse coherent integration model
and non-coherent pulse integration model are shown in
figures 12 and 13. The results from data acquired from the
sonar architecture are depicted in figure 14. The green
shades in figure 14 shows the distance in centimetres of
targets from the USV. The red circles also indicate similar
target proximity of target s from the USV.
The obstacle detection modelling process provided the
description of the raw data acquired from the sensors as
illustrated in figure 3. The model served to filter sensor
noise by detecting range data that were mutually consistent. The sonar model provided constraints to which the position
and orientation estimation of the USV were constrained to.
The model also provided obstacle constancy at the level
that described the geometric characteristics of the dynamic
environment. The obstacle constancy of the model enabled
the USV to effectively react to targets and events without
requesting their symbolic interpretation. The USV was
tested as shown in figure 9 to consolidate the models,
simulations and actual detections that were obtained during
the tests. The probability of detection shown in Fig. 10 and
figure 11 is a function of probability of false alarm as
indicated in equation 19. The probability of detection was computed continuously using a recursive algorithm that
implemented equations 19 and 20 until n > 10p for some
exponent value p 3. The accuracy of the algorithm was improved as the value of P increased. The presence of false
alarm in the algorithm increased the sensitivity of the sonar
system to small changes in the threshold value of the
system. Increasing the threshold value decreased the radar
maximum detection range. The choice of acceptable
threshold value was chosen to match the sonar operational
mode. In implementing coherent pulse integration, a perfect
integrator which implied 100% efficiency was introduced
and included in the model setup. At the integration of np
pulses as illustrated in figure 12, the SNR was improved by
the same margin as the number pulse integration. Coherent integration loss will only occur when the
integration process is implemented at non-optimum state.
This condition may exist as a result of target fluctuation,
changes in signal path propagation or sonar local oscillator.
The non-coherent integration was investigated after an
envelope detector process or post-detection process. The
non-coherent integration was less efficient in target
detection because the gain is always less than the number
of non-coherently integrated pulses. This was compared
with the performance of the coherent pulse integration
Radar
Unit
Ultrasonic
Sonar USV Stainless Steel
Support
PVC Pipes
Wooden
Base

Probabilistic Uncertainty Identification Modelling in USV Obstacle Detection
R & D Journal of the South African Institution of Mechanical Engineering 2013, 29, 36-43 http://www.saimeche.org.za (open access) © SAIMechE All rights reserved.
42
illustrated in figure 13. The sonar coherency was achieved
and implemented through the use of a stable local oscillator
(STALO) as illustrated in figure 7. The sonar screen shown
in figure 14 was used primarily used to monitor targets
within the dynamic environment of the USV and to
navigate the USV through a pre-defined motion path. The
sonar architecture scanned the near-field environment and
returns the proximity data in real-time. The sonar screen
also facilitated the performance monitoring for the sonar obstacle detection and avoidance model.
Figure 9: USV Autonomous Motion Test
Figure 10: Sonar Performance on High SNR
Figure 11: Sonar Performance on Low SNR
4. Conclusion The realisation that uncertainties and exceptions exist in the
modelling of the obstacle detection and avoidance
architecture of the autonomous marine vehicle provided ways in which the uncertainties and exceptions were
summarized in the development of the USV. In
summarising the uncertainties and exceptions, the
propositions that were provided in the models were
assigned numerical measures of uncertainty and were
combined to attain realisable results. The probabilistic
technique implemented in the sonar obstacle detection
model, created the basis required for coherent prescriptions
in choosing adequate motion actions and efficient reliable
motion choices that were made by the USV.
Figure 12: Sonar Detection Range Using 100 Pulse
Coherent Integration Models
Figure 13: Sonar Detection Range Comparing
Coherent Integration (CI) Model and Non-Coherent Integration (NCI) Model
The integration of reflected pulses in the sonar detection
model increased the detection range for a single pulse when
the same SNR is implemented in the model. The data
obtained from the sonar model was used in the
development of the control, guidance and navigation
system of the USV. The implementation of the model
provided a performance monitoring technique for the autonomous motion of the USV. The development of
efficient obstacle detection and avoidance architecture as
implemented in the use of a sonar multisensory system in
the USV provided the necessary guidance and control
options for the development of efficient navigation

Probabilistic Uncertainty Identification Modelling in USV Obstacle Detection
R & D Journal of the South African Institution of Mechanical Engineering 2013, 29, 36-43 http://www.saimeche.org.za (open access) © SAIMechE All rights reserved.
43
algorithms for the autonomous motion of the marine
vehicle. The sonar coherency allowed for accurate
measurement of the received signal from the sonar. The
requirements for maintaining and updating each transmitted
pulse phase and the coherency of the sonar was very
challenging and costly and as such non-coherent integration
was implemented in the sonar system.
The results from the models were adapted into the
control algorithm of the USV to reduce the uncertainties present in the guidance and control of the USV while
improving the obstacle detection and avoidance capacity of
the USV especially in the near field-region up to 500 cm
from the USV. Approximations which were derived from
the obstacle detection models were used in fine-tuning the
control algorithm of the USV.
Figure 14: Sonar Sweep from Left to Right
5. References 1. Veers J and Bertram V, Development of the USV
Multi-Mission Surface Vehicle III, 5th International
Conference on Computer Applications and Information
Technology in Maritime Industries (COMPIT), Leiden,
2006, 345-355. 2. Brizzolara R, ONR Unmanned Sea Surface Vehicle
(USSV), http://www.onr.navy.mil/~/media/Files, 2010.
3. Bertram V, Unmanned Surface Vehicles-A Survey,
Skibsteknisk Selskab, Copenhagen, Denmark, 2008.
4. Radix Marine, The Growing US Market for Unmanned
Surface Vehicles (USVs), www.radixmarine.com/PDFs,
2003.
5. Allen PK and Bajcsy R, Two Sensors are Better than
One: Example of Vision and Touch, Third International
Symposium on Robotics Research, MIT Press, 1986.
6. Richardson JM and Marsh KA, Fusion of Multisensor Data, International Journal of Robotics Research, 1988,
7(6), 78-96.
7. Zhen J, Arjuna B and Subhash C, Sensor Fusion-Based
Visual Target Tracking for Autonomous Vehicles with
the Out-of-Sequence Measurement Solution. Robotics
and Autonomous Systems, 2008, 56(2), 157-176.
8. Majura SF, Damion DD, Shi D and Collins EG, Robot
Navigation in Very Cluttered Environments by
Preference-Based Fuzzy Behaviours, Robotics and
Autonomous Systems, 2008, 56(3) 231-246.
9. GeeWah N, Fusion Systems for Intelligent Processing,
In GeeWah N, Intelligent Systems-Fusion, Tracking and
Control, Research Studies Press, Baldock UK, 2003, 79-107.
10. Pearl J, Probabilistic Reasoning in Intelligent Systems,
Morgan & Kaufman, San Mateo, 1988.
11. Bessiere P and Lebeltel O, Basic Concepts of Bayesian
Programming. In Bessiere P, Christian L and Roland S,
Probabilistic Reasoning and Decision Making in
Sensory-Motor Systems, Springer-Berlin, Heidelberg,
2008, 19-48.
12. Foessel A, Scene Modeling from Motion-free Radar
Sensing. PhD Thesis, Robotics Institute, Carnegie
Mellon University, USA, 2002. 13. Mahafza BR and Elsherbeni AZ, Matlab Simulations for
Radar Systems Design, CRC Press, Boca Raton, FL,
2004.
14. Parl S, A new Method of Calculating the Generalised
Q-Function, IEEE Transaction on Information Theory,
1980, 26(1), 121-124.
15. North DO, An Analysis of the Factors which Determine
Signal/Noise Discrimination in Pulsed Carried Systems,
Proceedings of the IEEE, 1963, 51(7) 1015-1027.
16. Mahafza BR, Radar Systems Analysis and Design Using
MATLAB, CRC Press, Boca Raton, FL, 2000.
17. Xiaowei Q, Guang R, Jin Y and Aiping Z, The Simulation for Autonomous Navigation of Water-jet-
propelled Unmanned Surface Vehicle, IEEE 3rd
International Conference on Measuring Technology
and Mechatronics Automation (ICMTMA), Shangshai,
2011, 945-948.
18. Sabikan S, Sulaiman M, Salim SNS and Miskon MF,
Track and Obstacle Detection with USB Camera for
Vision-based Automated Guided Vehicle
http://myweb.utem.edu.my/myweb/fahmimiskon, 2007.
19. Gal O, Unified Approch of Unmanned Surafce Vehicle
Navigation in Presence of Waves” Journal of Robotics, 2011.
20. Gal O and Zeitouni E, Tracking Objects Using PHD
filter for USV Autonomous Capabilities, Robotic
Sailing 2012, Springer, Berlin, 2013, 3-12.
21. Wang H, Wei Z, Wang S, Ow CS, Ho KT, Feng B, and
Lubing Z, Real-time Obstacle Detection for Unmanned
Surface Vehicle, IEEE Defense Science Research
Conference and Expo, Singapore, 2011, 1-4.
22. Onunka C, Autonomous Sea Craft for search and rescue
Operations: Marine Vehicle Modelling and Analysis,
Masters Thesis, University of KwaZulu Natal, 2011.