Embed Size (px)
Citation preview

The Robotics InstituteCarnegie Mellon University
Pittsburgh, Pennsylvania 15213
July, 1999
c 1999 Carnegie Mellon University
Probabilistic Registration of3-D Medical Images
Mei Chen, Takeo Kanade, Dean Pomerleau, Jeff Schneider
CMU-RI-TR-99-16
The views and conclusions contained in this document are those of the authors and shouldnot be interpreted as representing the official policies, either expressed or implied, of theU.S. government.

Abstract
Registration between 3-D images of human anatomies enables cross-subject diagnosis. However, innate differencesin the appearance and location of anatomical structures between individuals make accurate registration difficult. Wecharacterize such anatomical variations to achieve accurate registration.
We represent anatomical variations in the form of statistical models, and embed these statistics into a 3-D digitalbrain atlas which we use as a reference. These models are built by registering a training set of brain MRI volumeswith the atlas. This associates each voxel in the atlas with multi-dimensional distributions of variations in intensityand geometry of the training set. We evaluate statistical properties of these distributions to build a statistical atlas.When we register the statistical atlas with a particular subject, the embedded statistics function as prior knowledgeto guide the deformation process. This allows the deformation to tolerate variations between individuals whileretaining discrimination between different structures. This method gives an overall voxel mis-classification rate of2.9% on 40 test cases; this is a 34% error reduction over the performance of our previous algorithm without usinganatomical knowledge. Besides achieving accurate registration, statistical models of anatomical variations alsoenable quantitative study of anatomical differences between populations.

Table of Contents
1. Motivation
2. Problem Definition
3. Capturing Anatomical Variations
4. Modeling Anatomical Variations
5. Probabilistic Registration of 3-D Medical Images
6. Performance of Probabilistic Registration
7. Neighborhood Context
8. Registration Using Neighborhood Statistics
9. Related Work
10. Conclusion and Future Work
Acknowledgments
References

AbstractRegistration between 3-D images of human anatomies enables cross-subject diagnosis. However, innate differences in theappearance and location of anatomical structures between individuals make accurate registration difficult. We characterizesuch anatomical variations to achieve accurate registration.
We represent anatomical variations in the form of statistical models, and embed these statistics into a 3-D digital brain atlaswhich we use as a reference. These models are built by registering a training set of brain MRI volumes with the atlas. Thisassociates each voxel in the atlas with multi-dimensional distributions of variations in intensity and geometry of the trainingset. We evaluate statistical properties of these distributions to build a statistical atlas. When we register the statistical atlaswith a particular subject, the embedded statistics function as prior knowledge to guide the deformation process. This allowsthe deformation to tolerate variations between individuals while retaining discrimination between different structures. Thismethod gives an overall voxel mis-classification rate of 2.9% on 40 test cases; this is a 34% error reduction over the perfor-mance of our previous algorithm without using anatomical knowledge. Besides achieving accurate registration, statisticalmodels of anatomical variations also enable quantitative study of anatomical differences between populations.
1. Motivation
Registration between volumetric images of human bodies enables cross-subject diagnosis and post-treatment analysis.However, due to genetic and life-style factors, there are innate variations among individuals in the appearance and location ofanatomical structures. Figure 1 displays cross-sections of T1-weighted magnetic resonance imaging (MRI) volumes of two non-pathological brains. The example structure, corpus callosum, has different intensity, shape, size, and location in these twobrains. For registration algorithms that use only intensity or shape templates to achieve correspondence, results are typicallypoor due to these inherent variations.
Currently there exist many intensity correspondence based registration algorithms[1], [3], [5], [13]. Figure 2 shows a regis-tration result using method [5]. The right image volume is deformed to register with the left image volume, and outlines of itsanatomical structures are overlaid on the left image to illustrate the alignment. Note that there is significant misalignment be-tween the deformed structures and the real structures. This is because the shape and density of anatomical structures in the twovolumes are considerably different, and a method using intensity correspondence cannot address the difference.
Knowledge of anatomical variations provides information that can guide the registration process and improve accuracy.Characterization of such variations also facilitates quantitative study of anatomical differences between populations, as well asanomaly detection. We capture and model non-pathological anatomical differences between individuals, and use this knowledgeto achieve accurate registration.
Figure 1 . Innate variations between individuals.
CorpusCallosum
3-D Deformable Registration of Medical Images Using a Statistical Atlas
Mei Chen1, Takeo Kanade1, Dean Pomerleau1,2, Jeff Schneider1
1Robotics Institute, School of Computer Science, Carnegie Mellon University, Pittsburgh, PA 15213{meichen, tk, pomerlea, schneide}@cs.cmu.edu
www.cs.cmu.edu/~meichen/registration.html2AssistWare Technology, 123000 Perry Highway, Wexford, PA 15090

2. Problem Definition
We collected 105 T1-weighted MRI volumes of non-pathological brains, and use them as the training set for knowledgeextraction. Examples from the training set are shown in the top row of Figure 3. Apart from the intrinsic differences betweendifferent people’s brain structures, there are also extrinsic differences in image orientation, scale, resolution, and intensity.
In order to capture the anatomical variations in the training set, we compare each MRI volume to a common reference. Ourreference is a 3-D digital atlas, which is a T1-weighted MRI of a non-pathological brain, accompanied by expert classificationof its anatomical structures. Note that, this atlas is an example of a normal brain, not an average brain of a population. The meth-od for comparison is an automatic 3-D deformable registration algorithm that was previously developed[13]. This method firsteliminates the extrinsic variations between image volumes with preprocessing, then extracts the intrinsic anatomical variationsby finding the deformable mapping between each image volume and the atlas.
The intrinsic variations are abstracted into a computational model. During registration, this model functions as prior knowl-edge to guide the registration process to tolerate anatomical variations, and to achieve higher accuracy.
3. Capturing Anatomical Variations
Different image acquisition processes result in variations in the 3-D orientation, position, resolution and intensity of image vol-umes in the training set. Differences in head size also add variation in the scales of the image volumes. These variations areextrinsic to the anatomical variabilities, and thus need to be removed before the intrinsic variations can be extracted.
3.1. Eliminating Extrinsic Variations
The registration algorithm employed for atlas-training set comparison[13] consists of a hierarchy of deformable models, ofwhich the first level is a similarity transformation, which addresses the extrinsic geometric variations between different subjectvolumes via 3-D rotation, scaling, and translation. As a result, each subject volume in the training set has roughly the sameorientation, size, and location as that of the atlas. The transformed subject volume is resampled to match the resolution of theatlas. A multi-level intensity equalization scheme is interwoven into the deformation hierarchy to adjust the differences in in-tensity distributions. The middle row in Figure 3 shows the result of having removed the extrinsic differences between the atlasand the training set.
3.2. Extracting Intrinsic Anatomical Variations
After the removal of extrinsic variations, intrinsic variations are apparent as the misalignment between anatomical struc-tures in the subject volumes and the atlas. The employed registration algorithm captures this information by aligning the corre-sponding structures through 3-D deformation, and recording the 3-D displacement, as shown in the last row of Figure 3.Therefore, after aligning each subject’s anatomical structures with those in the atlas, each atlas voxel is associated with twodistributions: one is an intensity distribution of corresponding voxels in the subject volumes; the other is a geometric distributionof the 3-D displacement between the atlas voxel and the corresponding voxels in the subject volumes. The former contains den-sity variations of anatomical structures over a population (density is reflected in image intensity), while the latter embodies geo-metrical variations of these structures, such as shape, size, and location.
4. Modeling Anatomical Variations
The purpose of capturing anatomical variations is to achieve accurate registration. We characterize these variations in astatistical manner, so as to employ them as prior knowledge in statistical models.
Figure 2 . The right image volume is deformed to register with the left one. Outlinesof several deformed anatomical structures are overlaid on the real structures
Misalignment

4.1. Modeling Density Variations
Once the training set is deformed to register with the atlas, each atlas voxel corresponds with its counterpart in each of thesubject volumes. The histogram of their intensities captures tissue density variations in a population (Figure 4).
Atlas
Similarity Transformation
Deformable Registration
Subject 1 Subject N
...
...
...
Figure 3 . The process of removing extrinsic variations and extracting intrinsic variations.
Atlas Subject 1 Subject N
# S
ubje
cts
...
Figure 4 . Model density variations at each atlas voxel as a 1-D distribution.

The intensity histogram at each atlas voxel is modeled as a 1-D Gaussian distribution, :
where , while and are corresponding voxel intensities in the subject volume and the atlas. is the 3-D de-formation between them. is the mean intensity difference between the training set and the atlas at this voxel; is the vari-ance of the intensity difference distribution. has been adjusted for intensity variations caused by image acquisition processes.
4.2. Modeling Geometric Variations
After the training set is deformed to register with the atlas, the 3-D displacements between each atlas voxel and its coun-terparts in the training set embody the geometric variations between individuals. The distribution of the variations can be cap-tured in a 3-D histogram. Figure 5 shows a 2-D illustration.
The 3-D histogram of displacements at each atlas voxel is modeled as a 3-D Gaussian distribution, :
here is the 3-D displacement between the atlas voxel and its counterparts in the training set, is the mean 3-D displacementat this atlas voxel, and is the 3x3 covariance matrix of the distribution. has been adjusted for extrinsic variations.
4.3. A Statistical Atlas
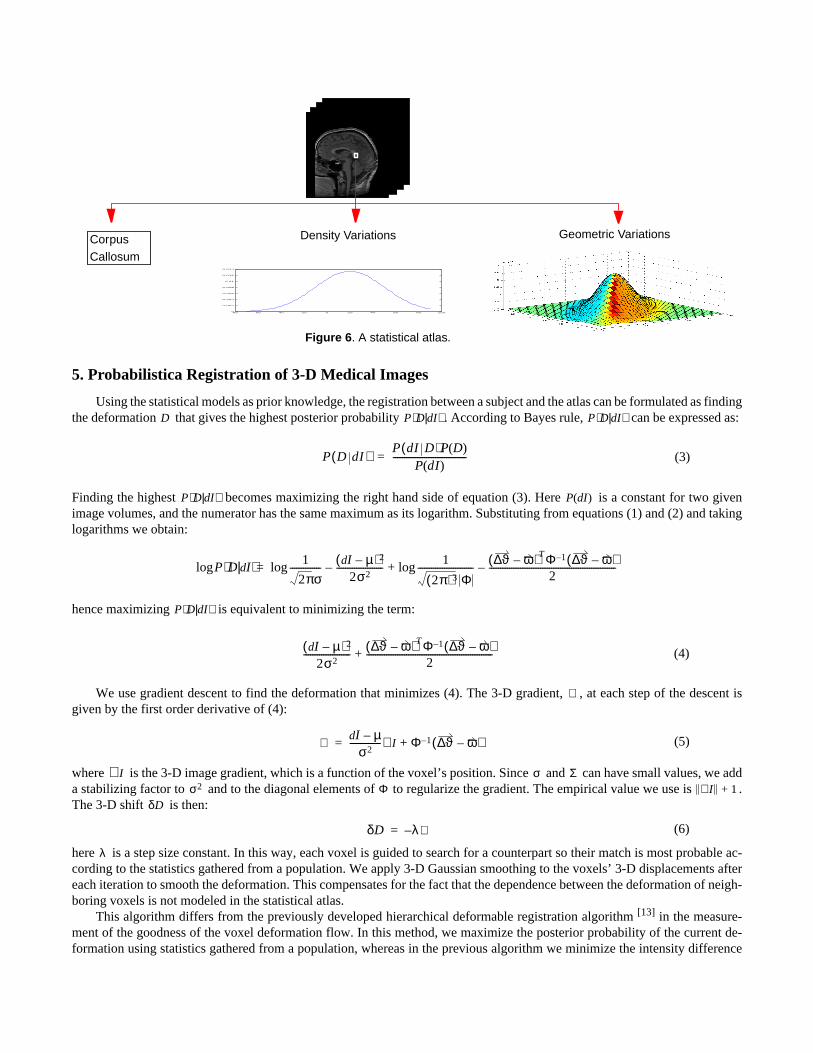
The original atlas was one particular subject’s brain MRI data, with each voxel’s anatomical classification given; the abovemodeling associates each atlas voxel with a distribution of tissue density variations, and a distribution of geometric variationsbetween individuals. These distributions enrich the atlas into a statistical atlas that embodies the knowledge of anatomical vari-ations in a population. Figure 6 illustrates the concept.
P Id D⟨ | ⟩
P Id D⟨ | ⟩ 1
2πσ--------------e
Id µ–( )2
2σ2---------------------–
= (1)
Id Is I a–= I s I a Dµ σ2
Id
Sub
ject
1S
ubje
ct N
......
DeformedAligned Deformation
...
Figure 5 . Model geometric variations at each atlas voxel as a 3-D distribution.
P D( )
P D( ) 1
2π( )3 Φ-----------------------------e
ϑ∆ ω–( )TΦ 1– ϑ∆ ω–( )2
-----------------------------------------------------------–
= (2)
ϑ∆ ωΦ ϑ∆
5. Probabilistica Registration of 3-D Medical Images
Using the statistical models as prior knowledge, the registration between a subject and the atlas can be formulated as findingthe deformation that gives the highest posterior probability . According to Bayes rule, can be expressed as:
Finding the highest becomes maximizing the right hand side of equation (3). Here is a constant for two givenimage volumes, and the numerator has the same maximum as its logarithm. Substituting from equations (1) and (2) and takinglogarithms we obtain:
hence maximizing is equivalent to minimizing the term:
We use gradient descent to find the deformation that minimizes (4). The 3-D gradient, , at each step of the descent isgiven by the first order derivative of (4):
where is the 3-D image gradient, which is a function of the voxel’s position. Since and can have small values, we adda stabilizing factor to and to the diagonal elements of to regularize the gradient. The empirical value we use is .The 3-D shift is then:
here is a step size constant. In this way, each voxel is guided to search for a counterpart so their match is most probable ac-cording to the statistics gathered from a population. We apply 3-D Gaussian smoothing to the voxels’ 3-D displacements aftereach iteration to smooth the deformation. This compensates for the fact that the dependence between the deformation of neigh-boring voxels is not modeled in the statistical atlas.
This algorithm differs from the previously developed hierarchical deformable registration algorithm[13] in the measure-ment of the goodness of the voxel deformation flow. In this method, we maximize the posterior probability of the current de-formation using statistics gathered from a population, whereas in the previous algorithm we minimize the intensity difference
−80 −60 −40 −20 0 20 40 60 80 1000
0.002
0.004
0.006
0.008
0.01
0.012
0.014
CorpusCallosum
Density Variations Geometric Variations
Figure 6 . A statistical atlas.
D P D Id⟨ | ⟩ P D Id⟨ | ⟩
P D dI( )P dI D( )P D( )
P dI( )---------------------------------= (3)
P D Id⟨ | ⟩ P Id( )
P D Id⟨ | ⟩log 1
2πσ--------------log Id µ–( )2
2σ2---------------------– 1
2π( )3 Φ-------------------------log ϑ∆ ω–( )TΦ 1– ϑ∆ ω–( )
2---------------------------------------------------------–+=
P D Id⟨ | ⟩
Id µ–( )2
2σ2--------------------- ϑ∆ ω–( )TΦ 1– ϑ∆ ω–( )
2---------------------------------------------------------+ (4)
∇
∇ Id µ–σ2
-------------- I∇ Φ 1– ϑ∆ ω–( )+= (5)
I∇ σ Σσ2 Φ I∇ 1+
δD
δD λ∇–= (6)
λ

between spatially corresponding voxels in the atlas and the subject volume. Before undergoing deformation, both algorithmsglobally align the two image volumes to eliminate extrinsic variations[13].
6. Performance of Probabilistic Registration
We evaluate the effectiveness of our model of anatomical variations by comparing registration using the statistical atlas,and registration using the original atlas.
6.1. Evaluation Metric
Since each voxel in the atlas is labelled with the anatomical structure that contains it, when we register the atlas with asubject, we can then assign the label to the corresponding voxel in the subject. This creates acustomized atlaswhich containsclassifications of the subject’s anatomical features. Figure 7 illustrates this process. Given theground-truthclassification of thesubject’s anatomical structures, we can evaluate the quality of the registration by assessing the voxel classification accuracy.
Currently we have 40 subjects’ brain MRIs that have expert classification of one structure, the corpus callosum, in oneplane, the mid-sagittal plane. Figure 8 shows an example. They are not part of the training set, and are used as the test set.
Our error metric is the ratio between the number of mislabelled voxels and the number of expert labelled voxels. Misla-belled voxels include those labelled as corpus callosum in the customized atlas but not by the expert, or vice versa.
6.2. Registration Using the Intensity Statistics Model
First, we assess the effectiveness of the intensity statistics model alone with constant geometric prior probability. The max-imization problem in equation (3) simplifies to , and equation (5) becomes:
We apply this method to the test set, and compute the ratio of mislabelled voxels for all volumes. We find an overall mis-labelled voxel ratio of 3.8%. This is a 14% error reduction over the algorithm with no knowledge guidance[13], which has an
Figure 7 . Illustration of classifying a subject’s anatomical structures through registration with the atlas.
Atlas Subject
3-D Deformable Registration
Atlas Label
Figure 8 . Expert classification of corpus callosum in the mid-sagittal plane of a brain MRI.
P D Id⟨ | ⟩ P Id D⟨ | ⟩∝
∇ Id µ–σ2
-------------- I∇=

error rate of 4.4%.
6.3. Registration Guided by the Geometric Statistics Model
In this experiment, we assess the effectiveness of the geometric statistics model alone, with the intensity statistics assumedto be a constant. The optimum deformation maximizes . The 3-D gradient at each step is the second term in equation (5):
however, alone is insufficient to determine the deformation because it ignores the images being registered. To combine theprior model prediction and the image gradient information, we use their inner product to obtain a 3-D deformation gradient :
this balances the influence of the prior distribution and the fidelity to the image data. We apply this method to the test set, andit yields an overall mislabelled voxel ratio of 4.05%, which is an 8% error reduction
6.4. Registration Using the Statistical Atlas
The statistical atlas combines the strength of the intensity and geometric prior, as derived in equation (5). When applied tothe test set, it has an overall mislabelled voxel ratio of 3.6%, which is a 23% error reduction over the algorithm with no knowl-edge guidance. Figure 9 shows an example of improved registration using the statistical atlas
7. Neighborhood Context
The voxel-based statistics models are efficient at modeling anatomical variations. In reality, however, the deformation of neigh-boring voxels are not independent. Figure 10 shows an example of the deformation flow overlaid on the image data. Note thatthe deformation flow is smooth and congruous locally. A more comprehensive model should consider the dependencies be-tween the 3-D deformation of neighboring voxels.
Modeling neighborhood context can be a direct higher dimensional extension of the voxel-based statistics models. Consid-er a 3-D neighborhood of NxMxK centered at an atlas voxel; the intensity distribution of this neighborhood under a specific
P D( )
∇ Φ 1– ϑ∆ ω–( )=
∇∇̃
∇̃ ∇∇
-------- I∇I∇
-----------• ∇= (7)
Use Statistical AtlasNo Knowledge Guidance
Figure 9 . Comparison of registration results using the original and the statistical atlas.
Figure 10 A close-up on the deformation flow overlaid on theimage data. Note the local smoothness of the deformation.

deformation is modeled as an dimensional Gaussian distribution, where equals NxMxK:
here is an vector of intensity differences between the corresponding neighborhoods in the subject volume and theatlas. is the mean vector of the neighborhood intensity difference distribution; is the covariance matrix ofthe intensity difference distribution. has been adjusted for extrinsic intensity variations
Similarly the geometric variations of a NxMxK neighborhood centered at each atlas voxel can be modeled as a dimen-sional Gaussian distribution of the neighborhood’s 3-D deformation:
where is the mean vector of the neighborhood’s 3-D deformation flow; is the covariance matrix of thegeometric distribution; is the vectors of the neighborhood’s 3-D displacement, and it has been adjusted for extrinsicgeometrical variations. Note that the voxel-based statistics models are a special case of the neighborhood statistics models witha 1x1x1 neighborhood.
8. Registration Using Neighborhood Statistics
We follow the same deduction procedure as in Section 5 to achieve the deformation that maximizes the posterior probabil-ity for a voxel neighborhood; the 3-D gradient of voxels in the neighborhood is:
Theoretically we can implement this algorithm in the same way as the voxel-based statistics models; however, theintensity covariance matrix has distinct entries, and the geometric covariance matrix has
distinct entries. Our image volumes typically have more than 8 million voxels. Even if all entries in the cova-riance matrices can be stored as bytes, the covariance information for each 2x2x2 voxel neighborhood will require 336 MBytememory. Together with other memory requirements, the dimensionality of our image volumes makes this approach impractical.
To simplify the problem, we consider only the interaction between immediate neighbors. Instead of storing interactionsbetween immediate neighbors, we compute them on the fly. We approximate the voxel-neighbor interaction using thegoodnessof its neighbors’ current match according to their prior distributions. Using a weighted-window matching approach, thegood-nessis weighted by the distance between the voxel and the particular neighbor. Therefore, for a voxel neighborhood , the 3-D gradient determined by neighborhood statistics models is a direct extension of equation (5):
8.1. Performance of Neighborhood Statistics Models
We evaluate the effectiveness of neighborhood statistics models in the same fashion as in Section 6. The size of the voxel neigh-borhood we used is 3x3x3.
Registration Guided by Neighborhood Intensity Statistics model:Using only the neighborhood intensity prior model, i.e.,the first term in equation (11) achieves an overall error ratio of 3.18%. This is a 27.7% reduction over the algorithm with noknowledge guidance, and a 16% error reduction over registration guided by voxel-based intensity statistics.
Registration Guided by Neighborhood Geometric Statistics model:Using only the neighborhood geometric prior model,i.e., the second term in equation (11) gives an overall error ratio of 3.76%. This is a 14.6% reduction over the algorithm withno knowledge guidance, and a 7% error reduction over registration guided by voxel-based geometric statistics.
D ℜ ℜ
P Id D⟨ | ⟩ 1
2π( )ℜ Σ--------------------------e
Id µ–( )TΣ 1– Id µ–( )2
-----------------------------------------------–
= (8)
Id ℜ 1×µ ℜ 1× Σ ℜ ℜ×
Id3ℜ
P D( ) 1
2π( )3ℜ Ψ-----------------------------e
ϑ∆ ω–( )TΨ 1– ϑ∆ ω–( )2
-------------------------------------------------------–
= (9)
ω 3ℜ 1× Ψ 3ℜ 3ℜ×ϑ∆ 3ℜ 1×
P D Id⟨ | ⟩
∇ Σ 1– Id µ–( ) I∇ Ψ 1– ϑ∆ ω–( )+= (10)
ℜ ℜ×Σ ℜ ℜ 1+( )( ) 2⁄ 3ℜ 3ℜ× Ψ
3ℜ 3ℜ 1+( )( ) 2⁄
ℵ
∇ wijkId µ–σ2
-------------- I∇
i jki j k, ,∑ wijk Φ 1– ϑ∆ ω–( )[ ]i jk
i j k, ,∑+= ijk ℵ∈ (11)

Registration Guided by Neighborhood Statistics models:Using both the neighborhood intensity and geometric prior distri-butions gives an overall mislabelled voxel ratio of 2.9%. This is a 34% error reduction over the algorithm with no knowledgeguidance. and a 20.6% error reduction over registration guided by voxel-based statistics models. Figure 11 shows an exampleof improved registration using neighborhood statistics models.
These experiments show that the neighborhood statistics models are significantly more effective than voxel-based statisticsmodels. In the case of intensity statistics model, the neighborhood statistics model nearly doubled the error reduction of thevoxel-based statistics model. The geometric statistics model did not seem to be as effective as the intensity statistics model. Weattribute this to its higher dimensionality, which would require a larger training set for more accurate model extraction. We ex-pect a complete implementation of the neighborhood statistics guided registration to yield an even greater improvement in per-formance.
9. Related Work
Many researchers have been exploring the characterization of anatomical variations. Bookstein analyzed the underlyingstatistical and geometric models of morphometrics[7], and applied landmark-based morphometrics to biomedical shape com-parison[8]. Joshi et al. developed mathematical representations for neuro-anatomically significant substructures of the brain andtheir variability in a population[17]. The “shape” of the substructures are quantified via the construction of templates; the vari-ations are represented by defining probabilistic deformations of the template. Gee et al. formulated the image matching problemunder a Bayesian framework, and designed a statistical shape model of the brain extending through the whole organ[16]. Theirmodal basis for describing anatomic variations is derived directly from spatial mappings which bring previous brain samplesinto alignment with a reference configuration. This is similar to our approach, however, no details on knowledge applicationhas been presented for comparison. Thompson et al. developed a 3-D statistical method for assessing structural variations in adatabase of anatomic images[14]. They created a 3-D probabilistic surface atlas of the human brain, which reflects the observedvariability in stereotaxic space of the connected system of anatomic surfaces. Martin et al. characterized neuropathologicalshape deformations using finite element modeling and statistical analysis[9]. Szekely et al. studied flexible parametric shapemodels by combining the mean contour with a set of eigenmodes of the parameters to characterize shape variations[6]. Guimondet al. developed an automatic method to build average intensity and average shape models of the human brain[10]. Wang andStaib incorporated statistical contour models into elastic model based 2-D non-rigid registration[11]. In their research on seg-mentation of magnetic resonance imagery, Kapur et al. considered local spatial coherence using a discrete vector valued MarkovRandom Field model[12]. More recent efforts have combined the strength of physically-based models and statistical models forregistration and segmentation.
10. Conclusion and Future Work
Inter-subject registration is made difficult due to inherent differences between individuals. Characterization of such ana-tomical variations can help improve registration performance. We extract the patterns of variations in the appearances of brainstructures from a training set of 105 T1-weighted MRI. Registration guided by this prior knowledge achieves higher accuracyon a test set of 40 MRI volumes.
We capture the anatomical variations between individuals by registering the training set with a 3-D digital brain atlas, using
With Neighborhood Context Voxel Statistics
Figure 11 Compare registration results given by voxel-based statistics and neighborhood statistics.

a previously developed 3-D hierarchical deformable registration algorithm[13]. This associates each voxel in the atlas withmulti-dimensional distributions of anatomical variations in density and geometry. We evaluate statistical properties of these dis-tributions for a neighborhood of each atlas voxel, and embed these statistics into the brain atlas to build a statistical atlas.
Statistical models embedded in the atlas reflect anatomical variations of a population, and thus can function as prior knowl-edge. It can guide the registration process to tolerate non-pathological variations between individuals while retaining discrim-ination between different structures. When applied to the test set, the knowledge-guided registration gives an overall voxel mis-classification rate of 2.9%; this is a 34% improvement over the performance of the algorithm without knowledge guidance. Ex-periments have also shown that statistical models that incorporate local spatial congruity are more effective than single-voxel-based statistical models.
The statistical atlas was built upon results from a registration algorithm without knowledge guidance. Imprecisions in theresults can affect the rigorousness of the statistical models. To improve model accuracy, we propose to build an initial statisticalatlas from a small but accurately registered training set, then bootstrap it into a more reliable model. Besides guiding deformableregistration, our computational model of anatomical variations can also facilitate quantitative investigation of anatomical dif-ferences between populations, and help detect abnormal variations due to pathology.
AcknowledgmentsThe authors are thankful to the Brigham and Women’s Hospital of the Harvard Medical School for the brain atlas. We are
grateful to Kate Fissell in the Carnegie Mellon Psychology Department, Dr. Daniel Rio in the National Institute of Health, andDr. Matcheri Keshavan in the Western Psychiatric Institute and Clinic of the University of Pittsburgh Medical School, for thebrain MRI data. We owe our gratitude to our colleagues Marie Elm, John A. Hancock, Daniel Morris, and David laRose fortheir insightful comments.
References[1] Christensen et al., “Individualizing Neuroanatomical Atlases Using A Massively Parallel Computer”,IEEE Computer, pp. 32-38, January
1996.[2] Evans et al., “Warping of Computerized 3D Atlas to Match Brain Image Volumes for Quantitative Neuroanatomical and Functional Anal-
ysis.Proceedings of SPIE Medical Imaging, vol. 1445, pp. 236-246.[3] Vemuri et al., “An Efficient Motion Estimator with Applications to Medical Image Registration”,Medical Image Analysis.[4] Bajcsy and Kovacic, “Multiresolution Elastic Matching”,Computer Vision, Graphics, and Image Processing, vol. 46, pp 1-21, 1989.[5] Jean-Philippe Thirion, “Fast Non-Rigid Matching of 3D Medical Images”, INRIA, Technical Report No. 2547, May, 1995.[6] Szekely et al., “Segmentation of 2-D and 3-D objects from MRI volume data using constrained elastic deformations of flexible Fourier
contour and surface models”,Medical Image Analysis, vol. 1, No. 1, pp. 19-34.[7] Bookstein, “Shape and the information in Medical Images: A decade of the Morphometric Synthesis”,Computer Vision And Image
Understanding, vol. 66, No. 2, pp. 97-118, 1997.[8] Bookstein, “Landmark methods for forms without landmarks: morphometrics of group differences in outline shape”,Medical Image
Analysis, vol. 1, No. 3, pp. 225-243.[9] Martin et al., “Characterization of Neuropathological Shape Deformations”,IEEE Transactions on Pattern Analysis and Machine Intel-
ligence, vol. 20, No. 2, 1998.[10] Guimond et al., “Automatic Computation of Average Brain Models”,Proceedings of the First International Conference on Medical Image
Computing and Computer-Assisted Intervention, pp. 631-640, 1998.[11] Wang and Staib, “Elastic Model Based Non-rigid Registration Incorporating Statistical Shape Information”,Proceedings of the First
International Conference on Medical Image Computing and Computer-Assisted Intervention, pp. 1162-1173, 1998.[12] Kapur et al., “Enhanced Spatial Priors for Segmentation of Magnetic Resonance Imagery”,Proceedings of the First International Con-
ference on Medical Image Computing and Computer-Assisted Intervention, pp. 457-468, 1998.[13] Chen et al., “Anomaly Detection through Registration”,Pattern Recognition, vol 32, pp. 113-128, 1999.[14] Thompson et al., “High-Resolution Random Mesh Algorithms for Creating a Probabilistic 3-D Surface Atlas of the Human Brain”,Neu-
roImage, vol 3, No. 1, pp. 19-34, February, 1996.[15] Miller et al., “Statistical methods in computational anatomy”,Statistical Methods in Medical Research, 6:267-299, 1997[16] Gee and Le Briquer, “An Empirical Model of Brain Shape”,Maximum Entropy and Bayesian Methods, August 4-8, 1997.[17] Joshi et al., “On the Geometry and Shape of Brain Sub-Manifolds”,International Journal of Pattern Recognition and Artificial Intelli-
gence, vol. 11, No. 8, pp. 1317-1343, 1997.