Embed Size (px)
Citation preview

Private rental market statistics, monthly rentsrecorded between 1 October 2015 and 30 September 2016 for the South East
South East summary
The median monthly rent was £850 with an interquartile range of £675 to £1,150. These are the second-highest rents in England (London has the highest).
The highest median rents over a unitary authority or country were in Windsor and Maidenhead UA (£1,200), closely followed by Surrey (£1,175). The highest median rents in a South Eastern district were in Elmbridge, Surrey (£1,295).
The lowest median rents in a unitary authority or county were in Isle of Wight UA (£600), followed by nearby Portsmouth UA (£700). The lowest median rents in the South East were in Hastings, East Sussex (£550) –another coastal area.
There is a clear geographical pattern in these rental prices. Districts close to London tend to be the most expensive and prices drop with increasing distance from London, with the cheapest rents found along the coast.
Definitions
Median – when a series of numbers
are arranged by order of magnitude the
median represents the middle value.
Interquartile range – difference
between lower quartile and upper
quartile, representing the middle 50 per
cent of monthly rent values.
Maps
The maps on the following pages show
the median monthly rents for the South
East for each bedroom category.
The ranges for the maps are produced
using ‘natural breaks’; a method that
separates values into groups which are
naturally present in the data. Similar
values are gathered together in such a
way that the differences between
groups are maximised.
The rents contained within each group
are greater than or equal to the lower
bound and strictly less than the upper
bound. For example, a group with a
range of £400 to £450 would contain
rents greater than or equal to £400 and
strictly less than £450.
Readers should take care as some
categories have small sample sizes.
The full tables can be found on the
GOV.UK page for the release.
1
Median and interquartile range of monthly rents by bedroom category: South East between 1 October 2015 and 30
September 2016

2
Private rental market statistics, ‘All’ monthly rentsrecorded between 1 October 2015 and 30 September 2016 for the South East
Statistics derived from fewer than five observations have been suppressed and denoted by ‘-’.
The data used to generate these statistics are based on a sample of rental information, collected by Rent Officers from landlords and letting agents.
The composition of this sample changes over time therefore any differences in median rent may be due to differences in the sample rather than true changes in the rental market.
Key Area
Median
Rent (£)
1 Bracknell Forest UA 950
2 Brighton and Hove UA 1,100
3 Isle of Wight UA 600
4 Medway UA 725
5 Milton Keynes UA 825
6 Portsmouth UA 700
7 Reading UA 925
8 Slough UA 850
9 Southampton UA 750
10 West Berkshire UA 880
11 Windsor and Maidenhead UA 1,200
12 Wokingham UA 1,100
13 Aylesbury Vale 825
14 Chiltern 1,250
15 South Bucks 1,275
16 Wycombe 950
Buckinghamshire
Key Area
Median
Rent (£)
17 Eastbourne 650
18 Hastings 550
19 Lewes 900
20 Rother 700
21 Wealden 825
22 Basingstoke and Deane 860
23 East Hampshire 800
24 Eastleigh 800
25 Fareham 795
26 Gosport 677
27 Hart 975
28 Havant 785
29 New Forest 800
30 Rushmoor 828
31 Test Valley 850
32 Winchester 975
East Sussex
Hampshire
Key Area
Median
Rent (£)
33 Ashford 725
34 Canterbury 850
35 Dartford 848
36 Dover 565
37 Gravesham 750
38 Maidstone 795
39 Sevenoaks 1,175
40 Shepway 569
41 Swale 678
42 Thanet 600
43 Tonbridge and Malling 950
44 Tunbridge Wells 900
45 Cherwell 850
46 Oxford 1,150
47 South Oxfordshire 950
48 Vale of White Horse 900
49 West Oxfordshire 850
50 Elmbridge 1,295
51 Epsom and Ewell 1,250
52 Guildford 1,225
53 Mole Valley 1,175
54 Reigate and Banstead 1,050
55 Runnymede 1,173
56 Spelthorne 1,100
57 Surrey Heath 1,025
58 Tandridge 1,200
59 Waverley 1,050
60 Woking 1,175
61 Adur 825
62 Arun 750
63 Chichester 895
64 Crawley 925
65 Horsham 950
66 Mid Sussex 950
67 Worthing 740
West Sussex
Kent
Oxfordshire
Surrey
Private rental market statistics, ‘Room’ monthly rentsrecorded between 1 October 2015 and 30 September 2016 for the South East
3
Statistics derived from fewer than five observations have been suppressed and denoted by ‘-’.
The data used to generate these statistics are based on a sample of rental information, collected by Rent Officers from landlords and letting agents.
The composition of this sample changes over time therefore any differences in median rent may be due to differences in the sample rather than true changes in the rental market.
Key Area
Median
Rent (£)
1 Bracknell Forest UA 550
2 Brighton and Hove UA 424
3 Isle of Wight UA 368
4 Medway UA 350
5 Milton Keynes UA 365
6 Portsmouth UA 375
7 Reading UA 450
8 Slough UA 433
9 Southampton UA 395
10 West Berkshire UA 490
11 Windsor and Maidenhead UA 500
12 Wokingham UA 625
13 Aylesbury Vale 380
14 Chiltern -
15 South Bucks 400
16 Wycombe 360
Buckinghamshire
Key Area
Median
Rent (£)
17 Eastbourne 450
18 Hastings 459
19 Lewes -
20 Rother 260
21 Wealden 425
22 Basingstoke and Deane 368
23 East Hampshire -
24 Eastleigh 415
25 Fareham 400
26 Gosport -
27 Hart 600
28 Havant -
29 New Forest 450
30 Rushmoor 433
31 Test Valley 347
32 Winchester 455
East Sussex
Hampshire
Key Area
Median
Rent (£)
33 Ashford 390
34 Canterbury 375
35 Dartford 500
36 Dover 325
37 Gravesham -
38 Maidstone 446
39 Sevenoaks 340
40 Shepway 282
41 Swale 347
42 Thanet 335
43 Tonbridge and Malling -
44 Tunbridge Wells 381
45 Cherwell 450
46 Oxford 525
47 South Oxfordshire 433
48 Vale of White Horse 550
49 West Oxfordshire 390
50 Elmbridge 600
51 Epsom and Ewell 446
52 Guildford 440
53 Mole Valley -
54 Reigate and Banstead -
55 Runnymede 500
56 Spelthorne 598
57 Surrey Heath 490
58 Tandridge -
59 Waverley 403
60 Woking -
61 Adur 390
62 Arun 347
63 Chichester 410
64 Crawley 475
65 Horsham 500
66 Mid Sussex 438
67 Worthing 420
West Sussex
Surrey
Kent
Oxfordshire

Private rental market statistics, ‘Studio’ monthly rentsrecorded between 1 October 2015 and 30 September 2016 for the South East
4
Statistics derived from fewer than five observations have been suppressed and denoted by ‘-’.
The data used to generate these statistics are based on a sample of rental information, collected by Rent Officers from landlords and letting agents.
The composition of this sample changes over time therefore any differences in median rent may be due to differences in the sample rather than true changes in the rental market.
Key Area
Median
Rent (£)
1 Bracknell Forest UA -
2 Brighton and Hove UA 650
3 Isle of Wight UA 395
4 Medway UA 445
5 Milton Keynes UA 535
6 Portsmouth UA 495
7 Reading UA 700
8 Slough UA 600
9 Southampton UA 490
10 West Berkshire UA 550
11 Windsor and Maidenhead UA 540
12 Wokingham UA 550
13 Aylesbury Vale 500
14 Chiltern -
15 South Bucks 650
16 Wycombe 625
Buckinghamshire
Key Area
Median
Rent (£)
17 Eastbourne 495
18 Hastings 375
19 Lewes 554
20 Rother 385
21 Wealden 575
22 Basingstoke and Deane 525
23 East Hampshire 463
24 Eastleigh 425
25 Fareham 498
26 Gosport 498
27 Hart -
28 Havant 450
29 New Forest 480
30 Rushmoor 595
31 Test Valley 550
32 Winchester 650
East Sussex
Hampshire
Key Area
Median
Rent (£)
33 Ashford 475
34 Canterbury 585
35 Dartford 563
36 Dover 350
37 Gravesham 500
38 Maidstone 495
39 Sevenoaks 600
40 Shepway 375
41 Swale 495
42 Thanet 350
43 Tonbridge and Malling 515
44 Tunbridge Wells 515
45 Cherwell 558
46 Oxford 673
47 South Oxfordshire 583
48 Vale of White Horse 638
49 West Oxfordshire 595
50 Elmbridge 695
51 Epsom and Ewell 750
52 Guildford 760
53 Mole Valley 695
54 Reigate and Banstead 625
55 Runnymede 725
56 Spelthorne 725
57 Surrey Heath 500
58 Tandridge -
59 Waverley 650
60 Woking 750
61 Adur 545
62 Arun 450
63 Chichester 550
64 Crawley 650
65 Horsham 595
66 Mid Sussex 573
67 Worthing 495
Kent
Oxfordshire
Surrey
West Sussex
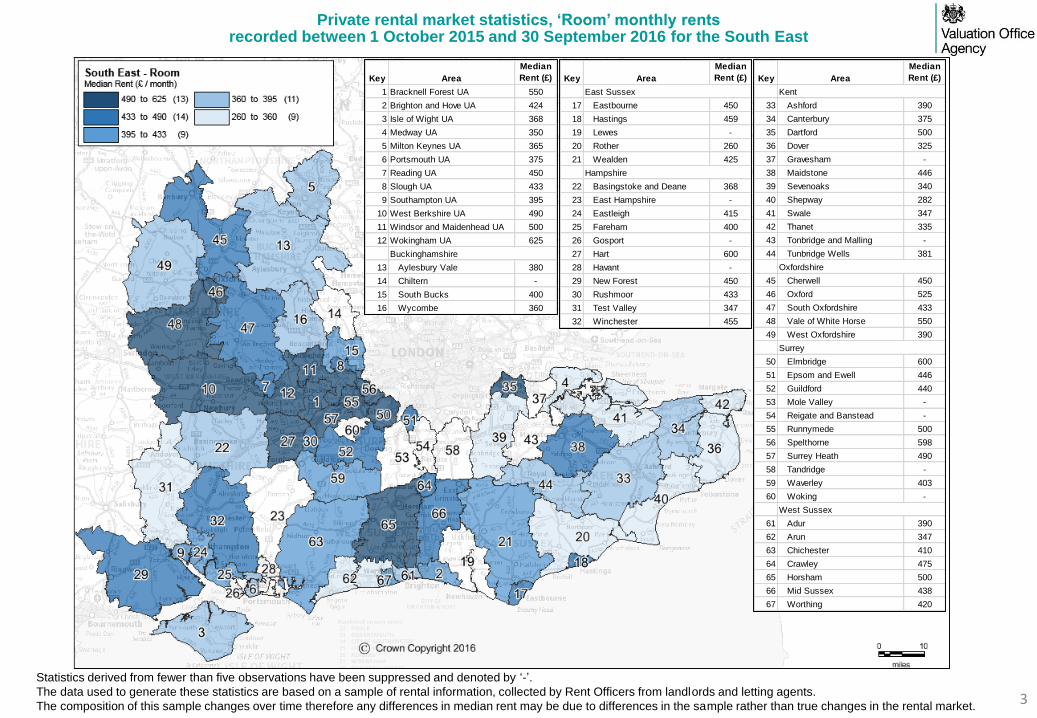
Private rental market statistics, ‘One Bedroom’ monthly rentsrecorded between 1 October 2015 and 30 September 2016 for the South East
5
Statistics derived from fewer than five observations have been suppressed and denoted by ‘-’.
The data used to generate these statistics are based on a sample of rental information, collected by Rent Officers from landlords and letting agents.
The composition of this sample changes over time therefore any differences in median rent may be due to differences in the sample rather than true changes in the rental market.
Key Area
Median
Rent (£)
1 Bracknell Forest UA 775
2 Brighton and Hove UA 825
3 Isle of Wight UA 450
4 Medway UA 575
5 Milton Keynes UA 675
6 Portsmouth UA 573
7 Reading UA 825
8 Slough UA 750
9 Southampton UA 595
10 West Berkshire UA 675
11 Windsor and Maidenhead UA 850
12 Wokingham UA 795
13 Aylesbury Vale 650
14 Chiltern 800
15 South Bucks 885
16 Wycombe 750
Buckinghamshire
Key Area
Median
Rent (£)
17 Eastbourne 584
18 Hastings 450
19 Lewes 653
20 Rother 500
21 Wealden 625
22 Basingstoke and Deane 710
23 East Hampshire 625
24 Eastleigh 625
25 Fareham 625
26 Gosport 550
27 Hart 725
28 Havant 600
29 New Forest 625
30 Rushmoor 725
31 Test Valley 635
32 Winchester 750
East Sussex
Hampshire
Key Area
Median
Rent (£)
33 Ashford 600
34 Canterbury 650
35 Dartford 700
36 Dover 450
37 Gravesham 600
38 Maidstone 650
39 Sevenoaks 800
40 Shepway 425
41 Swale 525
42 Thanet 450
43 Tonbridge and Malling 725
44 Tunbridge Wells 695
45 Cherwell 675
46 Oxford 900
47 South Oxfordshire 738
48 Vale of White Horse 735
49 West Oxfordshire 695
50 Elmbridge 900
51 Epsom and Ewell 975
52 Guildford 900
53 Mole Valley 875
54 Reigate and Banstead 800
55 Runnymede 895
56 Spelthorne 895
57 Surrey Heath 795
58 Tandridge 800
59 Waverley 790
60 Woking 895
61 Adur 650
62 Arun 575
63 Chichester 675
64 Crawley 800
65 Horsham 715
66 Mid Sussex 720
67 Worthing 623
West Sussex
Kent
Oxfordshire
Surrey

Private rental market statistics, ‘Two Bedrooms’ monthly rentsrecorded between 1 October 2015 and 30 September 2016 for the South East
6
Statistics derived from fewer than five observations have been suppressed and denoted by ‘-’.
The data used to generate these statistics are based on a sample of rental information, collected by Rent Officers from landlords and letting agents.
The composition of this sample changes over time therefore any differences in median rent may be due to differences in the sample rather than true changes in the rental market.
Key Area
Median
Rent (£)
1 Bracknell Forest UA 925
2 Brighton and Hove UA 1,100
3 Isle of Wight UA 595
4 Medway UA 725
5 Milton Keynes UA 825
6 Portsmouth UA 700
7 Reading UA 990
8 Slough UA 950
9 Southampton UA 790
10 West Berkshire UA 850
11 Windsor and Maidenhead UA 1,150
12 Wokingham UA 1,000
13 Aylesbury Vale 800
14 Chiltern 1,095
15 South Bucks 1,150
16 Wycombe 950
Buckinghamshire
Key Area
Median
Rent (£)
17 Eastbourne 775
18 Hastings 600
19 Lewes 850
20 Rother 650
21 Wealden 768
22 Basingstoke and Deane 850
23 East Hampshire 800
24 Eastleigh 790
25 Fareham 750
26 Gosport 675
27 Hart 925
28 Havant 750
29 New Forest 775
30 Rushmoor 880
31 Test Valley 775
32 Winchester 895
East Sussex
Hampshire
Key Area
Median
Rent (£)
33 Ashford 720
34 Canterbury 810
35 Dartford 858
36 Dover 590
37 Gravesham 750
38 Maidstone 795
39 Sevenoaks 1,050
40 Shepway 585
41 Swale 670
42 Thanet 625
43 Tonbridge and Malling 895
44 Tunbridge Wells 950
45 Cherwell 830
46 Oxford 1,100
47 South Oxfordshire 925
48 Vale of White Horse 895
49 West Oxfordshire 833
50 Elmbridge 1,195
51 Epsom and Ewell 1,250
52 Guildford 1,250
53 Mole Valley 1,150
54 Reigate and Banstead 1,075
55 Runnymede 1,195
56 Spelthorne 1,150
57 Surrey Heath 1,000
58 Tandridge 1,100
59 Waverley 1,050
60 Woking 1,175
61 Adur 850
62 Arun 775
63 Chichester 850
64 Crawley 950
65 Horsham 925
66 Mid Sussex 900
67 Worthing 825
Surrey
West Sussex
Kent
Oxfordshire

Private rental market statistics, ‘Three Bedrooms’ monthly rentsrecorded between 1 October 2015 and 30 September 2016 for the South East
7
Statistics derived from fewer than five observations have been suppressed and denoted by ‘-’.
The data used to generate these statistics are based on a sample of rental information, collected by Rent Officers from landlords and letting agents.
The composition of this sample changes over time therefore any differences in median rent may be due to differences in the sample rather than true changes in the rental market.
Key Area
Median
Rent (£)
1 Bracknell Forest UA 1,250
2 Brighton and Hove UA 1,400
3 Isle of Wight UA 735
4 Medway UA 800
5 Milton Keynes UA 975
6 Portsmouth UA 850
7 Reading UA 1,195
8 Slough UA 1,200
9 Southampton UA 900
10 West Berkshire UA 1,025
11 Windsor and Maidenhead UA 1,425
12 Wokingham UA 1,300
13 Aylesbury Vale 1,000
14 Chiltern 1,450
15 South Bucks 1,350
16 Wycombe 1,295
Buckinghamshire
Key Area
Median
Rent (£)
17 Eastbourne 925
18 Hastings 795
19 Lewes 1,100
20 Rother 880
21 Wealden 975
22 Basingstoke and Deane 995
23 East Hampshire 995
24 Eastleigh 950
25 Fareham 925
26 Gosport 808
27 Hart 1,250
28 Havant 895
29 New Forest 950
30 Rushmoor 1,100
31 Test Valley 950
32 Winchester 1,150
East Sussex
Hampshire
Key Area
Median
Rent (£)
33 Ashford 895
34 Canterbury 995
35 Dartford 1,100
36 Dover 750
37 Gravesham 900
38 Maidstone 950
39 Sevenoaks 1,300
40 Shepway 704
41 Swale 775
42 Thanet 775
43 Tonbridge and Malling 1,100
44 Tunbridge Wells 1,200
45 Cherwell 995
46 Oxford 1,370
47 South Oxfordshire 1,230
48 Vale of White Horse 1,050
49 West Oxfordshire 1,035
50 Elmbridge 1,500
51 Epsom and Ewell 1,500
52 Guildford 1,450
53 Mole Valley 1,500
54 Reigate and Banstead 1,350
55 Runnymede 1,400
56 Spelthorne 1,363
57 Surrey Heath 1,250
58 Tandridge 1,300
59 Waverley 1,350
60 Woking 1,375
61 Adur 1,100
62 Arun 950
63 Chichester 1,050
64 Crawley 1,150
65 Horsham 1,250
66 Mid Sussex 1,200
67 Worthing 1,025
West Sussex
Kent
Oxfordshire
Surrey

Private rental market statistics, ‘Four or more Bedrooms’ monthly rentsrecorded between 1 October 2015 and 30 September 2016 for the South East
8
Statistics derived from fewer than five observations have been suppressed and denoted by ‘-’.
The data used to generate these statistics are based on a sample of rental information, collected by Rent Officers from landlords and letting agents.
The composition of this sample changes over time therefore any differences in median rent may be due to differences in the sample rather than true changes in the rental market.
Key Area
Median
Rent (£)
1 Bracknell Forest UA 1,625
2 Brighton and Hove UA 2,145
3 Isle of Wight UA 950
4 Medway UA 1,225
5 Milton Keynes UA 1,400
6 Portsmouth UA 1,400
7 Reading UA 1,763
8 Slough UA 1,485
9 Southampton UA 1,300
10 West Berkshire UA 1,600
11 Windsor and Maidenhead UA 2,200
12 Wokingham UA 1,750
13 Aylesbury Vale 1,495
14 Chiltern 2,250
15 South Bucks 2,525
16 Wycombe 1,750
Buckinghamshire
Key Area
Median
Rent (£)
17 Eastbourne 1,300
18 Hastings 1,025
19 Lewes 1,550
20 Rother 1,325
21 Wealden 1,600
22 Basingstoke and Deane 1,495
23 East Hampshire 1,595
24 Eastleigh 1,295
25 Fareham 1,425
26 Gosport 1,175
27 Hart 1,700
28 Havant 1,175
29 New Forest 1,395
30 Rushmoor 1,425
31 Test Valley 1,600
32 Winchester 1,795
East Sussex
Hampshire
Key Area
Median
Rent (£)
33 Ashford 1,250
34 Canterbury 1,500
35 Dartford 1,538
36 Dover 875
37 Gravesham 1,325
38 Maidstone 1,300
39 Sevenoaks 2,350
40 Shepway 950
41 Swale 1,090
42 Thanet 973
43 Tonbridge and Malling 1,650
44 Tunbridge Wells 2,150
45 Cherwell 1,450
46 Oxford 2,080
47 South Oxfordshire 1,975
48 Vale of White Horse 1,575
49 West Oxfordshire 1,500
50 Elmbridge 3,600
51 Epsom and Ewell 2,175
52 Guildford 2,200
53 Mole Valley 2,300
54 Reigate and Banstead 1,900
55 Runnymede 1,950
56 Spelthorne 1,695
57 Surrey Heath 2,000
58 Tandridge 2,150
59 Waverley 2,250
60 Woking 2,300
61 Adur 1,398
62 Arun 1,395
63 Chichester 1,495
64 Crawley 1,500
65 Horsham 1,610
66 Mid Sussex 1,700
67 Worthing 1,400
Kent
Oxfordshire
Surrey
West Sussex