Embed Size (px)
Citation preview

STUDY ON
PRIVATE INVESTMENT IN THE OIC COUNTRIES BETWEEN STRATEGIC ALLIANCES
AND TRADE PROMOTION
SUBMITTED BY
THE ISLAMIC CENTRE FOR DEVELOPMENT OF TRADE
TO
THE WORKSHOP ON :
"THE PRIVATE SECTOR INVESTMENT IN THE OIC MEMBER COUNTRIES
AND THE ROLE OF IDB"
Istanbul, 14-16 September 2002

1
PRIVATE INVESTMENT IN THE OIC COUNTRIES
BETWEEN STRATEGIC ALLIANCES AND TRADE PROMOTION
GENERAL INTRODUCTION: Since a few years, the merging of enterprises has been invested with an international dimension to the extent that the transnational merger-acquisition operations have become in 1999 the most important component of the world Foreign direct investment flows (FDI). According to some estimates, these flows have accounted for 92% of total FDI in 1999 against less than 60% in 1995. These groupings have rapidly progressed in the 90’s, their volume increased from 153 billion US dollars in 1990 to about 1000 billion in 2000. They have played a major role in the globalisation and restructuring of activities, with an increasing tendency towards large-scale the operations. The development of merger-acquisitions may be explained by the fact that enterprises are inclined to sell or buy assets abroad instead of investing in the building of new installations. Compared to the building of new installations, the advantage of the acquisition of the existing assets allows to rapidly gaining ground in a market by immediately taking possession of a critical mass of installations and intangible assets in a given industrial sector. Several factors have contributed to the speeding up of such activity in this field worldwide, namely, trade and capital flows liberalisation, the quick technological changes and the rapid progress of information technologies. Privatisations and the reforms of regulations in some sectors and services of public purposes such as financial services, telecommunications and electricity have also played an important role1.
1 Le nouveau visage de la mondialisation industrielle. Fusions-acquisitions et
alliances stratégiques transnationales, OCDE, 13 novembre 2001.

2
Graph n° 1 Transnational mergers acquisitions and FDI inflows
0
200
400
600
800
1000
1995 1996 1997 1998 1999
0%
20%
40%
60%
80%
100%
Transnational Mergers acquisitions (in billion US $)
Total FDI inflows (in billion US $)
Transnational Mergers acquisitionsin comparison with the FDI inflows(in percentage)
Source: Thomson Financial et CNUCED, 2000
What stakes for Developing countries? In so far as developing countries are seeking integration in the world economy, it has become imperative for enterprises to collaborate more closely with authorities and between them. These agents should overcome reciprocal mistrust and set up in concert and harmoniously joint collaboration measures and strategies. As far as companies are concerned, sharing costs and acquired experiences may set up trade relationships. In the industrialised world, companies are more inclined to share the assets costs such as infrastructure, premises, the staff, storing, transport and repairing services, telecommunication systems as well as the common marketing of complementary products. Developing countries should find out their own joint ventures patterns, value added partnership, strategic alliances and cooperation agreements. In fact, in the future the sharing of risks and partnerships are expected to prevail2. Actually, if in the past, Developing countries have led an important import-substitution policy and that technology
2 Forum du commerce international; CCI 01 septembre 1999 page 11.
3
acquisition mainly consisted in imitating techniques used in developed countries, Developing countries are currently more and more focusing on exports oriented policies that require alliances and targeting foreign markets as well as the acquisition of the know-how and technology, which are henceforth established by the world market3. While the life cycles of technology and products are more and more getting shorter, technology and know-how are to a greater extent considered as basic assets that would allow facing competition on national and international markets. For the last two decades, inter-enterprises agreements have considerably developed, contracts by mutual agreement, franchising, concession and sub-contracting contracts are ever more growing. Besides, the recent agreements between air-companies, car manufacturers, information systems companies, insurance companies and Banks are a good evidence of such a development. The impressive merging of Daimler and Chrysler, the buying up of Volvo by Ford, the Renault-Nissan alliance, the attempt of General Motors to take over Daewoo, the absorption of Kia by Hyundai, the buying up of Bentley, Lamborghini and Bugatti by Volkswagen and of Rolls Royce by BMW, in addition to several other merger-acquisitions between manufacturers of components that have started several years ago4 seem to have produced a wave of contacts, negotiations, buyouts and alliances in car industry, which seem more irresistible particularly as similar waves have been noted in other sectors, such as pharmacy, aeronautics, banks insurance, telecommunications, agro food and information technology etc…
3 Renforcement des capacités technologiques : ONUDI, OMC,
IP/C/WW/243/Add2, 16 mars 2001, p 5. 4 Michel Freyssinet fusions acquisitions alliances et internationalisation, quelles
logiques, quelles perspectives?-Université Montesquieu, Bordeaux, éditorial de la lettre du GERPISA (groupe d’études et de recherche permanent sur l’industrie et les salaires de l’automobile), avril 1999, p 1.

4
FIRST PART
STRATEGIC ALLIANCES AND OTHER FORMS OF PARTNERSHIP:
It is generally recognized that partnership agreements are old practices in the industrial world. Garette and Dussage (1995) note the development by the late 60’s of joint ventures (JV)-which constitute the archetype of alliances-within the framework of multinational operations. However, it is the 80’s, which mark the real growth of inter-corporations cooperation. During this period, alliances have grown in number in a context propitious for globalisation and a rapid technological evolution.
Unlike, the previous cooperation forms, which are more properly targeted (licenses, franchising, sub-contracting…), it has been established that strategic alliances allow corporations to build up or acquire in the long run, major strategic skills and to derive benefit from a competitive advantage (Hamel and Pralahad, 1990)5. I. THE NOTION OF ALLIANCE : The several definitions of the concept of alliance are growingly extensive and more or less operational. They can include the most restraining modalities such as the takeover or less constraining ones such as franchising or sub-contracting, transfer of licences or acquisitions.
Strategic alliances consist in long-term agreements concluded between independent companies. These are cooperative arrangements that were set up so as to reach strategic objectives (LORANGE and ROOS, 1982).
5 PERROT Pascal Université de Rennes 2, RUFFIO Philippe , GUILLOUZO
Raymond « Les alliances stratégiques au service du développement des coopératives agroalimentaires (le cas de l’ouest de la France) » 23ème Congrès international du CIRIEC « Economie Sociale et Economie Publique : Nouvelles formes de coopération à l’ère de la mondialisation »13 – 14 juin 2000, Montréal, Québec, Canada.
5
According to the French Standard Association (AFNOR), alliances are: “a frame of mind making possible the establishment of relationships between partners, sharing and seeking the same medium term objectives, in conditions favouring reciprocity of advantages”.
We can also define an alliance as a new organisation entailing long-lasting and perceptible reductions in costs and generating a higher standard quality and a permanent innovation. Such an organisation is based on three main pillars: The redefinition of the roles of the different actors of the
industrial branch. Internal organisation structures, which rely more on
project logic than on a professional logic. The creation of a supplier’s network, which encourages
and facilitates cooperation between all enterprises that are involved in the implementation of the project.
Therefore, alliances represent a modality that would bring closer two or several companies, legally independent, whose objective is to pool their financial and human resources and know-how with a view to jointly carrying out activities dealing with a strategic field such as research and development (R&D), production, marketing etc. Companies agree on an objective, on means, as well as on sharing and controlling results while resorting to less formal modalities. In most cases, they sign contracts that govern the legal and economic aspects of their alliances, as well as its duration. It also happens that they choose arrangements that are more formal such as joint subsidiary companies or joint ventures.
II. THE DIFFERENT FORMS OF ALLIANCES :
PARTNERSHIP or ALLIANCE: In its broadest sense, partnership may refer to strategic alliances, partnerships, joint ventures, collaboration agreements, enterprises networks and coalitions.
Most of alliances may be gathered under the category of horizontal alliances, or under that of vertical alliances. Yet, it

6
happens sometimes that in view of their scope, certain alliances integrate vertical and horizontal components in their structure6. We may also classify alliances according to an organisational criterion based on the shape taken by the cooperation agreement: Is it only a delegation, a concession for the benefit of an already existing entity (sub-contracting strategy) or would it lead to a new entity (integration strategy)7. A. Sub-contracting strategies :
At present, in all the sectors, we may note an increase in sub-contracting practices (contracting out, joint subcontracting and concession), as concerns, products as well as the services sector. An enterprise may contract out functions or the production of sub-systems and components.
Licensing:
Through licensing, the licensor gives to the licensee the right to derive benefit and exploit fundamental and protected values of the enterprise (brands, devices, production processes, distribution channels…)
Thus, the licensee remains dependent on the licensor, at least from the legal point of view (the awarding by the Swiss chemical industry of licences for the production and sales of medicine to foreign companies whose head office is in the United States). In several cases, the enterprise sells also the production plant to the licensee and gives him the necessary instructions for the organisation of production and sales according to their own pattern.
6 There are four kinds of alliances:
- Horizontal alliances (arrangements between competing enterprises producing similar or identical products with a view to limiting competition);
- Vertical alliances (arrangements between enterprises intervening in the different stages of the production-distribution process);
- Mergers - Acquisitions
7 Marketing course of Geneva university , academic year 1999-2000.

7
Most of the business investments will be borne by the licensee. This way, the national enterprise can develop its line of products (eventually, other brands) on difficult markets and partly lagging behind. This way it can save money and invest solely in research and innovation and in the development of new products.
The overall returns of the product line can be basically improved by the supply of licensed products in cross-border markets.
In spite of being interesting, licensing conventions, dictate to international firms several legal and economic precautions, so as to avoid that the licensee becomes a rival.
The basic difference between the licensing convention and franchising, lies in the fact that the licensee remains in principle free on the way and means to sell its product, while the efforts of its counterpart, the franchiser will be strictly restrained on the market and at the same time stimulated thanks to the concept of international franchising provided by the licensor (ex Mac Donald’s restaurants and/or hotels).8 - Sub contracting :
It is an operation through which an entrepreneur, main contractor or prime contractor) entrusts under his responsibility to another person called sub-contractor, the task of carrying out and fulfilling the terms of all or a part of the contract or the market.
Such a definition allows the distinction of another enterprise’s sub-contactor:
The products of the Sub contractor are in general part of the final product but they do not constitute the whole of the final product;
The sub-contactor has not in general established any direct contact with the final consumer; it is the main contractor who establishes such contact.
8 IBID

8
We may distinguish several kinds of sub-contracting : Standard subcontracting Simple subcontracting Extended subcontracting Strategic subcontracting Sub-contracting in partnership
For the enterprise, subcontracting may be a way of getting known and doing business worldwide (internationalisation), in case the enterprise (the main contractor) is undertaking an international activity. It may also lead to the internationalisation of the main contractor if the latter contracts out all or part of a product abroad.
Special case: The original equipment manufacturers (OEM) contract, the prime contractor is called OEM or sourcer, while the components suppliers are considered as the manufacturers of OEM products, that is to say subcontractors.
In an OEM contract, the negotiating power between both parties is often in the interest of the prime contractor. It is not often the case in prime contractor/subcontractor normal relationship. Sometimes, the subcontractor is provided with a special competence or skill, which gives him a special power vis-à-vis, the prime contractor. This certainly explains partly the development of international subcontracting.
The reasons of such development are numerous. The contractor may wish to concentrate on his basic
skills; He may try to reduce the production costs. Each stage of
the supply chain is heading for international subcontracting;
The subcontractor may through his specialisation, be an innovation source
The potential prime contractor may be confronted with a fluctuating demand.

9
In this order, subcontracting implies an increasingly important coordination degree between both parties as the assigned task is more intricate. - FRANCHISING:
A company in a country (the franchiser) authorises a company in another country (franchisee) to use its trademark, its logo and or its production or marketing techniques against the payment of royalties.
There are several kinds of franchising: - Industrial franchising: In this case, the franchiser is a
manufacturer, who concedes to another manufacturer a licence that allows him to use its method and know-how (coca cola for example).
- Services franchising: in this case, the contract provides for the dissemination of a method and know-how (for example Mac Donald’s or Jean Louis Davis). This form of franchising has developed and currently accounts for 40% of franchised sales outlets.
- Production franchising: the franchiser is a producer, who sells his products in shops, which exploits his brand and its reputation (Yves Rocher or Benetton for example).
- Distribution franchising: In this case the franchiser is a wholesaler, who develops a device and disseminates a collection, which he selected with suppliers or which was designed for him (Manoukian or Pronuptia for example).
Concession and agreement:
1. CONCESSION:
The concession is a contract linking a supplier to a merchant, to whom exclusively sells his products, provided that he accepts a trade, accounting and even financial control of his enterprise and sometimes he undertakes to get his supplies from this sector and exclusively from the licensor. Such definition shows that the concession may be a mode of selective distribution and eventually exclusive.

10
- Selective concession: In this case, the producer carefully chooses his distributors and limits the number of sales outlets where his products will be distributed. The selection takes place according to a criterion taking into account the size, and especially the reception, skills and even advice proposed to customers. As concerns the producer, it results in a reduction in distribution costs and allows a qualitative control of sales outlets. Yet, the market coverage remains limited. No exclusivity is imposed on distributors. - Exclusive concession: It is an exclusive concession coupled with and exclusivity clause. In this case, the enterprise does not any more choose sales outlets but some distributors that have exclusive distribution rights of its products in a determined geographical sector. The objective of such a strategy is to enable the development and strengthening of a brand image. That is why; the exclusive concession is often reserved to luxury products or up-market products. The advantage of such a concession lies in the fact that it allows an excellent quality control of sales; it offers the possibility of a light investment for the producer in terms of sales force and logistics but the disadvantage is that is ensures only a weak market coverage in view of the small number of the selected sales outlets. Besides, the control and recruiting of distributors is not often easy. 2. THE AGREEMENT : It is the less restraining form of agreements between enterprises, because it does not provide for any exclusivity condition. The agreement falls within the framework of an intensive distribution policy that will consists in distributing products in maximum sales outlets. The advantage of the

11
agreement lies in the fact that it allows the coverage of an important geographical sector, to conquer high market shares, and make known products rapidly, whence an increase in the turnover. Yet, in keeping with such a strategy, the enterprise must be able to supply to distributors and in very short time limits large quantities. However, such a strategy is only conceivable for enterprises of a certain size. The major characteristics of the agreement may be summarized as follows:
The licensor should designate other distributors in the zone attributed to the franchise holder
The franchise holder does not undertake not to sell competing products.
Yet, the absence of exclusivity does not prevent the application of the essential principles of the concession contract, namely the possibility for the distributor to benefit from the promotional actions of the licensor. - The setting up of a joint subsidiary company: (joint venture) When it concerns companies of different nationalities. In this event, two companies decide to create a common subsidiary company as legal entity. The legal status is freely chosen.
- In general, the “best” subcontracting operations, in other words the easiest operations that can be assessed without difficulty. Through subcontracting, the major subcontracting enterprise should provide a competitive advantage, either in terms of cost, quality or exclusivity, while keeping its self-autonomy. Only limited strategy operations should be contracted out.

12
III/ INTEGRATION STRATEGIES : A/ Integration technique of patrimonial kind : There are three categories:
1. Merger 2. Merger-takeover 3. partial business transfer
Merger is a legal operation that consists in regrouping into one company several companies. For instance, if two companies, that is to say A and B, merge, the operation will result in the breaking up of these companies. Their assets will be unified. A new company will be created by incorporating the assets and liabilities of both A and B companies. Merger-takeover: It is characterised by the take over of a company by another one. Through this operation, the assets of the company, which has taken over the other one, increase. The company, which was taken over, breaks up, but without the creation of a new legal entity as in the previous case. The new owner should increase its capital and assign new securities to shareholders of the company, which was taken over. Partial business transfer: In this case, a company brings assets into another business. For example if the company A brings partial assets for the benefit of a company B, the latter will bring in return, securities to the latter. B/ Integration techniques of financial kind: In this case, it is question of the acquisition, takeover and the setting up of a trust. Acquisition: We speak of acquisition when a company becomes owner of a part of securities by another company. It is considered as an acquisition when the held percentage ranges between 10 to

13
50% of the company’s capital (beyond this percentage it becomes a takeover). Takeover: It is characterised by the holding of a percentage higher than 50%. For example if a company A holds more than 50% of a company B, it becomes a subsidiary company of the company A. However, we may speak of takeover even if the acquisition is lower than 50%. Such techniques are often used for the acquisition of enterprises within the framework of a tender offer. The tender offer is a technique through which a company proposes to the partners of a company that is highly sought after to buy their securities at a rate higher than that of the stock exchange for a limited period, with a view to taking over the targeted company. A tender offer might be friendly or unfriendly. Penetration strategies to foreign markets may therefore be limited to financial participations. In the event of venture capital, the adopted strategy consists in making a profitable investment abroad without any particular ambition to control the management of enterprises. In the seventies, the inflow of the Libyan capital in Fiat Company, at a time when the latter was experiencing great difficulties at production level is an eloquent example. After having clarifying the notions of partnership and alliances, we will deal with the stakes and difficulties related to the implementation process.

14
IV/ THE STATE OF ALLIANCES: A/ Sector-based distribution of alliances9: Porter and Alii (1986:353) have recorded a sector-based shifting of strategic alliances from ripe sectors towards high-tech sectors. Such a trend conflicts with the idea according to which alliances started in high-tech sectors before spreading in a second stage to ripe sectors. In the seventies, cooperation agreements mainly concerned metals, minerals, energy and chemical sectors. While cooperation agreements have constantly declined in the seventies, in the two first sectors, they have recorded a development in the energy sector immediately after the two oil crises. On the other hand, according to Porter and alii, increased alliances in the computer sector have increased in the early eighties. They explain the enhancement of cooperation in the chemicals and computer sectors by their technological intensity. In a latest study, Hagedoorn (1996:602-3) confirms this sector-based shifting of alliances. Actually, in the mid-seventies, strategic alliances were almost inexistent in high technologies such as information technologies, biotechnologies and new materials. Until 1979, alliances in the traditional sectors were more numerous than those in the high-tech areas. But since the 80’s, high-tech strategic alliances have prevailed.
9 Mohamed El Filali El Youssefi, under the supervision of Jorge Niosi. Strategic
alliances between in the globalisation era and of the changes of technological paradigms, Journal of Crises collection “Working papers”.

15
Table n°1 Sector-based distribution of alliances (1980-1993)
Distribution Sectors (%)
Biotechnology 16,2 Microélectronics 15,63 Chemicals 9,34 New matérials 9,29 Télécommunication 8,6 Software 8,55 Air-craft industry/defence 6,82 Industrial automation 5,86 computers 5,3 Car industry 4,3 Other Information Technologies 2,26 Heavy electrical industry 2,00 Technical Instruments 1,74 Électronics 1,69 Food and beverages 1,61 consumption 0,83 Others Total 100,00
Source : Hagedoorn et Narula, 1996.
Such results are corroborated by the study of Menguzzato and Reneau (1992:142), which shows the strong tendency to cooperate and its evolution in the 80’s vary according in the different sectors. Actually, in the young sectors (information, biotechnology) by a relatively important growth potential, a higher technological intensity and a higher globalisation degree, the propensity to cooperation is greater. In sectors, such as the information technologies and biotechnologies, technology is very complex and rapidly changing. Furthermore, they are young (biotechnology) and growing (information) sectors in addition of being globalised sectors. Hergert and Morris (1988:105) draw attention to the concentration of cooperation agreements in five major industries, which alone account for 87% of alliances. Such a result is not surprising since all these sectors are characterised by high entry costs, strong globalisation, scales economies, and by a very changing technology and finally they are considered as being high risk sectors. These are telecommunication, aerospace industries, car industry, computer and electrical equipment industries.

16
B/ GEOGRAPHICAL DISTRIBUTION OF STRATEGIC ALLIANCES:
Ohmae (1985) brings out the predominant role of American European and Japanese enterprises in the international strategic partnership in technology, especially in the computer and car industries. The results of the study of Morris and Hergert (1988:102-103), which covers the period between 1975 and 1986, reveal that the major part of international alliances are established between the partners of the European Community (30.8%) or between partners from the EC and the USA (25.8%). American enterprises account for 47% of registered alliances while the Japanese alliances account for only 18%. Europeans account for 74% of partnerships listed by the study. The rest of the world remains the poor relation of alliances with a little more than 10% of partnerships. Most of international alliances are established by the triad’s enterprises (USA, Europe and Japan). Such a statement has been corroborated by the latest studies, especially those of Freeman and Hagedoorn (1994) and Hagedoorn (1996 a: 612). On the other hand, the study of Porter, Fuller and Rawlinson (1986) shows that the geographical distribution of alliances is in favour of the United States followed by Japan and Europe. This difference between the results of the first analyses and those of the latter may be explained by the fact that the first ones overestimate European data and those of Porter and his colleagues are based on American data. Freeman and Hagedoorn (1994:773) show that for the 1980/1989 period, the predominating position of developed countries is also reflected at the level of the different sectors. In fact, in the biotechnology, software and computer industries, cooperation is quasi-exclusive to developed countries. The predominance of Developed Countries is felt at a lesser degree in food and beverages sectors. It may be explained by the attraction of Developed Countries by the new

17
sectors as well as by the relocation of ripe sectors or less dynamic market openings of ripe sectors in non-industrialised countries. The most typical case is the concentration of the United States followed later on by Europeans and Japanese in chemistry and their reorientation towards refined, specialised and value added chemical industry and at a lesser risk and the disengagement of the basic chemical industry and its relocation in DCs that are endowed with cheap raw materials. The 1990/1993 period marks a major change, in so much as the analysis of Hagedoorn reveals (i) a reduction in the percentage of intra-Europe technologic alliances (9%); (ii) the progression of intra-USA alliances and (iii) a more active participation of other countries’ enterprises (other than those of Europe, the United States and Japan), which has doubled between the 1970/1979 and 1991/1993 periods. The international combinations of alliances have changed in view especially of the increase of the agreements with companies of newly industrialised countries, particularly, those of South-East Asia, such as South Korea, Singapore and Hong Kong. Particular case of mergers and acquisitions: Industrial countries are predominating actors in the cross-border mergers-acquisitions. Since the 80’s, 80% of merger-acquisitions (purchases and sales) are carried out by industrialised countries.
The European Union held the first position in 1999 with
70% of acquisition sales and 50% of the sales carried out between industrialised countries. The outstanding imbalance between purchases and sales is due to the important acquisitions made in the United States. In addition to these operations, the remaining operations (75% of sales and 50% of purchases) are composed of intra-community operations, achieved in general in response to deregulations, regional integration and the creation of the Euro.
The United States are the main targets of operations with a record figure of purchases amounting to US$ 233
18
Billion, of which 80% are carried out by the EU’ s companies (while this share was lower than 50% in the mid-nineties). The acquisitions made by the America companies have dropped by 18%; i.e. US$ 112 billion in 1999, in view of their weak participation in mega-mergers concluded in 1999.
On the whole, Japan is somewhat behind M&A operations, probably in view of the absence of liquid assets, as a consequence of bank crises and those of insurance companies.
Emerging or developing countries remain minor actors with respect to purchases (5% of the world flow in 1999), in spite of an increase in the amounts’ value (US$ 41 Billion, i.e. twice more than in 1998). Yet, it should be underlined that such operations play a structural role in a regional context, particularly in Asia (starting from Singapore) and in Latin America, enabling thus some companies to emerge as important actors in their sectors at world level (Cemex in Mexico in the cement sector for example). As far as Mergers-acquisitions inflows are concerned, the share of emerging countries has increased by 20% of total operations, i.e. 9% in value in 1999), owing to privatisation operations in Latin America and of acquisitions in Asia following the crisis (especially in South Korea). The EU remains the main investor with 40% of inflows in the zone followed by the United States10.
10 Mohamed El Filali El Youssefi, under the supervision of Jorge Niosi. Strategic
alliances between the globalisation era and the changes of technological paradigms, op cit.
Todd Evans, monitor of foreign direct investment, Société d’expansion des exportations, Canada, Août 2000.

19
Table n° 2 Cross-border Mergers-acquisitions in percentage of FDI inflows11
Areas Average from 1997 to 1999
(Percentage) North America 91.7 Western Europe 93.9 Japan 100.0 Latin America 60.9 Eastern Europe 32.9 Africa 31.3 Middle-East 26.9 Asia 21.8 Average of developed countries
95.1
Average of developing countries
36.7
World average 77.1 Source: United Nations Conference on Trade and Development,
Report on investment in the world 2000, p 9
V/ ALLIANCES’ STAKES: In a first stage, the alliances’ objectives is to markedly strengthen enterprises at organisational level and in a second stage, it is at the strategic level that enterprises place the main stakes, (especially with regard to SMEs). Such stakes consist in obtaining advantages in order to overcome the constraints imposed by markets. Thus, the main strategy adopted by large enterprises is to focus on their know-how while combining their skills and by simplifying procedures. Such procedures are simplified because suppliers propose global services (it therefore implies the reduction in the number of interlocutors), it also implies the shrinking of the Industrial network. This reduction in the lean conception has three effects:
Reduction in development and industrialisation costs. Quick marketing of new products (gain in time) Allows making up for costly errors resulting from the
conception stages.
11 Todd Evans, monitor of foreign direct investment, Société d’expansion des
exportations, Canada, Août 2000.

20
The improvement of the production process may encompass/ quality, deadlines, innovation capacity and the efficiency of the management.
In addition to the costs reduction thanks to the economies of scale, there are reductions in the transport costs (and logistics). Finally, if the large enterprises form an alliance to benefit from a broader negotiation scope, SMEs endeavour to resist the increasingly restrictive market conditions. With respect to SMEs, an alliance is justified by the notion of critical size imposed by suppliers or the market. They must also increase their capacity in terms of financial investments, staff or in terms of equipment. But partner ship is above all for these enterprises a means to ensure their survival and meet competition and ensure their development. Better still, it is also an occasion for these enterprises to benefit from a stable order book.
- Yet, it should be underlined that some alliances merely consist of short-lived encounters, which last only for the time during which one of the partners penetrates the market. Others take place as a prelude to the total merger of technologies and capacities of one or several enterprises. More and more multinational companies adopt the strategic option: inter-regional competitive alliance of enterprises into which two or several international companies that are strongly implanted, and often from different areas, pool their capacities and resources to enter into competition at world level or regional level.
- Empirical studies on the determinant of strategic alliances:
According to the study of Hagedoorn (1993), three main causes play a significant role in the constitution of strategic alliances: technological complementarities with 31% of alliances, the reduction in the deadline of innovation which concerns 28% of agreements and market access as well as market restructuring which accounts for 32% of agreements (P: 378). The first two causes are probably the most important for the firms that get involved in technological cooperation.
21
According to the study, the importance of these motives has increasing for the last ten years.
Results show different motives in the different technological fields and industrial sectors. The same study points out that technological complementarity and the reduction in the innovation deadline are less significant cooperation motivations in sectors such as chemistry, the consumer electronic industry, food and beverages industry and to some extent in the car industry.
With regard to the car industry, cooperation started in the seventies and has since then developed. In this sector, the international cooperation agreements that have multiplied between North American, European and Asian enterprises, as shown by Ohmae (1958:201-6), correspond to a new competitive game allowing in particular to enterprises the access to skills and markets. In view of the FDI and the acquisitions, cooperation is an external increasing formula, use to penetrate foreign markets, to improve productive efficiency and widen the line of products and introduce innovations. (Sachwald, 1993, p. 86-102).
These motives are not the same in all the countries. The penetration of a foreign market is an objective, which concerns all the Japanese enterprises in view of the efficiency of their production process. The main target of the Japanese enterprises is on the one hand, exports in order to reduce costs and risks incurred by the penetration in a new market and to rapidly enter a market on the other. Besides, they also seek to be implanted abroad so as to use the already existing networks and benefit from the knowledge of the market conditions acquired by a future partner (Mitsubishi/Chrysler and Toyota/GM).
The efficiency objective12 is reached through (i) access to production: the European and American enterprises, whose
12 Chesnais (1988), contractor et Lorange (1988). Ohmae (1988). The author has
used the Merit databases-Cooperative agreements and Technology indicators (CATI). It is a relational database, which includes information on more than 1,300 technological cooperation agreements (systematic inventory) involving

22
performance is lower in terms of efficiency and seek to improve their situation through alliances with their Japanese competitors with a view to learning “new quality control processes and techniques” (Chrysler/Mitsubishi) (Ohmae, 1985:205); (ii) the achievement of economies of scale (Renault, Peugeot, Volvo for the V6 engine); the delocalisation of Japanese and European production towards less industrialised countries and the widening of the range of products (GM/Toyota). The chemical industry, which is a complex industry, diversified and capital intensive and cyclical was stricken by a crisis in 1980. With a view to reducing the cyclical effect of this industry, enterprises have adopted a portfolio reorganisation strategy as well as a globalisation one. The first one aims at re-orienting this industry towards refined or specialised chemistry, implying thus a disengagement of basic chemistry. Now, both refined and specialised chemistry require a high capacity for innovation and adaptation to meet demand. These two factors imply internationalisation in order to meet the cost of R&D and produce on the spot to be informed of the potential needs of customers (Sachwald, 1993:259-303). Therefore, cooperation is the ideal tool to achieve such objectives.
- Market access and reorganisation is an important motive in the four ripe sectors (car industry, chemistry, the consumer electronic industry, food and beverages as well as computer and micro-electronic industry. With respect to telecommunications, the importance of this motive is understandable, in view of the prevalence in this sector national monopolies and domestic oligopolistic markets. Even for the large companies, the access to international markets was only possible through alliances with the national producers of this market. For the last few years, this sector has been restructured due to an excess of capacity, an ineffective technologic development and a
about 5,000 parent companies concluded in the 80’s. For some sectors or technological fields, it was possible to collect information on cooperation agreements from 1980 to 1993.

23
sharp competition in which alliances play a great role. The last argument explains the importance of this motive in major sectors such as computer and micro-electronic industry (Hagedoorn, 1993:380).
On the other hand, in the semiconductors industry characterised by the intensification of competition upon the emergence on the world market of new producers and the importance of the technological factor, we are witnessing the setting up of joint ventures and technological development agreements for the acquisition of technology, market access, and the sharing of cost and risks and the strengthening of the productive capacity (Hobbay, 1993:172). VI/ DIFFICULTIES: No matter the different forms that alliances may take, the key to success lies in a careful planning and preparation; partnership cannot take shape overnight, the transformation of partnership speech into concrete and profitable reality goes through an apprenticeship period of cooperation, which is often costly. It is essential to define beforehand the common objectives. The fact of defining common strategies guarantees competitive advantage. But it also requires a deep cultural change. Besides, it is important to share information, to take common decisions and obtain the contribution of each party and not to press on suppliers. If need be, the prime contractor should help the supplier reach the targeted objective by delegating on the spot his technicians in order to improve the working methods. Such a transformation implies of course upstream adequate strategic reflections and a good preparation of collaboration. On the other hand, a difficulty arises from the fact that partners sign contracts concerning their targeted objectives before even starting the design and development process13.
13 J.Mbendé, le 24/11/98 (IUP Management des achats Grenoble).
24
The transnational cooperation agreements between car manufacturers (as attested by the agreement between Fiat and Ford explained by Guiseppe Volpato) can fail for reasons relating to power sharing and difficulties encountered to coordinate and even integrate the different services of “cooperating” enterprises. Furthermore, as pointed out by Koichi Shimokawa and young-suk Hyun, the problems generated by imbalanced alliances within which one of the partners pursues the objectives of his leader collaborator. For instance, thanks to its alliance with Chrysler, Mitsubishi has not succeeded in building up its own brand image in the USA. This ultimate alliance was rather disadvantageous. Actually, when Mitsubishi implanted at the USA its own production activities, it did not manage to make profitable owing to its weak commercial power. As to alliance between Deawoo and GM, we can speak of a “strong path dependency”, since Daewoo has produced for twenty one years from 1972 to 1992 for the American market, patterns designed by (Chevrolet, Rekord, LeMans…), while being confined within the internationalisation strategy of the American giant. Of course, this alliance has enabled Daewoo to follow a path of technological training, but the latter could not result in an autonomous design strategy of new patterns and of an international reorganisation as long as Daewoo remained under the dependency of GM. That is why, Daewoo has really started to follow its own internationalisation path while endeavouring to reconquer its domestic market starting from 1993 after its breaking off with GM14. According to the experience of strategic alliances in the car sector, the global environment of the enterprise contributes also to the success or to the failure of alliances. Actually, the lack of harmonisation of monetary, legislative and tariff systems fit for each country, generates economic risks for enterprises that are difficult to forecast (fluctuation of the
14 Lydie LAIGLE, stratégies et trajectoires d’internationalisation des firmes
Asiatiques et européennes, Actes du GERPISA n° 22, pp 3-5.

25
exchange rate, unsteadiness of the stock exchange and the financial markets). Likewise, one should not underrate the difficulties linked to the evolution of the political, social and macroeconomic situations (saving rates of households, distribution of incomes…) of countries in which the firms with which agreements are concluded, as shown by the agreement between the Soviet Government and fiat.
SECOND PART:
IMPACT OF ALLIANCES AND PARTNERSHIP ON TRADE
A/ Impact on trade: Empiric research works show that up till the mid-eighties, it is the international trade that has generated direct investments. After this period, the causality seems to have reversed and direct investment exerts a major influence on trade. More especially, data show that direct investments abroad stimulate the increase of the country of origin’s exports (investor country) and consequently they are complementary to trade. Through an analysis on a set of 14 countries, it was noted that each invested dollar produces about 2 US dollars of additional exports. On the other hand, most often in the host countries, short-term foreign investments tend to increase imports while the increase in exports is realised only in the long term. Yet, in the short term, the host countries derive several benefits from foreign investments (technological transfers, creation of jobs, local sub-contracting, etc)15. - From the point of view of the investor: the FDI may be
considered as substituting for trade, in so much as exports 15 Lionel Fontagné, Foreign Direct investment and international trade are they
complementary or substitutable? Working document of the DSTI, OECD 1999/3.
26
are replaced by domestic sales on foreign markets, particularly, under the form of finished products. This state of things may be harmful to the industry of the investing country, by reducing its production and employment level. On the other hand, the FDI and trade may be considered as complementary in so far as foreign investments reinforce competitiveness on foreign markets and increase trade in intermediary goods (inputs) and of finished products towards the subsidiary company. These kinds of links are expected to be beneficial for the exports of the investing country and hence for its industry.
- For the host countries, the link between the FDI and trade may be considered as symmetrical to the one observed in the investing country. The domestic sales and purchases made by foreign subsidiary companies replace imports from the investing country and thereby improve the situation of the current balance, the domestic production and the employment level. If the FDI leads to the imports of inputs, it can result in a weakening of the current balance of the host country, such a conclusion is corroborated by some studies. Thus, the progression by 28% in 1997 of foreign investments in the Caribbean and in Latin America, mainly in Brazil and in Mexico has led to a deterioration of the current balance in all the area.
As a general rule, the impact of alliances and investments relating to it generates the following effects: The outflows of FDI lead to imports in case of upstream vertical integration and/or the delocalisation abroad of labour intensive activities from capital-intensive countries. The inflows of FDI lead to exports if foreign enterprises are established in the host country in order to reexport to their own countries or supply a regional market. The outflows of FDI generate exports if competitiveness on foreign markets improves or if they give rise to a reduction in exports in the opposite case.

27
The inflows of FDI give rise to imports if competitiveness of foreign enterprises on domestic market improves but they can generate exports when the host country improves its competitiveness. 1- Impact on imports: In general, the impact of the FDI (mergers and acquisitions in particular) on the balance of payments of the host country is especially exercised through trade flows that are related to it. Apart from a completely secluded country, any FDI results in an increase in imports, owing only to its effects on the level of the domestic economic activity. More often, the FDI itself creates a new sources or demand for imports like national enterprises that develop around the activities of foreign subsidiary companies16. A project of the FDI entirely new in a developing country will undoubtedly require an initial supply with machinery and tools as well as with imported intermediary goods and services. After the establishment stage, a good number of factors are likely to intervene in order to determine to what extent a foreign subsidiary company will continue to import goods and services. These factors are notably the sector where the production sector of the host country’s economy in which the FDI operates (the FDI in agriculture, the mining sector and several services sectors, for example tend to have an import coefficient globally lower than the FDI in the manufacturing sector) and the age of the project (when a project is ready, the foreign subsidiary countries tend to become less dependant on imported inputs, because suppliers of components and domestic subcontractors are developing). The UNCTAD quotes a study based on a survey conducted in 1995 where it can be noted that with regard to 18 of the largest foreign companies belonging to the electrical and
16 According to the UNCTAD even if the recourse to national suppliers is
increasing, there can be an increase in imports to satisfy the demand from the suppliers of national components. Refer to the World Investment Report, 1997 quoting the UN Centre on the transnational companies (1981).
28
electronics sectors in Malaysia, the value of imported materials and components has accounted for 78% of total inputs, which is more than the average for the whole manufacturing industries17. Yet, as observed by the UNCTAD, it is question of an international and very competitive sector, which depends on specialised inputs meeting the standards of a precise quality. The UNCTAD also quotes studies where encouraging signs were observed of foreign subsidiary companies establishing upstream links and replacing imported inputs by domestic products18. The UNCTAD indicates in comparison that the FDI in the Malaysian extractive industries requires relatively less imported inputs and yields a high national value added per production unit19. In the study mentioned here above, the UNCTAD explains in its analysis that the high increase of the import share in the GDP, which rose from 25% in 1985 to 40% in 1991, was mainly the result of a strong dependency on imports, in addition to the increasing role of the FDI. Foreign investors imported 90% of machinery and equipments and 50% of raw materials required by the projects. Likewise, several studies tend to show that the import needs of the foreign subsidiary companies per production unit tend to reduce over time thanks to the increase in domestic supplies. McAleese and McDonald have noted such decrease in Ireland for the 1952-1974 period, ORR noted such tendency for the Japanese foreign subsidiary companies in the USA for the 1967-1989 period and was confirmed by FRY for the host
17 Ariff Mohamed and Yew Sieng Yong (1996), Transnational corporations and
industrial restructuring in developing countries. The case of Malaysia” ( Kuala Lumpur: University of Malaysia), lecture handout quoted in the UNCTAD (1997), op. cit.
18 Athukorala, Premachandra and Jayan Menon (1995), developing with foreign investment: Malaysia”, The Australian Economic Review, 1st semester, pages 9 to 22; and Sivalingham, M and Siew-Peng Yong (1993), TNCs and industrialisation in Malaysia: organisational behaviour and local and egional impacts”, Regional development dialogue, 14, 4 (hiver), pages 40 to 64, quoted in the UNCTAD (1997)n op, cit, page 91.
19 UNCTAD quotes Sivalingham et Yong (1993) op. cit., which have noted that in the sector of resources exploitation in Malaysia, the FDI content of input of national origin amounted to 76% in 1883.

29
countries of the Asia-Pacific region during the 80’s20. The UNCTAD has noted that the local purchases of the Japanese subsidiary companies in Asia increased from 27% of the global purchases in 1981 to 44% in 1988, and decreased to 34% during the 1994 financial year21. In Latin America, it noted that this share had regularly increased, going up from 28% in 1981 to 39% during the financial year 199422. South Korea had supplied to the WTO working group on “Trade and investment” the following indicative elements of such tendency23: In the early eighties, the stimulation effect of imports was felt significantly, because the foreign subsidiary companies were tending to buy raw materials, production and capital goods in the country of origin. Yet, the replacement effect of imports gradually enhanced in view of the integration at local level of foreign subsidiary companies offsetting thus the effect of the afore mentioned stimulation effect of imports”. - One of the measures that were used to reduce the import
output ratio of the FDI and hence to attenuate the “negative” effects of the FDI on the balance of payments in the host countries consists in requiring from subsidiary companies to respect a certain proportion of elements of national origin24.
In conclusion, it can be noted that in the long term the direct effects of the FDI’s flows on trade balance tend to be unfavourable for host countries25. Similarly, the negative impact can disappear in the long term, in view of the favourable implications of the technological progress and growth. This evolution seems to be all the more likely, 20 ORR James (1991), the trade balancing effects of Foreign trade Investment in
U.S. Manufacturing”, FRBNY Quarterly review, summer, pages 63 to 76; Fry, Maxwell (1993 and 1996), op.cit.
21 UNCTAD (1997), op.cit. note 63, page 104. 22 IBID. 23 WTO, WT/WGTI/W/16. 24 Investisssement étranger direct et balance des paiements, OMC,
WT/WGTI/W95, 2 Février 2001. 25 Lionel Fontagné, l’investissment direct étranger et le commerce international:
sont-ils compléméntaires ou substituables? Document de travail de la dsti, OCDE 1999/3, p 24.

30
especially as pointed out by Drabek (1988), the short effect is associated to induced imports of intermediary and capital goods, which are at the origin of a large part of favourable implications. Yet the final result will depend on the relevance of followed policies and other environmental conditions in which enterprises operate.
Table n° 3 The effects on trade of the prescriptions of required results26
Input Imports
per unit of local production
Imports competing with the local
production unit
Export of finished products per local production unit
Content in national products
(Dropping) (Increasing) (Dropping)
Export results ? (Increasing) (Increasing)
Trade balancing (Dropping) (Increasing) (Increasing)
Restrictions on foreign participation
? ? ?
Technological transfer
? ? ?
Note : Indirect effects are mentioned between brackets. The interrogation sign means that the effects on trade are not obvious.
Source : WTO 1998
2. Impact on exports: According to several reports and studies of several inter-governmental organisations, the composition of the FDI realized in the Developing countries has progressed: after having been motivated by the search for markets (often with a view to overcoming obstacles to import), investment is at present more motivated by the search for efficiency. The basic concern being the implantation of each stage of production or the final processing intended for the world market or for a regional market, in the country where its completion will be the most profitable thanks to the existence of useful products, natural resources, labour and technology27.
26 Effets des incitations à l’investissement et des prescriptions de résultats sur le
commerce international note du Secrétariat de l’OMC, document n° WT/WGTI/W/56 30 Septembre 1998, p 14.
27 WTO, W/8/Add.1, pages 9-12.

31
Foreign investors facilitate thus, directly the access of hosting countries to international markets, because they not only subdivide production between several countries and link the different stages to the flows of international trade, but also because they are provided with international distribution channels for the final product and in some cases with services provided by their foreign subsidiary companies. The supplied indications show that because they better know the world markets and that they can accede to international marketing channels, foreign enterprises deal with international trade more than national enterprises28. Likewise, the data on the export share of the host country, which is imputable to foreign subsidiary companies, show empirically the effects produced by the FDI on the export results of the host country thanks to the activity of these foreign enterprises29. The information collected from reports submitted by intergovernmental organisations to the WTO working group on “trade and investment”, show that the direct contribution of multinational enterprises to the exports performances recorded in the host country are not resulting only from the exports achieved by the foreign subsidiary companies; there is also an indirect contribution, in so far as these foreign enterprises boost the exports carried out by other enterprises in the host country. Actually, the driving effects established thanks to the distribution channels of the multinational companies, which facilitated the access to international markets are favoured by a range of intra-group contractual measures, under the shape, for example, of subcontracting agreements, licence granting, agreements on the splitting up of production30. Besides, it has been proved that the presence 28 WTO, W//8/Add.1, pages 27; W/7 paragraph 58. 29 According to one of the studies made in 1994 the exports of subsidiary foreign
companies with American capitals accounted for about 10% of Argentina, Brazil, Chile, Indonesia, Malaysia and Philippines, but if we add other foreign subsidiary companies, the share of these foreign enterprises in the total exports of some countries may be higher than 50%. In some sectors such as micro electronic components and micro processors this export share is sometimes higher than 90% (W/26, p. 34). According to a study on the FDI in China, the share of the foreign subsidiary companies in total exports increased from 17% in 1991 to 31,3% in 1995 (WTO, W/8/Add.2, p. 25).
30 WTO, W/26, pages 35.

32
of subsidiary foreign companies specialised in exports, is favourably felt owing to the demonstrations and information they provide, which contribute to building up the export capacities of the host country31. Likewise, in the note on “the linkages between trade and foreign direct investment”, the WTO secretariat, after having reviewed some concrete studies, has concluded that the FDI carried out in Developing Countries directly favour the exports of all these countries, owing to the export activities of multinational companies, and indirectly by reducing for national companies financial obstacles or by making up for the lack of information which prevented them from exporting or developing their exports32. On the basis of their national experience, a number of countries confirm the positive direct and indirect effects of the FDI inflows on the volume and the structure of their exports in the reports submitted to the WTO33. The FDI was sometimes strongly stimulated by the creation or the extension of some regional economic integration measures, which broaden the “national” market and guarantee that the host country will henceforth seek stability in its trade relations. If this form of FDI is often motivated mainly by the search for markets, it nevertheless favours often the intensification of trade within the area once production is restructured at regional level34.
31 WTO, W/8/ADD.2, page 27. 32 WTO, W/7, paragraphs 10 and 56-60. (see also the document n° 71712 of the
WTO which followed the observations formulated, by second meeting of the working group on Trade and Investment, on the conclusions made in the document W/7 on the linkages between the FDI and the exports results).
33 Refer to the papers within the WTO committee on trade and investment: of Japan (W/11, pages 2-3), of Poland (W/13, page 3) of Korea (W/16, pages 5-6 and of Costa Rica (W/31, pages 2-3.
34 The FDI and foreign portfolio investments are in general carried out by two kinds of different investors, which neither have the same motivations nor the same anticipations as to the advantages of their investments. On the whole, the FDI are made by enterprises involved in the production of goods and services, wishing to develop their commercial activities. The portfolio investors are either financial institutions, institutional investors (such as pension funds, insurance companies or investments funds) or individuals that are motivated by the financial profitability of their investments (increase in values or

33
B/ Portfolio investment and exports35: According to the WTO, foreign portfolio investments in Developing Countries are in general a more recent phenomenon than the FDI. They have therefore formed the subject of less research and analysis and for the moment, they are little empiric studies on this subject. Data collection and statistics on foreign Portfolio investment is also not very advanced and rises more conceptual problems than data collection and statistics on the FDIs. 1- General impact: Case of mergers and acquisitions.
According to a survey conducted by the UNCTAD for example, the data of the balance of payments for the 1990/1997 period show that for the two thirds of a sample of 30 developing countries and economies in transition, the FDI were on an average more important than the foreign portfolio investments36. According to some empiric studies, the profitability of the enterprises, which were subjected to a merger or acquisition, have in the best cases kept the same rate of profitability in the short term. Actually, the sales profit rate is not immediately likely to be sensitive to a takeover. Yet, the intensity of R&D expenditure is positively affected by the influence of the takeover.
Foreign interests do not positively affect the short-term profitability of enterprises during a takeover. Actually, the sales profitability rate highly reduces immediately after the takeover.
dividends) and who do not expect at first to have a sustainable interest in the enterprise or to directly intervene in its management
35 The recent meeting of the UNCTAD’s experts on the portfolio investments flows has concluded among others: “Given the importance of the foreign portfolio investments, countries should boost their efforts to establish accurate statistics of these flows for the purpose of analysis and for the orientation of the governmental action”. (TD/B/COM.2/EM.6/L.1, paragraph 2).
36 IBID, page 8.

34
The enterprises, which were subjected to a takeover, seemed to have intensified their investment activities in physical capital or in R&D37.
Table n°4
Main net flows of resources in the long term towards Developing countries, 1991/2000 (Billion US dollars)
1991 1992 1993 1994 1995 1996 1997 1998 1999 2000
Total 123.0 155.8 220.4 223.7 261.2 311.2 342.6 334.9 264.5 295.8
Of which:
Private flows 62.1 99.3 166.8 175.7 206.1 279.3 299.8 280.3 219.2 257.2
Of which
FDI 35.7 47.1 66.6 90.0 107.0 131.5 172.6 176.8 185.4 178.0
FPI 18.5 25.2 87.6 73.4 66.9 111.7 79.2 56.5 59.9 78.1
(Participations) (7.6) (14.1) (51.0) (35.2) (36.1) (49.2) (30.2) (15.6) (34.5) (47.9)
(Obligations) (10.9) (11.1) (36.6) (38.2) (30.8) (62.5) (49.0) (40.9) (25.4) (30.3)
Bank loans 5.0 16.2 3.4 8.7 30.5 33.7 45.2 50.0 24.6 0.7
Source: Word Bank, Financement de développement dans le monde 2001, tables 2&3
The World Bank for example tends to show that merger and acquisitions activities made in developing countries in the 90’s have opened new possibilities because they intervened in activity areas that produced non-tradable goods and services, contrary to the entirely new FDI, which for the major part concerned the manufacturing sector38. According to the World Bank, half of the merger-acquisitions made in East Asia for the last few years concerned non-exporting sectors, such as wholesale and Retail, real estate and the financial sector. Initially, we may therefore conclude that foreign investments under the form of mergers-acquisitions are less centred on exports than the FDI. Anyhow, once the enterprise is under the control of foreign investors, it is the latter who decide if it stay or not in the non-tradable goods sector.
37 The economic impact of the mergers and acquisitions activities on Gilles
Mcdougall enterprises, division of the microeconomic policy analysis, Canada Industry. Working document n°4, February 1995.
38 World Bank, Financement du développement dans le monde 2001 (Washington D.C.), page 36.

35
Table n° 5 Net resources flow under the form of FDI and takeovers
towards developing countries per area: 1998/1999 (Billion US dollars)
Including all Developing Countries
East Asia and Pacific
Europe Central
Asia
Latin America and Caribbean
Middle East and North
Africa
South Asia
Sub Saharan Africa
FDI (net)
1998 185.4 56.0 26.5 90.4 1.5 3.1 7.9
1999 178.0 58.0 28.8 76.2 4.5 3.2 7.3
Portfolio investment (Case of Takeover)
1998 34.5 21.1 3.5 3.9 0.7 1.3 3.9
1999 47.9 28.6 5.5 9.9 0.9 2.1 0.8
Source: Banque mondiale, Financement du développement dans le monde 2001.
THIRD PART:
OVERVIEW OF THE INVESTMENTS FLOWS IN THE WORLD AND IN THE OIC MEMBER STATES
I/ WORLD TRENDS : For the last decade, the growth of cross-border foreign direct
investment (FDI) has to a large extent exceeded the average growth of trade and production in the world. The flows of foreign direct investments have increased on an average by about 26% per year during the last ten years (1991/2000); while the GDP has increased by 4% and trade by 7% on an average. In the past, the FDI served to counter trade barriers, to accede foreign markets and profit by cheap labour and general governmental incentives. Even if these factors are still playing a role, the decision in the field of the FDI are more aiming at making the most from the competitive advantage of an enterprise by establishing production in the sector where it is the most efficient.
The world flows of the FDI reached a record amount of 1150 billion US dollars in 2000 after having reached 865 Billion US

36
dollars in 1999. The growth rate reaching +27%, even it is though lower than in 1998 (+80%) it remains exceptional). - The cross-border mergers-acquisitions (M&A) consist the
main factor, which explains the recent increases of the FDI. The surplus capacity of a good number of industries in the world and the accruing necessity to rationalise production and reduce costs, contribute to the increase of the cross border merger-acquisitions. Actually, it is much easier for a multinational company to buy some of the existing assets than invest in the construction of new infrastructures or manufacturing plants.
The cross-border M&A have increased from less than 75 billion US dollars in 1987 to 1.14 billion US dollars in 2000. The monetary value of the international M&A has increased by 49.3% in 2000. But the international M&A accounted for 90% of the FDI flows in the world in 2000, comparatively to 50% only in 199139. The steady economic growth of industrialised countries and the recovery on emerging markets have also boosted the FDI in the long term. The privatisation of the States enterprises stimulate the foreign capital flows towards several developing or transitional economies, despite of the slowing down of the flows linked to privatisation on some markets (such Latin America) recorded last year. Besides, the ongoing liberalisation is removing the obstacles to cross-border investment in the telecommunications and financial services (Banking services and insurance). Prevalence of industrialised countries : Industrialised countries account for 91.5% of the FDI outflows and hold 90% of the world stocks; they have also received 73.5% of the FDI inflows and hold 68% of the world stocks. - Western Europe is to a large extent the major source of FDI
in 1999 accounting for 65% of FDI outflows, followed by the NAFTA with 21%, Asia 8.3%, Latin America 6%, Africa,
39 Moniteur de l’Investissement Direct Etranger, op cit, pp 3-8.

37
the Middle East and East Europe account respectively for 0.5% and 0.3%.
- With respect to FDI inflows, West Europe and the NAFTA are on the lead of the attractive zones of the FDI accounting for 36% of the flows each, followed by Asia with 14% (5% of which for China), Latin America with 10% of flows. And then East Europe, Africa and the Middle East with respectively 3% and 2%.
Minority share of Developing countries: The relative share of Developing countries in the FDI dropped slightly in 1999, thus, developed countries received 75% of the inflows of the FDI against 71.5% in 1998. Asia receives more than half of these flows (106 billion US dollars+9%) confirming thus at the end of the crisis, but with geographical disparities. China remains the most attractive (63.5 Billion US dollars of which 23 billion for Hong Kong) followed by the Newly Industrialised Countries, except for Thailand whose flows are diminishing while keeping a relatively high level. Finally, Indonesia has experienced massive disinvestments (-3 billion US dollars in 1999 that followed political instability. Africa accounting for 1.2% (10 Billion US dollars), remains on the whole neglected in spite of an increase by 28% benefiting Angola (Oil investments) Egypt (In response to important deregulations), South Africa, Morocco, Tunisia and Nigeria (traditionally, the most important recipient country). II/ INVESTMENT FLOWS IN THE OIC MEMBER COUNTRIES: The OIC Member Countries received 0.42% of FDI inflows against 4% in 1996 and approximately 0.23% of Portfolio investment against 1% in 1996.

38
A/ FDI flows in the OIC Member States:
- The OIC Member States accounted for 0.1% of the FDI outflows in 1999 against 0.6% in 1996; i.e. a decrease by –76%.
Likewise, they only received 0.4% of the world inputs of FDI in 1999 against 4% in 1996, i.e. a decrease by –89%.
The main beneficiaries of the FDI are Kazakhstan (1587 million US dollars), Malaysia (1553 million US dollars), Egypt and Nigeria (one Billion US dollars each), Morocco (850 million US dollars), Turkey (783 million US dollars), Bahrain (448 million US dollars) and Tunisia (350 million US dollars).
The main providers of the FDI to the OIC countries are the European countries (with 37%), followed by the United States (34%), Japan (23%). The breaking down per product of the FDI to the OECD countries shows that services is the main sector accounting for 55% followed by the manufacturing sector with 37% and the primary sector accounting for 8%.
B/ The Portfolio investment flows in the OIC Member Countries:
As far as the portfolio investment is concerned, the OIC Member States accounted for 0.47% only of the outflows of portfolio investments at world level in 1999 against 2% in 1996, but they attracted 0.23% of the world inflows of portfolio investment. The main beneficiaries of portfolio investments are Turkey with 4 billion US dollars and Malaysia with 800 million US dollars. Among the OIC Member States, Saudi Arabia was the main supplier of portfolio investments in 1999 accounting for 11.7 billion US dollars.
With respect to intra-OIC investments, it can be noted that in spite of lack of adequate information, the total flows of the FDI are estimated at about 3 billion US dollars and the main targeted sectors are as follows: services accounting for 48%,
39
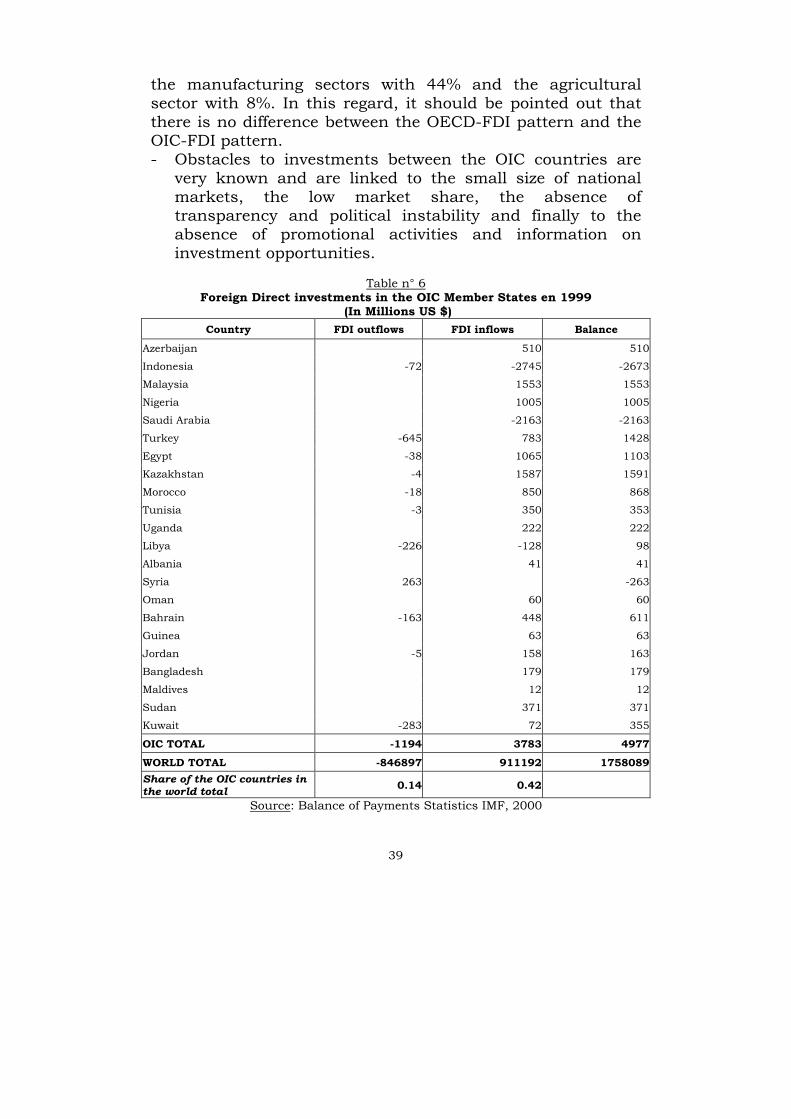
the manufacturing sectors with 44% and the agricultural sector with 8%. In this regard, it should be pointed out that there is no difference between the OECD-FDI pattern and the OIC-FDI pattern. - Obstacles to investments between the OIC countries are
very known and are linked to the small size of national markets, the low market share, the absence of transparency and political instability and finally to the absence of promotional activities and information on investment opportunities.
Table n° 6
Foreign Direct investments in the OIC Member States en 1999 (In Millions US $)
Country FDI outflows FDI inflows Balance
Azerbaijan 510 510
Indonesia -72 -2745 -2673
Malaysia 1553 1553
Nigeria 1005 1005
Saudi Arabia -2163 -2163
Turkey -645 783 1428
Egypt -38 1065 1103
Kazakhstan -4 1587 1591
Morocco -18 850 868
Tunisia -3 350 353
Uganda 222 222
Libya -226 -128 98
Albania 41 41
Syria 263 -263
Oman 60 60
Bahrain -163 448 611
Guinea 63 63
Jordan -5 158 163
Bangladesh 179 179
Maldives 12 12
Sudan 371 371
Kuwait -283 72 355
OIC TOTAL -1194 3783 4977
WORLD TOTAL -846897 911192 1758089
Share of the OIC countries in the world total 0.14 0.42
Source: Balance of Payments Statistics IMF, 2000

40
Table n° 7 Portfolio Investments in the OIC Member States in 1999 (in million US
dollars)
Country PI inflows PI outflows Balance Saudi Arabia 11712 11712
Turkey -759 4188 4947
Kuwait -2598 -23 2575
Cameroon 0
Bahrain -2053 -12 2041
Guinea -20 20
Tunisia 10 10
Indonesia -1792 -1792
Jordan 32 22 -10
Egypt -22 617 639
Kazakhstan -6 -40 -34
Libya -3 3
Malaysia 804 804
Nigeria 50 -39 -89
Morocco 6 6
Bangladesh 4 -1 -5
TOTAL OCI 6337 3740 -2597 The OIC share in the world total
-0,47 0,23
Source: Balance of Payments Statistics IMF, 2000
41
FOURTH PART:
THE TEACHINGS OF THE PILOT EXPERIENCES IN THE OIC MEMBER STATES AND IN THE OTHER DEVELOPING COUNTRIES IN THE FIELD OF
PROMOTION, PARTNERSHIP AND INVESTMENT40
Promoting SMEs clustering and networking means stimulating competition and cooperation among firms, creating specific locational advantages, an supporting businesses to make the best of a highly competitive environment ultimately, transforming small individual firms into integrated systems of firms. Some conclusions can be distilled from the examples of best practices: 1. In general, the target should not be a single enterprise, but a network of enterprises. Providing “collective” services has two main advantages: (i) it has lower transaction costs than assistance to individual enterprises; (ii) it helps generate relationships between enterprises, improving their efficiency and maximizing the potential of the group through the development of mutual learning. Given that competitiveness is not a static goal, but consists in the ability to attain and sustain a market position, firms should be stimulated to achieve continuous improvement through self-help and become less dependent on external
40 These information were drawn from the UNCTAD's report which are based on
case studies : 11 cases for the 1st report and 26 cases for the second, of which six OIC Member States (Burkina Faso, Indonesia, Malaysia, Nigeria, Pakistan, Uganda).
- "La promotion et soutien des groupements et réseaux de PME pour le développement", thematic document prepared by the UNCTAD's secretariat TD/B/COM.3/EM.5/26 june 1998.
- "Amélioration de la compétitivité des PME par l'établissement de liens", basic document established by the UNCTAD's secretariat, submitted to the expert meeting on the relationships between the SMEs and transnational companies with a view to promoting the SME's companies. TD/LB/COM.3/EM.11/27 September 2000.

42
support, thus developing a “cumulative” capacity to upgrade. In addition, interventions should be demand driven (“customer oriented”) and not wholly focused on supplying a set of generic services (i.e. training, credit, raw materials and technology). In particular, the formation of networks should be driven by the idea of serving a specific market, and clusters should be stimulated to conquer niche markets and compete on the basis of quality, design, speed of innovation and speed of response to customers’ changing needs. Product innovation should be guided continuously by feedback from their customers. There are many examples demonstrating how the sharing of credits and orders, advanced machines, taking common laboratory tests and quality control certification processes, or participating jointly in training courses, awareness-building workshops (on subjects such as quality, flexibility or efficiency), or trade fairs can stimulate the initial processes of inter-firm dialogue and begin the construction of a relationship of trust and reciprocity among entrepreneurs. 2. Clear priority should be given to the direct provision of innovative, value-adding services. This is based on the assumption that small firms are unlikely to pay for services that address needs, which are still latent, or where the pay-off is in the medium term. In principal, support to SMEs should be provided by the private sector. The public sector should intervene in the case of an initially unfavourable cost/benefit ratio or in cases of 'free riders' (where public goods are concerned). In any event, mechanisms and structures should be conceived in a business-like manner. 3. Increasing concerns about the cost and impact of the interventions are promoting an examination of BDS (business

43
development services) projects using certain performance criteria, such as cost-effectiveness, sustainability, outreach, replicability, demand-side orientation and benchmarking (Donor Committee, 1998). This refers especially to the way in which objectives are pursued, and does not imply the abandonment of social objectives. Isolated support measures (such as training, credit, technological assistance) are not sufficient to foster SME development, be it inside or outside clusters and networks. Services should be integrated or bundled together (i.e. training with innovation, information on partnering and finance, etc.). Services should be provided in an integrated, holistic and systemic manner. 4. Initiatives have to be defined and implemented with bottom-up involvement of the main local interest groups, both public and private. This emphasizes the need for long and often costly consensus-building and concertation processes, involving workers and employers either directly or through their associations. Recipients themselves should be in charge of the needs assessment and design process, and not just involved in the programme as end-users. A participative approach is essential if common strategic visions and alliances are to be created on a long-term basis. In general, obstacles to generating changes in attitudes, functions and distribution of power are much more difficult to overcome than strictly technical or technological problems. Moreover, “social” innovation is required to help local actors face global changes. Technopoles, industrial estates, incubators, and science parks, can all be characterized by high rates of entrepreneurial activity and high-tech start-ups. However, they have often been accused of being artificial and expensive without contributing to the local economy. Evidence shows that such planned forms of enclaves create more global than local linkages; agglomerations of firms perform better if based on already existing. clusters, serving as a start-up or relocation platform under specific external pressure

44
(environmental constraints, technological obsolescence, communication or infrastructural needs, willingness to joining consortia). 5. Small firm clusters and networks are widely considered to be one of the most cost-effective ways of delivering technical assistance for upgrading technology, management and marketing strategies to SMEs. Thus, the current trend among bilateral and multilateral agencies is not to deliver services directly to enterprises, but rather to focus on the development of meso-level institutions and intermediary organizations. A. The role of the government : The occurrence of TNC linkages and spillovers relies on the creation and further development of an enabling business environment. Such an environment is characterized by:
Existence of a sound legal, regulatory and tax framework;
the continuing availability of a skilled labour pool through education and training programmes;
a well developed infrastructure, especially transportation and telecommunication;
a continuing public-private sector dialogue on programmes for effective enterprise development; and
the encouragement of TNCs to create supplier links via targeted investment policies.
In this context, governments could also adopt a comprehensive set of selective support measures to promote linkages. Criteria for selection include the competitiveness of sectors in which potential partner firms operate, the dynamism of particular SMEs in that specific sector and their capacity to specialize in activities which complement that of potential TNC partners. Such proactive partner selection does not have to be limited to local SMEs. Equally stringent, though differing, selection criteria could be used for the identification of TNC partners: that is, which TNCs, in the view of the government, are likely to have a positive impact on

45
development; in other words, does the firm either pursue development strategies, or could it foreseeably contribute to the development goals and targets set by the government. Once governments have gone through the stage of identifying those strategic enterprise sectors and investors, support measures have to be put in place in order to make the local enterprises partnership-ready. Questions to be asked at this stage include:
Once a business-enabling environment has been created, what other specific policies could it adopt which would promote TNC-SME linkages?
What role does public-private sector dialogue play in formulating policies and support programmes?
Should government intervention be restricted just to remedy market failures in the areas of information, labour, capital, and technology?
B. The role of the private sector: 1. Business Associations: Business associations have an important role to play in facilitating and enhancing the formulation of SME-TNC linkages. The effectiveness of their role is directly related to the level of public-private sector dialogue established. Important measures taken by the business associations, not only to support and complement governmental policies and measures but also to tailor them more appropriately to the needs of the enterprise community, should include:
advice to the governments on the formulation of appropriate policies and strategies;
development of networks among suppliers, clients, business development support agencies, financial institutions, government offices, and NGOs;
assistance in pre-selection of potential local firms as suppliers to TNCs by preparing updated catalogs of enterprise profiles, supplying a maximum of clear and relevant information on the existing and potential

46
capabilities of enterprises interested in partnering ventures;
fostering partnership between TNCs and local SMEs through improved contact between them, by organizing fairs, exhibitions, and other trading events, facilitating participation in such events, or disseminating information on the advantages of creating links as well as on existing support mechanisms and governmental programmes; and
partner preparation by providing institutional assistance required for SMEs’ capacity upgrading, vertical and horizontal matchmaking.
Business associations can also contribute to the SME-TNC partnership development through mitigating negative impacts of such development on the society. For example, local firms may be informed of the risk of unwanted westernization, or loss of traditional crafts and skills. Moreover, unsustainable competition among local firms could be avoided through close collaboration with the associations. For example, measures could be introduced to discourage damaging cost cutting practices or supplier pyramids, where local firms are at the bottom.
2. TNCs :
The existence of competitive SME suppliers is beneficial for TNCs. In order to foster the network of competitive local suppliers, which are capable of maintaining long-term partnerships with TNCs, they could establish corporate strategies:
to facilitate SMEs’ access to TNC innovation centres and engineers;
train SMEs employees through rotational assignments of qualified technical and management staff from TNCs to SMEs, and vice versa;
gradually upgrade the productive capacities of SMEs from operations to technological capabilities;
participate in adoption, mentoring, coaching programmes;
47
share knowledge with local partners regarding market trends;
support local partners financially or facilitate their obtaining bank loans; and
help local partners develop other business opportunities abroad.
C/ The role of the international community:
As a major source of employment and, thus, income, local SMEs in developing countries are considered to be engines of economic growth. Particularly, in the globalization process where many societies in the developing world are in the process of adjusting to its impact, local firms are seen as the source of dynamic economic and social change. The international community can work towards achieving an equitable economic, social and political balance by:
initiating and developing dialogue on elements for an international environment conducive to the creation of sustainable, equitable TNC-SME linkages which are likely to have positive impacts;
creating international models for TNC-SME linkages, through exchanges of experiences and dissemination of best practices with the participation of relevant stakeholders in the process; e.g., TNCs, SMEs, governmental agencies and institutions, and civil society;
complementing national, regional and sub-regional efforts for investment promotion in general;
eliminating barriers to SME growth and export expansion, such as export barriers, discriminatory rules of competition, quality, health and sanitary standards; and
increasing support for technical cooperation in entrepreneurship development and institutional capacity building.

48
ANNEXES
Inflows of the FDIs in 1998 and 1999 (in Billion US$)
Outflows Owned stocks
1998 1999 1998 1999
Developed Countries
480.6 71% 636.4 74% 2690.1 67 % 3230.8 68%
Western Europe 259.9 38% 315.1 36 % 1545.9 39% 1757.2 37%
European Union 248.6 37 % 305.0 35% 1451.1 36% 1652.3 35%
Other West European Countries
11.2 2 % 10.0 1% 94.8 2 % 104.8 2%
United States 186.3 27% 275.5 32% 811.7 20% 1087.2 23%
Japan 1.8 <1% 12.7 1 % 26.0 1 % 38.8 1%
Other developed countries
32.6 5 % 33.1 4 % 306.5 8 % 347.6 7%
Developing countries
179.4 26% 207.6 24% 1240.9 31 % 1438.4 30%
Africa 7.5 1 % 8.9 1% 84.4 2 % 93.0 2%
Latin America and Caribbean
73.7 11 % 90.5 10% 404.6 10% 485.6 10%
Developing countries
1.4 <1% 2.3 <1% 7.5 <1% 9.8 <1%
Asia 96.5 14% 105.7 12% 741.3 18 % 846.7 18%
West Asia 6.2 1 % 6.7 1 % 54.1 1 % 60.8 1%
Central Asia 3.1 <1 % 2.7 <1 % 13.4 <1 % 16.3 <1%
South East and Asian South East
87.1 13 % 96.1 11 % 673.8 17 % 769.6 16 %
Pacific 0.2 <1 % 0.2 <1 % 3.1 <1 % 3.3 <1 %
Eastern & Central Europe
20.0 3 % 21.4 2 % 84.1 2 % 102.6 2%
The World 680.0 100% 865.4 100% 4015.2 100% 4771.9 100%
Source : CNUCED World Investment Report 2000

49
Outflows of the FDIs in 1998 and 1999 (in Billion US$)
Flux sortants Stocks détenus
1998 1999 1998 1999
Developed Countries
652.0 95 % 731.7 91 % 3649.9 90 % 4276.9 90 %
Western Europe 444.7 65 % 533.2 67 % 2135.3 53 % 2574.9 54 %
European Union 425.5 62 % 509.8 64 % 1920.4 47% 2336.6 49 %
Other West European Countries
19.2 3 % 23.4 3 % 214.9 5 % 238.3 5 %
United States 150.9 22 % 150.9 19 % 980.5 24 % 1131.4 24 %
Japan 0.7 <1% 22.7 3 % 270.0 7 % 292.7 6 %
Other developed countries
55.7 8 % 24.9 3 % 264.1 6 % 277.9 6 %
Developing countries
33.0 5 % 65.6 8 % 403.9 10 % 468.7 10 %
Africa 0.6 <1% 0.9 <1% 16.4 <1% 17.0 <1%
Latin America and Caribbean
9.4 1% 27.4 3 % 77.4 2% 104.6 2%
Developing countries
0.1 <1% 0.1 <1% 1.6 <1% 1.7 <1%
Asia 22.9 3% 37.2 5% 308.3 8% 345.2 7%
West Asia -4.2 -1% 1.1 <1% 3.7 <1% 4.9 <1%
Central Asia 0.1 <1% 0.3 <1% 0.1 <1% 0.5 <1%
South East and Asian South East
27.0 4% 35.8 4% 304.5 7% 339.8 7%
Pacific <0.1 <1% <0.1 <1% 0.2 <1% 0.2 <1%
Eastern & Central Europe
2.1 <1% 2.6 <1% 11.9 <1% 13.7 <1%
The World 687.1 100% 799.9 100% 4065.7 100% 4759.3 100%
Source : CNUCED World Investment Report 2000
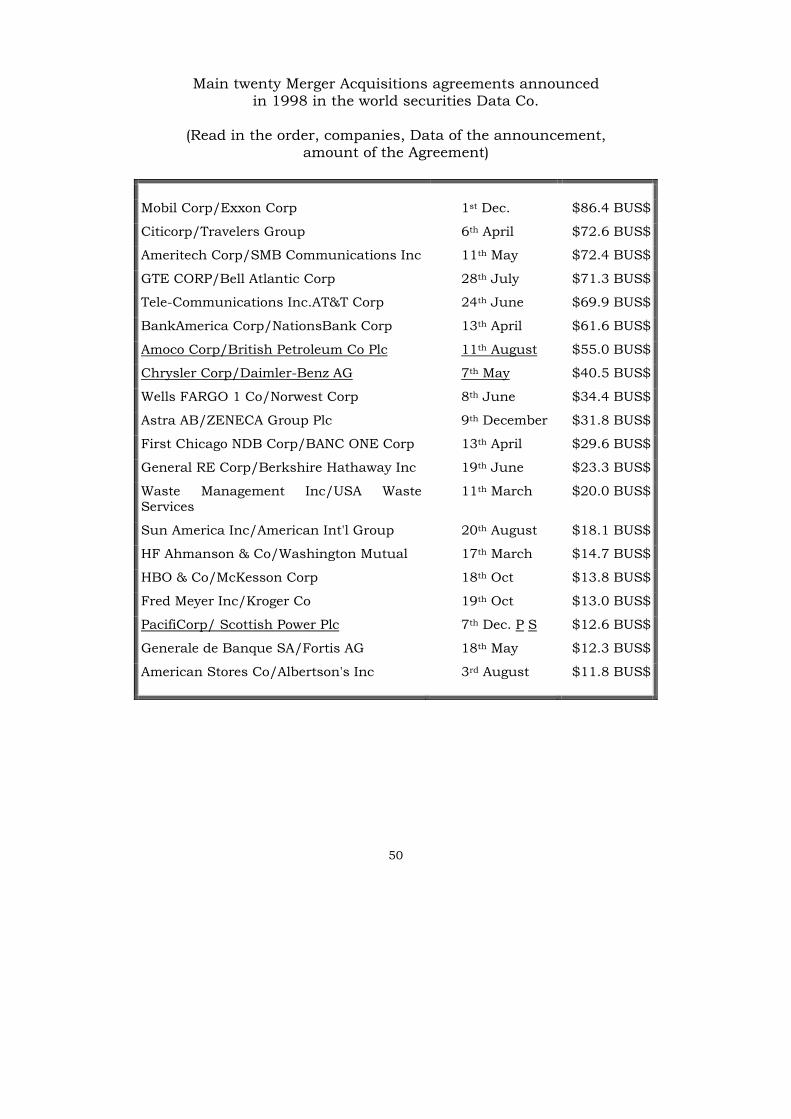
50
Main twenty Merger Acquisitions agreements announced in 1998 in the world securities Data Co.
(Read in the order, companies, Data of the announcement,
amount of the Agreement)
Mobil Corp/Exxon Corp 1st Dec. $86.4 BUS$
Citicorp/Travelers Group 6th April $72.6 BUS$
Ameritech Corp/SMB Communications Inc 11th May $72.4 BUS$
GTE CORP/Bell Atlantic Corp 28th July $71.3 BUS$
Tele-Communications Inc.AT&T Corp 24th June $69.9 BUS$
BankAmerica Corp/NationsBank Corp 13th April $61.6 BUS$
Amoco Corp/British Petroleum Co Plc 11th August $55.0 BUS$
Chrysler Corp/Daimler-Benz AG 7th May $40.5 BUS$
Wells FARGO 1 Co/Norwest Corp 8th June $34.4 BUS$
Astra AB/ZENECA Group Plc 9th December $31.8 BUS$
First Chicago NDB Corp/BANC ONE Corp 13th April $29.6 BUS$
General RE Corp/Berkshire Hathaway Inc 19th June $23.3 BUS$
Waste Management Inc/USA Waste Services
11th March $20.0 BUS$
Sun America Inc/American Int'l Group 20th August $18.1 BUS$
HF Ahmanson & Co/Washington Mutual 17th March $14.7 BUS$
HBO & Co/McKesson Corp 18th Oct $13.8 BUS$
Fred Meyer Inc/Kroger Co 19th Oct $13.0 BUS$
PacifiCorp/ Scottish Power Plc 7th Dec. P S $12.6 BUS$
Generale de Banque SA/Fortis AG 18th May $12.3 BUS$
American Stores Co/Albertson's Inc
3rd August $11.8 BUS$

51
BIBLIOGRAPHY
Ariff , D., Bell, M., (1997), “Patterns of subsidiary-parent linkages and technological capability-building inTNC subsidiaries : the electronics industry in Malaysia”, in Jono, K. S., Keller, J. (Eds), Malaysia’s industrial technology development: Political economy policies and institutes, Oxford, CambridgeUniversity Press. Bradley, Stephen, Richard L., Nolan et Jerry A., Hausman, Globalization, Technology, and Competition : The Fusion of Computers and Telecomunications in the 1990s, Boston, Mass. : Harvard Business School Press, 1993. Buckley, P. J. et Casson, M. « A Theory of Cooperation in International Business », in Contractor, Frank J. et Lorange Peter, (eds), 1988, p. 31-53. Cabon-Dhersin, M.L (2000) “La stabilité des alliances stratégiques en R&D: l’apport de la théorie des jeux”, in Voisin, C A. Plunket et B.Bellon ed. La coopération industrielle, Economica, 2000. Capron, L (1999), “The Long-Term Performance of Horizontal Acquisitions” in Strategic Management Journal, 20: 987-1018. Chesnais F.), « Les accords de coopération techniques entre firmes indépendantes », in STI Revue(OCDE), 4, décembre 1988. Chung S.A, Singh H et Lee, K (2000), “Complementarity, Status similarity and Social Capital As Drivers ofAlliance Formation”, in Strategic Management Journal, 21: 1-22. Contractor F., Lorange P., (1988), “Why should firms cooperate ? The strategy and economics basis for cooperative ventures”, in Contractor, F., Lorange, P., (Eds), Cooperative Strategies in Internaltional Business, Joint Ventures and Technology Partnerships between Firms, Lexinghton Books. Cohen W.M., Levinthal D.A., (1990), “Absorptive Capacity : A New Perspective on Learning and Innovation”, in Administrative Science Quaterly, 35, 128-152. Doz Y.L. (1996), “The evolution of cooperation in strategic alliances : initial conditions or learning processes ?”, in, Strategic Management Journal, Vol. 17, p.55-83.

52
Dussauge, P., « Les alliances stratégiques entre firmes concurrentielles », Revue Française de Gestion, no. 80, sept.-oct. 1990. Ethier, Wilfred. J. and James R. Markusen 1991. “Multinational Firms, Technology Diffusion and Trade,” Journal of International Economics 41: 1-28. Freeman, Christopher et John, Hagedoorn, « Catching Up or Falling Behind : Patterns in International InterfirmTechnology Partnering », World Development, Vol. 22, no 5, p. 771-780. Fernandez, G. et Alain Noël, L’alliance stratégique : Une réponse des PME à la mondialisation, Cahier du CETAI, École des HEC, No 93-19, Montréal, décembre 1993.. Fernandez, Georges, Les alliances stratégiques, Les Cahiers du CETAI, HEC, no ENS 93-01, avril 1993. Hagedoorn, J., (1990), “Organizational modes of inter-firm co-operation and technology transfer”, in Technovation, 10 (1), 17-30. Hagedoorn, John et Jos, Schakenraad, « Inter-firm Partnerships for generic technologies-the case of new materials,Technovation, Vol. 11, no 7, 1991, p. 429-444. Hamel, G., « Competition for Competence and Inter-partner Learning within International Strategic Alliances », Strategic Management Journal, 1991, vol. 12, p. 83-103. Hamel, G Y.L, Doz et C.K Prahalard (1989), "Collaborate with your competitors – and win", Harvard Business Review, 67(1), 133-139. Harrigan K. R., « Joint ventures and Competition Strategy », Strategic Management Journal, Vol. 9, 1988. Horstmann, Ignatius and James R. Markusen 1996. “Exploring New Markets: Direct Investment, Contractual Relations and the Multinational Enterprise,” International Economic Review 37 (1): 1-20. Kogut B., « Joint Ventures : Theorical an Empirical Perspectives », Strategic Management Journal, Vol. 9, 1988, p.319-332. Lorange, P. et J. Roos (1982), Strategic Alliances : formation, evolution and implementation. Basil Blackwell,Londres.

53
Mohamed El-Filali El-Youssefi, sous la direction de Jorge Niosi, Les alliances stratégiques entre les entreprises à l’ère de la mondialisation et du changement de paradigme technologique, Cahiers du CRISES Collection “Working Papers”. Morris, P. et Hergert, M. « Trends in International Collaborative Agreements », Columbia Journal of World Business, summer 1987. Mucchielli P (1991), Alliances stratégiques et firmes multinationales : une nouvelle théoriepour des nouvelles formes de multinationalisation, Revue d'Economie industrielle n°55, Navaretti, B et C.Carraro [1999], « From Learning to Partnership : Multinational R&D Cooperation in Developping Countries », in Economic Innovations and New Technologies, vol.8, 137-73. Ohmae Kenichi, « The Global Logic of Strategic Alliances », Harvard Business Review, Mars-avril, 1989, p. 143-175. Plunket, A. (1999), Evolution de la coopération : contribution à l’étude des déterminants des processus d’évolution et de sélection de la coopération technologique, Thèse de doctorat, Paris Sud. Plunket, A, Voisin C, Bellon B ed. (forthcoming 2001) « Industrial alliances » Edward Elgar, London. Porter M.L. L'avantage concurrentiel des nations, Interéditions, France1993. UNCTAD 1998. World Investment Report: Trends and Determinants. United Nations: New York, NY. UNCTAD 1997. World Investment Report: Transnational Corporations, Market Structure, and UNCTAD 2000. World Investment Report. United Nations: New York, NY. WTO : Several documents and notes of the working group on "trade and investment".

Original : Français
ETUDE
Sur
« L’INVESTISSEMENT PRIVE DANS LES PAYS DE L’OCI ENTRE LES ALLIANCES STRATEGIQUES ET LA PROMOTION DU
COMMERCE»
Présentée par
Le Centre Islamique pour le Développement du Commerce

2
Introduction Générale
Depuis quelques années, les regroupements d’entreprises ont de plus en plus un caractère mondial, à tel point que les opérations transnationales de fusion-acquisition sont devenues en 1999 la composante la plus importante des flux mondiaux d’investissement direct étranger (IDE). On estime qu’elles ont représenté 92 % de l’IDE total en 1999, contre moins de 60 % en 1995.
Ces regroupements ont progressé rapidement dans les années 90, leur volume est passé de US$ 153 milliards en 1990 à près de 1 000 milliards en 2000, et ils ont joué un rôle important dans la mondialisation et la restructuration des activités, avec une tendance croissante vers des opérations de très grande ampleur. Le développement des fusions-acquisitions internationales s’explique en partie par le fait que les entreprises ont tendance à céder ou à reprendre des actifs et des activités à l’étranger au lieu d’y investir dans la construction de nouvelles installations. Par rapport à la construction d’installations nouvelles, l’achat d’actifs existants présente l’avantage de permettre aux entreprises de prendre pied rapidement sur un marché en disposant immédiatement d’une masse critique d’installations de production et d’actifs incorporels dans une branche d’activité donnée. Plusieurs facteurs ont contribué à l’accélération de l’activité mondiale dans ce domaine : la libéralisation des échanges commerciaux et des mouvements de capitaux, les changements technologiques rapides et les progrès des technologies de l’information. Les privatisations et les réformes de la réglementation dans certains secteurs et services d’utilité publique comme les services financiers, les
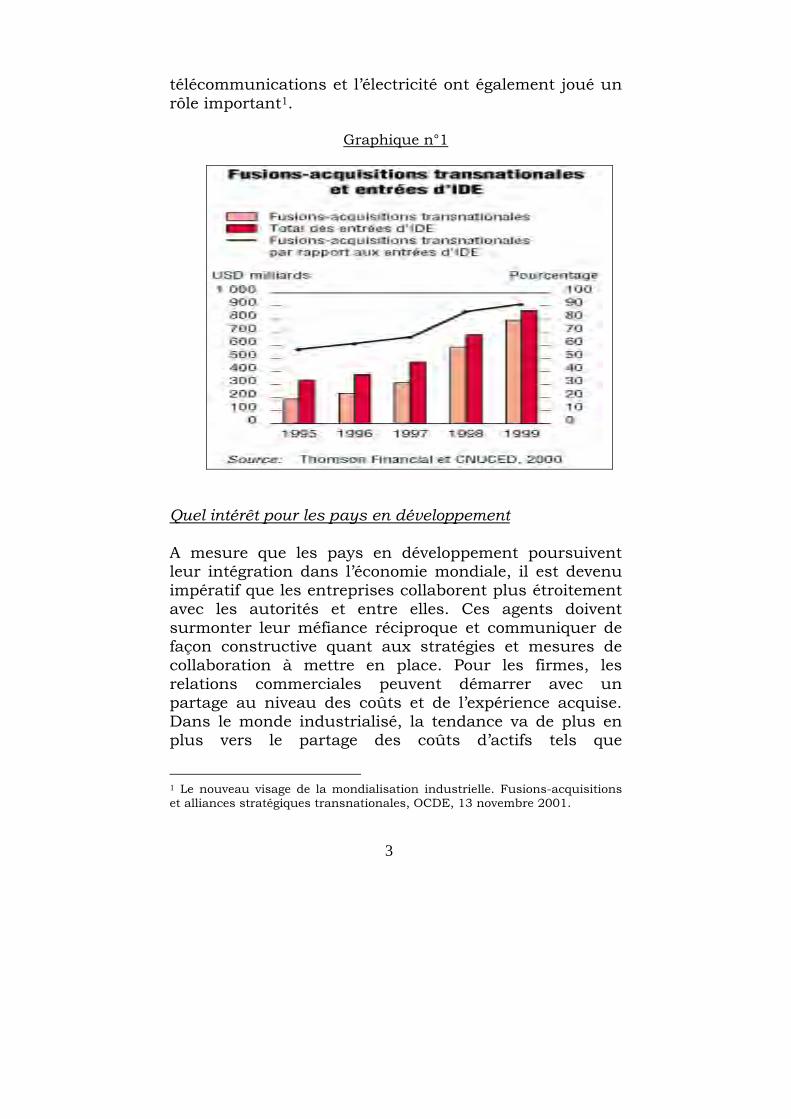
3
télécommunications et l’électricité ont également joué un rôle important1.
Graphique n°1
Quel intérêt pour les pays en développement A mesure que les pays en développement poursuivent leur intégration dans l’économie mondiale, il est devenu impératif que les entreprises collaborent plus étroitement avec les autorités et entre elles. Ces agents doivent surmonter leur méfiance réciproque et communiquer de façon constructive quant aux stratégies et mesures de collaboration à mettre en place. Pour les firmes, les relations commerciales peuvent démarrer avec un partage au niveau des coûts et de l’expérience acquise. Dans le monde industrialisé, la tendance va de plus en plus vers le partage des coûts d’actifs tels que
1 Le nouveau visage de la mondialisation industrielle. Fusions-acquisitions et alliances stratégiques transnationales, OCDE, 13 novembre 2001.

4
l’infrastructure, les locaux, le personnel, les services d’entreposage, de transport, de réparation, les systèmes de télécommunication, ainsi que la commercialisation commune de produits complémentaires. Les pays en développement devraient trouver leurs propres modèles de coentreprises, de partenariats de valeur ajoutée, d’alliances stratégiques et d’accords de coopération. En effet, à l’avenir le partage des risques et les partenariats prédomineront 2. En effet si dans le passé, les pays en développement ont mené une politique de substitution aux importations et que l'acquisition de technologie consistait essentiellement à imiter les procédés utilisés dans les pays développés, aujourd'hui, les pays en développement s'orientent vers des politiques axées sur l'exportation qui exigent des alliances en vue de conquérir les marchés extérieurs et acquérir le savoir faire et la technologie qui sont désormais déterminés par le marché mondial3.
Tandis que les cycles de vie de la technologie et des produits ne cessent de raccourcir, la technologie et le savoir sont de plus en plus considérés comme des atouts fondamentaux pour faire face à la concurrence sur les marchés nationaux et internationaux. Durant les deux dernières décennies, la pratique des accords interentreprises s'est considérablement développée ; les contrats d'agrément, de franchise, de concession et de sous-traitance se multiplient. D’ailleurs les récents accords entre compagnies aériennes, constructeurs automobiles, sociétés informatiques, compagnies d’assurances et les banques en sont des exemples éloquents.
2 Forum du commerce international, CCI 01 septembre 1999 Page 11 . 3 Renforcement des capacités technologiques: ONUDI , OMC, IP/C/W/243/Add.2 ,16 mars 2001, p 5.

5
La spectaculaire fusion de Daimler et Chrysler, le rachat de Volvo par Ford, l'alliance Renault-Nissan, la tentative de prise de contrôle de Daewoo par General Motors, l'absorption de Kia par Hyundaï, le rachat de Bentley, Lamborghini et Bugatti par Volkswagen et de Rolls Royce par BMW, sans parler des multiples fusions-acquisitions entre équipementiers, engagés depuis plusieurs années déjà4, semblent avoir déclenché une vague de contacts, tractations, rachats et alliances dans l'industrie automobile, qui apparaît d'autant plus irrésistible que des vagues semblables sont observables dans d'autres secteurs, comme la pharmacie, l'aéronautique, la banque, l'assurance, les télécommunications, l'agro-alimentaire, l'informatique, etc.
1ère PARTIE :
LES ALLIANCES STRATEGIQUES ET AUTRES FORMES DE PARTENARIAT :
Il est généralement admis que les accords de partenariat constituent une pratique déjà ancienne dans le monde industriel. Garrette et Dussauge (1995) notent le développement, dès la fin des années 60, des co-entreprises ou joint-ventures (JV) - qui constituent l’archétype des alliances – dans le cadre d’opérations de multinationalisation. Toutefois, ce sont les années 80 qui marquent le véritable essor de la coopération inter-firmes. Au cours de cette période, les alliances se sont multipliées dans un contexte propice de mondialisation et de rapide évolution technologique.
4 Michel Freyssenet fusions-acquisitions-alliances et internationalisation, quelles logiques, quelles perspectives? – Universite Montesquieu, Bordeaux , éditorial de la lettre du GERPISA (groupe d'études et de recherche permanent sur l'industrie et les salaries de l'automobile), avril 1999, p 1.

6
A la différence des formes de coopérations antérieures plus ciblées (licences, franchises, sous traitance…), il a été démontré que les alliances stratégiques permettent aux firmes de construire ou d’acquérir, sur le long terme, des compétences stratégiques majeures et d’en retirer un avantage concurrentiel (Hamel et Pralahad, 1990)5. I. LA NOTION D’ALLIANCE Les nombreuses définitions du concept d’alliance, relevées dans la littérature, sont plus ou moins extensives et plus ou moins opérationnelles. Elles peuvent inclure les modalités les plus contraignantes comme les formes de contrôle majoritaire ou celles qui le sont moins, comme la franchise, la sous-traitance, la cession de licences ou les prises de participations. Les alliances stratégiques constituent des accords à long terme conclus entre des firmes indépendantes. Ce sont des arrangements coopératifs mis en place pour atteindre des objectifs stratégiques (Lorange et Roos,1982).
Selon l'AFNOR les alliances sont : "Un état d'esprit rendant possible la création entre partenaires de relation privilégiées, fondées sur une recherche en commun d'objectifs à moyens termes, menées dans des conditions permettant d'assurer la réciprocité des avantages".
On peut aussi définir l’alliance comme étant une nouvelle organisation capable d’engendrer de façon durable une baisse significative des coûts, une qualité supérieure et une innovation permanente. Cette organisation repose sur trois piliers :
5 PERROT Pascal Université de Rennes 2, RUFFIO Philippe , GUILLOUZO Raymond « Les alliances stratégiques au service du développement des coopératives agro-alimentaires (le cas de l’ouest de la France) » 23ème Congrès international du CIRIEC « Economie Sociale et Economie Publique : Nouvelles formes de coopération à l’ère de la mondialisation »13 – 14 juin 2000, Montréal, Québec, Canada.

7
La « redéfinition » des rôles des différents acteurs de la filière industrielle.
Des structures d’organisation interne qui s’appuient davantage sur une logique de projet que sur une logique de métier.
La création de réseau de fournisseurs qui encouragent et facilitent les coopérations entre toutes les entreprises impliquées dans la réalisation du projet.
- Les alliances représentent donc une modalité de rapprochement de deux ou plusieurs firmes, juridiquement indépendantes, ayant pour objet de mettre en commun des ressources financières, humaines et de savoir-faire dans le but de réaliser conjointement des activités portant sur un domaine stratégique tel que la recherche et développement (R&D) , la production, la commercialisation, etc. Les firmes s’entendent sur un objet, des moyens, le partage et le contrôle des résultats selon des modalités plus ou moins formelles. Dans la majorité des cas, elles signent des contrats qui régissent les aspects juridiques et économiques de leur alliance, de même que sa durée. Il arrive également qu’elles choisissent des arrangements plus formels, telles que des filiales communes, des joint-ventures.
II. LES DIFFERENTES FORMES D’ALLIANCES
Le PARTENARIAT ou l’ALLIANCE. Utilisé au sens large le terme « partenariat » peut désigner les alliances stratégiques, les partenariats, les coentreprises, les ententes de collaboration, les réseaux d’entreprise et les coalitions.
La plupart des alliances peuvent être groupées soit sous la catégorie des alliances horizontales, soit sous celle des alliances verticales. Il arrive, cependant, que certaines alliances, en raison de leur envergure, intègrent des

8
composantes verticales et horizontales dans leur structure6.
On peut également classer les alliances suivant un critère organisationnel qui se base sur la forme que prend l’accord de coopération : s’agit – il uniquement d’une délégation, d’une concession au profit d’une entité déjà existante (stratégie d’impartition) ou bien débouchera t-il sur une nouvelle entité (stratégie d’intégration)7.
A - Les stratégies d'impartition
A l'heure actuelle, dans tous les secteurs on constate une augmentation de l'impartition (sous-traitance, co-traitance et concession), qu'il s'agisse du secteur des produits ou du secteur des services. Une entreprise peut impartir des fonctions ou la production de sous-systèmes et de composants.
- Les accords de licence (« Licensing) A travers la convention de licence, le donneur de licence (licencor) transmet au preneur de licence (licensee) le droit de tirer profit et d’exploiter des valeurs fondamentales et protégées de l’entreprise (Les marques, les procédés de production, les canaux de distribution,…). Ainsi, le preneur de licence reste indépendant du donneur, du moins juridiquement (p.ex. l’adjudication par l’industrie suisse de licences de production et de 6 Il existe quatre grands types d’alliances :
Les alliances horizontales (arrangements entre entreprises concurrentes produisant des produits similaires ou identiques en vue de restreindre la concurrence);
Les alliances verticales (arrangements entre entreprises intervenant à différentes étapes du circuit production-distribution);
Les fusions. Les acquisitions.
7 Cours de Marketing de l’Université de Genève, année universitaire 1999-2000.
9
vente de médicaments dans l’industrie chimique à des firmes étrangères dont le siège est aux USA). Dans maintes situations, l’entreprise vend également l’installation de production au preneur de licence et lui donne les indications nécessaires avec lesquelles la production et la vente pourront être organisées d’après leur modèle. La majeure partie des investissements de l’exploitation sera prise en charge par le preneur de licence. L’entreprise internationale peut de cette façon exploiter sa ligne de produits (év. d’autres marques), dans les marchés difficiles et partiellement en retard. Ainsi, elle peut épargner et n’investir que dans la recherche pour l’innovation et dans le développement de nouveaux produits. La rentabilité globale de la ligne de produits peut être améliorée fondamentalement par l’offre des produits licenciés dans les marchés frontaliers. Les conventions de licence, aussi intéressantes peuvent-elles paraître, exigent de la firme internationale de nombreuses directives de précaution juridiques et économiques, de sorte que le preneur de licence ne devienne pas un concurrent. La différence fondamentale entre la convention de licence et la franchise, c’est que le preneur de licence reste en principe libre sur l’art et la manière de commercialiser son produit, tandis que son homologue, le franchisé, sera restreint de façon stricte dans ses efforts sur le marché et en même temps, stimulé grâce au concept de franchise internationale procuré par le donneur de franchise (p.ex. les restaurants et/ou les hôtels Mc Donald’s)8.
8 Ibid.

10
- La Sous-traitance
C’est une opération par laquelle un entrepreneur, donneur d'ordre (main contractor ou prime contractor) confie sous sa responsabilité à une autre personne appelée sous-traitant (subcontractor) tout ou partie de l'exécution du contrat d'entreprise ou du marché. Cette définition permet de distinguer le sous-traitant d'une autre entreprise :
Les produits du sous-traitant font généralement partie du produit final mais ne constituent pas le produit final en totalité ;
Le sous-traitant n'a, en général, aucun contact direct avec le consommateur final, c'est le donneur d'ordre qui a ce contact.
On distingue différents types de sous-traitance :
Sous-traitance standard Sous-traitance simple Sous-traitance étendue Sous-traitance stratégique Sous-traitance en partenariat
La sous-traitance peut être une manière de s'internationaliser si l'entreprise donneuse d'ordre à une activité internationale. Elle peut aussi conduire à l'internationalisation de la firme donneuse d'ordre si celle-ci fait sous-traiter tout ou partie d'un produit à l'étranger. - Cas particulier : le contrat OEM Dans un contrat OEM (Original equipment manufacturer) : le donneur d'ordre est appelé OEM ou "sourcer" alors que les fournisseurs de composants sont vus comme des fabricants de produits OEM, c'est à dire des sous-traitants.
11
Dans un contrat OEM le pouvoir de négociation entre les deux parties est souvent à l'avantage du donneur d'ordre. Ce n'est pas toujours le cas dans une relation donneur d’ordre - sous-traitant normale. Le sous-traitant possède quelque fois une compétence particulière qui lui donne un pouvoir de négociation vis-à-vis du donneur d'ordre. Cela explique certainement en partie le développement de la sous-traitance internationale. Les raisons de ce développement sont nombreuses.
Le donneur d'ordre peut désirer se concentrer sur ses compétences de base.
Il peut rechercher à réduire les coûts de production. Chaque étape de la chaîne d'offre est candidate pour la sous-traitance internationale.
Le sous-traitant peut, par sa spécialisation, être une source d'innovation.
Le donneur d’ordre potentiel peut faire face à une demande fluctuante.
Dans cet ordre, la sous-traitance implique un degré de coordination de plus en plus important entre les deux parties au fur et à mesure que la tâche confiée est plus complexe. - La Franchise
Une firme dans un pays (le franchiseur) autorise une firme dans un autre pays (le franchisé) d'utiliser sa marque de fabrique, son logo, et/ou ses techniques de production ou de commercialisation contre le paiement de redevances.
Il existe plusieurs types de franchise :.
- la franchise industrielle : dans ce cas, le franchiseur est un industriel qui concède à

12
un autre industriel un droit d'exploitation de sa marque et de son savoir-faire (Coca-Cola par exemple).
- la franchise de services : ici, le contrat se rapporte à la diffusion d'une méthode ou d'un savoir-faire (MacDonald ou Jean-Louis David par exemple). Cette forme de franchise s'est très développée et représente aujourd'hui environ 40 % des points de vente franchisés.
- la franchise de production : le franchiseur est un producteur qui commercialise ses produits dans des magasins qui exploitent sa marque et sa renommée ( Yves Rocher ou Benetton par exemple).
- la franchise de distribution : le franchiseur est ici un grossiste qui développe un concept et diffuse une collection qu'il a sélectionné auprès de fournisseurs ou qu'il a fait créer (Manoukian ou Pronuptia par exemple).
- La concession et l'agrément
1- la concession
La concession est un contrat liant un fournisseur à un commerçant, auquel il réserve la vente de ses produits, à condition qu'il accepte un contrôle commercial, comptable, voire financier de son entreprise et parfois s'engage à s'approvisionner, dans ce secteur, exclusivement chez le concédant.
Cette définition fait apparaître que la concession peut-être un mode de distribution sélectif et éventuellement exclusif.
13
- La concession sélective
Dans ce cas, le producteur choisit soigneusement ses distributeurs et limite le nombre de points de vente où ses produits seront distribués. La sélection s'opère selon des critères de taille mais aussi et surtout d'accueil, de compétence et de conseils proposés à la clientèle. Côté producteur, cela aboutit à une diminution des coûts de distribution et permet un contrôle qualitatif des points de vente. Cependant, la couverture du marché reste limitée. Aucune exclusivité n'est toutefois imposée aux distributeurs.
- La concession exclusive
Il s'agit d'une concession sélective mais qui s'accompagne d'une clause d'exclusivité.
Ici, l'entreprise ne choisit plus un ensemble de points de vente mais quelques distributeurs ayant l'exclusivité de la distribution de ses produits sur un secteur géographique déterminé. L'objectif d'un tel choix stratégique est de permettre la création , le développement, et le renforcement d'une image de marque. C'est pourquoi la concession exclusive est souvent réservée à des produits de luxe ou des produits "haut de gamme".
Elle a pour avantage un excellent contrôle de la commercialisation de point de vue qualitatif, un investissement allégé pour le producteur en force de vente et en logistique mais présente l'inconvénient de n'assurer qu'une faible couverture du marché en raison du petit nombre de points de vente sélectionné. Par ailleurs, le contrôle et le recrutement des distributeurs n'est pas toujours très facile.

14
2- L'agrément
C'est la forme la moins contraignante d'accord interentreprises car elle ne comporte aucune exclusivité. L'agrément s'inscrit dans le cadre d'une politique de distribution intensive qui consistera à distribuer les produits dans un maximum de points de vente. L'avantage de l'agrément est de permettre de couvrir un secteur géographique important, de conquérir de fortes parts de marché, de faire connaître rapidement les produits, donc d'augmenter le Chiffre d’Affaires. Toutefois, cette stratégie exige que l'entreprise soit capable de fournir aux distributeurs, souvent dans des délais très courts, des quantités importantes. Cette stratégie n'est donc envisageable que pour des entreprises d’une certaine taille.
Les caractéristiques principales de l'agrément peuvent être résumées de la manière suivante :
le concédant ne s'interdit pas de désigner d'autre distributeurs dans la zone attribuée à son concessionnaire.
le concessionnaire ne s'engage pas à ne pas vendre de produits concurrents.
Toutefois, l'absence d'exclusivité n'empêche pas l'application des principes essentiels du contrat de concession à savoir la possibilité pour le fournisseur de contrôler les conditions de commercialisation de son produit et la possibilité pour le distributeur de bénéficier des actions promotionnelles du concédant.
- La constitution d'une filiale commune (Joint venture)
Lorsqu'il s'agit de sociétés de nationalités différentes. Dans ce cas, deux sociétés décident de créer une filiale commune sous forme de personne morale à part entière. Le choix du statut juridique le mieux adapté est libre.

15
- En général les « meilleures » opérations d'impartition, c'est-à-dire les plus faciles à réaliser sont celles où la performance est facile à mesurer et la complexité des opérations minimale. En sous-traitant, l'entreprise donneuse d'ordre devrait créer un avantage concurrentiel, soit en termes de coûts, de qualité ou d'exclusivité, tout en lui permettant de conserver son autonomie d'action. On donnera « à faire » à l'extérieur des opérations qui ont une importance stratégique limitée.
III – LES STRATEGIES D’INTEGRATION
A- Techniques d'intégration de type patrimonial.
On distingue trois catégories :. 1. la fusion. 2. la fusion-absorption. 3. l'apport partiel d'actif.
- La fusion est une opération juridique consistant à regrouper plusieurs sociétés ou entreprises en une seule. Par exemple, si deux sociétés, une société A est une société B , fusionnent, l'opération aboutira à une dissolution de ces deux sociétés. Leurs patrimoines seront réunis en un seul . Une nouvelle société sera créée issue de la fusion des deux précédentes et dont l'actif se composera de l'actif de la société A et de l'actif de la société B et dont le passif se composera du passif de la société A et du passif de la société B.
- La fusion-absorption se caractérise par l'absorption d'une société par une autre. La société absorbante verra son patrimoine gonflé par celui de la société absorbée. La société absorbée disparaît mais il n'y a pas, comme dans le cas précédent, de création d'une personne morale nouvelle. La société absorbante devra augmenter son capital et distribuer de nouveaux titres aux associés de la société absorbée.

16
- L'apport partiel d'actif : dans ce cas, une société opère un apport en société au profit d'une autre société. Par exemple, si la société A réalise un apport partiel d'actif au profit de la société B, cette dernière remettra à la société A des titres en contrepartie de cet apport.
B -Techniques d'intégration de type financier.
On distingue ici la prise de participation, la prise de contrôle, et la constitution d'un groupe.
- La prise de participation se caractérise par le fait qu'une société se rend propriétaire d'une fraction des titres d'une autre société. On parle généralement de prise de participation lorsque le pourcentage détenu se situe entre 10 et 50 % du capital d'une société par une autre (au-delà, il s'agit d'une prise de contrôle).
- La prise de contrôle se caractérise par la détention d'un pourcentage supérieur à 50 %. Par exemple, si une société A détient plus de 50 % d'une société B, celle-ci devient filiale de la société A .
Toutefois, on peut parfois parler de prise de contrôle même lorsque la participation est inférieure à 50 %. Ces techniques sont souvent utilisées pour l'acquisition d'entreprises dans le cadre d'une Offre Publique d’Achat (OPA).
L'OPA est une technique par laquelle une société propose aux associés d'une société « convoitée » de leur acheter leurs titres à un prix supérieur au cours de la bourse pendant une période limitée en vue d'en effectuer la prise de contrôle. Une OPA peut être amicale ou inamicale .
Des stratégies d'entrée sur les marchés étrangers peuvent se limiter donc à la forme des participations financières. Dans le cas du capital risque (venture capital), on cherche un placement rentable à l'étranger sans ambition

17
de contrôle du management des entreprises. Dans les années soixante dix, l'entrée du capital libyen dans la société Fiat, à un moment où cette dernière avait de grosses difficultés, surtout au niveau de la production, en est un exemple éloquent. Après avoir précisé les notions de partenariat et d’alliances, nous traiterons des enjeux et des difficultés de mise en œuvre.
IV- ETAT DES LIEUX DES ALLIANCES :
A- Distribution sectorielle des alliances9 Porter et alii [1986 : 353] ont enregistré un déplacement sectoriel des alliances stratégiques des secteurs mûrs vers les secteurs de pointe, ce qui contredit l’idée selon laquelle les alliances ont commencé dans les secteurs de pointe pour se généraliser dans un second temps aux secteurs mûrs. Durant les années 1970, les accords de coopération étaient concentrés dans les secteurs des métaux, minéraux, énergie et chimie. Alors que les accords de coopération ont décliné constamment durant la décennie 1970 dans les deux premiers secteurs, ils ont, cependant, enregistré un développement dans l’énergie immédiatement après les deux crises pétrolières. Porter et alii relèvent par contre, la montée des alliances dans le secteur de l’ordinateur au début des années 80. Et ils expliquent l’attrait du comportement de coopération dans la chimie et l’informatique par leur intensité technologique. Dans une plus récente étude, Hagedoorn [1996 : 602-3] confirme ce déplacement sectoriel des alliances. En effet, durant la première moitié des années 1970 les alliances
9 Mohamed El-Filali El-Youssefi, sous la direction de Jorge Niosi, Les alliances stratégiques entre les entreprises à l’ère de la mondialisation et du changement de paradigme technologique, Cahiers du CRISES Collection “Working Papers”.

18
stratégiques étaient presque inexistantes dans les technologies de pointe comme les technologies d’information, biotechnologie et nouveaux matériaux. Jusqu’à 1979, les alliances formées dans les secteurs classiques étaient plus nombreuses que celles créées dans les technologies de pointe. Mais depuis le début des années 1980, les alliances stratégiques de technologie de pointe sont dominantes.
Tableau n°1
Distribution sectorielle des alliances (1980-1993)
Secteurs Distribution (%) Biotechnologie 16,20 Microélectronique 15,63 Chimie 9,34 Nouveaux matériaux 9,29 Télécommunication 8,6 Logiciel 8,55 Aviation/défense 6,82 Industrie de l’Automation 5,86 Ordinateurs 5,3 Automobile 4,3 Autre technologie de l’information 2,26 Électricité lourde 2,00 Instruments techniques 1,74 Électronique 1,69 Alimentation et boissons 1,61 consommation 0,83 Autres Total 100,00 Source : Hagedoorn et Narula, 1996.
Ces résultats sont corroborés par l’étude de Menguzzato et Renau [1992 : 142] qui montre que la propension à coopérer et son évolution durant les années 1980 varient selon le secteur. En effet, dans les jeunes secteurs (information, biotechnologie), caractérisés par un potentiel de croissance relativement plus important, une intensité technologique plus grande et un degré de

19
mondialisation plus profonde, la propension à coopérer est plus grande. Dans les secteurs comme les technologies de l’information et de la biotechnologie, la technologie est très complexe et en changement rapide. Ils sont en outre jeunes (biotechnologie) et en croissance (information) en plus d’être des secteurs mondialisés. Hergert et Morris [1988 : 105] relèvent la concentration des accords de coopération dans cinq industries majeures qui à elles seules regroupent 87 % des alliances. Ce résultat n’est pas surprenant puisque tous ses secteurs sont catégorisés comme étant à coûts d’entrées élevés, hautement globalisés, caractérisés par les économies d’échelle, à technologie très changeante et enfin à haut risque. Il s’agit des télécommunications, de l’aérospatiale, de l’automobile, de l’ordinateur et du matériel électrique.
B- Distribution géographique des alliances
stratégiques Ohmae [1985] met en relief le rôle dominant des entreprises américaines, européennes et japonaises dans le partenariat stratégique international en technologie, spécialement dans l’industrie de l’ordinateur et de l’automobile. Il avance l’idée de triadisation du phénomène. Les résultats de l'étude de Morris et Hergert [1988 : 102-103] qui couvre la période allant de 1975 à 1986, révèlent également que la majorité des alliances internationales sont entre des partenaires de la Communauté Européenne (30,8%) ou entre des partenaires de la CE et les ÉU (25,8%). Les entreprises américaines représentent 47% des alliances recensées, alors que les japonaises ne participent qu’à 18% des cas. Les européennes sont dans 74% des partenariats inventoriés par l’étude.

20
Le parent pauvre des alliances est le reste du monde avec un peu plus de 10 % des partenariats. La majorité des alliances internationales sont donc le fait des entreprises de la Triade. Cette affirmation a été confirmée par des études plus récentes notamment celles de Freeman et Hagedoorn [1994] et Hagedoorn [1996a : 612]. L’étude de Porter, Fuller et Rawlinson [1986] montre, par contre, une distribution géographique des alliances en faveur des États-Unis, suivis du Japon et de l’Europe. Cette différence entre les résultats des premières analyses et celles de cette dernière peut s’expliquer par le fait que les premières surestiment les données européennes et celle de Porter et ses collègues se fondent sur les données américaines. Freeman et Hagedoorn [1994 : 773] montrent que pour la période 1980-1989, la position dominante des pays développés se reflète également au niveau sectoriel. En effet, dans les industries de la biotechnologie, du logiciel et des ordinateurs, la coopération est quasi exclusive aux pays développés. La domination des pays développés est moins ressentie dans l’alimentation et les boissons. L’explication réside dans l’attraction des pays développés par les nouveaux secteurs et la délocalisation des secteurs mûrs ou de créneaux moins dynamiques des secteurs mûrs aux pays non industrialisés. Le cas le plus typique est la concentration des États-Unis, suivi plus tard par les européens et les japonais dans la chimie, et leur réorientation vers la chimie fine et de spécialité à valeur ajoutée plus importante et à moindre risque et le désengagement de la chimie de base et sa délocalisation vers des PED disposant de matières premières à bon marché. La période 1990-1993 marque, cependant, un changement majeur, dans la mesure où l’analyse de Hagedoorn [1996a] révèle : (i) un rétrécissement du pourcentage des alliances technologiques intra-europe (9

21
%); (ii) la progression des alliances intra États-Unis, et; (iii) la participation plus active des entreprises des autres pays (autre que Europe, États-Unis et Japon) qui a doublé entre les périodes 1970-1979 et 1990-1993. Les combinaisons internationales des alliances ont changé en raison surtout de la montée des accords avec des compagnies originaires des nouveaux pays industrialisés, en particulier des pays du Sud-Est asiatique comme la Corée du Sud, Singapour et Hong Kong.
- Cas particulier des fusions et acquisitions :
Les pays industrialisés sont des acteurs dominants dans les F&A transfrontalières. Depuis les années 80,80% des opérations de F&A (achats et ventes) sont réalisées par les pays industrialisés.
L'Union européenne occupe la première place en 1999 avec 70 % des opérations d'achats et 50 % des ventes conclues entre pays industrialisés. Le déséquilibre notoire entre les achats et les ventes est dû aux importantes acquisitions réalisées aux États-Unis. Hormis ces dernières, le restant des opérations (75 % des ventes et 50 % des achats) est constitué d'opérations intracommunautaires, réalisées en général en réponse à la déréglementation, à l'intégration régionale et à la création de l'euro.
Les États-Unis constituent la cible principale des opérations avec un record de 233 Md$ d'opérations d'achat, dont 80 % sont conduites par des firmes de l'UE (alors que cette part était inférieure à 50 % au milieu des années 90). Les achats réalisés par les firmes américaines sont en baisse de 18 % à 112 Md$ en 1999, du fait de leur faible participation aux mégafusions conclues en 1999.

22
Le Japon reste globalement en retrait des opérations de F&A, probablement du fait de l'absence de liquidités, conséquence des crises du secteur bancaire et de celui des assurances.
Les pays émergents ou en développement restent des acteurs mineurs pour les achats (5% du flux mondial en 1999), malgré une hausse des montants en valeur (41 Md$ soit deux fois plus qu'en 1998). Il convient toutefois de souligner que ces opérations ont un rôle structurant dans un contexte régional, particulièrement en Asie (à partir de Singapour) et en Amérique latine, permettant à certaines firmes d'émerger comme acteurs mondiaux dans leurs secteurs (Cemex au Mexique dans le secteur du ciment, par exemple). En termes de flux de F&A entrants, le poids des pays émergents gagne de l'importance (20% en % des opérations, 9% en valeur en 1999), du fait d'opérations de privatisation en Amérique latine et d'acquisitions en Asie suite à la crise (Corée du Sud notamment). L'UE reste le principal investisseur, avec 40 % des flux entrant dans la zone, suivie par les États-Unis10.
10 Mohamed El-Filali El-Youssefi, sous la direction de Jorge Niosi, Les alliances stratégiques entre les entreprises à l’ère de la mondialisation et du changement de paradigme technologique, op cit.

23
Tableau n°2 Fusions et Acquisitions transfrontalières en
pourcentage des entrées d’IDE11
Régions Moyenne de 1997 à 1999 (pourcentage)
Amérique du nord 91,7
Europe occidentale 93,9 Japon 100,0 Amérique latine 60,9 Europe de l'Est 32,9 Afrique 31,3 Moyen-Orient 26,9 Asie 21,8 Moyenne des Pays développés
95,1
Moyenne des Pays en développement
36,7
Moyenne mondiale 77,1 Source : Conférence des Nations Unies sur le commerce
et le développement, Rapport sur l’investissement dans le monde 2000, p 9.
V. LES ENJEUX DES ALLIANCES :
L'objectif des alliances est dans un premier temps de renforcer nettement les entreprises sur le plan organisationnel et en second lieu, c'est au niveau stratégique que les entreprises situent les enjeux ( surtout les PME). Ces enjeux résident dans l'obtention d'avantages afin de passer outre les contraintes imposées par les marchés. Ainsi, les grandes entreprises cherchent 11 TODD EVANS, Moniteur de l'investissement direct étranger, Société d’Expansion des Exportations, Canada, Août 2000.
24
à se recentrer sur leur savoir-faire tout en combinant leurs compétences et en simplifiant leurs procédures. Tout d'abord, les procédures sont simplifiées car les fournisseurs proposent des prestations globales (on réduit donc le nombre d'interlocuteurs) mais aussi parce que la filière industrielle est réduite.
Cette réduction de la phase de conception (lean conception) a trois effets :
Réduction des coûts de développement et d'industrialisation.
Mise sur le marché rapidement des produits nouveaux ( gains de temps )
Permettre de corriger les erreurs coûteuses de "séquentialisation" des étapes de conception .
L’amélioration des processus de production, peut englober : la qualité, les délais, la capacité d'innovation, et l'efficacité du management et de l'organisation.
A la réduction des coûts due aux économies d'échelle, viennent s'ajouter les réductions de coûts de transport (et logistique ). Enfin, si les grandes entreprises s'allient aussi pour bénéficier d'un champ de négociation plus large, les PME quant à elles, cherchent à résister vis à vis de contraintes des marchés de plus en plus restrictives. Pour les PME, l'alliance trouve sa raison d'être dans la nécessité de répondre à la notion de taille critique imposée par les fournisseurs ou le marché. Il leur faut augmenter leur capacité en terme d'investissement financier, de personnel ou bien en terme d'équipement. Mais le partenariat est surtout pour ces entreprises un moyen d'assurer leur survie face à la concurrence et d'assurer leur développement. Mieux encore, c'est également une occasion pour ces firmes de profiter d'un carnet de commandes régulier.

25
- Toutefois il y a lieu de souligner que certaines alliances ne sont que des rencontres qui ne durent que le temps pour l'un des partenaires de s'introduire sur un nouveau marché. D'autres sont un prélude à la fusion totale des technologies et capacités de deux ou plusieurs entreprises. De plus en plus de sociétés multinationales adoptent l'option stratégique: l'alliance compétitive inter-régionale des entreprises dans lesquelles deux ou plusieurs sociétés internationales solidement implantées, souvent de régions différentes, unissent leurs forces pour entrer dans la compétition à l'échelle régionale ou mondiale.
- Etudes empiriques sur les déterminants des alliances stratégiques :
Selon l’étude de Hagedoorn de 1993, trois motifs principaux jouent un rôle significatif dans la constitution d’alliances stratégiques.: la complémentarité de la technologie avec 31 % des alliances, la réduction du délai de l’innovation qui concerne 28% des accords, et l’accès au marché ainsi que la structuration du marché qui porte sur 32 % des arrangements [p. 378]. Les deux premiers motifs sont probablement les plus importants pour les firmes qui s’engagent dans la coopération technologique. L’étude rapporte que l’importance de ces motifs s’est accrue durant les dix dernières années. Les résultats montrent des motifs différents dans les divers champs technologiques et secteurs industriels. La même étude relève que la complémentarité technologique et la réduction du délai de l’innovation sont des motifs de coopération moins significatifs dans des secteurs telles que la chimie, la consommation d’électronique, l’alimentation et boissons, et jusqu’à un certain point dans l’industrie automobile. Concernant l’automobile, la coopération y a débuté durant les années soixante-dix et s’est développée depuis

26
cette date. Dans ce secteur, les accords de coopération internationaux qui se sont multipliés entre les entreprises nord-américaines, européennes et asiatiques, comme le montre Ohmae [1985 : 201-6], correspondent à un nouveau jeu concurrentiel permettant aux entreprises notamment l’accès aux compétences et aux marchés. Avec l’IDE et les acquisitions, la coopération, est une formule de croissance externe utilisée pour pénétrer des marchés étrangers, améliorer l’efficacité productive et élargir la gamme de produits et innover [Sachwald, 1993, p. 86-102]. Ces motifs ne sont pas uniformes à travers les pays. La pénétration du marché étranger est un objectif qui concerne surtout les entreprises japonaises du fait de l'efficacité acquise de leur processus de production. L'objectif recherché par les entreprises japonaises est, d'une part, l’exportation pour minimiser les coûts et les risques d’entrée dans un nouveau marché et d’autre part, effectuer une entrée rapide. Elles cherchent en plus l’implantation à l’étranger pour utiliser les réseaux déjà en place et bénéficier de la connaissance du terrain acquise par le partenaire (Mitsubishi/Chrysler et Toyota/GM). L’objectif d’efficacité12 est atteint par (i) l’accès à la production : les entreprises européennes et américaines qui sont moins performantes en termes d’efficacité cherchent à améliorer leur situation à travers des alliances avec leurs concurrents japonais en vue 12 Chesnais (1988), Contractor et Lorange (1988). Ohmae (1988). L’auteur a utilisé la base de données MERIT-Cooperative Agreements and Technology Indicators (CATI). C’est une base de données relationnelle qui regroupe l’information sur plus de 13000 accords de coopération technologique (inventaire systématique) impliquant environ 5000 compagnies mères et établies durant les années 80. Pour certains secteurs ou champs technologiques, on a pu collecter des informations concernant même les années 70 ou plus loin. Une collection systématique des alliances technologiques a commencé en 1988. La base de données contient de l’information sur les coopérations de 1980 à 1993.

27
d’apprendre «les procédés modernes et les techniques du contrôle de qualité» (Chrysler/Mitsubishi) [Ohmae, 1985 : 205]; (ii) la réalisation d’économies d’échelle (Renault/Peugeot pour des composants et Renault/Peugeot/Volvo pour le moteur V6); (iii) la délocalisation de la production d’entreprises japonaises et européennes vers des pays moins industrialisés puis vers des pays du sud européen, et; (iv) l’élargissement de la gamme des produits (GM/Toyota). L’industrie chimique qui est une industrie complexe, diversifiée, intensive en capital et cyclique a été frappée par une crise en 1980. En vue de limiter l’effet cyclique de cette industrie, les entreprises ont adopté une stratégie de réorganisation du portefeuille et d’internationalisation. La première action vise la réorientation vers la chimie fine et la chimie de spécialités et donc un désengagement de la chimie de base. Or, tant la chimie fine que de spécialités nécessitent une grande capacité d’innovation et d’adaptation aux besoins de la demande. Ces deux facteurs impliquent l’internationalisation pour pouvoir supporter les coûts de la R&D et de produire sur place pour être informé sur les besoins potentiels des clients [Sachwald, 1993 : 259-303]. La coopération est donc l’instrument idéal pour réaliser ces objectifs.
- L’accès au marché et sa restructuration est un motif important dans les quatre secteurs mûrs (automobile, Chimie, électronique de consommation, alimentation et boissons ainsi que dans l’ordinateur et la micro-électronique. Pour les télécommunications, l’importance de ce motif est compréhensible si on reconnaît que le marché international des télécommunications est jusqu’à récemment caractérisé par des monopoles nationaux et des marchés oligopolistiques domestiques. Même pour les grandes compagnies, l’accès aux marchés internationaux n’a pu se

28
réaliser qu’à travers les alliances avec les producteurs nationaux de ces marchés. Pendant les dernières années, ce secteur connaît une restructuration due à l’excès de capacité, un développement technologique qui piétine et une compétition féroce dans laquelle les alliances jouent un rôle. Le dernier argument explique l’importance de ce motif dans des secteurs comme l’ordinateur et la micro-électronique [Hagedoorn, 1993 : 380].
Par contre, dans l’industrie des semi-conducteurs caractérisée par l’intensification de la concurrence suite à l’émergence sur le marché mondial de nouveaux producteurs et l’importance prise par le facteur technologique, on assiste à la constitution d’entreprises communes et des accords de développement de technologie pour l'acquisition de la technologie, l’accès au marché, le partage des coûts et des risques et l’élargissement de la capacité de production [Hobday, 1993 : 172].
VI. LES DIFFICULTES :
Peu importe les différentes formes que peuvent prendre les alliances, la clef du succès réside dans la planification et la préparation minutieuse ; Le partenariat ne s’improvise pas ; la transformation du discours « partenarial » en réalité concrète et rentable pour l’ensemble des partenaires passe par une période d’apprentissage de la coopération souvent coûteuse. Il est primordial de définir au préalable des objectifs communs. Définir des stratégies communes avec les fournisseurs procure un avantage concurrentiel certain. Mais cela nécessite aussi un profond changement culturel. En outre, il est important de partager l’information, de décider ensemble, d’obtenir la contribution de chacun et de ne pas peser trop lourd
29
chez les fournisseurs. Au besoin, le donneur d’ordre devrait aider son fournisseur à atteindre l’objectif visé en déléguant ses techniciens sur place pour améliorer les méthodes de travail ou d’une tout autre manière. Une telle transformation sous-entend évidemment des réflexions stratégiques suffisantes en amont et une bonne préparation de la collaboration. D’autre part, une difficulté naît du fait que les partenaires contractualisent sur des objectifs avant même que ne s’engage le processus de conception et de développement13. Les accords de coopération transnationale entre constructeurs automobiles (tel que l'atteste l'accord entre Fiat et Ford exposé par Guiseppe Volpato) peuvent échouer également pour des raisons relatives au partage des pouvoirs et aux difficultés rencontrées pour coordonner voire intégrer les différents services des entreprises "coopérantes".
A cela s'ajoute, comme le soulignent Koichi Shimokawa et Young-Suk Hyun, les problèmes engendrés par des alliances « déséquilibrées » au sein desquelles l’un des partenaires poursuit de façon dépendante les objectifs de son « collaborateur leader ». Par exemple, du fait de son alliance avec Chrysler, Mitsubishi n’a pas réussi à construire sa propre image de marque aux USA. Cette alliance à terme a plutôt été défavorable. En effet, lorsque Mitsubishi a implanté aux USA ses propres activités de production, celles-ci n'ont pu être rentabilisées à cause de son faible pouvoir commercial. Quant à l’alliance entre Daewoo et GM, on peut la qualifier de «strong path dependency» puisque Daewoo a produit, pendant vingt et un ans, de 1972 à 1992, pour le marché américain, les modèles conçus par GM (Chevrolet, Rekord, LeMans..), en se trouvant enfermé dans la stratégie d’internationalisation du géant américain. Cette alliance, certes, a permis à Daewoo de suivre une trajectoire
13 J.Mbendé, le 24/11/98 (IUP Management des Achats, Grenoble)

30
d’apprentissage technologique, mais celle-ci ne pouvait donner lieu à une stratégie autonome de conception de nouveaux modèles et de redéploiement international tant que Daewoo restait sous la dépendance de GM. C’est pourquoi Daewoo a réellement commencé à suivre sa propre trajectoire d’internationalisation corrélativement à une reconquête de son marché domestique à partir de 1993, après sa rupture avec GM14.
D’après l’expérience des alliances stratégiques dans le secteur automobile, l’environnement global de l’entreprise contribue également au succès ou à l’échec des alliances ; en effet le manque d'harmonisation des régimes législatifs, monétaires et tarifaires propres à chaque pays, fait encourir aux entreprises des risques économiques difficiles à anticiper (fluctuations des taux de change, instabilité des bourses et des systèmes financiers).
De même on ne doit pas sous-estimer les difficultés liées à l'évolution des situations politiques, sociales, macro-économiques (taux d'épargne des ménages, distribution des revenus…) des pays où sont implantées les firmes avec lesquelles les accords sont élaborés, tel que le montre l'accord passé entre le gouvernement soviétique et Fiat.
14 Lydie LAIGLE, Stratégies et trajectoires d’internationalisation des firmes Asiatiques et européennes, Actes du GERPISA n° 22, pp 3-5.

31
2ère PARTIE :
IMPACT DES ALLIANCES ET DU PARTENARIAT SUR LE COMMERCE
A – Impact sur le commerce: Les travaux empiriques montrent que jusqu’au milieu des années 80, c’est le commerce international qui a généré des investissements directs. Après cette période, la causalité semble s’inverser et l’investissement direct exerce une influence majeure sur les échanges. Plus spécialement, les données montrent que les investissements directs à l’étranger stimulent l’accroissement des exportations des pays d’origine (pays investisseurs) et par conséquent, ils sont complémentaires aux échanges. Une analyse menée sur un agrégat de 14 pays a permis de constater que chaque dollar investi à l’étranger produit environ 2 US$ d’exportations supplémentaires.
En revanche, dans les pays d’accueil, le plus souvent, les investissements étrangers à court terme tendent à accroître les importations alors que l’accroissement des exportations ne se manifeste qu’à plus long terme. Toutefois, à court terme, les pays d’accueil tirent de nombreux bénéfices des investissements étrangers (transferts technologiques, création d’emplois, sous-traitance locale, etc)15. Du point de vue du pays investisseur : l’IDE peut être considéré comme se substituant aux échanges, dans la mesure où les exportations sont remplacées par des ventes locales sur les marchés étrangers, 15 Lionel Fontagné, l'investissement étranger direct et le commerce international: sont-ils complementaires ou substituables ? documents de travail de la DSTI, OCDE 1999/3.

32
particulièrement sous forme de produits finis. Cet état de choses peut être préjudiciable à l’industrie du pays investisseur, en diminuant son niveau de production et d’emploi. D’un autre côté, l’IDE et les échanges peuvent être considérés comme complémentaires, dans la mesure où les investissements à l’étranger renforcent la compétitivité sur les marchés étrangers, et accroissent les échanges de biens intermédiaires (intrants) et de produits finis vers la filiale. Ce type de liens serait bénéfique pour les exportations du pays investisseur et donc pour son industrie. - Pour les pays d’accueil, le lien entre l’IDE et les échanges peut être considéré comme symétrique de celui observé dans le pays investisseur. Les ventes locales et les achats locaux effectués par les filiales étrangères remplacent les importations en provenance du pays investisseur et améliorent de ce fait la situation de la balance courante, la production intérieure et le niveau de l’emploi. Si l’IDE aboutit à l’importation d’intrants, il peut en résulter un affaiblissement de la balance courante du pays d’accueil, conclusion qui est validée par certaines études. C’est ainsi que la progression de 28 % en 1997 des investissements étrangers dans les Caraïbes et en Amérique latine, principalement au Brésil et au Mexique, a entraîné une détérioration de la balance courante dans toute la région. L’impact des alliances et des investissements y afférents débouchent en général sur les effets suivants :
Les sorties d’IDE entraînent des importations en cas d’intégration verticale en amont et/ou de délocalisations à l’étranger d’activités à forte intensité de main-d’oeuvre en provenance de pays intensifs en capital.

33
Les entrées d’IDE donnent lieu à des exportations si les entreprises étrangères s’implantent dans le pays d’accueil pour réexporter chez elles ou pour approvisionner un marché régional.
Les sorties d’IDE entraînent des exportations si la compétitivité sur les marchés étrangers s’améliore ou suscitent une baisse des exportations dans le cas inverse.
Les entrées d’IDE donnent lieu à des importations si la compétitivité des entreprises étrangères sur le marché intérieur s’améliore mais peuvent donner lieu à des exportations lorsque le pays d’accueil améliore sa compétitivité.
1- Impact sur les importations:
En général, l'incidence de l'IDE (fusions et acquisitions en particulier) sur la balance des paiements du pays d'accueil s'exerce surtout à travers les flux commerciaux qui lui sont liés. Mis à part le cas d'un pays totalement fermé, tout IDE entraîne une certaine augmentation des importations, ne serait-ce que grâce à ses effets sur le niveau de l'activité économique nationale. Le plus souvent, l'IDE lui-même crée une nouvelle source de demande d'importations, tout comme les entreprises nationales qui se développent autour des activités des filiales étrangères.16 Un projet d'IDE entièrement nouveau dans un pays en développement nécessitera sans doute un apport initial 16 D’après la CNUCED même si le recours aux fournisseurs nationaux s'accroît, il peut y avoir une augmentation des importations pour satisfaire la demande provenant des fournisseurs de composants nationaux. Voir World Investment Report, 1997, citant le Centre sur les sociétés transnationales de l'ONU (1981).

34
de machines et d'outillage ainsi que de biens et services intermédiaires importés. Passé la phase d'établissement, bon nombre de facteurs semblent intervenir pour déterminer dans quelle mesure une filiale étrangère continuera à importer des biens et services. Ces facteurs sont notamment le secteur ou la branche de production de l'économie du pays d'accueil dans lesquels opère l'IDE (l'IDE dans l'agriculture, le secteur minier et de nombreux secteurs de services, par exemple, tend à avoir un coefficient d'importation globalement moindre que l'IDE dans le secteur manufacturier) et l'âge du projet (quand un projet atteint la maturité, les filiales étrangères tendent à devenir moins tributaires des intrants importés, car les fournisseurs de composants et les sous-traitants nationaux se développent). La CNUCED cite une étude où l'on constate, à partir d'une enquête réalisée en 1995 sur 18 des plus grandes filiales étrangères appartenant aux secteurs de l'électricité et de l'électronique en Malaisie, que la valeur des matières et composants importés a représenté 78 % du total des intrants, ce qui est beaucoup plus que la moyenne pour l'ensemble des industries manufacturières.17 Toutefois, comme le fait ensuite observer la CNUCED, il s'agit d'un secteur mondial et très compétitif, qui dépend d'intrants spécialisés répondant à des normes de qualité précises, et elle cite des études où l'on constate des signes encourageants de filiales étrangères établissant des liaisons en amont et remplaçant les intrants importés par des produits
17 Ariff, Mohamed et Yew Siew Yong (1996), "Transnational corporations and industrial restructuring in developing countries: the case of Malaysia" (Kuala Lumpur: University of Malaysia), polycopié, cité dans CNUCED (1997), op. cit.

35
nationaux.18 La CNUCED indique, en comparaison, que l'IDE dans les industries extractives malaisiennes nécessite relativement moins d'intrants importés et produit une valeur ajoutée nationale plus élevée par unité de production.19 Dans l'étude mentionnée plus haut, la CNUCED a indiqué que, pour la Thaïlande, "une analyse décomposée de la forte croissance de la part des importations dans le PIB, qui est passée de 25 % en 1985 à 40 % en 1991, montre qu'elle était due en grande partie à une plus forte dépendance à l'égard des importations, liée au rôle grandissant de l'IDE. Les investisseurs étrangers ont importé 90 % des machines et outillage et 50 % des matières premières nécessaires à leurs projets. Plusieurs études tendent à montrer que les besoins d'importation des filiales étrangères par unité de production tendent à baisser au fil du temps avec l'augmentation de l'approvisionnement local. McAleese et McDonald ont constaté qu'il en avait été ainsi en Irlande durant la période 1952-1974, ORR l'a constaté pour les filiales japonaises aux États-Unis durant la période 1967-1989, et FRY l'a confirmé pour les pays d'accueil de la région Asie-Pacifique durant les années 80.20 La CNUCED a constaté que les achats locaux des filiales japonaises en Asie étaient passés de 27 % des achats totaux en 1981 à 44 % en 1988, pou revenir à 34% 18 Athukorala, Premachandra et Jayant Menon (1995), "Developing with foreign investment: Malaysia", The Australian Economic Review, 1er
trimestre, pages 9 à 22; et Sivalingham, M. et Siew-Peng Yong (1993), "TNCs and industrialization in Malaysia: organisational behaviour and local and regional impacts", Regional Development Dialogue, 14, 4 (hiver), pages 40 à 64, cité dans CNUCED (1997), op. cit., page 91. 19 La CNUCED cite Sivalingham et Yong (1993), op. cit., qui ont constaté que, dans le secteur de l'exploitation des ressources en Malaisie, la teneur de l'IDE en intrants d'origine nationale a été de 76 % en 1983. 20 Orr, James (1991), "The Trade Balancing Effects of Foreign Direct Investment in U.S. Manufacturing", FRBNY Quarterly Review, été, pages 63 à 76; Fry, Maxwell (1993 et 1996), op. cit.

36
durant l'exercice budgétaire 1994.21 En Amérique latine, elle a constaté que cette part avait augmenté régulièrement, passant de 28 % en 1981 à 39 % durant l'exercice budgétaire 1994.22 La Corée du Sud avait fourni au Groupe de travail de l’OMC sur le « commerce et l’investissement » des éléments révélateurs de cette tendance en précisant23: « qu’Au début des années 80, l'effet de stimulation des importations était sensible car les filiales étrangères achetaient des matières premières, des biens de production et des équipements dans les pays d'origine. Toutefois, l'effet de remplacement des importations s'est progressivement renforcé du fait de l'indigénisation des filiales étrangères, contrebalançant ainsi l'effet de stimulation des importations précité ». - L'une des mesures employées pour tenter d'abaisser le coefficient d'importation de l'IDE et donc d'atténuer cet aspect des effets "négatifs" de l'IDE sur la balance des paiements dans les pays d'accueil consiste à demander aux filiales de respecter une certaine proportion d'éléments d'origine nationale.24 - En conclusion, on observe qu’à court terme les effets directs des flux d’IDE sur la balance commerciale ont tendance à être défavorables pour les pays d’accueil25. Là encore, à long terme, l’impact négatif peut disparaître à cause des retombées du progrès technologique et de la croissance. Cette évolution semble d’autant plus 21 CNUCED (1997), op. cit., note 63, page 104. 22 Ibid. 23 OMC, WT/WGTI/W/16. 24 investissement étranger direct et balance des paiements, OMC, wt/wgti/w/95, 2 fevrier 2001. 25 Lionel Fontagné, l'investissement étranger direct et le commerce international: sont-ils complémentaires ou substituables ? documents de travail de la dsti, OCDE 1999/3, p 24.

37
vraisemblable que, comme le signale Drabek (1998), l’effet à court terme est associé à des importations induites de biens intermédiaires et de biens d’équipement qui sont à l’origine d’une bonne part des retombées bénéfiques. Toutefois, le résultat final dépendra de la pertinence des politiques suivies et des autres conditions de l’environnement dans lequel opèrent les entreprises.
Tableau n°3 Les effets sur le commerce des prescriptions de résultats
obligatoires26 Importations
d’intrants par l’unité de
production locale
Importations concurrençant l’unité de production
locale
Exportations de produits finals par l’unité de
production locale
Teneur en produits nationaux
En baisse (En hausse) (En baisse)
Résultats à l’exportation
? (En hausse) En hausse
Équilibrage des échanges
En baisse (En hausse) En hausse
Restrictions à la participation étrangère
? ? ?
Transfert de technologie
? ? ?
Note: Les effets indirects sont mentionnés entre
parenthèses. Le signe d’interrogation signifie que les effets sur le commerce ne sont pas évidents.
Source : OMC 1998.
2. Impact sur les exportations :
26 Effets des incitations à l’investissement et des prescriptions de résultats sur le commerce international, note du secrétariat de l’OMC, document n° WT/WGTI/W/56 30 septembre 1998, p 14.

38
D’après plusieurs rapports et études de plusieurs organisations intergouvernementales, la composition de l'IDE réalisé dans les pays en développement a évolué: après avoir été motivé par la recherche de marchés (souvent pour surmonter des obstacles à l'importation), l'investissement est aujourd'hui motivé davantage par la recherche d'efficience). La préoccupation fondamentale étant désormais d'implanter chaque stade de la production, ou bien l'ouvraison définitive destinée au marché mondial ou à un marché régional, dans le pays où sa réalisation sera la plus rentable grâce à la présence de facteurs de production utiles, ressources naturelles, main-d'œuvre, technologie.27 Les investisseurs étrangers facilitent ainsi directement l'accès des pays d'accueil aux marchés internationaux, cela ne tient pas seulement au fait qu'ils subdivisent la production entre plusieurs pays et en rattachent les différents stades grâce aux courants du commerce international, c'est aussi parce qu'ils disposent de circuits de distribution internationaux pour le produit final et, dans certains cas, de services fournis par leurs filiales étrangères. Les indications fournies montrent que, parce qu'elles connaissent mieux les marchés mondiaux et qu'elles ont accès à des circuits de commercialisation internationaux, les entreprises étrangères s'occupent de commerce international plus que les entreprises nationales.28 De même, les données sur la part des exportations du pays d'accueil qui est imputable aux sociétés étrangères affiliées montrent empiriquement quels effets l'IDE produit directement sur
27 OMC, W/8/Add.1, pages 9-12.
28 OMC, W/8/Add.2, page 27; W/7, paragraphe 58.

39
les résultats à l'exportation du pays d'accueil grâce à l'activité de ces entreprises étrangères.29 Les informations recueillies à partir des rapports soumis par des organisations intergouvernementales au groupe de travail de l’OMC sur «le commerce et l’investissement», montrent que la contribution directe des entreprises multinationales aux résultats à l'exportation enregistrés dans le pays d'accueil n'est pas seulement fonction des exportations réalisées par les filiales étrangères; il y a aussi un apport indirect, en ce sens que ces entreprises étrangères stimulent l'exportation réalisée par d'autres entreprises dans le pays d'accueil. Il en va ainsi parce que les effets d'entraînement constatés grâce aux réseaux de production et de distribution des multinationales qui facilitent l'accès aux marchés internationaux sont favorisés par toute une gamme de dispositifs contractuels intra groupe, sous forme, par exemple, d'accords de sous-traitance, d'octroi de licences, d'accords de fractionnement de la production.30 Il est en outre prouvé que la présence de sociétés étrangères affiliées axées sur l'exportation est source de retombées en matière de démonstration et d'information qui tendent à renforcer les capacités d'exportation des entreprises locales dans les pays d'accueil.31 De même, dans la note sur "Les
29 D'après l'une des études réalisées en 1994, les exportations des entreprises étrangères affiliées à capitaux américains représentaient autour de 10 % des exportations totales d'Argentine, du Brésil, du Chili, de l'Indonésie, de la Malaisie et des Philippines, mais, si l'on ajoute d'autres filiales étrangères, la part de ces entreprises étrangères dans les exportations totales de certains pays pourrait être supérieure à 50 %. Dans certains secteurs, comme ceux des composants électroniques et des microprocesseurs, cette part des exportations est parfois supérieure à 90 % (W/26, page 34). D'après une étude de l'IDE en Chine, la part des sociétés étrangères affiliées dans les exportations totales est passée de 17 % en 1991 à 31,3 % en 1995 (OMC, W/8/Add.2, page 25).
30 OMC, W/26, page 35.
31 OMC, W/8/Add.2, page 27.

40
liens entre le commerce et l'investissement étranger direct", le Secrétariat de l’OMC, après avoir passé en revue certaines études concrètes, conclut que l'IDE réalisé dans les pays en développement favorise les exportations de ces pays à la fois directement, du fait des activités d'exportation propres des multinationales, et indirectement, en aplanissant pour les entreprises nationales les obstacles financiers ou les carences en matière d'information qui les empêchaient de commencer à exporter ou de développer leurs exportations.32 Un certain nombre de pays confirment dans les rapports qu’ils ont remis à l’OMC, à partir de leur expérience nationale, les effets positifs, directs et indirects, des entrées d'IDE sur le volume et la structure de leurs exportations.33 L'IDE a parfois été fortement stimulé par la création ou l'extension de certains dispositifs d'intégration économique régionale, lesquels agrandissent le marché "national" et garantissent que le pays d'accueil recherche désormais la stabilité dans ses relations commerciales. Si cette forme d'IDE est souvent motivée principalement par la recherche de marchés, elle favorise néanmoins souvent l'intensification des échanges à l'intérieur de la région une fois que la production s'est restructurée à l'échelle régionale.
32 OMC, W/7, paragraphes 10 et 56-60. (Voir également le document n° 7172 de l’OMC qui fait suite aux observations formulées à la deuxième réunion du groupe de travail sur «le commerce et les investissements» au sujet des conclusions énoncées dans le document W/7 sur les liens entre l'IDE et les résultats à l'exportation.)
33 Voir les communications au sein du comité de l’OMC sur le commerce et l’investissement : du Japon (W/11, pages 2-3), de la Pologne (W/13, page 3), de la Corée (W/16, pages 5-6) et du Costa Rica (W/31, pages 2-3).

41
B/ Investissement de portefeuille et exportations34 D’après l’OMC, les investissements étrangers de portefeuille dans les pays en développement sont en général un phénomène plus récent que les IDE. Ils ont donc fait l'objet de moins de recherches et d'analyses et, pour le moment, il existe peu d'études empiriques à ce sujet. La collecte des données et des statistiques sur les investissements étrangers de portefeuille est également moins avancée et elle pose plus de problèmes conceptuels que la collecte des données et des statistiques sur les IDE.35
1. Impact général : cas des fusions et acquisitions
Selon une enquête de la CNUCED par exemple, les données de la balance des paiements pour la période 1990-1997 montrent que, pour les deux tiers d'un échantillon de 30 pays en développement et économies en transition, les IDE étaient en moyenne plus importants que les investissements étrangers de portefeuille.36 34 les IDE et les investissements étrangers de portefeuille sont généralement le fait de deux types d'investisseurs différents, qui n'ont ni les mêmes motivations ni les mêmes anticipations quant aux avantages de leur investissement. D'une manière générale, les IDE sont effectués par des entreprises engagées dans la production de biens et services qui sont motivées par le désir de développer leurs activités commerciales. Les investisseurs de portefeuille sont soit des institutions financières, des investisseurs institutionnels (tels que les fonds de pension, les compagnies d'assurances ou les fonds de placement) ou des particuliers qui sont motivés par le rendement financier de leur investissement (plus-values ou dividendes) et qui ne prévoient aucunement au départ d'avoir un intérêt durable dans l'entreprise ou d'intervenir directement dans sa gestion. 35 La récente Réunion d'experts de la CNUCED sur les flux d'investissement de portefeuille conclut entre autres: "étant donné l'importance IEP, les pays devraient redoubler d'efforts pour établir des statistiques précises de ces flux aux fins d'analyse et pour l'orientation de l'action gouvernementale" (TD/B/COM.2/EM.6/L.1, paragraphe 2). 36 Ibid, page 8.

42
D’après certaines études empiriques, les entreprises ayant fait l'objet d'une fusion ou d'une acquisition voient, au mieux, leur rentabilité rester la même à court terme. En effet, le ratio des bénéfices aux ventes n'est pas immédiatement sensible à une prise de contrôle. Toutefois, l'intensité des dépenses de R-D subit l'influence positive d'une prise de contrôle.
la rentabilité à court terme des entreprises n'est pas touchée positivement lors d'une prise de contrôle par des intérêts étrangers. En effet, le ratio des bénéfices aux ventes diminue fortement immédiatement après la prise de contrôle.
les entreprises ayant fait l'objet d'une prise de contrôle semblaient intensifier leurs activités d'investissement en capital physique ou en R-D.37
Tableau n°4
Principaux flux nets de ressources à long terme vers les pays en développement, 1991-2000
(milliards de dollars)
1991 1992 1993 1994 1995 1996 1997 1998 1999 2000
Total 123,0 155,8 220,4 223,7 261,2 311,2 342,6 334,9 264,5 295,8
dont:
Flux privés 62,1 99,3 166,8 175,7 206,1 279,3 299,8 280,3 219,2 257,2
dont:
IDE 35,7 47,1 66,6 90,0 107,0 131,5 172,6 176,8 185,4 178,0
IEP 18,5 25,2 87,6 73,4 66,9 111,7 79,2 56,5 59,9 78,1
(Participations) (7,6) (14,1) (51,0) (35,2) (36,1) (49,2) (30,2) (15,6) (34,5) (47,9)
(Obligations) (10,9) (11,1) (36,6) (38,2) (30,8) (62,5) (49,0) (40,9) (25,4) (30,3)
Prêts bancaires 5,0 16,2 3,4 8,7 30,5 33,7 45,2 50,0 24,6 0,7
Source: Banque mondiale, Financement du développement
dans le monde 2001, tableau 2&3.
37 L'impact économique des activités de fusion et d'acquisition sur les entreprises Gilles Mcdougall, Direction de l'analyse de la politique microéconomique, Industrie Canada .Document de travail n 4 , Février 1995.

43
La Banque mondiale par exemple tend à montrer que les activités de fusions et acquisitions effectuées dans les pays en développement dans les années 90 ont ouvert de nouvelles possibilités car elles intervenaient dans de nouvelles branches d'activité qui produisent des biens et services non échangeables, contrairement aux IDE entièrement nouveaux qui concernaient en grande partie le secteur manufacturier.38 D'après la Banque mondiale, la moitié environ des fusions et acquisitions effectuées en Asie de l'Est au cours des dernières années intéressaient les secteurs non exportateurs, tels que le commerce de gros et de détail, l'immobilier et le secteur financier, et elles portaient en particulier sur la recapitalisation de l'industrie bancaire après la crise financière. De prime abord, on pourrait donc conclure que les investissements étrangers sous forme de fusions et acquisitions sont moins axés sur l'exportation que les IDE. En tout état de cause, une fois que l'entreprise aura passé sous le contrôle des investisseurs étrangers, ce sont ces derniers qui décideront si elle restera ou non dans le secteur des biens non échangeables de l'économie.
38 Banque mondiale, Financement du développement dans le monde 2001 (Washington D.C.), page 36.
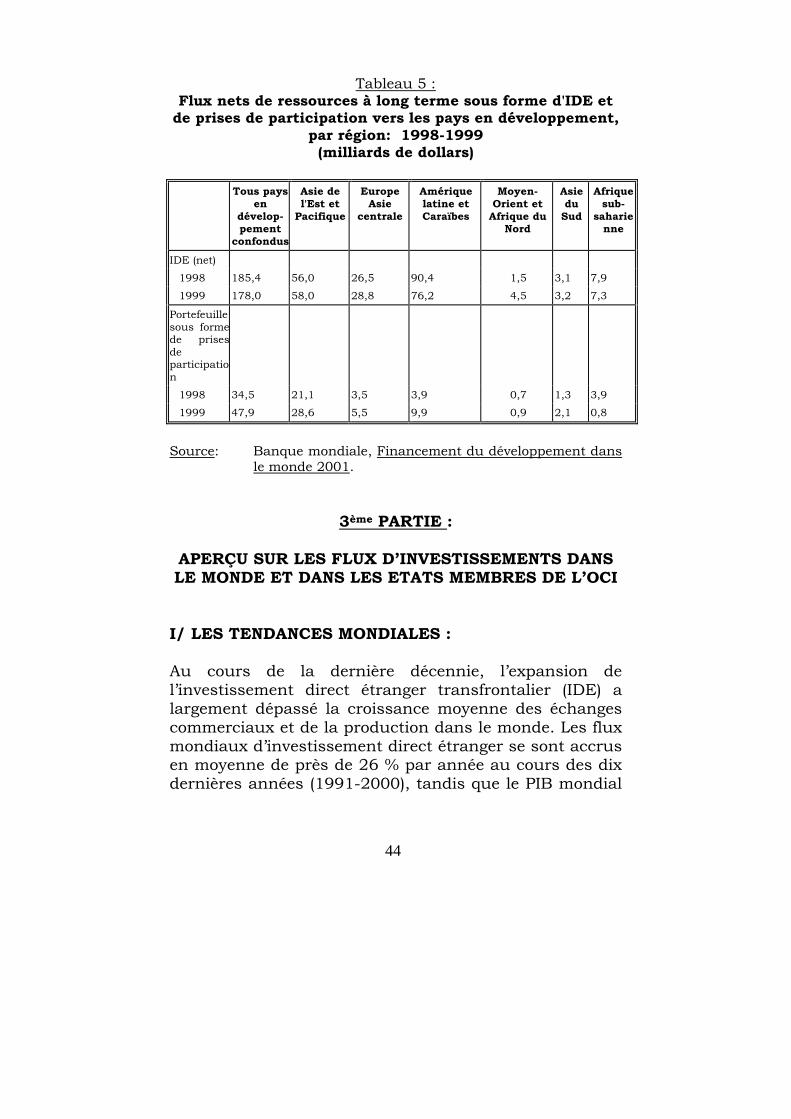
44
Tableau 5 : Flux nets de ressources à long terme sous forme d'IDE et
de prises de participation vers les pays en développement, par région: 1998-1999 (milliards de dollars)
Tous pays
en dévelop- pement
confondus
Asie de l'Est et
Pacifique
Europe Asie
centrale
Amérique latine et Caraïbes
Moyen-Orient et
Afrique du Nord
Asie du Sud
Afrique sub-
saharienne
IDE (net)
1998 185,4 56,0 26,5 90,4 1,5 3,1 7,9
1999 178,0 58,0 28,8 76,2 4,5 3,2 7,3
Portefeuille sous formede prisesde participation
1998 34,5 21,1 3,5 3,9 0,7 1,3 3,9
1999 47,9 28,6 5,5 9,9 0,9 2,1 0,8
Source: Banque mondiale, Financement du développement dans
le monde 2001.
3ème PARTIE :
APERÇU SUR LES FLUX D’INVESTISSEMENTS DANS LE MONDE ET DANS LES ETATS MEMBRES DE L’OCI
I/ LES TENDANCES MONDIALES :
Au cours de la dernière décennie, l’expansion de l’investissement direct étranger transfrontalier (IDE) a largement dépassé la croissance moyenne des échanges commerciaux et de la production dans le monde. Les flux mondiaux d’investissement direct étranger se sont accrus en moyenne de près de 26 % par année au cours des dix dernières années (1991-2000), tandis que le PIB mondial

45
a augmenté de 4 % et le commerce, de 7 % en moyenne. Autrefois, l’IDE servait à contourner les barrières commerciales, à accéder à des marchés étrangers et à profiter de la main-d’œuvre à bon marché et des mesures d’incitation gouvernementales. Même si ces facteurs jouent encore un certain rôle, les décisions en matière d’IDE visent davantage désormais à exploiter au maximum l’avantage concurrentiel d’une entreprise en établissant la production là où elle est la plus efficiente.
Les flux mondiaux d'IDE ont atteint un montant record de 1150 Md$ en 2000 après avoir atteint 865 Md$ en 1999. Le rythme de croissance de + 27 %, bien que plus faible qu'en 1998 (+ 40 %), reste exceptionnel.
- Les fusions et acquisitions transfrontalières principal facteur qui explique les augmentations récentes de l’IDE
Les fusions et acquisitions transfrontalières (F & A) sont le principal facteur qui explique les augmentations récentes de l’IDE. La capacité excédentaire d’un grand nombre d’industries dans le monde, et la nécessité qui en découle de rationaliser la production et de réduire les coûts, contribuent à la multiplication des fusions-acquisitions (F&A) transfrontalières. En effet il est beaucoup plus facile pour une société multinationale d’acheter des éléments d’actif existants que d’investir dans la construction de nouvelles infrastructures ou usines de fabrication.
Les F & A transfrontalières sont passées de moins de 75 milliards de USD en 1987 à 1.140 milliards de USD en 2000. La valeur monétaire des F&A internationales a augmenté de 49,3% en 2000. Mais les F&A dans le monde ont plafonné au début de 2000 et déclinent depuis. Les F&A internationales ont représenté 90% des

46
flux d’IDE dans le monde en 2000, comparativement à 50% seulement en 1991.39
La croissance économique stable des pays industrialisés et la reprise sur les marchés émergents sont également stimulant de l’IDE à long terme. La privatisation des entreprises d’État stimule les mouvements de capitaux étrangers vers de nombreuses économies en développement ou en transition, bien que les flux liés à la privatisation sur certains marchés (comme l’Amérique latine) se soient ralentis l’an dernier. En outre, la libéralisation en cours élimine les obstacles à l’investissement transfrontalier. La libéralisation et la privatisation favorisent tout particulièrement l’investissement transfrontalier dans les télécommunications et les services financiers (services bancaires et assurance). Prédominance des pays industrialisés
Les pays industrialisés sont à l'origine de 91,5 % des sorties d'IDE et détiennent 90% des stocks mondiaux ; ils ont également accueilli 73,5% des entrées d’IDE et détiennent 68% des stocks mondiaux. - L’Europe occidentale est largement en tête des
pourvoyeurs d’IDE en 1999 avec 65% des sorties d’IDE, elle est suivie par les Pays de l’ALENA avec 21%, l’Asie avec 8,3 %, l’Amérique latine avec 6%, l’Afrique, le Moyen Orient et l’Europe de l’Est détiennent respectivement 0,5% et 0,3%.
- S’agissant des entrées d’IDE l’Europe occidentale et
l’ALENA sont à la tête des zones attractives de l’IDE avec 36% des flux chacun, ils sont suivis par l’Asie avec 14% (dont 5% pour la Chine), l’Amérique Latine
39 Moniteur de l’Investissement Direct Etranger, op cit, pp 3-8.

47
avec 10% des flux et puis l’Europe de l’Est, l’Afrique et le Moyen orient avec respectivement 3% et 2%.
Part minoritaire des pays en développement
Les pays en développement ont vu leur poids relatif dans les flux d'IDE baisser légèrement en 1999 ; ainsi, 75 % des flux entrants d'IDE sont à destination des pays développés, contre 71,5 % en 1998.
Plus de la moitié de ces flux (106 Md$ + 9 %) sont à destination de l'Asie, confirmant la fin de la crise, avec toutefois des disparités géographiques. La Chine reste la plus attractive (63,5 Md$ dont 23 Md$ pour Hong Kong) suivie par les Nouveaux Pays industrialisés, à l'exception de la Thaïlande qui voit ses flux diminuer en conservant toutefois un niveau relativement élevé. Enfin, l'Indonésie a accusé des désinvestissements massifs (- 3 Md$ ) en 1999, suite aux instabilités politiques. L'Afrique, avec 1,2 % (10 Md$) des flux d'IDE, reste pour l'essentiel délaissée malgré une hausse de 28 % profitant à l'Angola (investissements pétroliers), à l'Égypte (en réponse à l'importante déréglementation), à l'Afrique du Sud, au Maroc, à la Tunisie et au Nigéria (traditionnellement, le plus important récipiendaire). II/ LES FLUX D’INVESTISSEMENTS DANS LES PAYS MEMBRES DE L’OCI : - Les pays Membres de l’OCI n’ont reçu en 1999 que 0,42% des entrées d’IDE contre 4% des afflux des IDE en 1996 et environ 0,23% des afflux mondiaux d’investissements de portefeuille contre 1% en 1996.
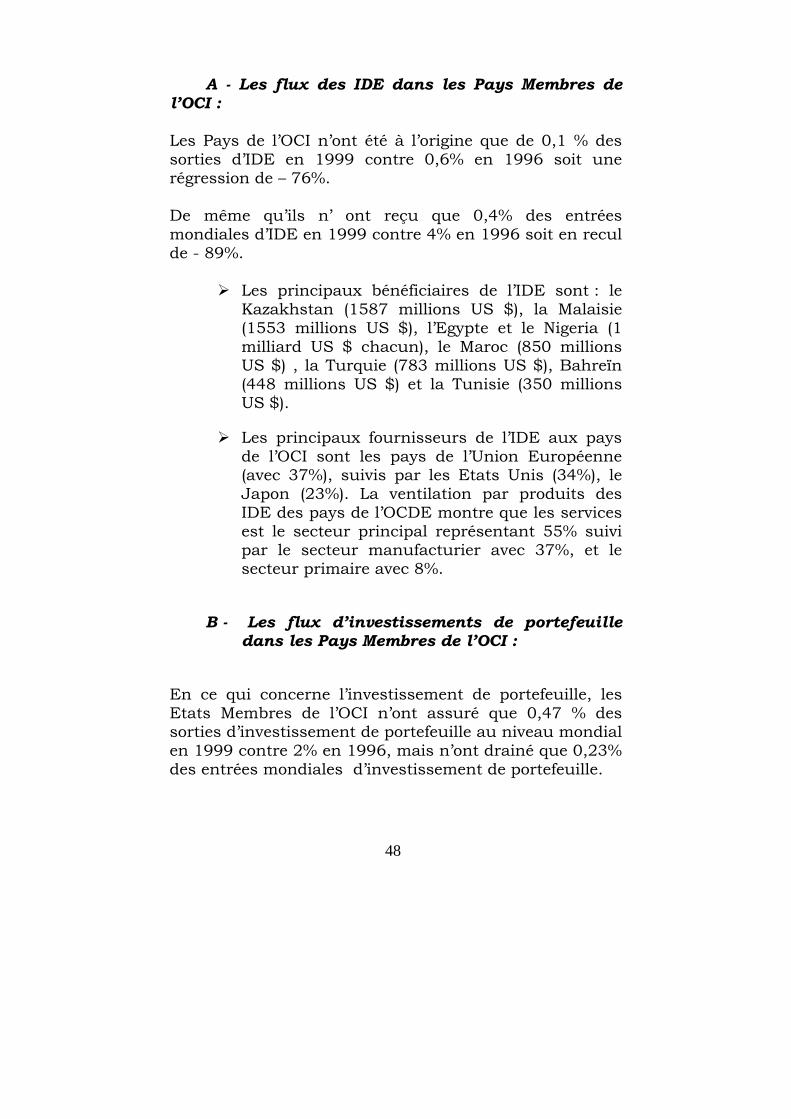
48
A - Les flux des IDE dans les Pays Membres de l’OCI : Les Pays de l’OCI n’ont été à l’origine que de 0,1 % des sorties d’IDE en 1999 contre 0,6% en 1996 soit une régression de – 76%. De même qu’ils n’ ont reçu que 0,4% des entrées mondiales d’IDE en 1999 contre 4% en 1996 soit en recul de - 89%.
Les principaux bénéficiaires de l’IDE sont : le Kazakhstan (1587 millions US $), la Malaisie (1553 millions US $), l’Egypte et le Nigeria (1 milliard US $ chacun), le Maroc (850 millions US $) , la Turquie (783 millions US $), Bahreïn (448 millions US $) et la Tunisie (350 millions US $).
Les principaux fournisseurs de l’IDE aux pays de l’OCI sont les pays de l’Union Européenne (avec 37%), suivis par les Etats Unis (34%), le Japon (23%). La ventilation par produits des IDE des pays de l’OCDE montre que les services est le secteur principal représentant 55% suivi par le secteur manufacturier avec 37%, et le secteur primaire avec 8%.
B - Les flux d’investissements de portefeuille
dans les Pays Membres de l’OCI :
En ce qui concerne l’investissement de portefeuille, les Etats Membres de l’OCI n’ont assuré que 0,47 % des sorties d’investissement de portefeuille au niveau mondial en 1999 contre 2% en 1996, mais n’ont drainé que 0,23% des entrées mondiales d’investissement de portefeuille.

49
Les principaux bénéficiaires d’investissements de portefeuille sont la Turquie avec 4 milliards US$ et la Malaisie avec 800 millions US $.
L’Arabie Saoudite est le principal fournisseur d’investissements de portefeuille parmi les Etats Membres de l’OCI en 1999 avec 11,7 milliards US $.
Concernant les investissements Intra-OCI, on peut noter que malgré l’absence d’informations suffisantes, les flux totaux des IDE sont estimés à environ 4 milliards US$ et les secteurs qui sont principalement visés sont les services avec 48%, le secteurs manufacturier avec 44%, et le secteur agricole avec 8%. A ce propos, il faudrait signaler qu’il n’y a guère de différence entre le modèle de l’IDE de l’OCDE et l’IDE Intra-OCI.
- Les obstacles à l’investissement entre les pays de l’OCI sont très connus. Ils sont liés à la taille réduite des marchés nationaux, à la part de marché peu élevée, à l’absence de transparence et de stabilité des politiques et réglementations sur les investissements, au manque d’infrastructure et au coût élevé de certains facteurs de production, à l’instabilité économique et politique, à l’absence d’activités promotionnelles et d’informations sur les opportunités d’investissement.

50
Tableau n°6
Investissements Directs Etrangers dans les Etats Membres de l’OCI en 1999 (en millions de US $)
Pays
SORTIES D’IDE
ENTREES D’IDE
Solde
Azerbaïdjan 510 510 Indonésie -72 -2745 -2673 Malaisie 1553 1553 Nigeria 1005 1005 Arabie Saoudite -2163 -2163 Turquie -645 783 1428 Egypte -38 1065 1103 Kazakhstan -4 1587 1591 Maroc -18 850 868 Tunisie -3 350 353 Ouganda 222 222 Libye -226 -128 98 Albanie 41 41 Syrie 263 -263 Oman 60 60 Bahreïn -163 448 611 Guinée 63 63 Jordanie -5 158 163 Bangladesh 179 179 Maldives 12 12 Soudan 371 371 Koweït -283 72 355 TOTAL OCI -1194 3783 4977 TOTAL Mondial -846897 911192 1758089 Part des Pays OCI dans le total mondial
0,14 0,42
Source : Balance of Payments Statistics FMI, 2000
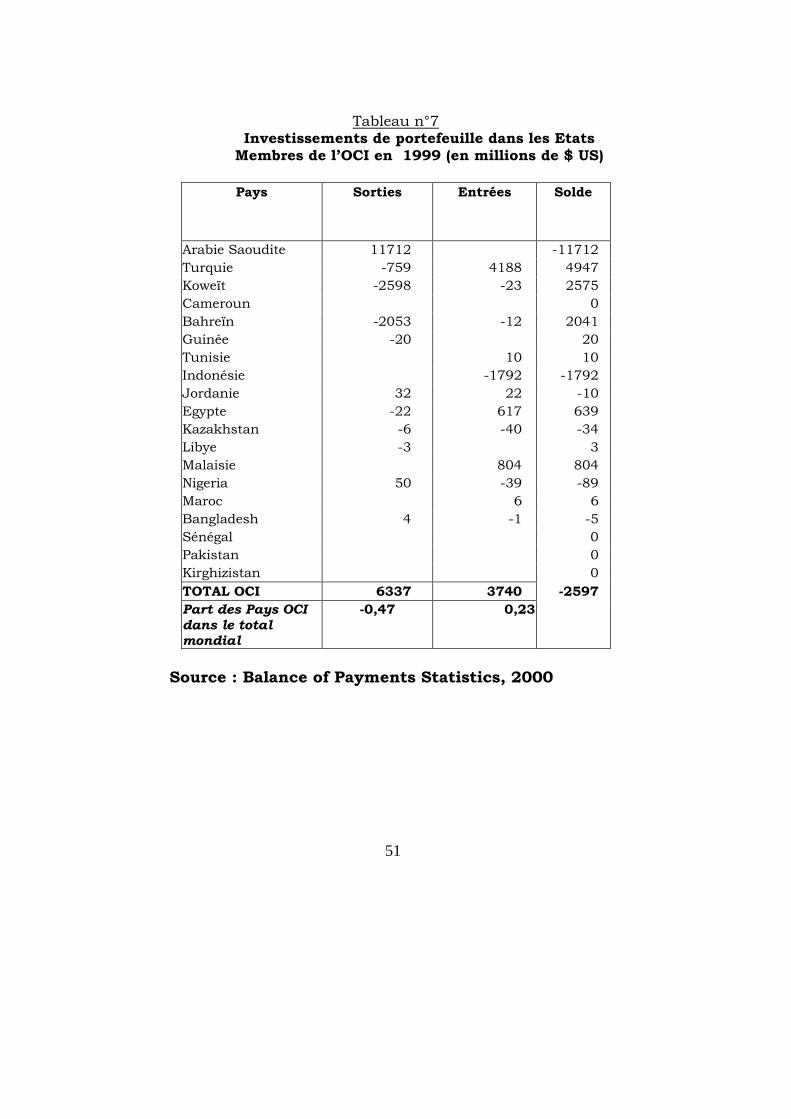
51
Tableau n°7 Investissements de portefeuille dans les Etats
Membres de l’OCI en 1999 (en millions de $ US)
Pays
Sorties Entrées Solde
Arabie Saoudite 11712 -11712 Turquie -759 4188 4947 Koweït -2598 -23 2575 Cameroun 0 Bahreïn -2053 -12 2041 Guinée -20 20 Tunisie 10 10 Indonésie -1792 -1792 Jordanie 32 22 -10 Egypte -22 617 639 Kazakhstan -6 -40 -34 Libye -3 3 Malaisie 804 804 Nigeria 50 -39 -89 Maroc 6 6 Bangladesh 4 -1 -5 Sénégal 0 Pakistan 0 Kirghizistan 0 TOTAL OCI 6337 3740 -2597 Part des Pays OCI dans le total mondial
-0,47 0,23
Source : Balance of Payments Statistics, 2000
52
4ème PARTIE :
ENSEIGNEMENTS DES EXPERIENCES PILOTES DANS LES ETATS MEMBRES DE L’OCI ET DANS LES AUTRES PED EN MATIERE DE PROMOTION DU PARTENARIAT ET DES INVESTISSEMENTS40.
Pour promouvoir les groupements , les réseaux et le partenariat, il faut encourager la concurrence et la coopération interentreprises, créer des conditions favorables à l'implantation d'entreprises et aider les entreprises à tirer le meilleur parti d'un environnement hautement concurrentiel - à terme, transformer en systèmes intégrés d'entreprises. Un certain nombre de conclusions peuvent être tirées des exemples de meilleures pratiques :
1- En général l'action doit porter non pas sur des entreprises prises isolément, mais sur un réseau d'entreprises. Assurer des services "collectifs" présente deux grands avantages : i) coûts de transaction plus faibles que dans le cas d'une aide individualisée; ii) établissement de relations interentreprises, qui favorisent un accroissement de l'efficacité individuelle et une
40 Ces enseignements sont tirés de deux rapports de la CNUCED qui sont basés sur des études de cas : 11 cas pour le 1er rapport et 26 cas pour le second, dont six Etats Membres de l’OCI (Burkina Faso, Indonésie, Malaisie, Nigeria, Pakistan, Ouganda) : - Promotion et soutien des groupements et réseaux de PME pour le développement, Document thématique établi par le secrétariat de la CNUCED TD/B/COM.3/EM.5/26 juin 1998. - Amélioration de la compétitivité des PME par l’établissement de liens, document de base établi par le secrétariat de la CNUCED, document soumis à la Réunion d'experts sur les relations entre les PME et les sociétés transnationales en vue de promouvoir la compétitivité des PME. TD/B/COM.3/EM.11/ 27 septembre 2000.

53
optimisation du potentiel du groupe à travers un processus d'apprentissage réciproque. La compétitivité étant non pas un objectif statique, mais découlant au contraire de la capacité d'acquérir et de conserver une position de force sur le marché, les entreprises devraient être encouragées à progresser continuellement de façon autonome et à devenir de moins en moins dépendantes d'un appui extérieur, acquérant ainsi une capacité "cumulative" d'amélioration. En outre, les interventions devraient davantage répondre aux besoins exprimés ("orientation client") que viser à fournir un ensemble de services génériques (formation, crédit, matières premières, technologie). En particulier, la formation d'un réseau devrait être motivée par la volonté de desservir un marché précis, et les groupements d'entreprises devraient être encouragés à conquérir des créneaux de marché et à soutenir la concurrence en termes de qualité, de conception, de rapidité d'innovation et de rapidité de réaction à l'évolution des besoins de la clientèle. L'innovation en matière de produits devrait en permanence s'appuyer sur les résultats d'enquêtes auprès des utilisateurs et des clients; De nombreux exemples montrent comment en partageant des crédits et des commandes, ou encore l'utilisation de machines modernes, en réalisant des essais communs en laboratoire et en se soumettant à des processus de certification du contrôle de la qualité, ou en participant conjointement à des programmes de formation, à des ateliers de sensibilisation (sur des sujets tels que la qualité, la flexibilité ou l'efficacité) ou à des foires commerciales, les entreprises peuvent établir un dialogue entre elles et les chefs d'entreprise nouer des relations de confiance et de réciprocité.
54
2- Une nette priorité devrait être accordée à la fourniture directe de services novateurs, à valeur ajoutée, car il est peu probable que de petites entreprises veuillent financer des services portant sur des besoins encore latents, ou dont la rentabilité n'apparaîtra qu'à moyen terme. En principe, l'appui aux PME devrait être assuré par le secteur privé. Le secteur public ne devrait intervenir que dans le cas d'un ratio coûts avantages initialement défavorable ou d'une situation concernant des biens d'intérêt général. En tout état de cause, les mécanismes et les structures devraient être conçus dans une optique commerciale; 3- Le souci du coût et des incidences des interventions conduit à soumettre les projets relatifs à la fourniture de services aux entreprises à certains critères de résultat : rentabilité, viabilité, diffusion, reproductibilité, conception en fonction de la demande, étalonnage concurrentiel (Donor Committee, 1998). Cela concerne plus particulièrement la façon dont les objectifs sont poursuivis et n'implique pas l'abandon d'objectifs sociaux.
Des mesures de soutien isolées (formation, crédit, assistance technologique) ne sont pas suffisantes pour promouvoir le développement des entreprises, que ce soit de l'intérieur ou de l'extérieur des groupements et des réseaux. Les services devraient être intégrés ou regroupés (formation et innovation, information sur les partenariats et le financement, etc.). Ils devraient être assurés de façon intégrée et systémique. 4- Les initiatives doivent être définies et appliquées avec la participation active des principaux groupes d'intérêts locaux publics et privés; d'où la nécessité d'engager des processus de concertation longs et souvent coûteux, avec la participation, directe ou par le biais de

55
leurs associations, des travailleurs et des employeurs. L'évaluation des besoins et la conception des programmes devraient être confiées aux bénéficiaires eux mêmes, au lieu que ceux ci soient cantonnés dans un rôle d'utilisateur final. La définition d'un projet commun et d'alliances stratégiques durables passe fondamentalement par une approche participative. D'une manière générale, les obstacles au changement - d'attitude, de fonction, de répartition du pouvoir - sont beaucoup plus difficiles à surmonter que les problèmes strictement techniques ou technologiques. En outre, des mesures d'innovation "sociale" sont nécessaires pour aider les acteurs locaux à s'adapter à l'évolution des conditions mondiales; Les technopoles, les zones industrielles, les pépinières d'entreprises et les parcs scientifiques se distinguent par des taux élevés d'activité entreprenariale et de création d'entreprises de haute technologie. Ils sont toutefois souvent accusés d'être artificiels et onéreux, et de ne pas contribuer à l'économie locale. L'expérience montre que ces formes planifiées d'enclave créent des liens davantage mondiaux que locaux; l'agglomération d'entreprises donne de meilleurs résultats si elle repose sur des groupements déjà existants, qui contribueront à de nouvelles créations ou à des relocalisations d'entreprises sous l'influence de certains facteurs extérieurs (contraintes environnementales, obsolescence technologique, besoins en communication ou en infrastructure, volonté de s'associer à des consortiums) . 5- Les groupements et réseaux de petites entreprises sont généralement considérés comme l'un des moyens les plus efficaces d'apporter aux PME une assistance technique pour l'amélioration de leurs stratégies en matière de technologie, de gestion et de commercialisation. La tendance actuelle parmi les organismes bilatéraux et multilatéraux est moins de fournir directement des services aux entreprises que de se concentrer sur le
56
développement d'institutions au niveau mésoéconomique et d'organismes intermédiaires.
A. Rôle des pouvoirs publics
L'établissement de liens avec des STN, et leurs retombées, dépendent d'un environnement commercial favorable se caractérisant par :
L'existence d'un cadre juridique, réglementaire et fiscal approprié;
Un réservoir de main-d'œuvre qualifiée, alimenté en permanence par la mise en œuvre de programmes d'éducation et de formation;
Une infrastructure - en particulier des transports et des télécommunications - bien développée;
Un dialogue continu entre le secteur public et le secteur privé sur les programmes permettant un développement effectif des entreprises;
Des politiques d'investissement ciblées encourageant les STN à nouer des liens avec des fournisseurs.
À cet égard, les pouvoirs publics pourraient aussi prendre toute une série de mesures sélectives d'appui à l'établissement de liens. Les critères de sélection sont, notamment, la compétitivité des secteurs dans lesquels existent des partenaires potentiels, le dynamisme de certaines PME dans les secteurs en question et leur capacité de se spécialiser dans des activités complémentaires de celles des STN. Cette sélection dynamique de partenaires ne doit pas se limiter aux PME locales : des critères tout aussi rigoureux - quoique différents – pourraient être utilisés pour identifier les STN partenaires, autrement dit, les STN qui, de l'avis des pouvoirs publics, peuvent influer favorablement sur le développement; il s'agirait par exemple de savoir si

57
l'entreprise met en œuvre des stratégies de développement ou si elle peut vraisemblablement contribuer à la réalisation des objectifs fixés par les pouvoirs publics. Une fois les investisseurs et les secteurs stratégiques d'entreprises identifiés par les pouvoirs publics, il faut adopter des mesures de soutien pour préparer les entreprises locales à nouer des partenariats. À ce stade, les questions suivantes doivent être posées :
Après l'instauration d'un environnement favorable, quelles autres politiques spécifiques pourrait-on mettre en œuvre pour promouvoir les liens entre STN et l’entreprise locale ?
Quel rôle le dialogue entre le secteur public et le secteur privé joue-t-il dans la formulation des politiques et des programmes de soutien ?
L'intervention de l'État devrait-elle se borner à remédier aux dysfonctionnements du marché dans les domaines de l'information, du travail, du capital et de la technologie ?
B. Rôle du secteur privé
1. Associations professionnelles
Les associations professionnelles ont un rôle clef à jouer dans l'établissement de liens entre STN et entreprises locales ; l'efficacité de leur rôle est en rapport direct avec le niveau du dialogue instauré entre le secteur public et le secteur privé. Elles pourraient, non seulement appuyer et compléter les politiques et les mesures publiques, mais également mieux les adapter aux besoins des entreprises:
En conseillant les gouvernements sur la définition de politiques et de stratégies appropriées;

58
En établissant des réseaux entre fournisseurs, clients, organismes d'aide au développement des entreprises, institutions financières, organismes publics et ONG;
En aidant à présélectionner d'éventuels fournisseurs de STN au moyen de répertoires d'entreprises aussi documentés, précis et pertinents que possible, indiquant les capacités réelles ou potentielles d'entreprises désireuses de nouer des partenariats;
En encourageant les contacts entre STN et entreprises locales au moyen de foires, d'expositions et autres manifestations commerciales, en facilitant la participation à ces manifestations, ou en diffusant des renseignements sur les avantages que présente la création de liens, ainsi que sur les mécanismes de soutien et les programmes publics existants;
En préparant les entreprises à nouer des partenariats, grâce à une assistance institutionnelle pour la modernisation de leurs capacités et la promotion de leur intégration verticale et horizontale.
Les associations professionnelles peuvent également contribuer à atténuer les effets négatifs des partenariats sur la société, par exemple en informant les entreprises locales des risques d'occidentalisation forcée ou de disparition de savoir-faire et de techniques traditionnelles. En outre, des rapports de concurrence non viables entre entreprises locales peuvent être évités par une collaboration étroite avec les associations; ainsi, des mesures peuvent être prises pour décourager des pratiques dommageables en matière de réduction des coûts ou des structures pyramidales de fournisseurs, dont la base est formée par des entreprises locales.

59
2. Sociétés transnationales (STN)
Disposer de fournisseurs compétitifs est bénéfique pour les STN. Pour pouvoir s'appuyer sur un réseau de fournisseurs locaux compétitifs, capables de leur assurer un partenariat à long terme, les STN pourraient mettre en œuvre des stratégies d'entreprise pour : Faciliter l'accès des entreprises locales à leurs
centres d'innovation et à leurs ingénieurs; Former les employés des entreprises locales par des
échanges de techniciens et de cadres qualifiés; Moderniser progressivement les capacités
productives des entreprises locales, des activités de production jusqu'aux capacités technologiques;
Participer à des programmes de "parrainage" et d'encadrement; (stratégie du piggy back)
Informer leurs partenaires locaux des tendances du marché;
Assister financièrement leurs partenaires locaux ou les aider à obtenir des prêts bancaires;
Aider leurs partenaires locaux à trouver de nouveaux débouchés à l'étranger.
C. Rôle de la communauté internationale
Principale source d'emplois, et, partant, de revenus, les entreprises locales (en particulier les PME) sont considérées comme des moteurs de la croissance économique dans les pays en développement. En particulier, dans le contexte de la mondialisation à laquelle de nombreuses sociétés des pays en développement s'efforcent de s'adapter, les entreprises locales sont perçues comme un facteur de dynamisme économique et social. La communauté internationale peut contribuer à un équilibre économique, social et politique équitable :

60
En lançant un dialogue sur les éléments qui, au niveau international, seraient propices à l'établissement de liens durables, équitables et bénéfiques entre les STN et les entreprises locales ;
En mettant au point des modèles internationaux de liens entre STN et entreprises locales ;
grâce à des échanges d'expériences et à la diffusion des meilleures pratiques, avec la participation des parties intéressées - STN, entreprises locales, organismes et institutions d'État, société civile ;
En appuyant les efforts menés aux niveaux national, régional et sous-régional pour promouvoir l'investissement en général ;
En éliminant les obstacles à la croissance des entreprises locales et au développement de leurs exportations - par exemple, règles de concurrence ou normes de qualité ou normes sanitaires discriminatoires;
En renforçant l'appui à la coopération technique pour le développement de l'entreprenariat et le renforcement des capacités institutionnelles.

61
ANNEXES
Flux Entrants et stocks mondiaux d'IDE accueillis en 1998 et 1999 (en Md$)
Flux entrants Stocks accueillis
1998 1999 1998 1999
Pays développés 480,6 71% 636,4 74% 2690,1 67 % 3230,8 68%
Europe de l'Ouest 259,9 38% 315,1 36 % 1545,9 39% 1757,2 37%
Union européenne 248,6 37 % 305,0 35% 1451,1 36% 1652,3 35%
Autres pays de l'Europe de l'Ouest
11,2 2 % 10,0 1% 94,8 2 % 104,8 2%
États-Unis 186,3 27% 275,5 32% 811,7 20% 1087,2 23%
Japon 1,8 <1% 12,7 1 % 26,0 1 % 38,8 1%
Autres pays développés
32,6 5 % 33,1 4 % 306,5 8 % 347,6 7%
Pays en développement
179,4 26% 207,6 24% 1240,9 31 % 1438,4 30%
Afrique 7,5 1 % 8,9 1% 84,4 2 % 93,0 2%
Amérique latine et Caraïbes
73,7 11 % 90,5 10% 404,6 10% 485,6 10%
Europe en développement
1,4 <1% 2,3 <1% 7,5 <1% 9,8 <1%
Asie 96,5 14% 105,7 12% 741,3 18 % 846,7 18%
Asie de l'Ouest 6,2 1 % 6,7 1 % 54,1 1 % 60,8 1%
Asie centrale 3,1 <1 % 2,7 <1 % 13,4 <1 % 16,3 <1%
Sud, Est et Sud-Est asiatique
87,1 13 % 96,1 11 % 673,8 17 % 769,6 16 %
Pacifique 0,2 <1 % 0,2 <1 % 3,1 <1 % 3,3 <1 %
Europe centrale & orientale
20,0 3 % 21,4 2 % 84,1 2 % 102,6 2%
Monde 680,0 100% 865,4 100% 4015,2 100% 4771,9 100%
Source : CNUCED World Investment Report 2000

62
Flux sortants et stocks mondiaux d'IDE détenus en 1998 et 1999
(en Md$)
Flux sortants Stocks détenus
1998 1999 1998 1999
Pays développés 652,0 95 % 731,7 91 % 3649,9 90 % 4276,9 90 %
Europe de l'Ouest 444,7 65 % 533,2 67 % 2135,3 53 % 2574,9 54 %
Union européenne 425,5 62 % 509,8 64 % 1920,4 47% 2336,6 49 %
Autres pays de l'Europe de l'Ouest
19,2 3 % 23,4 3 % 214,9 5 % 238,3 5 %
États-Unis 150,9 22 % 150,9 19 % 980,5 24 % 1131,4 24 %
Japon 0,7 <1% 22,7 3 % 270,0 7 % 292,7 6 %
Autres pays développés
55,7 8 % 24,9 3 % 264,1 6 % 277,9 6 %
Pays en développement
33,0 5 % 65,6 8 % 403,9 10 % 468,7 10 %
Afrique 0,6 <1% 0,9 <1% 16,4 <1% 17,0 <1%
Amérique latine et Caraïbes
9,4 1% 27,4 3 % 77,4 2% 104,6 2%
Europe en développement
0,1 <1% 0,1 <1% 1,6 <1% 1,7 <1%
Asie 22,9 3% 37,2 5% 308,3 8% 345,2 7%
Asie de l'Ouest -4,2 -1% 1,1 <1% 3,7 <1% 4,9 <1%
Asie centrale 0,1 <1% 0,3 <1% 0,1 <1% 0,5 <1%
Sud, Est et Sud-Est asiatique
27,0 4% 35,8 4% 304,5 7% 339,8 7%
Pacifique <0,1 <1% <0,1 <1% 0,2 <1% 0,2 <1%
Europe centrale & orientale
2,1 <1% 2,6 <1% 11,9 <1% 13,7 <1%
Monde 687,1 100% 799,9 100% 4065,7 100% 4759,3 100%
Source : CNUCED World Investment Report 2000
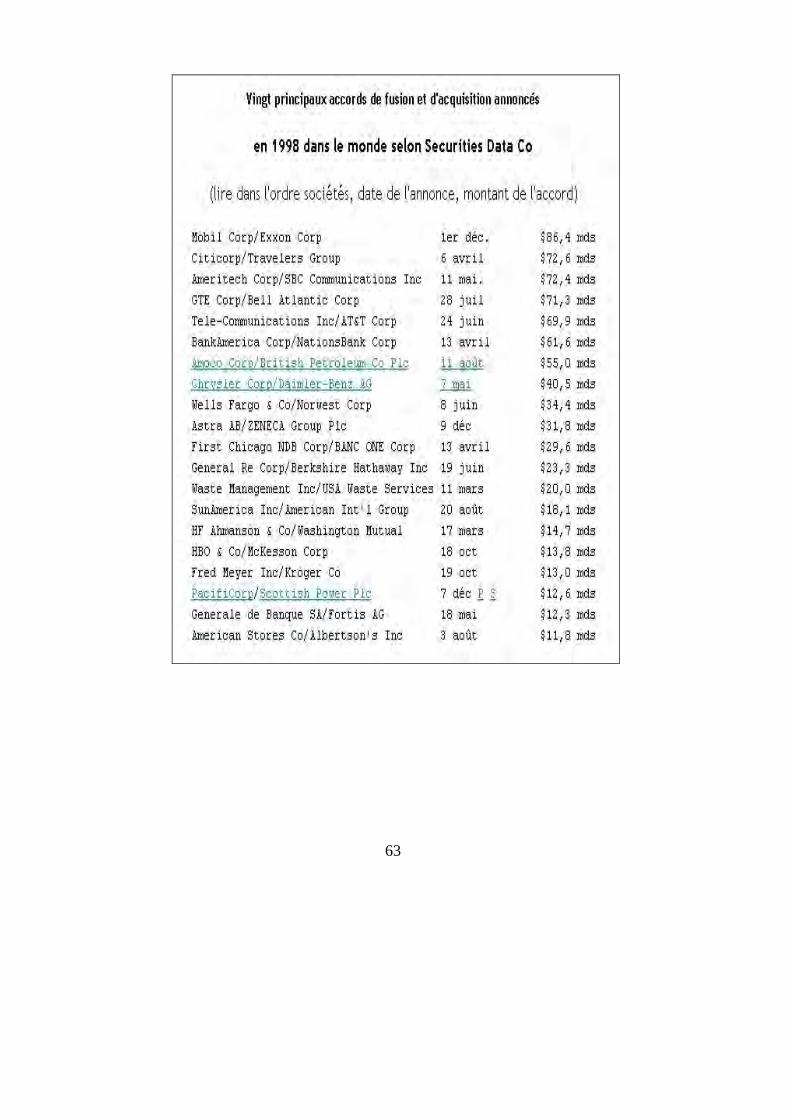
63

64
BIBLIOGRAPHIE
Ariff , D., Bell, M., (1997), “Patterns of subsidiary-parent linkages and technological capability-building inTNC subsidiaries : the electronics industry in Malaysia”, in Jono, K. S., Keller, J. (Eds), Malaysia’sindustrial technology development: Political economy policies and institutes, Oxford, CambridgeUniversity Press. Bradley, Stephen, Richard L., Nolan et Jerry A., Hausman, Globalization, Technology, and Competition : The Fusion of Computers and Telecomunications in the 1990s, Boston, Mass. : Harvard Business School Press, 1993. Buckley, P. J. et Casson, M. « A Theory of Cooperation in International Business », in Contractor, Frank J. et Lorange Peter, (eds), 1988, p. 31-53. Cabon-Dhersin, M.L (2000) “La stabilité des alliances stratégiques en R&D: l’apport de la théorie des jeux”, in Voisin, C A. Plunket et B.Bellon ed. La coopération industrielle, Economica, 2000. Capron, L (1999), “The Long-Term Performance of Horizontal Acquisitions” in Strategic Management Journal, 20: 987-1018. Chesnais F.), « Les accords de coopération techniques entre firmes indépendantes », in STI Revue(OCDE), 4, décembre 1988. Chung S.A, Singh H et Lee, K (2000), “Complementarity, Status similarity and Social Capital As Drivers ofAlliance Formation”, in Strategic Management Journal, 21: 1-22. Contractor F., Lorange P., (1988), “Why should firms cooperate ? The strategy and economics basis for

65
cooperative ventures”, in Contractor, F., Lorange, P., (Eds), Cooperative Strategies in Internaltional Business, Joint Ventures and Technology Partnerships between Firms, Lexinghton Books. Cohen W.M., Levinthal D.A., (1990), “Absorptive Capacity : A New Perspective on Learning and Innovation”, in Administrative Science Quaterly, 35, 128-152. Doz Y.L. (1996), “The evolution of cooperation in strategic alliances : initial conditions or learning processes ?”, in, Strategic Management Journal, Vol. 17, p.55-83. Dussauge, P., « Les alliances stratégiques entre firmes concurrentielles », Revue Française de Gestion, no. 80, sept.-oct. 1990. Ethier, Wilfred. J. and James R. Markusen 1991. “Multinational Firms, Technology Diffusion and Trade,” Journal of International Economics 41: 1-28. Freeman, Christopher et John, Hagedoorn, « Catching Up or Falling Behind : Patterns in International InterfirmTechnology Partnering », World Development, Vol. 22, no 5, p. 771-780. Fernandez, G. et Alain Noël, L’alliance stratégique : Une réponse des PME à la mondialisation, Cahier du CETAI, École des HEC, No 93-19, Montréal, décembre 1993.. Fernandez, Georges, Les alliances stratégiques, Les Cahiers du CETAI, HEC, no ENS 93-01, avril 1993. Hagedoorn, J., (1990), “Organizational modes of inter-firm co-operation and technology transfer”, in Technovation, 10 (1), 17-30.

66
Hagedoorn, John et Jos, Schakenraad, « Inter-firm Partnerships for generic technologies-the case of new materials,Technovation, Vol. 11, no 7, 1991, p. 429-444. Hamel, G., « Competition for Competence and Inter-partner Learning within International Strategic Alliances », Strategic Management Journal, 1991, vol. 12, p. 83-103. Hamel, G Y.L, Doz et C.K Prahalard (1989), "Collaborate with your competitors – and win", Harvard Business Review, 67(1), 133-139. Harrigan K. R., « Joint ventures and Competition Strategy », Strategic Management Journal, Vol. 9, 1988. Horstmann, Ignatius and James R. Markusen 1996. “Exploring New Markets: Direct Investment, Contractual Relations and the Multinational Enterprise,” International Economic Review 37 (1): 1-20. Kogut B., « Joint Ventures : Theorical an Empirical Perspectives », Strategic Management Journal, Vol. 9, 1988, p.319-332. Lorange, P. et J. Roos (1982), Strategic Alliances : formation, evolution and implementation. Basil Blackwell,Londres. Mohamed El-Filali El-Youssefi, sous la direction de Jorge Niosi, Les alliances stratégiques entre les entreprises à l’ère de la mondialisation et du changement de paradigme technologique, Cahiers du CRISES Collection “Working Papers”. Morris, P. et Hergert, M. « Trends in International Collaborative Agreements », Columbia Journal of World Business, summer 1987. Mucchielli P (1991), Alliances stratégiques et firmes multinationales : une nouvelle théoriepour des nouvelles

67
formes de multinationalisation, Revue d'Economie industrielle n°55, Navaretti, B et C.Carraro [1999], « From Learning to Partnership : Multinational R&D Cooperation in Developping Countries », in Economic Innovations and New Technologies, vol.8, 137-73. Ohmae Kenichi, « The Global Logic of Strategic Alliances », Harvard Business Review, Mars-avril, 1989, p. 143-175. Plunket, A. (1999), Evolution de la coopération : contribution à l’étude des déterminants des processus d’évolution et de sélection de la coopération technologique, Thèse de doctorat, Paris Sud. Plunket, A, Voisin C, Bellon B ed. (forthcoming 2001) « Industrial alliances » Edward Elgar, London. Porter M.L. L'avantage concurrentiel des nations, Interéditions, France1993. UNCTAD 1998. World Investment Report: Trends and Determinants. United Nations: New York, NY. UNCTAD 1997. World Investment Report: Transnational Corporations, Market Structure, and UNCTAD 2000. World Investment Report. United Nations: New York, NY. OMC : Divers documents et notes du groupe de travail sur “le commerce et l’investissement”.