Embed Size (px)
Citation preview

JOURNAL OF ECONOMIC DEVELOPMENT 83 Volume 38, Number 1, March 2013
PRIVATE INVESTMENT AND FISCAL POLICY IN PAKISTAN
AFIA MALIK
*
The Pakistan Institute of Development Economics, Pakistan
This paper has examined linear as well as non-linear impact of fiscal policy variables on private investment in Pakistan. The results imply that it’s better to examine different aspects of fiscal policy instead of fiscal policy variables in aggregate form as the impact of fiscal policy variables in aggregate and disaggregate form do not comply with each other. Different categories of expenditures and revenues have different impact on private investment. Secondly, in most of the cases there exists a non-linear relationship, which implies the significance of certain threshold level for the different fiscal policy instruments to encourage private investment. Keywords: Fiscal Policy, Private Investment, Non-Linear Relationship JEL classification: E22, E62
1. INTRODUCTION The importance of private investment for growth and development in the developing
countries is a well-established fact. Private investment is regarded as an essential element in promoting a broad-based and sustained growth that in turn would help in reducing poverty. Equally important is the response of private investment to changes in economic policies (including fiscal policy) of the government.
The economic difficulties faced by many developing countries in the early 1980s (widening current account and balance of payment deficits, rising inflation rates, growing foreign debt burdens, and falling growth rates) forced policy makers to shift development strategies against large-scale government intervention and more towards market for allocating and utilising the resources; along with the increased role of the private sector. Empirical research also has confirmed a much larger role of the private investment in the growth process as compared to the public investment (Reinhart and Khan, 1989).
Since the 1980s the general trend seen in most of the developing countries is the decline in public investment as a result of tightening aggregate demand and increasing
* The valuable comments of an anonymous referee are greatly appreciated. Any error, however, is mine.
AFIA MALIK 84
role of the private sector in capital formation. Furthermore, it is observed that public resources are earmarked for social sectors, that is, for the alleviation of poverty and for the upgrading of social capital and services (Chibber and Dailami, 1991).
On the other hand, there exists strong evidence in the favour of fiscal policy and economic growth relationship in the empirical literature. While in this relationship, private investment is regarded as one of the main channels through which fiscal policy can influence economic growth (Hermes and Lensink, 2001). In endogenous growth models changes in the capital stock can affect the long-run per capita growth rate, either through more investment in quantitative terms or through more efficient investment. Therefore, in these models a positive role of economic policies (fiscal policy included) is assumed in the process of economic growth provided these policies aimed at improving the quantity and/ or the efficiency of capital stock. In these models, it is established that some fiscal policy instruments are good and some are bad for growth.
The role of private sector in the Pakistan’s economy, undoubtedly, is quite significant; not only as a major producer of goods and services, but also as a major contributor in investment, and the largest employer. Its importance can be gauged from the fact that according to one estimate its contribution to total GDP is around 84%. When undocumented informal economy (private sector) is taken into account its contribution to GDP exceeds even further (ADB, 2008). To elaborate it further, in Pakistan’s total investment of 15.2% of GDP in 2008-09 the share of private sector investment is around 88%.
Pakistan has seen an asymmetrical real GDP growth rate pattern throughout its history, ranging from around 10% in 1969-70 to just 1% in 2008-09. When average for different decades is estimated, it indicate that the private sector-friendly 1960s recorded the highest GDP growth rate of around 7% followed by 5%, 6%, 4%, and 5% in the 1970s, 1980s, 1990s and in the 2000s respectively. In the 1970s, Pakistan adopted a policy that allowed for a greater role of the public sector, which resulted in public investment almost twice as much as the private sector. This expansion in the government’s role in investment activity combined with its difficulties in raising revenues or to cut down expenditures, resulted in high overall fiscal deficit in comparison to the size of the economy. Since then this trend in fiscal deficit has continued despite the change in government policies in the 1980s and onwards1.
1 In line with the global trend Pakistan started deregulating its economy in the 1980s. although efforts to
turn around public enterprises was somewhat slow given the aid flows, especially from the USA on which
Pakistani economy had become dependent since the Soviet Union’s invasion of Afghanistan in 1979. By the
end of the 1980s, when Soviet’s were defeated these aid flows reduced substantially and policy makers were
forced to rethink the role of the state and the private sector in the economic sphere. Thus after that all the
unnecessary regulations that were constraining the private sector activities have been removed. The import
policy has been liberalised, investment sanctions have been discontinued, the foreign exchange control has
been considerably eased, and price controls have been removed.

PRIVATE INVESTMENT AND FISCAL POLICY IN PAKISTAN 85
In other words, fiscal deficits have remained high in Pakistan2 essentially because of the government’s failure to mobilize additional resources or to cut down current expenditures. The structural weaknesses in the tax system have led to an inelastic, inefficient, inequitable and unfair tax system. As a result tax to GDP ratio had remained low and stagnant (i.e., in the range of 10 to 12% in the last twenty five years or so). These weaknesses have forced the successive governments to generate resources through surcharges and non-tax revenues.
Moreover, total expenditures as a percentage of GDP (although it has declined since the beginning of the 1990s) are around 22%. Where current expenditures represent about 82% of total expenditures and the remaining 18% are development expenditures. In other words, the structure of expenditures has not been amenable to large cuts3.
In other words, despite its importance the private sector in Pakistan is faced with severe macroeconomic and other institutional challenges. For example, problems associated with rising deficits and inflation major financing gap threatens the fiscal space for public investment required for private sector’s growth. That is, abrupt worsening in fiscal account has diluted the fiscal space required for social sector investment and infrastructure development. In other words, fiscal wastefulness in the absence of corresponding increase in revenues has lead to the reappearance of higher debt burden which in turn has squeezed fiscal space even further because of higher debt service payments. Moreover, increase in government borrowings to finance the deficit has a crowding out effect on private sector, thus a negative impact on the private sector investment.
Moreover, empirical evidence has also suggested that fiscal policy in Pakistan has both direct and indirect effects on private investment. The direct effect would appear to operate by expanding domestic infrastructure through public investment or development expenditures. While more indirect effects are visible via the effects of fiscal policy interest rates. The high fiscal deficits in Pakistan have largely been financed by domestic nonbank borrowing, resulting in increasing ratios of domestic public debt to GDP and to rising interest rates on such debt. Further evidence has indicated that, while relying on this source of finance may have alleviated the inflationary effects of deficits; and it was achieved at the expense of crowding out of private investment and thus implied slowed growth than would otherwise have been observed (Haque and Montiel, 1993).
Therefore, there is a need for fiscal policy restructuring of the taxation system and reprioritising of expenditures to maintain a certain level of public spending required for private sector development. No doubt fiscal policy has occupied a central place in recent policy deliberations in Pakistan given its inability to mobilise resources or to cut down
2 1980-81 was the only exception when fiscal situation improves substantially as a result of improvement
in revenue collection as well as cuts in expenditures. 3 However, massive slippages in current expenditures in the last few years have led to the cut in
development expenditure.

AFIA MALIK 86
expenditures. There is an urgent need to reduce large fiscal deficits but not at the cost of long term economic goals. Therefore, issues relating to the appropriate scope, nature, and conduct of fiscal policy, in the context of both mitigating macroeconomic instability in the short run and fostering growth in the long run have become extremely significant.
In these circumstances it becomes necessary to study various aspects of fiscal policy; especially when there is a dearth of sufficient empirical evidence. There is a need to understand which taxes should be increased and which components of the expenditures should be curtailed to encourage growth prospects in the country. This paper will examine the likely impact of different fiscal policy components on the macroeconomic performance while focusing on private investment rather than on overall economic growth. Majority of the studies in the existing literature have focused on overall growth instead of private investment; and those which have focused on private investment have relied on cross-country data. Therefore this country specific study will be an important contribution in the literature as far as issues in the developing countries are concerned.
This study, to my knowledge is the first endeavour to examine the effect of fiscal policy variables (in disaggregate form) on private investment in Pakistan. The plan of the paper is as follows. Introduction is followed by the theoretical framework and the review of literature. Section three will discuss the methodology and data sources. Section four will report and analyse empirical findings. Section five will conclude the discussion.
2. THEORETICAL FRAMEWORK AND REVIEW OF LITERATURE 2.1. Theoretical Linkages As discussed in the previous section, private investment is regarded as an important
instrument in influencing economic growth. It is cited in Soli et al. (2008) that government activity may increase total output through its interaction with the private sector. It is argued that changes in government expenditures and taxation affect corporate profits and thus private investments. There are five possible channels through which fiscal policy can possibly have an impact on private investment (for details see Ndikumana, 2005; and Chibber and Dailami, 1991).
First, fiscal policy can change private investment through its impact on the volume of savings. It is believed that tight fiscal policy can influence private investment positively via increase in total domestic saving and dipping interest rates. Second, fiscal policy can increase investment by building investors confidence in relation to predictability and credibility of fiscal policy. This requires not only low fiscal deficits but consistent government policies towards fiscal goals. “A firm commitment to stabilization measures and policy reform, even at some short-term costs of lost output, is likely to be more critical in influencing long-term investment decisions than policy fluctuations and stop-go strategies” (Chibber and Dailami, 1991, p. 4).

PRIVATE INVESTMENT AND FISCAL POLICY IN PAKISTAN 87
Third, fiscal policy can have its influences on investment by changing domestic demand. Tight fiscal policy, i.e., reduction in expenditure and/or increase in taxes will have a negative impact on domestic aggregate demand, which in turn will influence sales and profits expectations negatively thus reducing incentives to invest.
Fourth, fiscal policy can directly impact investment through the cost of capital as changed by tax policy. The dependence on tax policy to influence investment decisions has been rare in developing countries given the institutional factors4. In addition, intricacies are involved in the determination of capital income, particularly in inflationary environments. But liberalisation and privatisation programmes undertaken by the developing countries have shifted the focus from direct government intervention to a well-designed corporate tax system considerably.
Finally, fiscal policy can have its impact on private investment via the complementarities or competitiveness between private and public investment. The provision of public services through the public investment expenditures reduces the cost of production of the private sector, thus effecting positively private profitability and investment. Higher aggregate public investment expenditures can also raise demand and increase capacity utilisation in the private sector. On the negative side, public investment expenditures can crowd out the private sector in input and product markets, or in financial markets. For instance, business enterprises in developing countries are mostly dependent on bank loans to finance their investment. The implications of financial crowding out are quite severe as private sector companies are more likely to face strict credit supply constraints from the banking sector as compared to the public sector companies.
Moreover, recent developments in endogenous growth theory have confirmed the long run effects of fiscal policy on economic growth via private investment. Where some taxes distorts investment decisions in the private sector (negative effect), while some have a positive impact. Similarly, some public expenditures are productive, they compliment private investment (positive effect), while others are non-productive expenditures (Gemmell, 2001).
2.2. Review of Empirical Literature As cited in Kneller et al. (1999) endogenous growth models have emphasised the
role of investment in human and physical capital to influence the steady-state growth rate. Accordingly these models have highlighted the possibility for at least some elements of tax and government expenditures to play a role in the growth process. Followed by the ground-breaking contributions of Barro (1990), Barro and Sala-i-
4 For instance, larger role played by the government in the process of capital formation, influence of
public sector enterprises on central government’s budgetary position, and general weaknesses in the
administrative procedures.

AFIA MALIK 88
Martin (1992), and King and Rebelo (1990) many studies in the empirical literature have focused on different aspects of fiscal policy playing an important role in the process of economic growth (see for example, Tanzi and Zee, 1997; Kneller et al., 1999; Easterly and Rebello, 1993; Devarajan et al., 1996; Gemmell, 2001; Gupta et al., 2005; and Perotti, 2004).
Then there is another strand of literature that has specifically studied the impact of fiscal policy on private investment. For instance, Alesina et al. (1999) has investigated the impact of different types of fiscal policy on profits and consequently, on business investment using a panel of OECD countries. They have found a negative effect of public spending, in particular of its public wage component on business investment. Similarly, various types of taxes in their estimated model have a negative effect on profits; but the effect of government spending on investment is larger than the effect of taxes.
Arin (2004) while studying the effect of fiscal policy on economic growth and private investment for G-7 countries has suggested for studying different tax groups separately in empirical studies as different tax groups have different effect on the steady-state growth rate. The findings in this study have proved the negative impact of any increase in income tax revenues on growth rates. Further, the study has highlighted the distortionary effects of government expenditures if the wage bill is included in it. More significantly, the study has proved that government expenditures and income taxes actually impede growth by decreasing private investment.
The attention is also drawn towards the existence of non-linear relationship between different fiscal policy variables and private investment in the empirical literature (Hermes and Lensink, 2001)5. While Soli et al. (2008) has examined the relationship between fiscal policy variables in disaggregated form, private capital investment and economic growth in Ghana, as well as the similarities and differences in the impact of these variables on private investment and economic growth (using cointegration and error correction model). Their findings have indicated that changes in government recurrent expenditure, current government capital expenditure and international trade taxes are significant for growth while changes in tax on domestic goods and services, international trade taxes and income and property taxes matter for private capital investment. Similarly, Chhibber and Wijnbergen (1988) have studied the impact of public policy on private investment in Turkey.
Another line of research has focused only on the spending side of fiscal policy and its impact on private investment. For instance, Karago and Ozdemir (2006) have examined the relationship between government expenditures and private investment for Turkey suggesting government expenditures tends to crowd out private investment. Wang (2005) has investigated the relationship between different government expenditures and private investment in Canada and come up with a positive influence of
5 Empirical study has been done for a sample of thirty three less developed countries.

PRIVATE INVESTMENT AND FISCAL POLICY IN PAKISTAN 89
government expenditure on education and health while negative effect of government expenditure on capital and infrastructure. Laopodis (2001) has explored the implications of military and non-military expenditures on private investment for four emerging European countries - Greece, Ireland, Portugal and Spain while finding a mixed response in the sample countries.
Bahmani-Oskooee (1999) has discussed different schools of thought -Keynsian, Neoclassicals and Ricardian Equivalence approach- with opposite views regarding the impact of budget deficits on private investment. This study has investigated the long-run relationship between US federal real budget deficits and real fixed investment and its findings has supported the Keynesian view that deficits crowds-in real investment. Similarly, Mamatzakis (2000) has explored the possible relationship between private spending and various government expenditures using neo-classical and cash-flow investment model.
Generally the studies on the subject have focussed on cross-country data. There are few exceptions that have analysed the country situation. As far as Pakistan is concerned the research is very limited on this specific issue. Some studies have focussed on the role of public capital in economic growth (Khan and Sasaki, 2001); some have examined the determinants of private investment, but no explicit focus on various aspects of fiscal policy (Rehman et al., 2009; Hyder and Ahmed, 2003; and Sakr, 1993). Looney and Frederiken (1997) have analysed the relationship between public investment and private investment while suggesting selective types of public investment to stimulate private sector activities in Pakistan.
Khan and Iqbal (1991) is the only study that has explicitly examined the impact of fiscal deficits on private sector activities in Pakistan in the light of three theories: conventional crowding out, Keynsian crowding out and the monetary approach to the balance of payments. But the focus in this study is limited to budget deficits only. Similarly, Haque and Monteil (1993) has analysed the causes of high fiscal deficits in Pakistan and the impact of fiscal policy on the economic behaviour (including investment, consumption, output and financial sector) of the country.
So far the impact of disaggregated fiscal policy has not been studied for Pakistan. To my knowledge this study is the first attempt to analyse the (linear as well as non-linear) impact of various aspects of fiscal policy on private investment in Pakistan.
3. METHODOLOGY AND DATA Since the objective in this paper is to assess the impact of fiscal policy on private
investment, fiscal policy is disaggregated into its expenditure and revenue components, as well as fiscal surplus (or deficit). In addition, expenditure and revenue are further disaggregated following Barro and Sala-i-Martin (1992) and Devarajan et al. (1996). That is, expenditure is decomposed into productive expenditure and non-productive expenditure respectively. The productive expenditure is expected to enter into the

AFIA MALIK 90
production function of the private sector, increasing returns to investment and in that way encourage economic growth. The major difference between productive and non-productive expenditure is productive expenditure ends up in the production function of the private sector, while non-productive expenditure only ends up in the utility function (Soli et al., 2008). For Pakistan, the government expenditures that are assumed to fall in the productive category are development (capital) expenditures. On the other hand, non-productive expenditure comprises of spending on the wage and salary bill of the public services and purchases of goods and services by the government. Therefore, current expenditures in Pakistan are assumed to fall in this category.
While on the revenue side, when tax serves as disincentive to saving (investment), it is considered as distortionary and exerts a negative influence on economic growth. However, if the tax encourages savings (investment) it is considered as non-distortionary and exerts a positive influence on economic growth. We will assume income and property taxes (that is, direct taxes) as distortionary and consumption (expenditure based) taxes 6 (that is indirect taxes) as non-distortionary. It is assumed that non-distortionary taxes do not reduce the returns to investment, even though they may affect the labour/leisure choice.
The treatment of development expenditure as productive and current expenditure as non-productive, similarly income and property taxes as distortionary and consumption taxes as non-distortionary is simply a hypothesis in the case of Pakistan which will be tested empirically in the next section.
As expenditures are disaggregated into development expenditure and current expenditure, revenues are disaggregated into direct tax, indirect tax and non-tax revenue7. Non-tax revenues are also assumed to be non-distortionary. Fiscal policy variables are used in different combinations along with the set of control variables to account for possible omitted variable bias. The variables used to counter the omitted variable bias includes: private credit scaled by GDP, real lending rate, debt-GDP ratio and lag of real per capita GDP. The availability of private credit and increase in real per capita GDP are expected to have a positive influence on private investment, while any increase in lending rate is expected to have an adverse impact on private investment. Similarly, increase in debt burden is also expected to be harmful for private investment. For estimation, the model is specified as:
iikk
kijj
ji μFPδXβαPI , (1)
6 Consumption tax is a tax on spending on goods and services. It is a term with a tax base of consumption.
It usually takes the form of sales tax or value added tax. A direct consumption tax is sometimes called an
expenditure tax, a cash-flow tax or consumed income tax. 7 Non-tax revenue has a major share in total revenues in Pakistan, e.g., in 2008-09 its share in total
revenues was almost 25 percent.

PRIVATE INVESTMENT AND FISCAL POLICY IN PAKISTAN 91
where,
iPI private investment scaled by GDP.
jX set of j conditioning variables. It includes:
1X private credit scaled by GDP,
2X log of lagged per capita GDP,
3X real lending rate,
4X debt-GDP ratio.
kFP set of k fiscal policy variables. It includes:
5X development (capital) expenditures scaled by GDP,
6X current expenditures scaled by GDP,
7X direct taxes scaled by GDP,
8X indirect taxes scaled by GDP,
9X non-tax revenue as a percentage of GDP,
10X surplus8 as a percentage of GDP,
iμ the error term.
As far as the coefficients of the fiscal policy variables are concerned they may be
positive or negative, as discussed above. Moreover, besides analysing linear relationship between various fiscal policy variables and private investment, this paper will also examine the non-linear relationship between fiscal policy and private investment. The importance of analysing a non-linear relationship between different fiscal policy variables and private investment is discussed by Hermes and Lensink (2001) in detail. Moreover Barro (1990) has recommended an inverted U-curve relationship between productive government expenditure and economic growth, as the increasing cost of distortionary taxation required for financing spending exceeds the decreasing benefits of productive spending. Similarly, Devarajan et al. (1996) studied the non-linear relation between current and capital expenditure and growth. They developed a model with public investment and consumption expenditure to show the negative impact of public investment on growth if there is excessive investment. Therefore, in this paper the existence of non-linear relationship will be examined by including a quadratic term for fiscal policy variable concerned presuming that government expenditures (current or capital) and/ or revenues (direct taxes, indirect taxes or non-tax revenue) will start to have a negative (or positive) effects on private investment after a certain level.
The study will use time series data spanning 36 years (1972 to 2009). Data sources includes: International Financial Statistics of the IMF, State Bank Annual Reports,
8 Surplus is defined as total revenues minus total expenditures.

AFIA MALIK 92
Pakistan Economic Survey for various years and Federal Board of Revenue Yearbooks.
4. EMPIRICAL FINDINGS
To satisfy the standard econometric theory, first of all stationarity of all variables
have been checked with linear trend and intercept. According to the Augmented Dickey-Fuller (ADF) test all variables have unit roots in the level form except for the real lending rate, capital expenditure, direct tax and surplus, but are stationary in the first difference at the 5 percent level.
After checking for the stationarity, Johansen Maximum Likelihood method is used to test for the cointegration. According to the Johansen cointegration test allowing for a linear deterministic trend in data with intercept and no trend or with intercept and trend, the null hypothesis of one cointegrating relationship between private investment and the right hand side variables (all control variables and fiscal policy variables in different combinations) cannot be rejected at the 5 percent level, because the estimated statistic is greater than the critical value for each equation estimated9. Thus, suggesting that private investment and all explanatory variables have a stable long run relationship. Equation (1) is therefore estimated (with different fiscal policy variables) using Newey-West method to correct for heteroscedasticity. First difference is not used to avoid the potential loss of valuable information and obscure outcomes (Hsing, 2007). Stability tests (CUSUM and CUSUMSQ) are also performed randomly in different combination of variables and in most of the cases the results indicate a stable equation.
4.1. Aggregate and Disaggregate Fiscal Policy variables: Linear Representation
First of all the impact of aggregate fiscal policy on private investment is studied in linear form (Table 1). The coefficient of surplus (defined as total revenues minus total expenditures) is positive and significant, thus indicating that any increase in revenue or any decrease in expenditure would help in boosting private sector investment (Eq. 4). This finding is similar to what Haque and Montiel (1993) have suggested for Pakistan. That is, higher fiscal deficits are largely been financed by domestic non-bank borrowing resulting in increasing ratios of domestic debt to GDP and to rising interest rates on such debt; which may have alleviated the inflationary effects of deficits but at the expense of crowding out of private investment. Further, borrowing may eat-up funds that could otherwise have been available for the private sector. Similar argument is discussed in Carneiro et al. (2005), that is debt-financed deficit prompt the government to absorb additional resources from the private sector; and if the same revenue is consumed in less productive activities than it would be by the private sector, the overall growth effect would be negative.
9 Results are not reported here due to space limitations.

PRIVATE INVESTMENT AND FISCAL POLICY IN PAKISTAN 93
Table 1. Results of Linear Equations: Aggregate Fiscal Policy Variables (Dependent Variable: Private Investment % of GDP)
Eq. 1 Eq. 2 Eq. 3 Eq.4 Constant -82.68
(-8.23) -79.668 (-8.645)
-84.540 (-9.144)
-89.85 (-9.780)
Private Credit 0.235 (1.650)*
0.261 (1.718)*
0.232 (1.667)*
0.239 (1.721)*
Lending rate -0.041 (-1.685)*
-0.040 (-1.533)*
-0.045 (-1.903)**
-0.059 (-2.308)**
L (GDP per capita(-1)) 9.712 (10.770)**
9.424 (11.209)**
9.847 (11.094)**
10.179 (11.206)**
Debt -0.087 (-1.612)*
-0.095 (-1.725)*
-0.082 (-1.738)*
-0.070 (-1.448)*
Total Revenue -0.053 (-0.465)
-0.181 (-2.359)**
Total Expenditure -0.089 (-1.655)*
-0.109 (-2.785)**
Surplus 0.119 (2.317)**
R2 0.91 0.91 0.91 0.91 Adjusted R2 0.90 0.89 0.90 0.89 DW 1.30 1.39 1.28 1.25 Ramsey RESET test p-value 0.000091 0.000063 0.00052 0.00019 BDS test p-value 0.0280 0.0094 0.0336 0.0208
Notes: Value in parentheses is the t-statistics. ** significant at 5% critical level and * significant at 10%
critical level; low Ramsey test p-value as well as BDS test p-value indicate misspecification.
To further investigate this relationship, the impact of total revenue and total
expenditure is studied separately and together. When examined separately (Eq.2 and Eq.3), both variables have negative and significant impact on private investment. Thus, indicating that both variables in aggregate form are harmful for private investment. However, when studied together (Eq.1) although the impact of both variables is negative but the significance of expenditure outweigh the revenue, and this variable becomes insignificant. As far as the control variables are concerned (ratio of private credit to GDP, lending rate, log of lagged GDP per capita and debt GDP ratio), in all the four equations of Table 1, have performed as expected.
To further investigate the negative coefficients of revenue and expenditure, they are disaggregated. As we have discussed in the previous section there may be few sources of revenue that are distortionary but there may also be some non-distortionary elements in the total revenues. Similarly, different expenditures may be productive or non- productive with reference to private investment in Pakistan.

AFIA MALIK 94
First of all total expenditure is disaggregated into current expenditure and capital (or development) expenditure to analyse which portion of total expenditure is productive and which one is non-productive in terms of its impact on private investment. Results are reported in Table 2. When the impact of both these expenditures is studied together (Eq. 1) it is in confirmation with what literature has suggested, that is, current expenditure is non-productive while development expenditure is productive. But the coefficient of development expenditure is insignificant. However, when debt variable is excluded it becomes significant (Eq. 2). The negative and significant coefficient of current expenditure could be because of the large and inefficient public sector consuming large amount of the nation’s resources but not returning enough to make up. In Pakistan, a major chunk of current expenditures (more than 60%) is consumed in interest payments (almost 40%) and in defence expenditures (20%), which do not affect the private marginal product of capital and consequently growth.
Table 2. Results of Linear Equations: Disaggregated Total Public Expenditures
(Dependent Variable: Private Investment % of GDP) Eq. 1 Eq. 2 Eq. 3 Eq. 4 Eq. 5 Constant -121.27
(-6.133) -136.73 (-6.84)
-99.75 (-11.01)
-86.05 (-5.79)
-108.18 (-5.41)
Private Credit 0.157 (1.053)
0.167 (1.276)
0.189 (1.365)
0.280 (1.862)*
0.334 (2.532)**
Lending rate -0.050 (-2.109)**
-0.048 (-2.016)**
-0.043 (-1.950)**
-0.063 (-1.951)**
-0.063 (-1.687)*
L (GDP per capita(-1)) 13.452 (6.810)**
14.439 (7.307)**
11.397 (12.674)**
9.742 (6.637)**
11.583 (6.021)**
Debt -0.043 (-0.914)
-0.067 (-1.448)*
-0.077 (-1.631)*
Current Expenditure -0.240 (-2.845)**
-0.271 (-3.193)**
-0.189 (-3.201)**
Capital Expenditure 0.195 (1.206)
0.288 (1.616)*
-0.023 (-0.196)
0.109 (0.644)
R2 0.92 0.92 0.92 0.90 0.88 Adjusted R2 0.91 0.91 0.91 0.88 0.87 DW 1.39 1.38 1.31 1.27 1.17 Ramsey RESET test p-value
0.00063 0.0044 0.00086 0.00006 0.00062
BDS test p-value 0.0480 0.0716 0.0068 0.0088 0.0010 Notes: Value in parentheses is the t-statistics. ** significant at 5% critical level and * significant at 10%
critical level; low Ramsey test p-value as well as BDS test p-value indicate misspecification.

PRIVATE INVESTMENT AND FISCAL POLICY IN PAKISTAN 95
The non-productive performance of current expenditure with respect to private investment is not different from what is found in other empirical studies. Empirical research even on developed countries (e.g., Alesina et al., 1999) has suggested a larger role of changes in public spending on private investment as compared to the changes in taxes. It is particularly through the change in the public wage bill and in the government transfers. Higher wages cut into profits, reducing investment, and consequently economic growth. Moreover, any increase in wages in the public sector also can push up wage demands in the private sector, both in unionized and non-unionized labour markets. Similarly, increase in the number of public sector jobs lead to tighter labour market conditions and would increase wage pressure10. Similarly, more generous government transfers to those who are out of work can also bid up private sector wages.
Similarly when both expenditure categories are studied separately, the coefficient of development expenditure is negative and insignificant in the presence of debt variable (Eq. 4); while positive and insignificant in the absence of debt variable (Eq. 5). It seems huge debt burden has crowd out the positive implications of development expenditure on private investment. In other words, debt burden ultimately reduces the fiscal space for development expenditures in Pakistan. Secondly, the productivity of development expenditure also depends on the existence of current expenditure (which in itself is non-productive, Eq. 3).
In the next step we disaggregate the revenue side. First of all total revenues are disaggregated into direct taxes, indirect taxes and non-tax revenues and regressed on private investment in linear form. Results are illustrated in Table 3. In Eq. 1 of this table, when three types of revenue are regressed together, the results are in contradiction to what is expected. Direct tax has positive coefficient (although insignificant), while the coefficient of indirect tax is negative and highly significant. The result remains the same when these two types of revenues are regressed separately (Eq. 2, and Eq. 3). The influence of non-tax revenues remains inconclusive. When it is regressed along with other revenues, the coefficient is positive (Eq. 1); but when regressed separately, the coefficient is negative but insignificant (Eq. 4).
The behavior of direct taxes could be because the population falling within the income and property tax net in Pakistan are indifferent to tax with respect to their investment decisions. Second explanation could be that the tax rate is so low in the country which does not serve as a disincentive to capital accumulation. While indirect taxes have a significant negative influence. As Pakistan is dependent significantly on imports of machinery and raw material to aid its manufacturing sector11, indirect tax categories could distort their cost functions and make them relatively uncompetitive in the market and reduce the returns to investment.
10 Similar is the case in Pakistan, larger role of public sector; and wide wage gap between public and
private sector employees-both male and female earning more in public sector (for details see Aslam, 2009). 11 More than 50 % of our imports are composed of industrial raw material.

AFIA MALIK 96
Table 3. Results of Linear Equations: Disaggregated Revenues (Dependent Variable: Private Investment % of GDP)
Eq. 1 Eq. 2 Eq. 3 Eq. 4 Constant -46.76
(-2.534) -90.32
(-12.56) -60.72 (-4.69)
-87.85 (-10.22)
Private Credit 0.197 (1.441)
0.231 (1.508)*
0.232 (1.627)*
0.281 (1.837)*
Lending rate -0049 (-1.965)**
-0.061 (-2.135)**
-0.038 (-1.665)*
-0.062 (-2.163)**
L (GDP per capita (-1)) 6.242 (3.364)**
10.077 (12.470)**
7.659 (6.696)**
9.927 (11.235)**
Debt -0.103 (-2.168)**
-0.063 (-1.322)
-0.105 (-2.056)**
-0.077 (-1.461)*
Direct Taxes 0.159 (0.395)
0.081 (0.214)
Indirect Taxes -0.628 (-3.388)**
-0.425 (-2.793)**
Non-tax Revenue 0.374 (1.481)*
-0.046 (-0.445)
R2 0.93 0.90 0.92 0.89 Adjusted R2 0.91 0.89 0.91 0.88 DW 1.24 1.30 1.38 1.29 Ramsey RESET test p-value 0.00024 0.00020 0.0022 0.000010 BDS test p-value 0.0176 0.0248 0.0390 0.0156
Notes: Value in parentheses is the t-statistics. ** significant at 5% critical level and * significant at 10%
critical level; low Ramsey test p-value as well as BDS test p-value indicate misspecification.
To examine the impact of tax revenues in more detail they are disaggregated again.
Direct taxes are disaggregated into three major categories wealth tax, income tax and other direct taxes (which includes gift tax, estate duty, capital value tax and corporate assets tax). Similarly indirect taxes are disaggregated into sales tax, customs and federal excise duty12. They are then regressed on private investment along with control variables. Further disaggregation of expenditures is not done because of data limitations.
12 All the disaggregated variables are scaled by GDP before estimation.

PRIVATE INVESTMENT AND FISCAL POLICY IN PAKISTAN 97
Table 4. Results of Linear Equations: Disaggregated Direct Taxes and Indirect Taxes (Dependent Variable: Private Investment % of GDP)
Eq. 1 Eq. 2 Eq. 3 Eq. 4 Eq. 5 Eq. 6 Constant -87.07
(-12.28) -102.46 (-14.18)
-59.20 (-4.35)
-68.76 (-6.07)
-33.51 (-2.29)
-61.64 (-4.39)
Private Credit 0.281 (1.817)*
0.113 (1.029)
0.170 (1.335)
0.253 (1.728)*
0.142 (1.024)
0.245 (1.661)*
Lending rate -0.065 (-2.260)**
-0.065 (-3.580)**
-0.038 (-1.684)*
-0.045 (-2.007)**
-0.033 (-1.610)*
-0.047 (-2.216)**
L (GDP per capita (-1))
9.812 (11.782)**
11.309 (17.104)**
6.996 (5.283)
8.190 (7.739)**
4.912 (3.683)**
7.192 (5.071)**
Debt -0.075 (-1.461)*
-0.026 (-0.560)
-0.083 (-1.684)*
-0.095 (-1.802)*
-0.113 (-2.138)**
-0.085 (-1.630)*
Income Taxes 0.051 (0.119)
Wealth Taxes -17.427 (-3.985)**
Other Direct Taxes 14.158 (2.72)**
Customs -0.326 (-2.762)**
Excise Duty -1.164 (-4.299)**
Sales tax 0.619 (2.783)**
R2 0.90 0.93 0.93 0.91 0.92 0.91 Adjusted R2 0.88 0.91 0.91 0.90 0.91 0.90 DW 1.27 1.56 1.44 1.31 1.34 1.34 Ramsey RESET test p-value
0.00004 0.0021 0.00042 0.00028 0.000075 0.000094
BDS test p-value 0.0096 0.3574 0.0302 0.0234 0.0180 0.8606
Notes: Value in parentheses is the t-statistics. ** significant at 5% critical level and * significant at 10%
critical level; low Ramsey test p-value as well as BDS test p-value indicate misspecification, except for
equation 6 where the two test results are inconsistent.
First only linear terms are included. Results as reported in Table 4 demonstrate the
negative and significant influence of wealth tax on private investment (Eq. 2), while income tax and other direct taxes (Eq. 1, and Eq. 3) have positive effect on private investment but the coefficient of only other direct taxes is significant. This mixed response of different direct tax categories explains the insignificant response of aggregate direct taxes (both in linear and quadratic form as reported in the next

AFIA MALIK 98
sub-section). Economic explanation of the insignificant response of direct tax has been discussed above.
As far as disaggregating of indirect tax is concerned (Eq. 4 to Eq. 6 in Table 4), the three components have significant influence on private investment - customs and federal excise duty have distortionary impact while sales tax has non-distortionary impact. However, the distortionary impact of customs and federal excise duty is stronger as indicated by the negative coefficient of total indirect taxes in Table 3, Eq. 1 and Eq. 3. But this impact deteriorates after a certain level as revealed by the U-shaped relationship in Table 8, Eq. 1 and Eq. 3 (discussed in the next sub-section).
Briefly, in linear form the results are not conclusive especially when the impact of fiscal revenues on private investment is studied. In the next sub-section, all the relationships are studied again but in non-linear form. But before that in order to show the dominance of non-linear models to linear ones, Ramsey RESET Test is applied to check if there is any specification error in the form of incorrect functional form, i.e., missing of non-linear or quadratic term in the regression equation. We apply the Ramsey RESET test to all the equations in Table 1 to Table 4. In all the cases F-statistic is quite high and p-value for Ramsey RESET test (reported in the last row of Table 1 to Table 4) is smaller than the required level of significance (5%). Furthermore, the coefficient of the fitted squared term is statistically significant; thus rejecting the hypothesis of correct specification in the form of linear model.
4.2. Aggregate and Disaggregate Fiscal Policy variables: Non-linear Representation In the next step fiscal policy variables are examined in non-linear form (Table 5).
For this purpose a quadratic term for fiscal policy variable is included. With respect to surplus the results imply that there is diminishing returns with respect to this variable as the quadratic variable becomes negative (Eq. 4). However, both linear and quadratic variables become insignificant. Similarly, when total revenue and total expenditure are studied along with their quadratic terms, although they show increasing returns separately as well as together (Eq. 1 to Eq. 3) but none of the variable in linear or in quadratic form is significant. Therefore, this table suggests that there is no significant non-linear relationship between aggregate fiscal policy variables and private investment.

PRIVATE INVESTMENT AND FISCAL POLICY IN PAKISTAN 99
Table 5. Results of Non-linear Equations: Aggregate Fiscal Policy Variables (Dependent Variable: Private Investment % of GDP)
Eq. 1 Eq. 2 Eq. 3 Eq. 4 Constant -67.81
(-3.05) -66.46 (-3.84)
-79.26 (-4.94)
-89.70 (-9.86)
Private Credit 0.216 (1.541)*
0.250 (1.611)*
0.217 (1.651)*
0.237 (1.567)*
Lending rate -0.038 (-1.702)*
-0.039 (-1.632)*
-0.046 (-2.006)**
-0.059 (-2.237)**
L (GDP per capita (-1)) 9.504 (9.893)**
9.278 (10.477)**
9.875 (11.722)**
10.163 (11.542)**
Debt -0.099 (-1.924)**
-0.105 (-1.946)**
-0.083 (-1.853)*
-0.071 (-1.347)
Total Revenue -0.769 (-0.731)
-1.705 (-1.333)
Total Revenue Sq. 0.022 (0.616)
0.051 (1.202)
Total Expenditure -0.729 (-0.659)
-0.625 (-0.684)
Total expenditure Sq. 0.015 (0.588)
0.012 (0.589)
Surplus 0.095 (0.508)
Surplus Sq. -0.002 (-0.127)
R2 0.92 0.91 0.91 0.91 Adjusted R2 0.89 0.89 0.90 0.89 DW 1.31 1.36 1.27 1.26 BDS test p-value 0.0462 0.0344 0.0884 0.0234
Notes: Value in parentheses is the t-statistics. ** significant at 5% critical level and * significant at 10%
critical level. sq. stands for square.
Similar to aggregate representation, the impact of disaggregated expenditures on
private investment is studied in non-linear form, that is, with the inclusion of quadratic terms. Results are reported in Table 6. When both current and capital expenditures in level as well as in quadratic form are regressed on private investment (Eq.1), current expenditure in both the forms turned negative and insignificant. But when current expenditure (in level form) was regressed on private investment (Table 2), its relationship with private investment was negative and significant. Thus, it implies the existence of only linear relationship between private investment and current expenditure and current expenditures are not productive as far as private investment is concerned.

AFIA MALIK 100
Table 6. Results of Non-linear Equations: Disaggregated Total Public Expenditures (Dependent Variable: Private Investment % of GDP)
Eq. 1 Eq. 2 Eq. 3 Constant -152.76
(-10.88) -136.71 (-6.78)
-152.14 (-11.16)
Private Credit 0.015 (0.120)
0.162 (1.252)
0.012 (0.092)
Lending rate -0.031 (-1.139)
-0.049 (-1.877)*
-0.034 (-1.279)
L (GDP per capita (-1)) 16.032 (11.907)**
15.000 (7.297)**
16.257 (11.63)**
Current Expenditure -0.055 (-0.094)
-0.477 (-0.644)
-0.405 (-3.972)**
Current Expenditure Sq. -0.011 (-0.612)
0.006 (0.291)
Capital Expenditure 1.832 (3.566)**
0.294 (1.630)*
1.785 (3.503)**
Capital Expenditure Sq. -0.131 (-3.355)**
-0.126 (-3.295)**
R2 0.94 0.92 0.94 Adjusted R2 0.93 0.91 0.93 DW 1.69 1.34 1.59 BDS test p-value 0.3106 0.3950 0.1962
Notes: Value in parentheses is the t-statistics. ** significant at 5% critical level and * significant at 10%
critical level. BDS test p-value indicates correct specification. sq. stands for square. Debt Variable is omitted
as it was insignificant and its omission in the three equations does not have much impact on the concerned
results, they become even more pronounced and robust.
On the other hand, positive and significant coefficient of capital expenditure in linear
form while negative and significant coefficients of capital expenditure (in quadratic form) in Eq. 1 of Table 6 indicate the existence of a bell-shaped relationship, that is, a certain level of capital expenditure is beneficial for private investment after that level it becomes detrimental for private investment. As Devarajan et al. (1996) has pointed out that too much of those expenditures (supposedly productive) would eventually become unproductive. While Barro (1990) has suggested an inverted U-curve relationship, that is, the rising cost of distortionary taxation necessary to finance spending overtakes the declining benefits of productive spending. The result for both current expenditure and capital expenditure holds even when these two expenditures (in level as well as in quadratic form) are regressed separately on private investment (Eq. 2, and Eq. 3 in Table 6). In Pakistan, development expenditures are generally pitched at an unrealistically high level in budgets; and whenever there is fiscal crisis, sharp cutbacks in outlays of public
PRIVATE INVESTMENT AND FISCAL POLICY IN PAKISTAN 101
sector development programmes have been noticed. It is therefore important to realise the threshold level of development expenditure before taking any decision for its allocation or for its reduction.
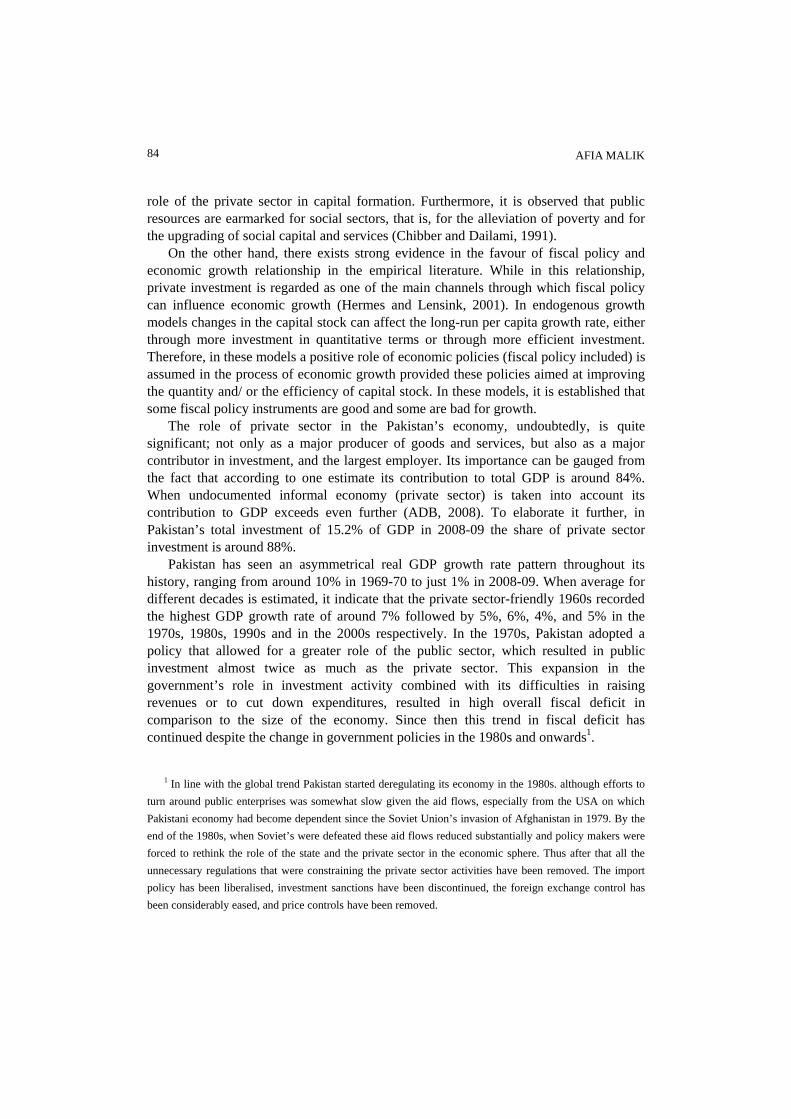
The revenues in disaggregated form are also regressed with the inclusion of quadratic term for each revenue type (results are reported in Table 7). In Eq. 1 of this table, different signs for direct tax in linear and in quadratic form suggests a bell-shaped relationship, that is, a certain level of direct taxes is non-distortionary but after that level it becomes distortionary for private investment initiatives. Contrary to this, the relationship between indirect tax and private investment is found to be U-shaped, that is, a diminishing distortionary effect of indirect taxes on private investment. In other words, they become non-distortionary after a certain minimum level is reached. The results for direct and indirect taxes hold even in Eq. 2 and Eq. 3 when the two types of taxes are regressed separately. Non-linear relationship also exists for non-tax revenues and even more in the presence of tax revenues (Eq. 1 and Eq. 4). The relation between non-tax revenues and private investment is bell-shaped, similar to direct tax and private investment relationship.
Table 7. Results of Non-linear Equations: Disaggregated Revenues (Dependent Variable: Private Investment % of GDP)
Eq. 1 Eq. 2 Eq. 3 Eq. 4 Constant -29.011
(-1.763) -87.03
(-13.40) -54.82 (-4.36)
-88.11 (-10.02)
Private Credit 0.233 (1.815)*
0.281 (1.808)*
0.252 (1.735)*
0.284 (1.886)*
Lending rate -0.051 (-1.799)*
-0.068 (-2.410)**
-0.042 (-2.072)**
-0.061 (-2.078)**
L (GDP per capita (-1)) 4.680 (2.754)**
9.692 (11.711)**
7.756 (7.717)**
9.883 (10.853)**
Debt -0.059 (-1.264)
-0.073 (-1.291)
-0.089 (-1.706)*
-0.074 (-1.344)
Direct Taxes 1.136 (0.757)
0.891 (0.429)
Direct Taxes Sq. -0.139 (-0.540)
-0.151 (-0.385)
Indirect Taxes -3.167 (-2.705)**
-2.396 (-1.986)**
Indirect Taxes Sq. 0.151 (2.176)**
0.124 (1.693)*
Non-tax Revenue 2.568 (3.041)**
0.217 (0.248)
Non-tax Revenue sq. -0.224 (-3.144)**
-0.029 (-0.321)
AFIA MALIK 102
R2 0.94 0.90 0.92 0.90 Adjusted R2 0.91 0.88 0.91 0.88 DW 1.43 1.25 1.35 1.28 BDS test p-value 0.0798 0.0216 0.1130 0.0116
Notes: Value in parentheses is the t-statistics. ** significant at 5% critical level and * significant at 10%
critical level. BDS test p-value indicates correct specification except for Equation 2.
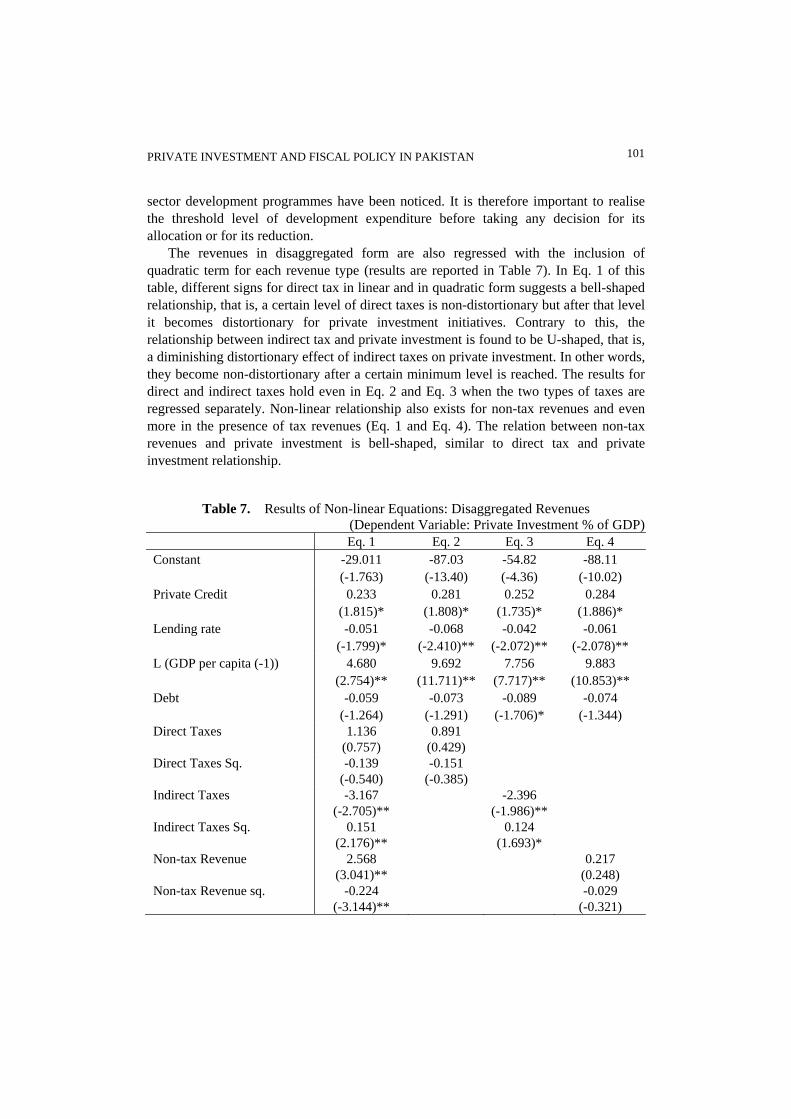
Next in Eq. 1 of Table 813, the quadratic term for each category of direct taxes is
included. The coefficient of income tax (both in linear and quadratic form) indicates the non-linear relationship between private investment and income taxes. This relationship is bell-shaped, meaning a certain level of this particular direct tax is fine as far as private investment is concerned but after that level it becomes distortionary for private investment. The coefficients of wealth tax both in linear and quadratic form are insignificant but they do switch signs from negative to positive. But in Eq. 4 when only wealth tax is included, negative sign of the first term is significant (highlighting its distortionary properties for private investment) as in Table 4, where only linear term is included. Thus, indicating no significant non-linear relationship between wealth tax and private investment. Whereas the significant coefficients of other direct taxes in linear and quadratic form suggest a U-shaped relationship.
Among the indirect tax categories, customs has bell-shaped, federal excise duty and sales tax has U-shaped relationship with private investment respectively. The coefficients are significant for federal excise duty and sales taxes, and insignificant for customs, for both linear and quadratic terms. Thus, implying that federal excise duty and sales tax (as components of indirect taxes) helped in attracting private investment after a certain minimum level.
Table 8. Results of Non-linear Equations: Disaggregated Direct Taxes and Indirect Taxes (Dependent Variable: Private Investment % of GDP)
Eq. 1 Eq. 2 Eq. 3 Eq. 4 Eq. 5 Eq. 6 Eq.7 Eq. 8
Constant -93.79
(-9.04)
-121.78
(-5.85)
-101.84
(-9.24)
-104.79
(-13.91)
-91.68
(-10.15)
-83.09
(-9.03)
-89.21
(-5.40)
-143.60
(-5.19)
Lending rate -0.054
(-2.174)**
-0.046
(-2.799)**
-0.06
(-2.31)**
-0.06
(-3.48)**
-0.04
(-1.40)
-0.05
(-1.78)*
-0.03
(-1.81)*
-0.06
(-2.96)**
L (GDP per
capita (-1))
9.865
(8.548)**
13.959
(6.078)**
10.81
(8.01)**
11.48
(15.07)**
10.09
(10.67)**
9.40
(10.46)**
10.14
(6.20)**
15.86
(5.19)**
13 In Table 8, among the control variables debt in all equations and private credit in first two equations are
omitted because they were not only insignificant but with wrong signs; and their omission has no impact on
the performance of other variables.

PRIVATE INVESTMENT AND FISCAL POLICY IN PAKISTAN 103
Private Credit 0.34
(2.33)**
0.08
(0.80)
0.11
(1.22)
0.35
(2.61)**
0.15
(1.44)*
0.04
(0.43) Income Taxes 4.367
(4.493)** 1.73
(0.68)
Income Taxes Sq.
-0.853 (-3.646)**
-0.35 (-0.69)
Wealth Taxes -17.99 (-0.811)
-31.03(-1.89)**
Wealth Taxes Sq.
114.49 (0.775)
95.95(0.81)
Other Direct Taxes
-32.70 (-3.513)**
-31.84(-2.91)**
Other Direct Taxes Sq.
214.902 (7.510)**
213.12(5.17)**
Customs 0.692 (0.845)
-1.58 (-2.29)**
Customs Sq. -0.067 (-0.669)
0.19 (1.92)**
Excise Duty -4.695 (-2.619)**
-3.21 (-3.28)**
Excise Duty Sq.
0.791 (2.519)**
0.62 (2.97)**
Sales tax -3.431 (-1.748)*
-5.72 (-2.39)**
Sales tax sq. 0.517 (1.422)
1.09 (2.68)**
R2 0.96 0.94 0.88 0.93 0.95 0.90 0.92 0.93 Adjusted R2 0.95 0.93 0.87 0.91 0.94 0.88 0.91 0.91 DW 2.20 1.91 1.14 1.49 1.93 1.28 1.44 1.42 BDS test p-value
0.1512 0.2050 0.0860 0.1308 0.6868 0.3880 0.4682 0.3550
Notes: Value in parentheses is the t-statistics. ** significant at 5% critical level and * significant at 10%
critical level. BDS test p-value indicates correct specification. Among the control variables, external debt and
private credit are ignored in these equations because they were insignificant and their omission does not have
any effect on other results.
To investigate the interrelationship between disaggregated expenditures and
disaggregated revenues, they are regressed together. Results as reported in Table 9. Eq. 1 which includes only linear term for each independent variable reaffirmed more or less the same results as reported in previous tables. No significant difference can be observed. In Eq. 2 when quadratic term of two expenditures and three sources of revenue (in linear form only) is included, significant bell-shaped relationship with capital expenditures as observed in Table 6, Eq. 1; and insignificant coefficients of current expenditure (both

AFIA MALIK 104
linear and quadratic) as in Table 6 Eq. 1. Different revenue categories performed in a similar manner as in Table 3, Eq. 1.
Table 9. Disaggregated Expenditures and Revenues: Linear and Non- linear (Dependent Variable: Private Investment % of GDP)
Eq. 1 Eq. 2 Eq. 3 Eq. 4 Constant -116.41
(-5.53) -122.46 (-8.53)
-100.94 (-3.63)
-103.77 (-4.88)
Lending rate -0.076 (-2.470)**
-0.036 (-1.234)
-0.064 (-1.591)*
-0.039 (-1.301)
L (GDP per capita (-1)) 12.816 (5.984)**
13.364 (8.485)**
11.073 (4.277)**
11.685 (6.016)**
Capital Expenditure 0.268 (2.342)
1.778 (4.890)**
0.192 (1.609)*
1.887 (3.944)**
Capital Expenditure Sq. -0.127 (-4.373)**
-0.133 (-3.801)**
Current Expenditure -0.404 (-5.806)**
-0.349 (-0.677)
-0.386 (-2.847)**
-0.641 (-1.617)*
Current Expenditure Sq. -0.002 (-0.138)
0.010 (0.749)
Direct Taxes 0.582 (1.488)*
0.173 (0.451)
0.008 (0.004)
2.168 (1.678)*
Direct Taxes Sq. 0.108 (0.296)
-0.359 (-1.687)*
Indirect Taxes -0.257 (-1.572)*
-0.452 (-3.225)**
-0.470 (-0.229)
-1.486 (-0.837)
Indirect Taxes Sq. 0.006 (0.050)
0.051 (0.488)
Non-Tax Revenue 0.846 (3.469)**
0.570 (2.644)**
2.705 (4.183)**
1.368 (1.471)*
Non-Tax Revenue Sq. -0.195 (-3.272)**
-0.092 (-1.137)
R2 0.95 0.96 0.95 0.97 Adjusted R2 0.94 0.95 0.94 0.95 DW 1.34 1.88 1.39 1.92 BDS test p-value 0.2078 0.9776 0.2838 0.6198
Notes: Value in parentheses is the t-statistics. ** significant at 5% critical level and * significant at 10%
critical level. BDS test p-value indicates correct specification. Among the control variables, external debt and
private credit are ignored in these equations because they were insignificant and their omission does not have
any effect on other results.

PRIVATE INVESTMENT AND FISCAL POLICY IN PAKISTAN 105
In Eq. 3 of Table 9 when quadratic term for revenue categories is included along with the linear term for two types of expenditures, the coefficients of both direct and indirect taxes (in linear and quadratic form) becomes insignificant, only non-tax revenue show a significant bell shaped relationship with private investment. In Eq. 4, the quadratic term for capital expenditure and current expenditure is also included. Here again the coefficient of capital expenditure indicates a significant bell-shaped relationship. For current expenditure, although the quadratic term becomes positive (unlike earlier situations) but it is insignificant. The coefficient of direct tax indicates a significant bell-shaped relationship, which in the absence of both the expenditures in quadratic form is insignificant Eq. 3. Non-tax revenue which has significant bell-shaped relationship in Eq. 3, although maintained its signs in Eq. 4 but the coefficient of quadratic term becomes insignificant. No change can be observed in the behaviour of indirect tax in the presence of expenditures. Indirect tax similar to Eq. 3 remains insignificant.
In other words, specification of the model does change the results. Direct tax has shown an insignificant bell-shaped relation with private investment in the absence of expenditures in the model. But when expenditures in non-linear form are included it has shown a significant bell-shaped relationship. On the contrary, indirect tax maintained a U-shaped relation with private investment in the presence of expenditures (although insignificant in both the cases). While non-tax revenue which has significant bell-shaped relationship with private investment in the absence of quadratic term for expenditure categories becomes insignificant in their presence. The most consistent performance is that of capital expenditures.
To further reinforce the superiority of nonlinear models to linear ones, BDS (1987) nonlinearity test14 is applied to all the models linear as well as non-linear. BDS (as a misspecification) test is applied to the residuals of the fitted model. This test is applied using two free parameters embedding dimension ( m 4) and metric bound/ proximity parameter ( ε 0.9). As the results for M 2, 3, 4 are more or less the same, therefore to avoid unnecessary length only p-values for m 2, ε 0.9 are reported. The results of the BDS test in significance level (boot strapped p-values) are reported in the last row of all the tables (Table 1 to Table 9). In models (Table 1 to Table 4), p-value of less than 0.05clearly indicates the evidence of non-linearity. But in models where quadratic term is introduced, (Table 5 to Table 9) in most of the cases p-value is greater than 0.05; specifically when fiscal policy variables are disaggregated and statistically significant, thus indicating the superiority of non-linear specifications.
In general these results imply the significance of examining fiscal policy in
14 Brock, W., Dechert, W.D., LeBaron, B., and Scheinkman, J. (1995), “A Test for Independence Based
on the Correlation Dimension,” working paper, Department of Economics, University of Wisconsin,
Madison.

AFIA MALIK 106
disaggregated form. With few exceptions there exists a non-linear relationship between fiscal policy and private investment; thus, highlighting the significance of threshold level in budgetary allocations and in setting the targets for revenue generation in Pakistan.
5. CONCLUSION This paper has examined linear as well as non-linear impact of fiscal policy variables
on private investment in Pakistan. The results imply that it’s better to examine fiscal policy in disaggregated form; as the impact of fiscal policy in aggregate and disaggregate form do not comply with each other. Different categories of expenditures and revenues have different impact on private investment. And in most of the cases this relationship is non-linear. The only exception is current expenditures, which remained non-productive in most of the cases.
When expenditures are regressed in disaggregated form, results imply current expenditure as non-productive while development expenditure as productive. However, development expenditure also become non-productive after a certain level. In other words, development expenditure stimulates investment until the optimum level of operation is reached; further expenditure in this category may then be harmful. Secondly, productivity of development expenditure is dependent on the existence of current expenditures. In other words, there are certain elements in the current expenditures that are complementing the productivity of development (or capital) expenditures in the case of Pakistan.
On the revenue side, the relation between direct tax and private investment is of an inverted U or bell-shaped, while between indirect tax and private investment is that of U-shaped. Non-tax revenues also become distortionary after a certain level. While U-shaped relation between indirect tax and private investment indicate spill-over effects become useful only after this tax form has reached a certain minimum level. In the indirect tax categories, it's the sales tax and federal excise duties that become effective (or non-distortionary) after reaching a certain minimum level. While custom duty is non-distortionary for private investment until a certain level is reached after that it becomes distortionary. Similarly, among the direct tax categories, wealth tax is distortionary and the relationship is significantly linear; income tax is non-distortionary up to a certain level after that it becomes harmful. While other direct taxes only becomes non-distortionary only after they have reached a certain minimum level.
In short, the existence of non-linear relationship between different fiscal policy instruments and private investment highlights the importance of certain threshold values for the different fiscal policy instruments to encourage private investment. Rising budget deficits is a serious concern in Pakistan. But before deciding on how to reduce it, selecting an optimal combination of different expenditures and revenue categories may be of crucial importance.

PRIVATE INVESTMENT AND FISCAL POLICY IN PAKISTAN 107
REFERENCES
ADB (2008), Private Sector Assessment Pakistan, Asian Development Bank, Manilla. Alesina, A., S. Ardagna, R. Perotti, and F. Schiantaretti (1999), “Fiscal Policy, Profits
and Investment,” NBER working paper, 7207. Arin, K.P. (2004), “Fiscal Policy, Private Investment and Economic Growth: Evidence
from G-7 Countries,” available online http://papers.ssrn.com/sol3/papers.cfm?abstract- id=438785.
Aslam, M., and G. Kingdon (2009), “Public-Private Sector Segmentation in the Pakistani Labour Market,” Journal of Asian Economics, 20(1), 34-49.
Barro, R.J. (1990), “Government Spending in a Simple Model of Endogenous Growth,” Journal of Political Economy, 98(1), 103-117.
Barro, R.J., and X. Sala-i-Martin (1992), “Public Finance in Models of Economic Growth,” Review of Economic Studies, 59(4), 645-661.
Brock, W.A., W.D. Dechert, B. LeBaron, and J.A. Scheinkman (1995), “A Test for Independence Based on the Correlation Dimension,” Working Paper, 9520, University of Wisconsin Madison.
Carneiro, F.G., J.R. Faria, and B.S. Barry (2005), “Government Revenues and Expenditures in Guinea-Bissau: Causality and Cointegration,” Journal of Economic Development, 30(1), 107-117.
Chhibber, A., and M. Dailami (1990), “Fiscal Policy and Private Investment in Developing Countries: Some Recent Evidence on Key Selected Issues,” The World Bank, Policy, Research and External Affairs Working Papers in Development Economics, WPS 559.
Chibber, A., and S. van Wijnbergen (1988), “Public Policy and Private Investment in Turkey,” Policy Research Working Paper, 120.
Devarajan, S., V. Swaroop, and H. Zou (1996), “The Composition of Public Expenditure and Growth,” The Journal of Monetary Economics, 37(2-3), 313-344.
Easterly, W., and S. Rebelo (1993), “Fiscal Policy and Economic Growth: An Empirical Investigation,” NBER Working Paper, 4499.
Gemmell, N. (2001), “Fiscal Policy in a Growth Framework,” World Institute for Development and Economic Research (WIDER) Discussion Paper, 2001/ 84.
Gupta, S., B. Clements, E. Baldacci, and C. Mulas-Granados (2005), “Fiscal Policy, Expenditure Composition and Growth in Low-income Countries,” Journal of International Money and Finance, 24(3), 441-463.
Haque, N.U., and P.J. Montiel (1993), “Fiscal Adjustment in Pakistan,” IMF Staff Papers, 40(2), 471-480.
Hermes, N., and R. Lensink (2001), “Fiscal Policy and Private Investment in Less Developed Countries,” World Institute for Development and Economic Research (WIDER) Discussion Paper, 2001/ 32.
Hsing, Yu (2007), “Impacts of Higher Crude Oil Prices and Changing Macroeconomic Conditions on Output Growth in Germany,” International Research Journal of

AFIA MALIK 108
Finance and Economics, 11, 134-140. Hyder, K., and Q.M. Ahmed (2003), “Why Private Investment in Pakistan Has
Collapsed and How It Can Be Restored,” MPRA Working Paper, 16251. Karago, E., and K. Ozdemir (2006), “Government Expenditure and Private Investment:
Evidence from Turkey,” The Middle East Business and Economic Review, 18(2), 33-38.
Khan, A.H., and Z. Iqbal (1991), “Fiscal Deficit and Private Sector Activities in Pakistan,” Economia Internazionale, 44 (2-3), 182-190.
Khan, M.T.Y., and K. Sasaki (2001), “Roles of Public Capital in Pakistan’s Economy: Productivity, Investment and Growth Analysis,” RURDS, 13(2), 143-162.
King, R.G., and S. Rebello (1990), “Public Policy and Economic Growth: Developing Neoclassical Implications,” Journal of Political Economy, 98(5), 126-150.
Kneller, R., M.F. Bleaney, and N. Gemmell (1999), “Fiscal Policy and Growth: Evidence from OECD Countries,” Journal of Public Economics, 74(2), 171-190.
Looney, R.E., and P.C. Frederiken (1997), “Government Investment and Follow-on Private Sector Investment in Pakistan, 1972-1995,” Journal of Economic Development, 22(1), 91-100.
Mamatzakis, E.C. (2000), “The Effect of Public Expenditure on Private Investment: An Empirical Application,” in C.C. Paraskevopoulos, T. Georgakopoulos, and L. Michelis, eds., The Asymmetric global Economy: Growth, Investment and Public Policy, APF Press: Toronto Canada.
Ndikumana, L. (2005), “Can Macroeconomic Policy Stimulate Private Investment in South Africa? New Insights from Aggregate and Manufacturing Sector-level Evidence,” Political Economy Research Institute (PERI) Working Paper, 106.
Oskooee, M.B. (1999), “Do Federal Budget Deficits Crowd Out or Crowd in Private Investment?” Journal of Policy Modelling, 2(5), 633-640.
Perotti, R. (2004), “Estimating the Effects of Fiscal Policy in OECD Countries,” Inocenzo Gasparini Institute for Economic Research (IGIER) Working Paper, 276.
Rehman, H., S. Khan, and M.A. Khan (2009), “What Determines Private Investment? The case of Pakistan,” A Research Journal of South Asian Studies, 24(1), 52-68.
Reinhart, C.M., and M.S. Khan (1989), “Private Investment and Economic Growth in Developing Countries,” IMF Working Paper, 89/60.
Sakr, K. (1993), “Determinants of Private Investment in Pakistan,” IMF Working Paper, 93/30.
Soli, V.O., S.K. Harvey, and E. Hagan (2008), “Fiscal Policy, Private Investment and Economic Growth: The Case of Ghana,” Studies in Economics and Finance, 25(2), 112-130.
Tanzi, V., and H.H. Zee (1997), “Fiscal Policy and Long Run Growth,” IMF Staff Papers, 44(2), 179-209.
Wang, B. (2005), “Effects of Government Expenditures on Private Investment: Canadian Empirical Evidence,” Empirical Economics, 30(2), 493-504.
PRIVATE INVESTMENT AND FISCAL POLICY IN PAKISTAN 109
Mailing Address: Afia Malik, House 16, Street 17, Sector G, Defence Housing Authority Phase II, Islamabad, Pakistan. E-mail: [email protected].
Received November 22, 2011, Revised June 25, 2012, Accepted January 3, 2013.