Embed Size (px)
Citation preview

Division of Investment Management Risk and Examinations Office
Private Funds Statistics
First Calendar Quarter 2015
December 30, 2015
This is a report of the Staff of the Division of Investment Management’s Risk and Examinations Office (REO) of the U.S. Securities and Exchange Commission. The Commission has expressed no view regarding the analysis, findings, or conclusions contained herein.

December 30, 2015 Risk and Examinations Office
Introduction
This report provides a summary of recent private fund industry statistics and trends, reflecting data collected through Form PF and Form ADV filings.1 Form PF information provided in this report is aggregated, rounded, and/or masked to avoid potential disclosure of proprietary information of individual Form PF filers.
This report reflects data from Second Calendar Quarter 2013 through First Calendar Quarter 2015 as reported by Form PF filers.2 Please see the Appendix for information on the categories of Form PF filers, the definitions of capitalized terms, a description of the boxplots used in several figures, as well as other technical descriptions.
Form PF is still a relatively new reporting requirement for advisers to private funds. The Staff continues to work with the data and filers to identify and correct filing errors. In some instances, the Staff has made adjustments to the summary statistics presented here to correct what appear to be clear filing errors. In addition, the Staff has employed certain assumptions in aggregating the data. Future adjustments to these methodologies could lead to changes in reported statistics.
If you have any questions or comments about First Calendar Quarter 2015 Private Funds Statistics, please contact:
Tim Dulaney, PhD, FRM or Tim Husson, PhD, FRM at [email protected] with subject line “First Calendar Quarter 2015-Private Funds Statistics”.
1Only SEC-registered advisers with at least $150 million in private fund assets under management must report to the Commission on Form PF. SEC-registered investment advisers with less than $150 million in private fund assets under management, SEC exempt reporting advisers, and state-registered investment advisers are not required to file Form PF, but report general information about the private funds they manage on Form ADV. 2The Commission began receiving Form PF filings from Large Hedge Fund Advisers in July 2012. A full data set was
not received until March 2013. This report relies upon the Form PF database constructed and maintained by the Office of Research and Data Services in the Division of Economic and Risk Analysis.
1

December 30, 2015 Risk and Examinations Office
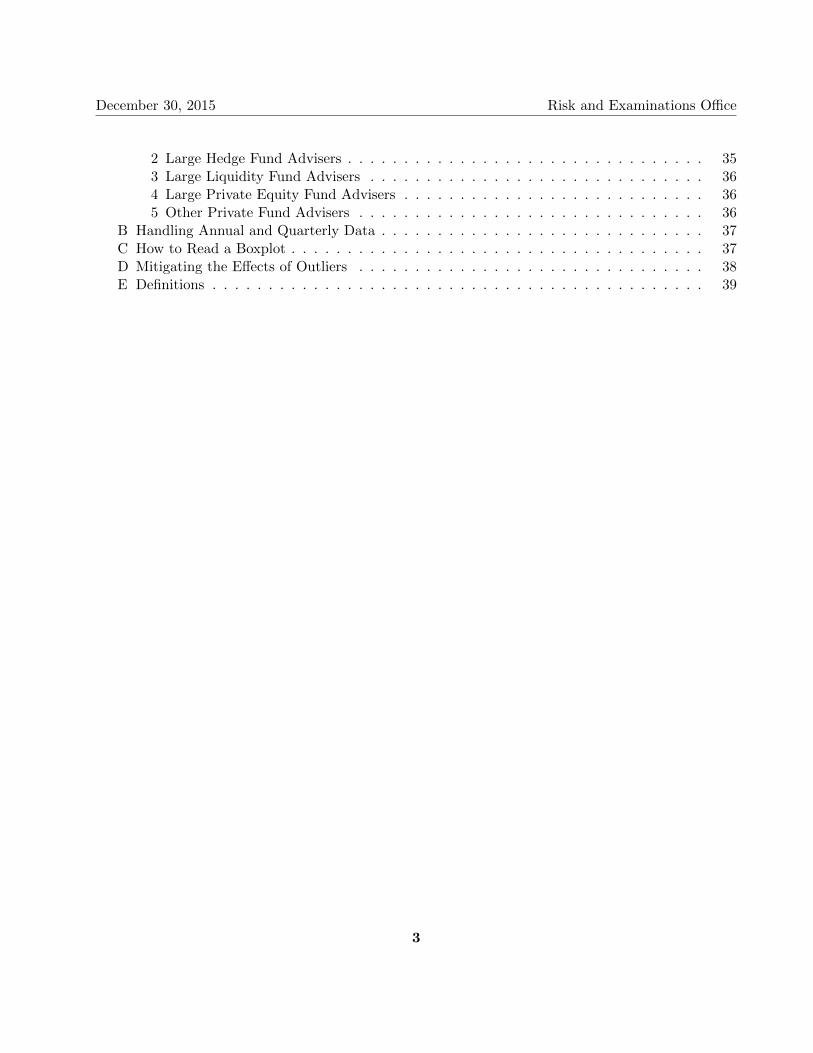
Contents
I Number of Funds and Advisers 4
II Gross and Net Assets 5 A Aggregate Assets by Fund Type over Time . . . . . . . . . . . . . . . . . . . . . . . . . . 5 B Borrowings . . . . . . . . . . . . . . . . . . . . . . . . . . . . . . . . . . . . . . . . . . . . 7 C Parallel Managed Accounts . . . . . . . . . . . . . . . . . . . . . . . . . . . . . . . . . . . 8
III Fund Domiciles and Adviser Main Offices 10
IV Beneficial Ownership 12
V Derivatives 16
VI High Frequency Trading 17
VII Information Reported by Large Hedge Fund Advisers 18 A Economic Leverage . . . . . . . . . . . . . . . . . . . . . . . . . . . . . . . . . . . . . . . 18 B Industry Concentration . . . . . . . . . . . . . . . . . . . . . . . . . . . . . . . . . . . . . 20 C Portfolio Turnover . . . . . . . . . . . . . . . . . . . . . . . . . . . . . . . . . . . . . . . . 21 D Region and Country Exposure . . . . . . . . . . . . . . . . . . . . . . . . . . . . . . . . . 22
VIII Qualifying Hedge Fund Specific Information 24 A Gross Exposure by Strategy . . . . . . . . . . . . . . . . . . . . . . . . . . . . . . . . . . 24 B Liquidity . . . . . . . . . . . . . . . . . . . . . . . . . . . . . . . . . . . . . . . . . . . . . 26 C Borrowings . . . . . . . . . . . . . . . . . . . . . . . . . . . . . . . . . . . . . . . . . . . . 27 D Central Clearing . . . . . . . . . . . . . . . . . . . . . . . . . . . . . . . . . . . . . . . . . 28
IX Section 3 Liquidity Fund Specific Information 29 A Liquidity . . . . . . . . . . . . . . . . . . . . . . . . . . . . . . . . . . . . . . . . . . . . . 29 B Rule 2a-7 Compliance . . . . . . . . . . . . . . . . . . . . . . . . . . . . . . . . . . . . . . 30 C Methods of Calculating NAV . . . . . . . . . . . . . . . . . . . . . . . . . . . . . . . . . . 30
X Section 4 Private Equity Fund Specific Information 31 A CPC Industry Concentration . . . . . . . . . . . . . . . . . . . . . . . . . . . . . . . . . . 31 B CPC Financial Leverage . . . . . . . . . . . . . . . . . . . . . . . . . . . . . . . . . . . . 32 C CPC Investments by Region and Country . . . . . . . . . . . . . . . . . . . . . . . . . . 33
XI Appendices 35 A Form PF Filer Categories . . . . . . . . . . . . . . . . . . . . . . . . . . . . . . . . . . . 35
1 All Private Fund Advisers . . . . . . . . . . . . . . . . . . . . . . . . . . . . . . . . . 35
2
December 30, 2015 Risk and Examinations Office
2 Large Hedge Fund Advisers . . . . . . . . . . . . . . . . . . . . . . . . . . . . . . . . 35 3 Large Liquidity Fund Advisers . . . . . . . . . . . . . . . . . . . . . . . . . . . . . . 36 4 Large Private Equity Fund Advisers . . . . . . . . . . . . . . . . . . . . . . . . . . . 36 5 Other Private Fund Advisers . . . . . . . . . . . . . . . . . . . . . . . . . . . . . . . 36
B Handling Annual and Quarterly Data . . . . . . . . . . . . . . . . . . . . . . . . . . . . . 37 C How to Read a Boxplot . . . . . . . . . . . . . . . . . . . . . . . . . . . . . . . . . . . . . 37 D Mitigating the Effects of Outliers . . . . . . . . . . . . . . . . . . . . . . . . . . . . . . . 38 E Definitions . . . . . . . . . . . . . . . . . . . . . . . . . . . . . . . . . . . . . . . . . . . . 39
3
I
December 30, 2015 Risk and Examinations Office
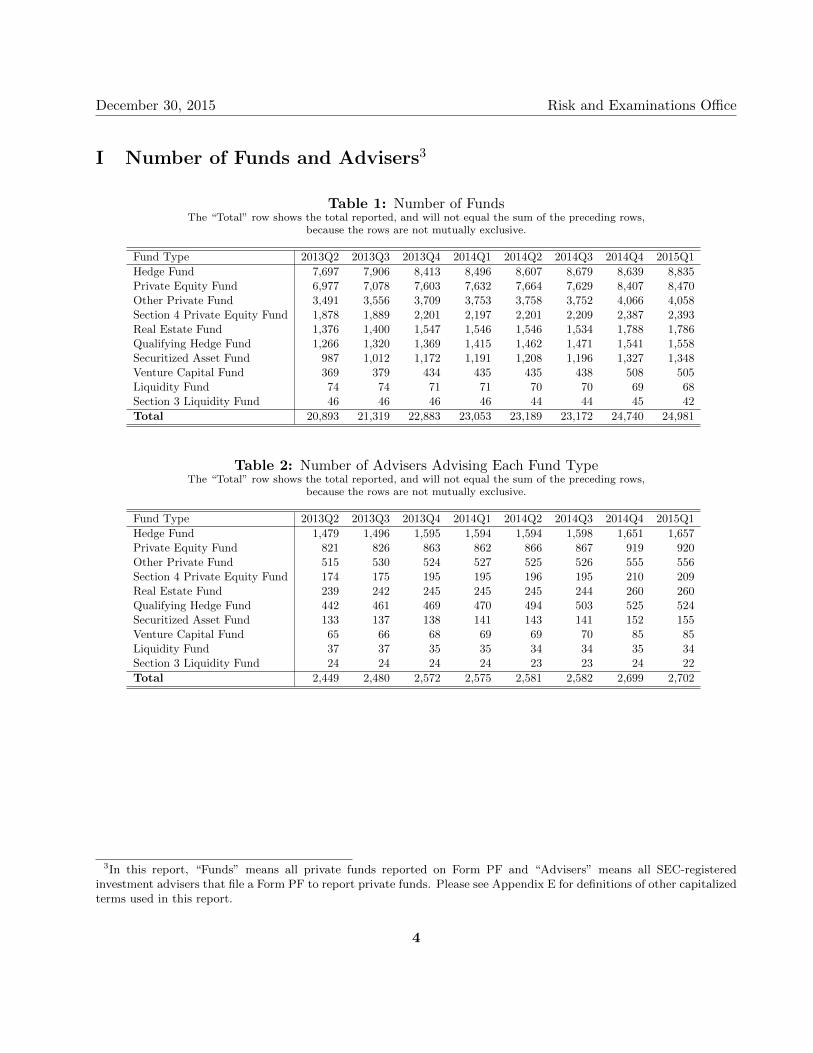
Number of Funds and Advisers3
Table 1: Number of Funds The “Total” row shows the total reported, and will not equal the sum of the preceding rows,
because the rows are not mutually exclusive.
Fund Type 2013Q2 2013Q3 2013Q4 2014Q1 2014Q2 2014Q3 2014Q4 2015Q1 Hedge Fund 7,697 7,906 8,413 8,496 8,607 8,679 8,639 8,835 Private Equity Fund 6,977 7,078 7,603 7,632 7,664 7,629 8,407 8,470 Other Private Fund 3,491 3,556 3,709 3,753 3,758 3,752 4,066 4,058 Section 4 Private Equity Fund 1,878 1,889 2,201 2,197 2,201 2,209 2,387 2,393 Real Estate Fund 1,376 1,400 1,547 1,546 1,546 1,534 1,788 1,786 Qualifying Hedge Fund 1,266 1,320 1,369 1,415 1,462 1,471 1,541 1,558 Securitized Asset Fund 987 1,012 1,172 1,191 1,208 1,196 1,327 1,348 Venture Capital Fund 369 379 434 435 435 438 508 505 Liquidity Fund 74 74 71 71 70 70 69 68 Section 3 Liquidity Fund 46 46 46 46 44 44 45 42 Total 20,893 21,319 22,883 23,053 23,189 23,172 24,740 24,981
Table 2: Number of Advisers Advising Each Fund Type The “Total” row shows the total reported, and will not equal the sum of the preceding rows,
because the rows are not mutually exclusive.
Fund Type 2013Q2 2013Q3 2013Q4 2014Q1 2014Q2 2014Q3 2014Q4 2015Q1 Hedge Fund 1,479 1,496 1,595 1,594 1,594 1,598 1,651 1,657 Private Equity Fund 821 826 863 862 866 867 919 920 Other Private Fund 515 530 524 527 525 526 555 556 Section 4 Private Equity Fund 174 175 195 195 196 195 210 209 Real Estate Fund 239 242 245 245 245 244 260 260 Qualifying Hedge Fund 442 461 469 470 494 503 525 524 Securitized Asset Fund 133 137 138 141 143 141 152 155 Venture Capital Fund 65 66 68 69 69 70 85 85 Liquidity Fund 37 37 35 35 34 34 35 34 Section 3 Liquidity Fund 24 24 24 24 23 23 24 22 Total 2,449 2,480 2,572 2,575 2,581 2,582 2,699 2,702
3In this report, “Funds” means all private funds reported on Form PF and “Advisers” means all SEC-registered investment advisers that file a Form PF to report private funds. Please see Appendix E for definitions of other capitalized terms used in this report.
4

December 30, 2015 Risk and Examinations Office
II Gross and Net Assets
A Aggregate Assets by Fund Type over Time
Table 3: Aggregate Private Fund Gross Asset Value (GAV) ($ Billions) As reported on Form PF, Question 8.
The “Total” row shows the total reported, and will not equal the sum of the preceding rows, because the rows are not mutually exclusive.
Fund Type 2013Q2 2013Q3 2013Q4 2014Q1 2014Q2 2014Q3 2014Q4 2015Q1 Hedge Fund 4,945 5,093 5,393 5,656 5,892 6,115 6,061 6,466 Qualifying Hedge Fund 3,986 4,135 4,357 4,583 4,827 4,941 4,925 5,245 Private Equity Fund 1,615 1,628 1,842 1,835 1,845 1,838 1,887 1,894 Section 4 Private Equity Fund 1,099 1,107 1,271 1,265 1,270 1,274 1,352 1,357 Other Private Fund 765 779 935 950 955 957 991 987 Securitized Asset Fund 330 338 351 356 362 357 377 382 Real Estate Fund 299 301 334 334 334 334 350 350 Liquidity Fund 257 249 248 250 274 286 274 290 Section 3 Liquidity Fund 249 241 241 247 262 281 272 287 Venture Capital Fund 24 24 30 30 30 30 39 39 Total 8,206 8,383 9,112 9,397 9,667 9,878 9,959 10,380
Table 4: Aggregate Private Fund Net Asset Value (NAV) ($ Billions) As reported on Form PF, Question 9.
The “Total” row shows the total reported, and will not equal the sum of the preceding rows, because the rows are not mutually exclusive.
Fund Type 2013Q2 2013Q3 2013Q4 2014Q1 2014Q2 2014Q3 2014Q4 2015Q1 Hedge Fund 2,685 2,815 3,078 3,162 3,308 3,360 3,400 3,580 Qualifying Hedge Fund 2,084 2,194 2,397 2,470 2,627 2,606 2,672 2,812 Private Equity Fund 1,479 1,494 1,702 1,695 1,702 1,694 1,744 1,753 Section 4 Private Equity Fund 1,042 1,049 1,206 1,200 1,205 1,209 1,275 1,279 Other Private Fund 653 667 816 823 827 830 884 890 Securitized Asset Fund 114 116 117 122 126 126 114 115 Real Estate Fund 235 237 266 266 266 265 279 279 Liquidity Fund 255 247 246 249 273 283 272 287 Section 3 Liquidity Fund 247 239 239 246 261 279 271 284 Venture Capital Fund 21 22 28 28 28 28 37 37 Total 5,420 5,573 6,232 6,329 6,511 6,548 6,710 6,911
5

December 30, 2015 Risk and Examinations Office
Figure 1: GAV and NAV Distributions See Appendix C for an explanation of boxplots.
As reported on Form PF, Questions 8 and 9.
2013
Q2
2013
Q3
2013
Q4
2014
Q1
2014
Q2
2014
Q3
2014
Q4
2015
Q1012345678
GA
V ($
Billi
ons)
2013
Q2
2013
Q3
2013
Q4
2014
Q1
2014
Q2
2014
Q3
2014
Q4
2015
Q1012345678
NA
V ($
Billi
ons)
(a) Qualifying Hedge Fund GAV (b) Qualifying Hedge Fund NAV
2013
Q2
2013
Q3
2013
Q4
2014
Q1
2014
Q2
2014
Q3
2014
Q4
2015
Q10
200400600800
1000120014001600
GA
V ($
Mill
ions
)
2013
Q2
2013
Q3
2013
Q4
2014
Q1
2014
Q2
2014
Q3
2014
Q4
2015
Q10
200400600800
1000120014001600
NA
V ($
Mill
ions
)
(c) Section 4 Private Equity Fund GAV (d) Section 4 Private Equity Fund NAV
6

December 30, 2015 Risk and Examinations Office
B Borrowings
Table 5: Aggregate Borrowings (Percent of Aggregate GAV) As reported on Form PF, Questions 8, 12, and 43 (Third Month).
Fund Type 2013Q2 2013Q3 2013Q4 2014Q1 2014Q2 2014Q3 2014Q4 2015Q1 Securitized Asset Fund 46.4 45.9 47.5 46.9 46.4 47.1 48.0 46.6 Qualifying Hedge Fund 44.4 41.4 39.3 39.2 37.9 37.6 38.3 38.3 Hedge Fund 40.9 38.4 36.8 36.9 36.6 36.6 35.9 35.1 Real Estate Fund 14.9 14.8 12.9 12.5 12.5 12.5 13.6 13.2 Private Equity Fund 3.8 3.8 2.3 2.4 2.4 2.4 4.0 4.0 Other Private Fund 6.2 6.0 4.2 4.1 4.1 4.0 2.8 2.7 Section 4 Private Equity Fund 2.8 2.8 2.1 2.1 2.1 2.1 2.3 2.3 Venture Capital Fund 1.4 1.4 0.9 0.9 0.9 0.9 0.6 0.6 Liquidity Fund 0.0 0.0 0.0 0.0 0.0 0.0 0.0 0.0 Section 3 Liquidity Fund 0.0 0.0 0.0 0.0 0.0 0.0 0.0 0.0
Figure 2: Distribution of Total Borrowings for All Private Funds and Qualifying Hedge Funds
See Appendix C for an explanation of boxplots. As reported on Form PF, Questions 12 and 43 (Third Month).
2013
Q2
2013
Q3
2013
Q4
2014
Q1
2014
Q2
2014
Q3
2014
Q4
2015
Q10
100
200
300
400
500
600
700
Tota
l Bor
row
ings
($M
illio
ns)
2013
Q2
2013
Q3
2013
Q4
2014
Q1
2014
Q2
2014
Q3
2014
Q4
2015
Q10.00.51.01.52.02.53.03.54.0
Tota
l Bor
row
ings
($Bi
llion
s)
(a) All Private Funds (b) Qualifying Hedge Funds
7

December 30, 2015 Risk and Examinations Office
C Parallel Managed Accounts4
Table 6: Number of Funds with Parallel Managed Accounts As reported on Form PF, Question 11.
The “Total” row shows the total reported, and will not equal the sum of the preceding rows, because the rows are not mutually exclusive.
Type 2013Q2 2013Q3 2013Q4 2014Q1 2014Q2 2014Q3 2014Q4 2015Q1 Hedge Fund 646 648 667 683 696 710 710 714 Other Private Fund 324 332 336 342 342 340 399 389 Qualifying Hedge Fund 190 199 202 211 227 218 230 236 Private Equity Fund 184 187 190 188 195 197 210 210 Section 4 Private Equity Fund 76 76 62 57 57 57 60 63 Real Estate Fund 33 33 46 46 46 46 51 51 Securitized Asset Fund *** *** *** *** *** *** *** *** Liquidity Fund 19 18 18 17 17 17 16 17 Section 3 Liquidity Fund 16 15 15 15 14 15 14 15 Venture Capital Fund *** *** *** *** *** *** *** *** Total 1,209 1,222 1,286 1,305 1,324 1,338 1,418 1,412
Table 7: Aggregate Value in Parallel Managed Accounts ($ Billions) As reported on Form PF, Question 11.
The “Total” row shows the total reported, and will not equal the sum of the preceding rows, because the rows are not mutually exclusive.
Type 2013Q2 2013Q3 2013Q4 2014Q1 2014Q2 2014Q3 2014Q4 2015Q1 Hedge Fund 594 600 620 612 910 834 754 798 Other Private Fund 925 1,132 1,446 1,455 1,450 1,272 1,417 1,387 Qualifying Hedge Fund 344 418 451 431 737 441 532 569 Private Equity Fund 115 115 123 122 124 124 107 106 Section 4 Private Equity Fund 23 23 18 17 17 17 16 16 Real Estate Fund 8 8 11 11 11 11 11 11 Securitized Asset Fund *** *** *** *** *** *** *** *** Liquidity Fund 371 384 392 334 326 339 349 363 Section 3 Liquidity Fund 314 327 335 330 321 335 345 359 Venture Capital Fund *** *** *** *** *** *** *** *** Total 2,011 2,237 2,656 2,596 2,880 2,638 2,731 2,748
Certain data points in the tables in this section and other sections may be masked to avoid possible disclosure of proprietary information of individual Form PF filers.
8
4

December 30, 2015 Risk and Examinations Office
Figure 3: Parallel Managed Account Value Distributions See Appendix C for an explanation of boxplots.
As reported on Form PF, Question 11.
2013
Q2
2013
Q3
2013
Q4
2014
Q1
2014
Q2
2014
Q3
2014
Q4
2015
Q10.00.51.01.52.02.53.03.54.04.5
Para
llel M
anag
ed A
sset
s ($B
illio
ns)
2013
Q2
2013
Q3
2013
Q4
2014
Q1
2014
Q2
2014
Q3
2014
Q4
2015
Q10.00.51.01.52.02.53.03.54.04.5
Para
llel M
anag
ed A
sset
s ($B
illio
ns)
(a) All Private Funds (b) Qualifying Hedge Funds
9

December 30, 2015 Risk and Examinations Office
III Fund Domiciles and Adviser Main Offices
Table 8: Fund Domicile (Percent of NAV) As reported on Form PF, Question 9 and Form ADV.
Country 2013Q2 2013Q3 2013Q4 2014Q1 2014Q2 2014Q3 2014Q4 2015Q1 United States 49.7 49.5 51.3 50.5 50.1 50.1 49.5 49.3 Cayman Islands 37.2 37.4 36.8 37.3 37.6 37.6 37.8 38.0 Ireland 4.2 4.1 4.1 4.2 4.4 4.6 4.7 4.6 Virgin Islands, British 2.8 2.8 2.7 2.7 2.7 2.7 2.6 2.8 Bermuda 1.2 1.2 1.2 1.2 1.2 1.2 1.2 1.2 Luxembourg 1.1 1.2 1.2 1.2 1.2 1.2 1.2 1.2 United Kingdom 1.1 1.1 0.7 0.7 0.7 0.7 1.0 1.0 Other 2.7 2.6 2.1 2.1 2.1 2.0 1.9 2.0
All Private Funds
Qualifying Hedge Funds
Country 2013Q2 2013Q3 2013Q4 2014Q1 2014Q2 2014Q3 2014Q4 2015Q1 Cayman Islands 53.7 53.9 54.3 55.4 55.3 54.9 55.5 55.5 United States 32.5 32.3 32.5 31.3 31.6 32.2 31.5 31.5 Virgin Islands, British 5.8 5.7 6.2 6.2 6.1 6.0 6.1 6.3 Ireland 1.8 2.0 2.1 2.2 2.2 2.2 2.4 2.3 Bermuda 1.8 1.8 1.4 1.3 1.4 1.4 1.4 1.4 Luxembourg 1.7 1.8 1.5 1.6 1.6 1.5 1.3 1.2 Other 2.7 2.6 2.0 2.0 1.9 1.8 1.9 1.9
Section 3 Liquidity Funds
Country 2013Q2 2013Q3 2013Q4 2014Q1 2014Q2 2014Q3 2014Q4 2015Q1 Ireland *** *** *** *** *** *** *** *** United States 32.9 34.4 35.9 33.2 34.1 32.3 30.6 32.8 Cayman Islands 8.7 8.1 7.9 8.8 *** 8.2 *** *** Other *** *** *** *** *** *** *** ***
Country 2013Q2 2013Q3 2013Q4 2014Q1 2014Q2 2014Q3 2014Q4 2015Q1 United States 66.2 66.5 66.6 66.3 66.4 66.5 63.3 63.6 Cayman Islands 28.6 28.4 28.2 28.3 28.2 28.2 30.7 30.5 United Kingdom 1.6 1.6 1.3 1.3 1.3 1.3 2.3 2.4 Canada *** *** 1.3 1.3 1.3 1.3 1.3 1.3 Bermuda *** *** 0.9 0.9 0.9 0.9 1.0 1.0 Other 1.6 1.6 1.6 1.8 1.8 1.8 1.4 1.2
Section 4 Private Equity Funds
10

December 30, 2015 Risk and Examinations Office
Table 9: Adviser Main Office Location (Percent of NAV) As reported on Form PF, Question 9 and Form ADV.
Country 2013Q2 2013Q3 2013Q4 2014Q1 2014Q2 2014Q3 2014Q4 2015Q1 United States 89.4 89.3 89.9 89.2 88.9 88.7 89.8 90.0 United Kingdom 6.9 6.9 6.4 6.7 7.0 7.3 6.4 6.3 Other 3.7 3.8 3.7 4.1 4.1 4.0 3.7 3.7
All Private Funds
Country 2013Q2 2013Q3 2013Q4 2014Q1 2014Q2 2014Q3 2014Q4 2015Q1 United States 89.6 89.4 89.5 89.3 89.4 89.7 89.9 90.8 United Kingdom 5.7 5.8 5.6 5.7 5.8 5.6 5.0 4.8 Hong Kong *** *** *** *** *** *** *** *** Australia *** *** *** *** *** *** *** *** Other 4.0 3.5 3.2 3.1 2.9 2.8 2.7 2.0
Qualifying Hedge Funds
Country 2013Q2 2013Q3 2013Q4 2014Q1 2014Q2 2014Q3 2014Q4 2015Q1 United States 66.4 66.9 66.8 67.2 68.5 65.3 63.6 65.6 United Kingdom *** *** *** *** *** *** *** *** France *** *** *** *** *** *** *** ***
Section 3 Liquidity Funds
Country 2013Q2 2013Q3 2013Q4 2014Q1 2014Q2 2014Q3 2014Q4 2015Q1 United States 98.0 98.0 97.3 97.4 97.4 97.4 97.8 97.8 Canada *** *** *** *** *** *** *** *** Other *** *** *** *** *** *** *** ***
Section 4 Private Equity Funds
11
December 30, 2015 Risk and Examinations Office
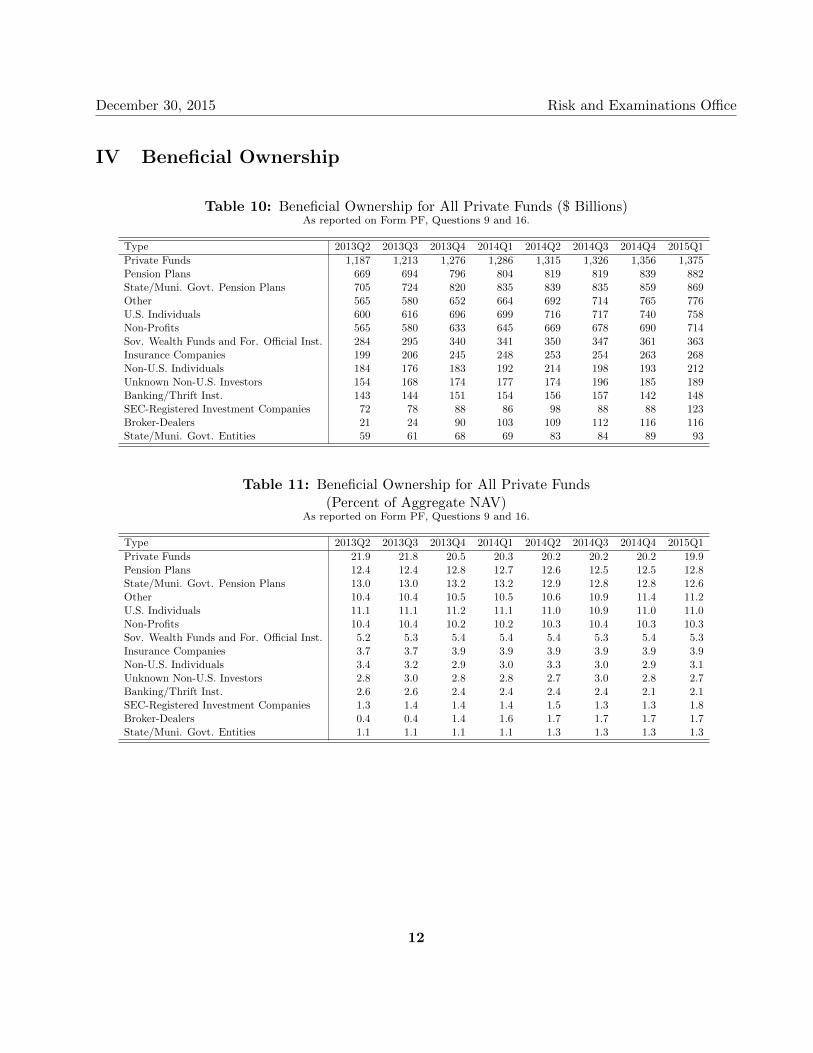
IV Beneficial Ownership
Table 10: Beneficial Ownership for All Private Funds ($ Billions) As reported on Form PF, Questions 9 and 16.
Type 2013Q2 2013Q3 2013Q4 2014Q1 2014Q2 2014Q3 2014Q4 2015Q1 Private Funds 1,187 1,213 1,276 1,286 1,315 1,326 1,356 1,375 Pension Plans 669 694 796 804 819 819 839 882 State/Muni. Govt. Pension Plans 705 724 820 835 839 835 859 869 Other 565 580 652 664 692 714 765 776 U.S. Individuals 600 616 696 699 716 717 740 758 Non-Profits 565 580 633 645 669 678 690 714 Sov. Wealth Funds and For. Official Inst. 284 295 340 341 350 347 361 363 Insurance Companies 199 206 245 248 253 254 263 268 Non-U.S. Individuals 184 176 183 192 214 198 193 212 Unknown Non-U.S. Investors 154 168 174 177 174 196 185 189 Banking/Thrift Inst. 143 144 151 154 156 157 142 148 SEC-Registered Investment Companies 72 78 88 86 98 88 88 123 Broker-Dealers 21 24 90 103 109 112 116 116 State/Muni. Govt. Entities 59 61 68 69 83 84 89 93
Table 11: Beneficial Ownership for All Private Funds (Percent of Aggregate NAV)
As reported on Form PF, Questions 9 and 16.
Type 2013Q2 2013Q3 2013Q4 2014Q1 2014Q2 2014Q3 2014Q4 2015Q1 Private Funds 21.9 21.8 20.5 20.3 20.2 20.2 20.2 19.9 Pension Plans 12.4 12.4 12.8 12.7 12.6 12.5 12.5 12.8 State/Muni. Govt. Pension Plans 13.0 13.0 13.2 13.2 12.9 12.8 12.8 12.6 Other 10.4 10.4 10.5 10.5 10.6 10.9 11.4 11.2 U.S. Individuals 11.1 11.1 11.2 11.1 11.0 10.9 11.0 11.0 Non-Profits 10.4 10.4 10.2 10.2 10.3 10.4 10.3 10.3 Sov. Wealth Funds and For. Official Inst. 5.2 5.3 5.4 5.4 5.4 5.3 5.4 5.3 Insurance Companies 3.7 3.7 3.9 3.9 3.9 3.9 3.9 3.9 Non-U.S. Individuals 3.4 3.2 2.9 3.0 3.3 3.0 2.9 3.1 Unknown Non-U.S. Investors 2.8 3.0 2.8 2.8 2.7 3.0 2.8 2.7 Banking/Thrift Inst. 2.6 2.6 2.4 2.4 2.4 2.4 2.1 2.1 SEC-Registered Investment Companies 1.3 1.4 1.4 1.4 1.5 1.3 1.3 1.8 Broker-Dealers 0.4 0.4 1.4 1.6 1.7 1.7 1.7 1.7 State/Muni. Govt. Entities 1.1 1.1 1.1 1.1 1.3 1.3 1.3 1.3
12

December 30, 2015 Risk and Examinations Office
Table 12: Beneficial Ownership for Qualifying Hedge Funds ($ Billions) As reported on Form PF, Questions 9 and 16.
Type 2013Q2 2013Q3 2013Q4 2014Q1 2014Q2 2014Q3 2014Q4 2015Q1 Private Funds 497 504 509 526 547 554 558 575 Non-Profits 295 305 322 323 349 358 357 378 Pension Plans 263 276 293 308 323 312 334 360 U.S. Individuals 270 283 307 303 322 321 321 340 Other 194 209 238 242 271 268 300 319 State/Muni. Govt. Pension Plans 209 224 242 253 254 242 256 261 Sov. Wealth Funds and For. Official Inst. 111 118 127 129 137 133 133 133 Broker-Dealers 5 7 71 85 89 91 93 91 SEC-Registered Investment Companies 33 39 49 48 58 50 49 81 Non-U.S. Individuals 51 57 60 62 68 69 68 69 Insurance Companies 53 57 59 61 65 65 65 67 Unknown Non-U.S. Investors 49 55 58 61 66 68 61 56 State/Muni. Govt. Entities 22 23 25 26 38 38 41 44 Banking/Thrift Inst. 32 34 34 36 36 36 33 37
Table 13: Beneficial Ownership for Qualifying Hedge Funds (Percent of Aggregate NAV)
As reported on Form PF, Questions 9 and 16.
Type 2013Q2 2013Q3 2013Q4 2014Q1 2014Q2 2014Q3 2014Q4 2015Q1 Private Funds 23.8 23.0 21.2 21.3 20.8 21.3 20.9 20.5 Non-Profits 14.1 13.9 13.4 13.1 13.3 13.7 13.4 13.4 Pension Plans 12.6 12.6 12.2 12.5 12.3 12.0 12.5 12.8 U.S. Individuals 12.9 12.9 12.8 12.3 12.3 12.3 12.0 12.1 Other 9.3 9.5 9.9 9.8 10.3 10.3 11.2 11.3 State/Muni. Govt. Pension Plans 10.0 10.2 10.1 10.3 9.7 9.3 9.6 9.3 Sov. Wealth Funds and For. Official Inst. 5.3 5.4 5.3 5.2 5.2 5.1 5.0 4.7 Broker-Dealers 0.3 0.3 3.0 3.4 3.4 3.5 3.5 3.2 SEC-Registered Investment Companies 1.6 1.8 2.1 2.0 2.2 1.9 1.8 2.9 Non-U.S. Individuals 2.4 2.6 2.5 2.5 2.6 2.6 2.5 2.5 Insurance Companies 2.5 2.6 2.5 2.5 2.5 2.5 2.4 2.4 Unknown Non-U.S. Investors 2.4 2.5 2.4 2.5 2.5 2.6 2.3 2.0 State/Muni. Govt. Entities 1.1 1.1 1.1 1.1 1.5 1.5 1.5 1.6 Banking/Thrift Inst. 1.5 1.5 1.4 1.5 1.4 1.4 1.3 1.3
13

December 30, 2015 Risk and Examinations Office
Table 14: Beneficial Ownership for Section 3 Liquidity Funds ($ Billions) As reported on Form PF, Questions 9 and 16.
Type 2013Q2 2013Q3 2013Q4 2014Q1 2014Q2 2014Q3 2014Q4 2015Q1 Private Funds 69 68 68 67 75 80 75 86 Other 45 39 35 37 37 43 63 45 Unknown Non-U.S. Investors 35 47 46 46 37 58 40 44 Non-U.S. Individuals *** *** *** 22 38 20 20 35 SEC-Registered Investment Companies 19 18 18 17 18 17 15 17 Banking/Thrift Inst. 9 9 13 16 17 19 14 *** Broker-Dealers *** *** *** *** *** *** *** *** Sov. Wealth Funds and For. Official Inst. *** 10 10 *** 11 *** 11 *** Insurance Companies 7 8 9 9 7 9 10 9 Pension Plans 7 8 8 7 *** 6 5 6 State/Muni. Govt. Entities *** *** *** *** *** *** *** *** State/Muni. Govt. Pension Plans *** *** *** *** *** *** *** *** Non-Profits *** *** *** *** *** *** *** *** U.S. Individuals *** *** *** 0 0 0 0 0
Table 15: Beneficial Ownership for Section 3 Liquidity Funds (Percent of Aggregate NAV)
As reported on Form PF, Questions 9 and 16.
Type 2013Q2 2013Q3 2013Q4 2014Q1 2014Q2 2014Q3 2014Q4 2015Q1 Private Funds 28.0 28.5 28.5 27.4 28.8 28.7 27.7 30.5 Other 18.1 16.2 14.7 15.0 14.2 15.5 23.4 15.7 Unknown Non-U.S. Investors 14.4 19.6 19.3 18.6 14.3 20.9 14.9 15.6 Non-U.S. Individuals *** *** *** 9.0 14.7 7.3 7.3 12.3 SEC-Registered Investment Companies 7.8 7.4 7.4 6.8 7.0 6.2 5.6 5.9 Banking/Thrift Inst. 3.6 3.8 5.6 6.4 6.5 6.8 5.2 *** Broker-Dealers *** *** *** *** *** *** *** *** Sov. Wealth Funds and For. Official Inst. *** 4.4 4.4 *** 4.1 *** 4.1 *** Insurance Companies 2.8 3.3 3.6 3.7 2.8 3.3 3.5 3.2 Pension Plans 2.9 3.3 3.4 2.9 *** 2.1 1.9 2.0 State/Muni. Govt. Entities *** *** *** *** *** *** *** *** State/Muni. Govt. Pension Plans *** *** *** *** *** *** *** *** Non-Profits *** *** *** *** *** *** *** *** U.S. Individuals *** *** *** 0.0 0.0 0.0 0.0 0.0
14

December 30, 2015 Risk and Examinations Office
Table 16: Beneficial Ownership for Section 4 Private Equity Funds ($ Billions) As reported on Form PF, Questions 9 and 16.
Type 2013Q2 2013Q3 2013Q4 2014Q1 2014Q2 2014Q3 2014Q4 2015Q1 State/Muni. Govt. Pension Plans 246 247 285 283 284 286 300 302 Private Funds 230 230 266 266 266 268 277 278 Pension Plans 104 107 119 116 118 119 123 125 Sov. Wealth Funds and For. Official Inst. 90 91 112 112 113 113 124 124 Other 83 83 95 95 95 96 110 110 Non-Profits 66 68 78 77 77 76 80 80 U.S. Individuals 62 63 72 72 72 72 79 79 Insurance Companies 61 61 72 71 71 72 75 76 Banking/Thrift Inst. 45 45 46 45 45 45 35 35 Non-U.S. Individuals 23 23 31 33 33 33 33 32 State/Muni. Govt. Entities 14 14 15 15 15 15 16 16 Unknown Non-U.S. Investors 16 16 14 14 14 14 11 11 SEC-Registered Investment Companies 3 3 2 2 2 2 3 3 Broker-Dealers 1 1 1 1 1 1 1 1
Table 17: Beneficial Ownership for Section 4 Private Equity Funds (Percent of Aggregate NAV)
As reported on Form PF, Questions 9 and 16.
Type 2013Q2 2013Q3 2013Q4 2014Q1 2014Q2 2014Q3 2014Q4 2015Q1 State/Muni. Govt. Pension Plans 23.6 23.5 23.6 23.6 23.6 23.7 23.6 23.6 Private Funds 22.1 22.0 22.1 22.1 22.1 22.1 21.8 21.7 Pension Plans 10.0 10.2 9.9 9.6 9.8 9.8 9.6 9.8 Sov. Wealth Funds and For. Official Inst. 8.7 8.7 9.3 9.4 9.4 9.3 9.7 9.7 Other 8.0 7.9 7.9 7.9 7.9 8.0 8.6 8.6 Non-Profits 6.4 6.5 6.4 6.4 6.4 6.3 6.3 6.3 U.S. Individuals 6.0 6.0 6.0 6.0 6.0 5.9 6.2 6.2 Insurance Companies 5.9 5.8 5.9 5.9 5.9 5.9 5.9 5.9 Banking/Thrift Inst. 4.3 4.3 3.8 3.8 3.8 3.7 2.8 2.7 Non-U.S. Individuals 2.2 2.2 2.6 2.8 2.7 2.7 2.6 2.5 State/Muni. Govt. Entities 1.3 1.3 1.3 1.2 1.2 1.2 1.2 1.2 Unknown Non-U.S. Investors 1.5 1.5 1.1 1.1 1.1 1.1 0.9 0.9 SEC-Registered Investment Companies 0.3 0.2 0.2 0.2 0.2 0.2 0.2 0.2 Broker-Dealers 0.1 0.1 0.1 0.1 0.1 0.1 0.1 0.1
15

December 30, 2015 Risk and Examinations Office
V Derivatives
Table 18: Aggregate Derivative Notional ($ Billions) As reported on Form PF, Questions 13 and 44 (Third Month).
The “Total” row shows the total reported, and will not equal the sum of the preceding rows, because the rows are not mutually exclusive.
Type 2013Q2 2013Q3 2013Q4 2014Q1 2014Q2 2014Q3 2014Q4 2015Q1 Hedge Fund 13,792 13,885 13,151 14,382 16,984 15,929 14,592 14,473 Qualifying Hedge Fund 11,664 12,669 11,995 13,264 15,889 14,713 13,316 13,351 Other Private Fund 78 76 88 101 102 101 127 121 Private Equity Fund 49 49 47 47 47 48 66 69 Section 4 Private Equity Fund 45 45 43 43 43 43 60 60 Securitized Asset Fund 70 70 45 45 45 45 27 29 Real Estate Fund 12 12 12 12 12 12 13 13 Liquidity Fund *** *** *** *** *** *** *** *** Section 3 Liquidity Fund *** *** *** *** *** *** *** *** Venture Capital Fund 0 0 0 0 0 0 0 0 Total 13,999 14,090 13,341 14,583 17,185 16,114 14,808 14,689
Table 19: Aggregate Derivative Notional (Percent of Aggregate NAV) As reported on Form PF, Questions 9, 13, and 44 (Third Month).
Type 2013Q2 2013Q3 2013Q4 2014Q1 2014Q2 2014Q3 2014Q4 2015Q1 Hedge Fund 513.7 493.3 427.3 454.9 513.4 474.2 429.2 404.3 Qualifying Hedge Fund 559.6 577.5 500.4 536.9 604.9 564.6 498.4 474.8 Other Private Fund 11.9 11.4 10.8 12.2 12.3 12.2 14.4 13.6 Private Equity Fund 3.3 3.3 2.8 2.8 2.8 2.8 3.8 3.9 Section 4 Private Equity Fund 4.3 4.2 3.5 3.6 3.5 3.5 4.7 4.7 Securitized Asset Fund 61.9 60.8 38.8 37.3 35.9 35.6 23.4 25.4 Real Estate Fund 5.0 5.0 4.4 4.4 4.4 4.4 4.6 4.6 Liquidity Fund *** *** *** *** *** *** *** *** Section 3 Liquidity Fund *** *** *** *** *** *** *** *** Venture Capital Fund 0.3 0.3 0.2 0.2 0.2 0.2 0.1 0.1 Total 258.3 252.8 214.1 230.4 264.0 246.1 220.7 212.5
16

December 30, 2015 Risk and Examinations Office
Figure 4: Distribution of Derivative Notional Values See Appendix C and Appendix D for an explanation of boxplots and winsorization.
As reported on Form PF, Questions 13 and 44 (Third Month).
2013
Q2
2013
Q3
2013
Q4
2014
Q1
2014
Q2
2014
Q3
2014
Q4
2015
Q10.00.20.40.60.81.01.21.41.61.8
Tota
l Der
ivat
ive
Valu
e ($
Billi
ons)
Win
soriz
ed (l
imits
=[1
%,9
9%])
2013
Q2
2013
Q3
2013
Q4
2014
Q1
2014
Q2
2014
Q3
2014
Q4
2015
Q10
2
4
6
8
10
12
Tota
l Der
ivat
ive
Valu
e ($
Billi
ons)
Win
soriz
ed (l
imits
=[1
%,9
9%])
(a) All Private Funds (b) Qualifying Hedge Funds
VI High Frequency Trading
Table 20: Number of Hedge Funds Using High Frequency Trading (HFT) Strategies
As reported on Form PF, Questions 9 and 21.
Fraction of NAV 2013Q2 2013Q3 2013Q4 2014Q1 2014Q2 2014Q3 2014Q4 2015Q1 0% 6,080 6,257 6,715 6,796 6,929 6,995 7,161 7,309 Less than 100% 53 54 59 57 55 53 45 39 100% or More 15 15 13 27 24 28 28 25
Table 21: Hedge Fund Assets Managed Using HFT Strategies ($ Billions) As reported on Form PF, Question 21.
Fraction of NAV 2013Q2 2013Q3 2013Q4 2014Q1 2014Q2 2014Q3 2014Q4 2015Q1 0% 2,574 2,705 2,946 3,044 3,205 3,258 3,299 3,468 Less than 100% 64 67 65 78 54 37 35 41 100% or More 16 16 35 19 31 30 32 34
17

December 30, 2015 Risk and Examinations Office
VII Information Reported by Large Hedge Fund Advisers
A Economic Leverage
Figure 5: Ratio of Hedge Fund Gross Notional Exposure to Net Asset Value See Appendix C and Appendix D for an explanation of boxplots and winsorization.
As reported on Form PF, Questions 3(a) and 26.
2013
-06
2013
-09
2013
-12
2014
-03
2014
-06
2014
-09
2014
-12
2015
-030
2
4
6
8
10
12
14
Ratio
of G
NE
to N
AV
Win
soriz
ed (l
imits
=[0
%,9
8%])
2013
-06
2013
-09
2013
-12
2014
-03
2014
-06
2014
-09
2014
-12
2015
-030
2
4
6
8
10
12
14
Ratio
of G
NE
(w/o
IRD
s) to
NA
V W
inso
rized
(lim
its=
[0%
,98%
])
(a) Gross Exposure with Interest Rate Derivatives (IRDs) (b) Gross Exposure without IRDs
18

December 30, 2015 Risk and Examinations Office
Figure 6: Ratio of Hedge Fund Long Notional Exposure (LNE) and Short Notional Exposure (SNE) to Net Asset Value Distribution
See Appendix C and Appendix D for an explanation of boxplots and winsorization. As reported on Form PF, Questions 3(a) and 26.
2013
-06
2013
-09
2013
-12
2014
-03
2014
-06
2014
-09
2014
-12
2015
-030
2
4
6
8
10
Ratio
of L
NE
to N
AV
Win
soriz
ed (l
imits
=[0
%,9
8%])
2013
-06
2013
-09
2013
-12
2014
-03
2014
-06
2014
-09
2014
-12
2015
-030
2
4
6
8
10
Ratio
of L
NE
(w/o
IRD
s) to
NA
V W
inso
rized
(lim
its=
[0%
,98%
])(a) Long Exposure with IRDs (b) Long Exposure without IRDs
2013
-06
2013
-09
2013
-12
2014
-03
2014
-06
2014
-09
2014
-12
2015
-030
2
4
6
8
10
Ratio
of S
NE
to N
AV
Win
soriz
ed (l
imits
=[0
%,9
8%])
2013
-06
2013
-09
2013
-12
2014
-03
2014
-06
2014
-09
2014
-12
2015
-030
2
4
6
8
10
Ratio
of S
NE
(w/o
IRD
s) to
NA
V W
inso
rized
(lim
its=
[0%
,98%
])
(c) Short Exposure with IRDs (d) Short Exposure without IRDs
19

December 30, 2015 Risk and Examinations Office
B Industry Concentration
Table 22: Large Hedge Fund Adviser Asset and Exposure Concentration (Percent of Total Reported)
As reported on Form PF, Questions 3(a) and 26.
Month 2013-04 2013-05 2013-06 2013-07 2013-08 2013-09 2013-10 2013-11 2013-12 2014-01 2014-02 2014-03 2014-04 2014-05 2014-06 2014-07 2014-08 2014-09 2014-10 2014-11 2014-12 2015-01 2015-02 2015-03
Top 10 Advisers (NAV) Top 20 Advisers (NAV) Top 10 Advisers (GNE) Top 20 Advisers (GNE) 17.0 17.2 17.2 18.4 17.1 17.1 17.9 17.6 17.6 17.8 18.0 18.0 17.7 17.7 17.7 16.4 16.4 16.4 20.6 20.6 20.6 17.3 17.2 17.3
27.1 27.5 27.5 28.0 26.8 26.8 27.8 27.5 27.5 27.6 27.9 27.9 27.1 27.1 27.1 25.9 25.9 25.9 30.0 30.0 30.0 26.8 26.7 26.9
47.1 47.4 47.5 47.2 46.7 45.3 43.9 45.5 43.0 45.4 45.8 43.3 40.7 41.7 40.3 41.0 42.2 41.4 41.6 42.1 41.1 40.0 40.1 38.6
60.9 60.0 59.7 59.3 59.1 58.6 56.9 58.5 56.4 57.7 58.0 56.2 54.0 54.7 53.4 54.0 55.0 53.7 54.2 54.5 53.4 53.1 53.2 52.1
20

December 30, 2015 Risk and Examinations Office
C Portfolio Turnover
Table 23: Aggregate Portfolio Turnover ($ Billions) As reported on Form PF, Question 27.
Month Futures Sov. and muni. bonds Listed equities Corporate bonds Convertible bonds Total 2013-04 9,293 2,415 1,758 89 21 13,501 2013-05 11,444 2,717 1,740 102 26 15,912 2013-06 18,097 2,604 1,605 66 19 22,287 2013-07 8,136 2,025 1,563 62 16 11,725 2013-08 8,340 2,043 4,956 46 17 15,314 2013-09 12,356 2,157 1,461 94 21 15,979 2013-10 8,299 2,171 1,826 97 33 12,322 2013-11 8,852 1,942 1,553 91 28 12,356 2013-12 11,533 1,934 1,443 66 22 14,898 2014-01 10,957 2,357 1,968 99 30 15,248 2014-02 9,985 2,190 1,886 92 29 14,077 2014-03 17,827 2,395 1,860 109 55 22,094 2014-04 9,899 2,319 2,357 108 20 14,613 2014-05 11,116 2,276 2,077 100 23 15,546 2014-06 20,520 2,341 2,200 100 29 25,126 2014-07 9,105 2,347 1,720 89 19 13,205 2014-08 9,177 2,220 1,430 66 14 12,840 2014-09 12,784 2,572 1,509 107 23 16,899 2014-10 12,662 2,760 2,304 118 20 17,766 2014-11 8,427 1,983 1,534 88 17 12,019 2014-12 11,353 2,210 1,656 74 17 15,266 2015-01 9,726 2,339 1,812 93 17 13,962 2015-02 10,042 2,304 1,712 111 23 14,158 2015-03 11,421 2,291 1,856 123 24 15,680
Figure 7: Distributions of Portfolio Turnover See Appendix C and Appendix D for an explanation of boxplots and winsorization.
As reported on Form PF, Questions 3(a) and 27.
2013
-06
2013
-09
2013
-12
2014
-03
2014
-06
2014
-09
2014
-12
2015
-030
10
20
30
40
50
60
Tota
l Tur
nove
r ($B
illio
ns)
Win
soriz
ed (l
imits
=[1
%,9
9%])
2013
-06
2013
-09
2013
-12
2014
-03
2014
-06
2014
-09
2014
-12
2015
-0302468
1012141618
Ratio
of T
urno
ver t
o N
AV
Win
soriz
ed (l
imits
=[1
%,9
9%])
(a) Total Turnover (b) Total Turnover to NAV Ratio
21

December 30, 2015 Risk and Examinations Office
D Region and Country Exposure
Table 24: Large Hedge Fund Adviser Hedge Fund Region Exposure ($ Billions)
As reported on Form PF, Questions 3(a) and 28.
Region 2013Q2 2013Q3 2013Q4 2014Q1 2014Q2 2014Q3 2014Q4 2015Q1 North America 3,237 3,323 3,537 3,539 3,840 3,970 3,954 3,969 Europe EEA 1,163 1,128 1,243 1,323 1,354 1,290 1,129 1,234 Asia 577 619 605 557 687 632 612 605 South America 99 69 76 76 90 100 92 86 Europe Other 80 81 78 71 86 83 71 73 Supranational 33 27 27 41 42 41 39 41 Africa 18 21 17 22 26 25 20 24 Middle East 9 10 10 13 12 13 14 17
Region 2013Q2 2013Q3 2013Q4 2014Q1 2014Q2 2014Q3 2014Q4 2015Q1 North America 143.6 142.2 135.0 132.5 134.3 140.8 129.9 131.6 Europe EEA 51.6 48.2 47.4 49.5 47.4 45.8 37.1 40.9 Asia 25.6 26.5 23.1 20.8 24.0 22.4 20.1 20.0 South America 4.4 3.0 2.9 2.8 3.1 3.6 3.0 2.9 Europe Other 3.6 3.4 3.0 2.7 3.0 2.9 2.3 2.4 Supranational 1.5 1.2 1.0 1.5 1.5 1.5 1.3 1.4 Africa 0.8 0.9 0.7 0.8 0.9 0.9 0.7 0.8 Middle East 0.4 0.4 0.4 0.5 0.4 0.5 0.5 0.6
Table 25: Large Hedge Fund Adviser Hedge Fund Region Exposure (Percent of Aggregate NAV)
As reported on Form PF, Questions 3(a) and 28.
22

December 30, 2015 Risk and Examinations Office
Table 26: Large Hedge Fund Adviser Hedge Fund Country Exposure ($ Billions)
As reported on Form PF, Questions 3(a) and 28.
Country 2013Q2 2013Q3 2013Q4 2014Q1 2014Q2 2014Q3 2014Q4 2015Q1 United States 3,048 3,091 3,330 3,360 3,635 3,769 3,757 3,762 Japan 278 282 258 234 266 244 237 230 China (Inc. Hong Kong) 99 119 90 112 202 134 142 149 Brazil 57 29 29 31 43 39 41 41 India 25 20 20 22 27 25 27 33 Russia 17 22 18 14 17 16 10 9
Table 27: Large Hedge Fund Adviser Hedge Fund Country Exposure (Percent of Aggregate NAV)
As reported on Form PF, Questions 3(a) and 28.
Country 2013Q2 2013Q3 2013Q4 2014Q1 2014Q2 2014Q3 2014Q4 2015Q1 United States 135.2 132.2 127.1 125.8 127.1 133.7 123.4 124.7 Japan 12.3 12.1 9.9 8.8 9.3 8.7 7.8 7.6 China (Inc. Hong Kong) 4.4 5.1 3.4 4.2 7.1 4.8 4.7 5.0 Brazil 2.5 1.2 1.1 1.2 1.5 1.4 1.3 1.4 India 1.1 0.8 0.8 0.8 0.9 0.9 0.9 1.1 Russia 0.8 1.0 0.7 0.5 0.6 0.6 0.3 0.3
23

December 30, 2015 Risk and Examinations Office
VIII Qualifying Hedge Fund Specific Information
A Gross Exposure by Strategy5
Table 28: Exposures of Hedge Funds ($ Billions) As reported on Form PF, Questions 9 and 20.
Category Strategy 2013Q2 2013Q3 2013Q4 2014Q1 2014Q2 2014Q3 2014Q4 2015Q1
Equity
Subtotal 1,083 1,164 1,306 1,338 1,453 1,432 1,508 1,609 Long/Short 691 752 854 867 909 904 924 983 Market Neutral 218 222 239 254 275 294 309 *** Long Bias 170 187 209 209 263 232 270 265 Short Bias 3 3 5 8 5 2 5 ***
Relative Value
Subtotal 422 442 628 654 689 774 717 841 F.I. Sov. 230 229 387 414 433 520 470 578 F.I. Asset Backed 87 105 112 114 128 133 128 139 F.I. Corp. 44 45 54 54 59 54 51 53 F.I. Conv. Arb. 40 43 48 46 48 47 49 50 Volatility Arb. 21 20 28 25 21 19 19 21
Other Subtotal 554 584 646 667 712 728 750 764
Macro
Subtotal 336 509 384 403 438 384 441 453 Global Macro 244 412 275 291 306 297 333 357 Currency 30 31 42 46 53 *** 48 48 Commodity 61 65 65 65 79 40 59 47 Active Trading 1 1 1 1 1 *** 1 1
Event Driven
Subtotal 278 298 343 365 412 427 403 417 Distressed/Restruct. 169 179 188 196 192 185 178 185 Equity 64 69 93 109 140 145 138 150 Risk Arb./Merger Arb. 45 50 62 60 80 97 88 82
Credit Subtotal 233 244 266 278 299 291 299 291 Long/Short 211 220 243 254 273 264 272 261 Asset Based Lending 22 24 23 24 25 27 27 29
Managed Futures/CTA Subtotal 49 51 63 58 67 70 90 96 Quantitative 45 *** *** *** *** *** *** *** Fundamental 4 *** *** *** *** *** *** ***
Investment in other funds Subtotal 25 28 45 47 49 52 49 47
Total Total 2,979 3,318 3,681 3,810 4,119 4,158 4,256 4,518
5Form PF Question 20 requires advisers to indicate which strategies best describe the reporting fund’s strategies including a good faith estimate of the reporting fund’s allocation among strategies, and provides a list of investment strategies for this purpose. Form PF does not define the investment strategies listed by Question 20.
24

December 30, 2015 Risk and Examinations Office
Table 29: Exposures of Hedge Funds (Percent of NAV) As reported on Form PF, Questions 9 and 20.
Category Strategy 2013Q2 2013Q3 2013Q4 2014Q1 2014Q2 2014Q3 2014Q4 2015Q1
Equity
Subtotal 49.8 51.2 52.0 51.5 52.6 52.4 53.9 54.2 Long/Short 31.8 33.1 34.0 33.4 33.0 33.0 33.0 33.1 Market Neutral 10.1 9.7 9.5 9.8 10.0 10.8 11.1 *** Long Bias 7.8 8.2 8.3 8.0 9.5 8.5 9.6 8.9 Short Bias 0.1 0.1 0.2 0.3 0.2 0.1 0.2 ***
Relative Value
Subtotal 19.4 19.5 25.0 25.2 25.0 28.3 25.6 28.3 F.I. Sov. 10.6 10.1 15.4 15.9 15.7 19.0 16.8 19.5 F.I. Asset Backed 4.0 4.6 4.4 4.4 4.6 4.9 4.6 4.7 F.I. Corp. 2.0 2.0 2.1 2.1 2.1 2.0 1.8 1.8 F.I. Conv. Arb. 1.8 1.9 1.9 1.8 1.8 1.7 1.7 1.7 Volatility Arb. 1.0 0.9 1.1 1.0 0.8 0.7 0.7 0.7
Other Subtotal 25.5 25.7 25.7 25.7 25.8 26.6 26.8 25.7
Macro
Subtotal 15.4 22.4 15.3 15.5 15.9 14.0 15.8 15.2 Global Macro 11.2 18.1 10.9 11.2 11.1 10.8 11.9 12.0 Currency 1.4 1.4 1.7 1.8 1.9 *** 1.7 1.6 Commodity 2.8 2.9 2.6 2.5 2.9 1.5 2.1 1.6 Active Trading 0.0 0.0 0.1 0.0 0.0 *** 0.0 0.0
Event Driven
Subtotal 12.8 13.1 13.7 14.1 14.9 15.6 14.4 14.0 Distressed/Restruct. 7.8 7.9 7.5 7.6 7.0 6.8 6.3 6.2 Equity 2.9 3.0 3.7 4.2 5.1 5.3 4.9 5.0 Risk Arb./Merger Arb. 2.1 2.2 2.5 2.3 2.9 3.5 3.1 2.8
Credit Subtotal 10.7 10.7 10.6 10.7 10.8 10.6 10.7 9.8 Long/Short 9.7 9.7 9.7 9.8 9.9 9.6 9.7 8.8 Asset Based Lending 1.0 1.0 0.9 0.9 0.9 1.0 1.0 1.0
Managed Futures/CTA Subtotal 2.3 2.2 2.5 2.2 2.4 2.5 3.2 3.2 Quantitative 2.1 *** *** *** *** *** *** *** Fundamental 0.2 *** *** *** *** *** *** ***
Investment in other funds Subtotal 1.1 1.2 1.8 1.8 1.8 1.9 1.8 1.6
Total Total 137.1 146.0 146.4 146.7 149.3 152.0 152.0 152.1
25

December 30, 2015 Risk and Examinations Office
B Liquidity
Table 30: Investor Liquidity for Qualifying Hedge Funds (Percent of Aggregate NAV) As reported on Form PF, Questions 9 and 50.
Liquidation Period 2013Q2 2013Q3 2013Q4 2014Q1 2014Q2 2014Q3 2014Q4 2015Q1 At most 1 day 6.8 6.5 7.7 9.9 7.8 6.0 7.6 6.9 At most 7 days 8.9 8.7 11.3 11.9 11.0 9.7 11.4 13.1 At most 30 days 22.9 22.3 24.5 26.2 24.3 23.7 25.9 27.6 At most 90 days 43.1 44.0 48.5 44.8 44.2 44.9 49.8 47.1 At most 180 days 58.4 59.8 57.9 59.5 58.4 61.4 59.0 60.8 At most 365 days 75.8 74.8 75.5 76.0 75.6 75.3 75.5 75.1
Table 31: Portfolio Liquidity for Qualifying Hedge Funds (Percent of Aggregate NAV) As reported on Form PF, Questions 9 and 32.
Liquidation Period 2013Q2 2013Q3 2013Q4 2014Q1 2014Q2 2014Q3 2014Q4 2015Q1 At most 1 day 28.6 28.3 28.6 29.4 29.7 29.0 29.2 30.3 At most 7 days 56.5 56.2 57.0 58.1 57.9 57.3 56.6 58.4 At most 30 days 74.1 74.5 75.1 75.5 75.1 74.7 74.3 75.3 At most 90 days 82.3 82.7 83.4 83.2 82.8 83.0 83.3 83.7 At most 180 days 85.8 86.5 87.1 87.1 86.7 87.4 87.5 87.3 At most 365 days 89.9 90.4 90.8 90.5 90.4 90.8 90.8 90.8
Figure 8: Asset Weighted-Average Qualifying Hedge Fund Investor and Portfolio Liquidity Reported on Form PF as of First Calendar Quarter 2015
As reported on Form PF, Questions 9, 32, and 50.
At most
1 day
At most
7 day
s
At most
30 da
ys
At most
90 da
ys
At most
180 d
ays
At most
365 d
ays0
20
40
60
80
100
Perc
ent o
f Fun
d N
et A
sset
s (%
)
Portfolio Liquidity Investor Liquidity
26

December 30, 2015 Risk and Examinations Office
Table 32: Restrictions on Qualifying Hedge Fund Assets ($ Billions) As reported on Form PF, Questions 48 and 49.
Type 2013Q2 2013Q3 2013Q4 2014Q1 2014Q2 2014Q3 2014Q4 2015Q1 May Suspend 1,647 1,747 1,919 1,987 2,105 2,087 2,143 2,294 May Have Gates 1,089 1,144 1,229 1,279 1,365 1,395 1,409 1,450 Gated 25 34 28 29 32 30 41 43 Side Pocketed 41 39 37 37 42 39 39 37 Suspended 16 19 10 10 9 8 13 12
Figure 9: Distribution of the Ratio of Qualifying Hedge Fund Assets Held in Side Pockets to NAV
See Appendix C for an explanation of boxplots. As reported on Form PF, Questions 9 and 48.
2013
Q2
2013
Q3
2013
Q4
2014
Q1
2014
Q2
2014
Q3
2014
Q4
2015
Q10
5
10
15
20
25
30
35
NA
V in
Sid
e-Po
cket
(%)
C Borrowings
Table 33: Borrowings of Qualifying Hedge Funds ($ Billions) As reported on Form PF, Question 43 (Third Month).
Type Subtype 2013Q2 2013Q3 2013Q4 2014Q1 2014Q2 2014Q3 2014Q4 2015Q1
Secured
Subtotal 1,755 1,700 1,698 1,777 1,807 1,847 1,874 1,999 Prime Broker 835 846 926 997 990 985 1,039 1,077 Reverse Repo 695 598 508 500 547 576 555 647 Other Secured 225 256 265 279 270 286 280 276
Unsecured Subtotal 5 7 7 10 11 11 9 8
Total Total 1,760 1,706 1,705 1,787 1,818 1,858 1,883 2,007
27

December 30, 2015 Risk and Examinations Office
D Central Clearing
Figure 10: Qualifying Hedge Funds Using Central Clearing As reported on Form PF, Question 39.
2013
Q2
2013
Q3
2013
Q4
2014
Q1
2014
Q2
2014
Q3
2014
Q4
2015
Q10
5
10
15
20
25
30Percent of Funds Percent of NAV
28
December 30, 2015 Risk and Examinations Office
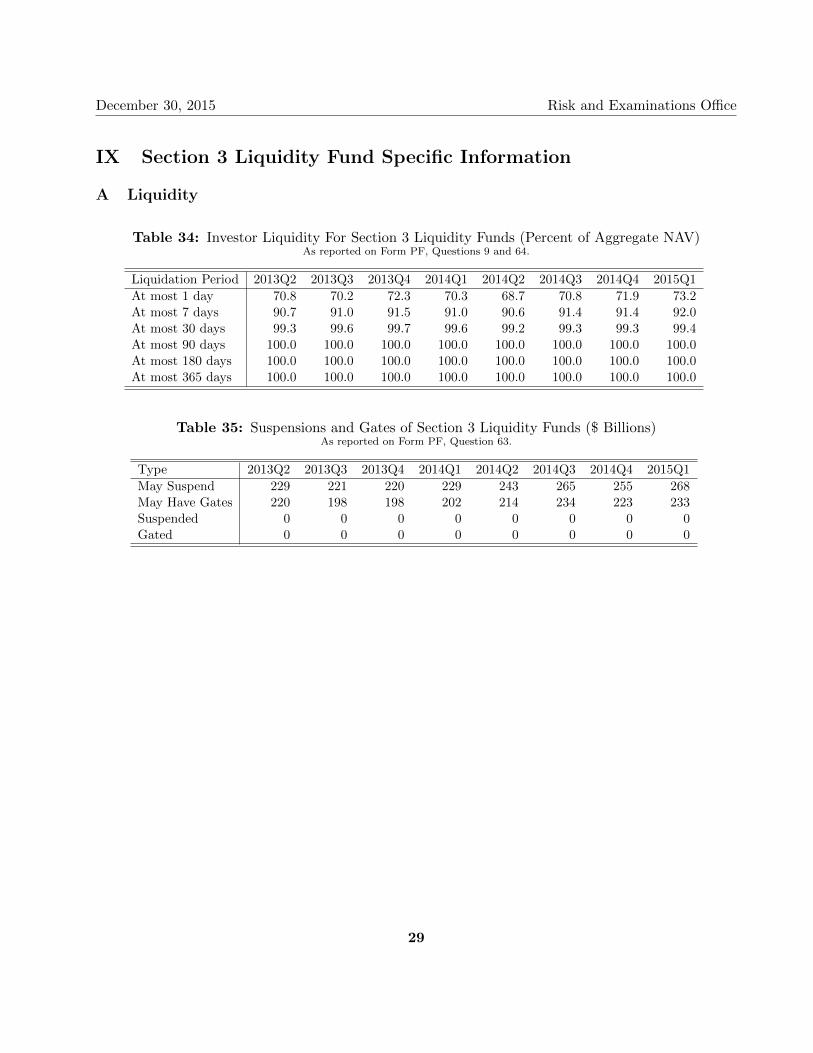
IX Section 3 Liquidity Fund Specific Information
A Liquidity
Table 34: Investor Liquidity For Section 3 Liquidity Funds (Percent of Aggregate NAV) As reported on Form PF, Questions 9 and 64.
Liquidation Period 2013Q2 2013Q3 2013Q4 2014Q1 2014Q2 2014Q3 2014Q4 2015Q1 At most 1 day 70.8 70.2 72.3 70.3 68.7 70.8 71.9 73.2 At most 7 days 90.7 91.0 91.5 91.0 90.6 91.4 91.4 92.0 At most 30 days 99.3 99.6 99.7 99.6 99.2 99.3 99.3 99.4 At most 90 days 100.0 100.0 100.0 100.0 100.0 100.0 100.0 100.0 At most 180 days 100.0 100.0 100.0 100.0 100.0 100.0 100.0 100.0 At most 365 days 100.0 100.0 100.0 100.0 100.0 100.0 100.0 100.0
Table 35: Suspensions and Gates of Section 3 Liquidity Funds ($ Billions) As reported on Form PF, Question 63.
Type 2013Q2 2013Q3 2013Q4 2014Q1 2014Q2 2014Q3 2014Q4 2015Q1 May Suspend 229 221 220 229 243 265 255 268 May Have Gates 220 198 198 202 214 234 223 233 Suspended 0 0 0 0 0 0 0 0 Gated 0 0 0 0 0 0 0 0
29
December 30, 2015 Risk and Examinations Office
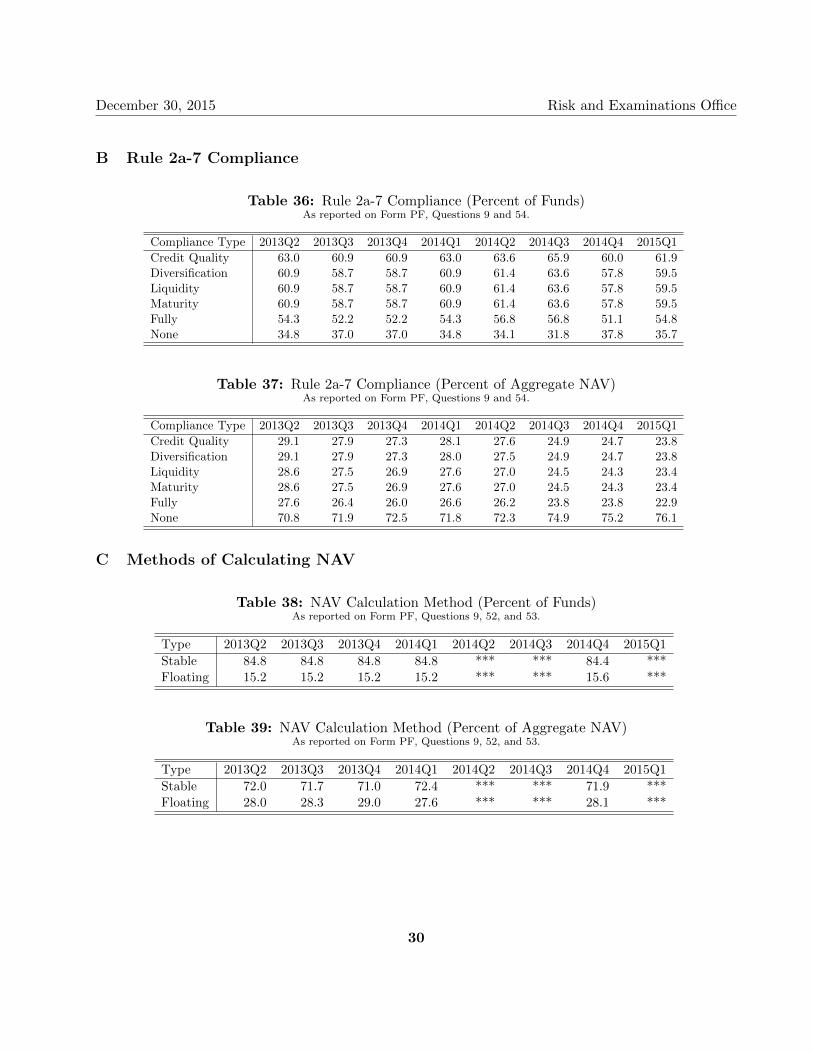
B Rule 2a-7 Compliance
Table 36: Rule 2a-7 Compliance (Percent of Funds) As reported on Form PF, Questions 9 and 54.
Compliance Type 2013Q2 2013Q3 2013Q4 2014Q1 2014Q2 2014Q3 2014Q4 2015Q1 Credit Quality 63.0 60.9 60.9 63.0 63.6 65.9 60.0 61.9 Diversification 60.9 58.7 58.7 60.9 61.4 63.6 57.8 59.5 Liquidity 60.9 58.7 58.7 60.9 61.4 63.6 57.8 59.5 Maturity 60.9 58.7 58.7 60.9 61.4 63.6 57.8 59.5 Fully 54.3 52.2 52.2 54.3 56.8 56.8 51.1 54.8 None 34.8 37.0 37.0 34.8 34.1 31.8 37.8 35.7
Table 37: Rule 2a-7 Compliance (Percent of Aggregate NAV) As reported on Form PF, Questions 9 and 54.
Compliance Type 2013Q2 2013Q3 2013Q4 2014Q1 2014Q2 2014Q3 2014Q4 2015Q1 Credit Quality 29.1 27.9 27.3 28.1 27.6 24.9 24.7 23.8 Diversification 29.1 27.9 27.3 28.0 27.5 24.9 24.7 23.8 Liquidity 28.6 27.5 26.9 27.6 27.0 24.5 24.3 23.4 Maturity 28.6 27.5 26.9 27.6 27.0 24.5 24.3 23.4 Fully 27.6 26.4 26.0 26.6 26.2 23.8 23.8 22.9 None 70.8 71.9 72.5 71.8 72.3 74.9 75.2 76.1
C Methods of Calculating NAV
Table 38: NAV Calculation Method (Percent of Funds) As reported on Form PF, Questions 9, 52, and 53.
Type Stable Floating
2013Q2 84.8 15.2
2013Q3 84.8 15.2
2013Q4 84.8 15.2
2014Q1 84.8 15.2
2014Q2 *** ***
2014Q3 *** ***
2014Q4 84.4 15.6
2015Q1 *** ***
Table 39: NAV Calculation Method (Percent of Aggregate NAV) As reported on Form PF, Questions 9, 52, and 53.
Type 2013Q2 2013Q3 2013Q4 2014Q1 2014Q2 2014Q3 2014Q4 2015Q1 Stable 72.0 71.7 71.0 72.4 *** *** 71.9 *** Floating 28.0 28.3 29.0 27.6 *** *** 28.1 ***
30
December 30, 2015 Risk and Examinations Office
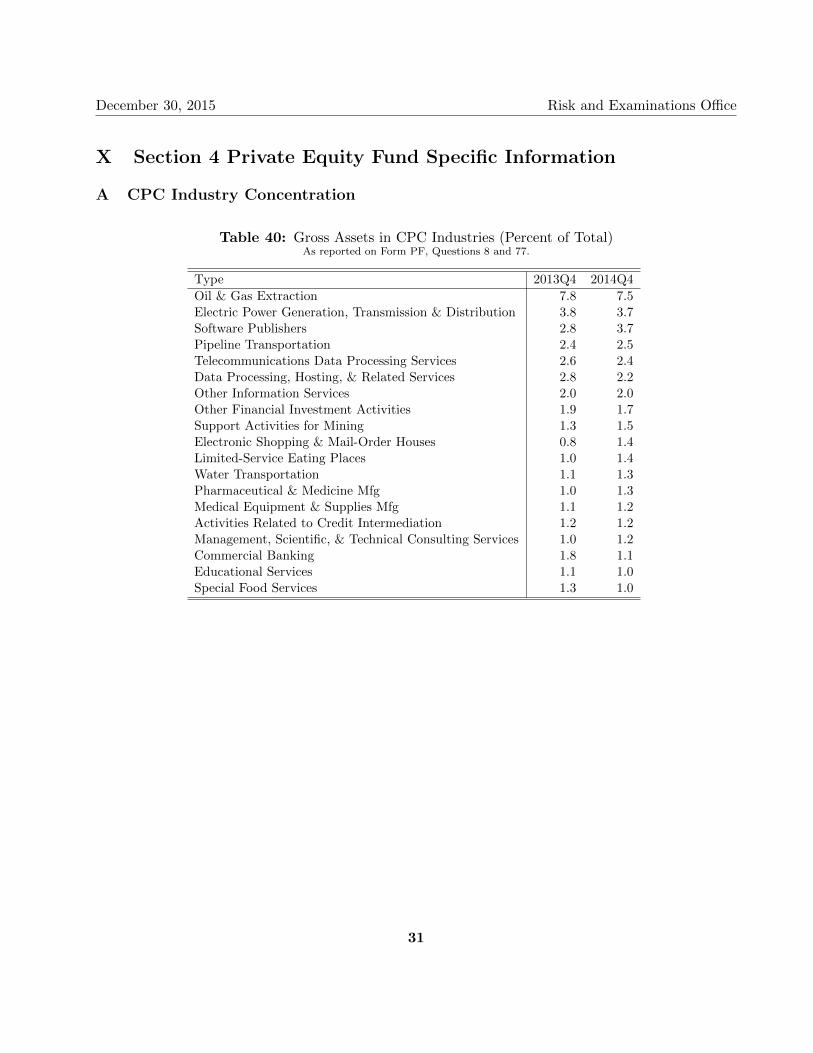
X Section 4 Private Equity Fund Specific Information
A CPC Industry Concentration
Table 40: Gross Assets in CPC Industries (Percent of Total) As reported on Form PF, Questions 8 and 77.
Type 2013Q4 2014Q4 Oil & Gas Extraction 7.8 7.5 Electric Power Generation, Transmission & Distribution 3.8 3.7 Software Publishers 2.8 3.7 Pipeline Transportation 2.4 2.5 Telecommunications Data Processing Services 2.6 2.4 Data Processing, Hosting, & Related Services 2.8 2.2 Other Information Services 2.0 2.0 Other Financial Investment Activities 1.9 1.7 Support Activities for Mining 1.3 1.5 Electronic Shopping & Mail-Order Houses 0.8 1.4 Limited-Service Eating Places 1.0 1.4 Water Transportation 1.1 1.3 Pharmaceutical & Medicine Mfg 1.0 1.3 Medical Equipment & Supplies Mfg 1.1 1.2 Activities Related to Credit Intermediation 1.2 1.2 Management, Scientific, & Technical Consulting Services 1.0 1.2 Commercial Banking 1.8 1.1 Educational Services 1.1 1.0 Special Food Services 1.3 1.0
31

December 30, 2015 Risk and Examinations Office
B CPC Financial Leverage
Figure 11: Distribution of Ratio of Aggregate CPC Current Liabilities to Total Liabilities of Section 4 Private Equity Funds
See Appendix C for an explanation of boxplots. As reported on Form PF, Questions 71 and 72.
2013
Q4
2014
Q40
10
20
30
40
50
60Ra
tio o
f Por
tfolio
Com
pany
Cur
rent
L
iabili
ties t
o To
tal L
iabili
ties (
%)
Figure 12: Distribution of CPC Payment-in-Kind or Zero Coupon Borrowings to Total Borrowings Ratio
See Appendix C for an explanation of boxplots. As reported on Form PF, Question 73.
2013
Q4
2014
Q405
10152025303540
CPC
Paym
ent-i
n-K
ind
Borr
owin
gs
to T
otal
Borr
owin
gs R
atio
(%)
32
December 30, 2015 Risk and Examinations Office
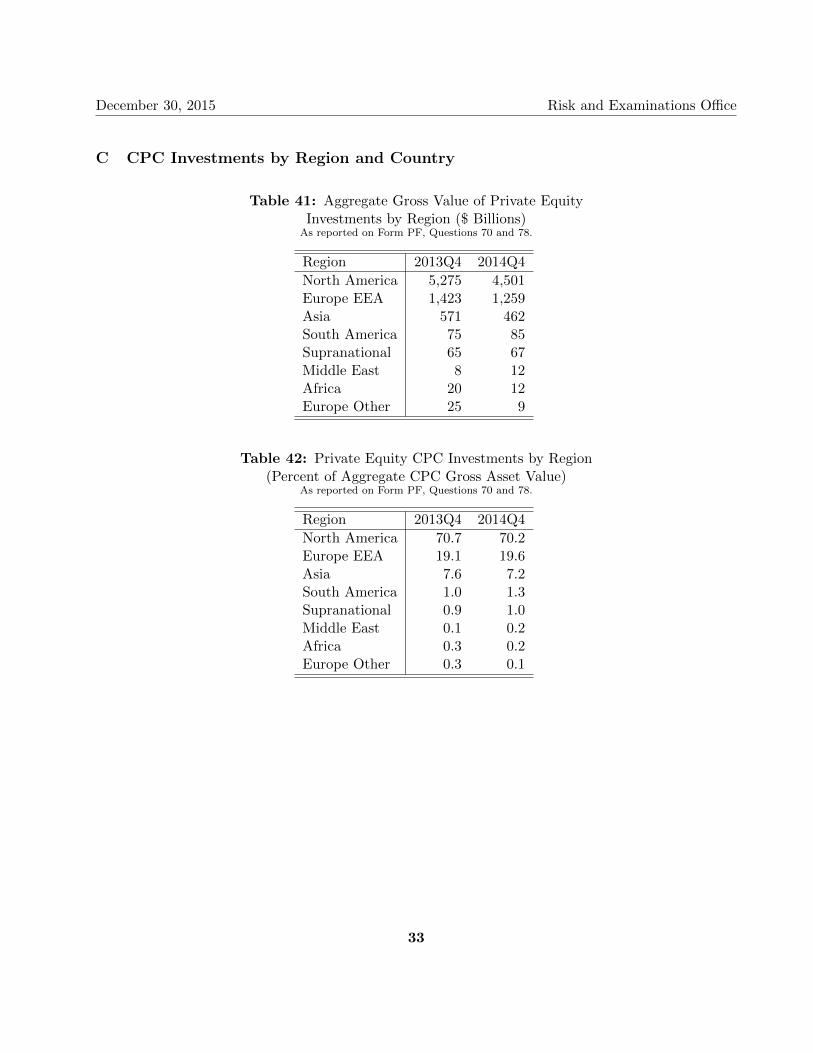
C CPC Investments by Region and Country
Table 41: Aggregate Gross Value of Private Equity Investments by Region ($ Billions)
As reported on Form PF, Questions 70 and 78.
Region 2013Q4 2014Q4 North America 5,275 4,501 Europe EEA 1,423 1,259 Asia 571 462 South America 75 85 Supranational 65 67 Middle East 8 12 Africa 20 12 Europe Other 25 9
Table 42: Private Equity CPC Investments by Region (Percent of Aggregate CPC Gross Asset Value)
As reported on Form PF, Questions 70 and 78.
Region 2013Q4 2014Q4 North America 70.7 70.2 Europe EEA 19.1 19.6 Asia 7.6 7.2 South America 1.0 1.3 Supranational 0.9 1.0 Middle East 0.1 0.2 Africa 0.3 0.2 Europe Other 0.3 0.1
33
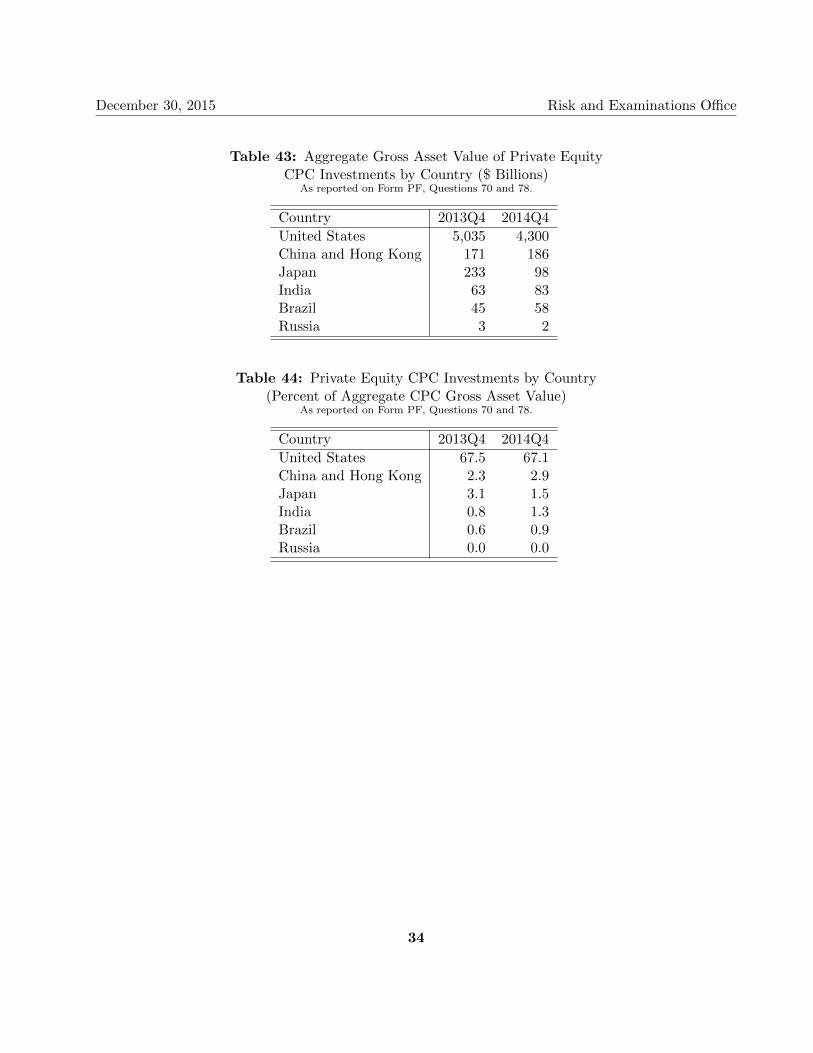
December 30, 2015 Risk and Examinations Office
Table 43: Aggregate Gross Asset Value of Private Equity CPC Investments by Country ($ Billions)
As reported on Form PF, Questions 70 and 78.
Country 2013Q4 2014Q4 United States 5,035 4,300 China and Hong Kong 171 186 Japan 233 98 India 63 83 Brazil 45 58 Russia 3 2
Table 44: Private Equity CPC Investments by Country (Percent of Aggregate CPC Gross Asset Value)
As reported on Form PF, Questions 70 and 78.
Country 2013Q4 2014Q4 United States 67.5 67.1 China and Hong Kong 2.3 2.9 Japan 3.1 1.5 India 0.8 1.3 Brazil 0.6 0.9 Russia 0.0 0.0
34

December 30, 2015 Risk and Examinations Office
XI Appendices
A Form PF Filer Categories
The amount of information an adviser must report and the frequency with which it must report on Form PF depends on the amount of the adviser’s private fund assets and the types of private funds managed. Reporting advisers must identify the types of private funds they manage on Form PF.
1 All Private Fund Advisers
SEC-registered investment advisers with at least $150 million in private fund assets under management are required to file Form PF. Registered investment advisers with less than $150 million in private funds assets under management, exempt reporting advisers, and state-registered advisers report general private fund data on Form ADV, but do not file Form PF.6 Not all Form PF filers report on a quarterly basis. Smaller private fund advisers and all private equity fund advisers file Form PF on an annual basis, while larger hedge fund advisers and larger liquidity fund advisers file the form quarterly.7 As a result of the difference in reporting frequency, information in this report related to funds that are reported annually may be dated by several months.8
2 Large Hedge Fund Advisers
Large Hedge Fund Advisers have at least $1.5 billion in hedge fund assets under management. A Large Hedge Fund Adviser is required to file Form PF quarterly and provide data about each hedge fund it managed during the reporting period (irrespective of the size of the fund).
Large Hedge Fund Advisers must report more information on Form PF about Qualifying Hedge Funds than other hedge funds they manage during the reporting period. A Qualifying Hedge Fund is any hedge fund advised by a Large Hedge Fund Adviser that had a NAV (individually or in combination with any feeder funds, parallel funds, and/or dependent parallel managed accounts) of at least $500 million as of the last day of any month in the fiscal quarter immediately preceding the adviser’s most recently completed fiscal quarter. This report provides information about all hedge funds reported by Large Hedge Fund Advisers, including Qualifying Hedge Funds and smaller hedge funds. This report also provides an overview of certain data reported solely for Qualifying Hedge Funds. 6Note that these thresholds are on a gross basis. Exempt reporting advisers are advisers that rely on the exemptions
from SEC registration in Advisers Act section 203(l) for venture capital fund advisers and section 203(m) for advisers managing less than $150 million in private fund assets in the U.S. 7An adviser may be a large hedge fund adviser that must file quarterly to report data about the hedge funds it manages
as well as a private equity fund adviser that must file only annually to report data about the private equity funds it manages. 8In addition, because some Form PF filers have fiscal year ends that are not December 31, not all Form PF data is filed
as of a single date.
35

December 30, 2015 Risk and Examinations Office
3 Large Liquidity Fund Advisers
Large Liquidity Fund Advisers have at least $1 billion in combined liquidity fund and money market fund assets under management. On a quarterly basis, such advisers report on Form PF data about the liquidity funds they managed during the reporting period (irrespective of the size of the fund). This report contains information about all liquidity funds reported by Large Liquidity Fund Advisers (referred to in this report as “Section 3 Liquidity Funds”).
4 Large Private Equity Fund Advisers
Large Private Equity Fund Advisers have at least a $2 billion in private equity fund assets under management. These advisers are required to file Form PF annually in connection with the private equity funds they managed during the reporting period. Smaller Private Equity Fund Advisers must file annually as well, but provide less detail regarding the private equity funds they manage. This report provides information about private equity funds managed by Large Private Equity Fund Advisers (referred to in this report as “Section 4 Private Equity Funds”).
5 Other Private Fund Advisers
All advisers required to file Form PF that are not Large Hedge Fund Advisers or Large Liquidity Fund Advisers must file Form PF annually to report data about each private fund managed by the adviser.9 These “annual filing advisers” include smaller fund advisers, Large Private Equity Fund advisers, and venture capital fund advisers. Annual filers must provide specific information about each of the private funds they manage on an annual basis.
9This includes “other private funds,” which are private funds that do not meet the Form PF definition of hedge fund, liquidity fund, private equity fund, real estate fund, securitized asset fund, or venture capital fund.
36

December 30, 2015 Risk and Examinations Office
B Handling Annual and Quarterly Data
Only a subset of filers (Large Hedge Fund Advisers and Large Liquidity Fund Advisers) are required to file Form PF quarterly; all other filings are made annually. Annual filings are typically, but not always, made at the end of the calendar year, as Form PF allows filings to be made at the end of an adviser’s fiscal year. In order to present the most complete and recent data possible, while accounting for differences in filing dates, we use the following procedure for determining which data to consider in any given quarter:
First, filings are grouped by their report date within their reported year:
• (Q1): February 15 to May 14
• (Q2): May 15 to August 14
• (Q3): August 15 to November 14
• (Q4): November 15 to February 14
Then, responses for funds that have no information are ‘filled forward’ — essentially, copied from last reported values — up to a maximum of three quarters. Any fund that has no data four quarters after its most recent date is no longer counted or included in any calculations.10
C How to Read a Boxplot
In these figures, the boxes extend from the twenty-fifth percentile to the seventy-fifth percentile, while the levels (the dashed vertical lines) extend from the tenth to the twenty-fifth percentile as well as the seventy-fifth to the ninetieth percentile. Also shown as a red line within the box is the median (the fiftieth percentile) and the horizontal dashed line is mean of the distribution. See Figure 13 for an explanation of each feature.
Figure 13: How to Read a Boxplot
10Form PF has no requirement to inform the SEC if a fund liquidates or otherwise terminates operations. Therefore, liquidations or terminations may not be reflected on this report for up to one year after ceasing operations.
37

December 30, 2015 Risk and Examinations Office
D Mitigating the Effects of Outliers
Form PF data occasionally contains spurious outliers. While REO staff actively engages in outreach to identify and correct such values, not all aberrant values have been corrected as of this writing. To reduce the effect of these outliers on the aggregate measures reported here, we have chosen to winsorize or trim some data sets.
Winsorization is a technique for reducing the effect of outliers by reducing the size of the largest and smallest values in a distribution.11 For example, to calculate a 95%/5% Winsorized data set, all the values above the ninety-fifth percentile are set to the value of the ninety-fifth percentile, and all the values below the fifth percentile are set to the value of the fifth percentile. Effectively, this procedure makes the very largest values smaller (but still large), and all the smallest values larger (but still small). This approach can be more effective than trimming (simply removing the largest and/or smallest values) because it does not change the number of data points and does not change the median or other percentile values within the 95%/5% range. All instances of winsorization or trimming have been noted and include the affected percentiles.
11Such techniques are known as ‘robust statistics’, reviewed for example in Wilcox (2012), Introduction to Robust Estimation & Hypothesis Testing, 3rd Edition.
38
December 30, 2015 Risk and Examinations Office
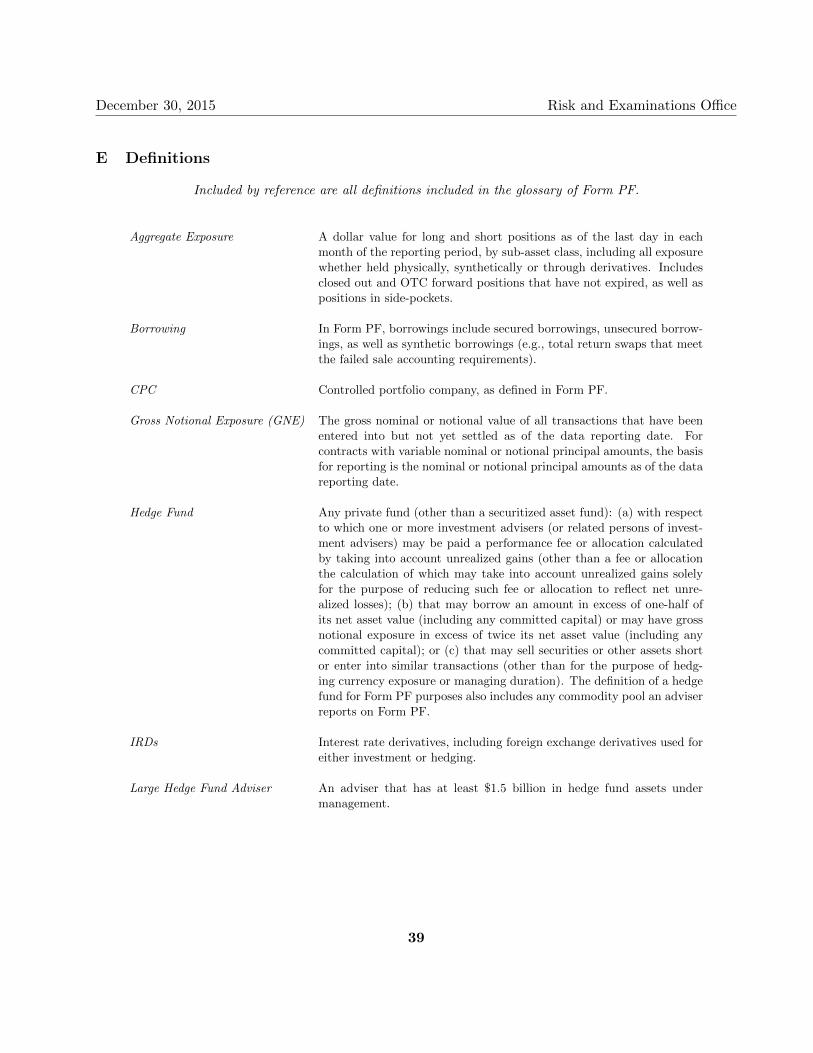
E Definitions
Included by reference are all definitions included in the glossary of Form PF.
Aggregate Exposure A dollar value for long and short positions as of the last day in each month of the reporting period, by sub-asset class, including all exposure whether held physically, synthetically or through derivatives. Includes closed out and OTC forward positions that have not expired, as well as positions in side-pockets.
Borrowing In Form PF, borrowings include secured borrowings, unsecured borrowings, as well as synthetic borrowings (e.g., total return swaps that meet the failed sale accounting requirements).
CPC Controlled portfolio company, as defined in Form PF.
Gross Notional Exposure (GNE) The gross nominal or notional value of all transactions that have been entered into but not yet settled as of the data reporting date. For contracts with variable nominal or notional principal amounts, the basis for reporting is the nominal or notional principal amounts as of the data reporting date.
Hedge Fund Any private fund (other than a securitized asset fund): (a) with respect to which one or more investment advisers (or related persons of investment advisers) may be paid a performance fee or allocation calculated by taking into account unrealized gains (other than a fee or allocation the calculation of which may take into account unrealized gains solely for the purpose of reducing such fee or allocation to reflect net unrealized losses); (b) that may borrow an amount in excess of one-half of its net asset value (including any committed capital) or may have gross notional exposure in excess of twice its net asset value (including any committed capital); or (c) that may sell securities or other assets short or enter into similar transactions (other than for the purpose of hedging currency exposure or managing duration). The definition of a hedge fund for Form PF purposes also includes any commodity pool an adviser reports on Form PF.
IRDs Interest rate derivatives, including foreign exchange derivatives used for either investment or hedging.
Large Hedge Fund Adviser An adviser that has at least $1.5 billion in hedge fund assets under management.
39

December 30, 2015 Risk and Examinations Office
Large Liquidity Fund Adviser An adviser that has at least $1 billion in combined liquidity fund and money market fund assets under management.
Large Private Equity Fund Adviser An adviser that has at least a $2 billion in private equity fund assets under management.
Parallel Managed Account An account advised by an adviser that pursues substantially the same investment objective and strategy and invests side by side in substantially the same positions as the reporting fund.
Qualifying Hedge Fund A hedge fund advised by a Large Hedge Fund Adviser that has a net asset value (individually or in combination with any feeder funds, parallel funds, and/or dependent parallel managed accounts) of at least $500 million as of the last day of any month in the fiscal quarter immediately preceding the adviser’s most recently completed fiscal quarter.
Section 3 Liquidity Fund A liquidity fund advised by a Large Liquidity Fund Adviser.
Section 4 Private Equity Fund A private equity fund advised by a Large Private Equity Fund Adviser.
Value For derivatives (other than options), “value” means gross notional value; for options, “value” means delta adjusted notional value; for all other investments and for all borrowings where the reporting fund is the creditor, “value” means market value or, where there is not a readily available market value, fair value; for borrowings where the reporting fund is the debtor, “value” means the value you report internally and to current and prospective investors.
40