Embed Size (px)
Citation preview
Schulte Roth & Zabel Private Equity Buyer/Public Target M&A Deal Study 2015-17 Review and Comparative Analysis
In this edition of Schulte Roth & Zabel’s Private Equity Buyer/Public Target M&A Deal Study, we survey private equity buyer acquisitions of U.S. public companies from 2015 to 2017. Focusing on key terms in middle- and large-market acquisitions valued at over $100 million, we also compare our findings with our previous analysis of transactions from 2013 to 2014. The Deal Study identifies key market practices and deal trends, and its appendices present additional data that will be helpful to participants in today’s M&A markets.
Table of Contents
Survey Methodology 2
Key Takeaways 3
Market Activity — Number and Value of Transactions 5
Deal Structure — One-Step Merger vs. Two-Step Tender Offer/Back-End Merger 6
Target Fiduciary Duty Issues 7
Deal Protections for Buyer 8
Deal Certainty Provisions for the Target 13
Appendix A — Surveyed Transactions 18
Appendix B — Marketing Periods 22
Appendix C — Break-Up Fees and Reverse Termination Fees 24
SRZ’s M&A and Securities Group and the Authors 27
Private Equity Buyer/Public Target M&A Deal Study 2015-17 Review and Comparative Analysis
2 | Schulte Roth & Zabel
Survey Methodology
Consistent with our prior deal studies, we conducted the survey as follows:
• We reviewed certain key deal terms in all private equity buyer/public-company target cash merger transactions entered into in 2015, 2016 and 2017 involving consideration of at least $100 million (a total of 56 transactions and, collectively, the “2015–17 Transactions”). For the purposes of our analysis, the 2015–17 Transactions are further divided into the following two groups:
- Transactions involving consideration of at least $500 million in enterprise value (a total of 36 transactions and, collectively, the “2015–17 Large-Market Transactions”); and
- Transactions involving consideration of at least $100 million but less than $500 million in enterprise value1 (a total of 20 transactions and, collectively, the “2015–17 Middle-Market Transactions”).
• We then compared such deal terms with those of similarly sized private equity buyer/public company target cash merger transactions entered into in 2013 and 2014 (which were the subject of our most recent deal study and which we refer to herein as the “2013–14 Transactions,” divided similarly into the “2013–14 Large-Market Transactions” and “2013–14 Middle-Market Transactions”) and, where applicable, set forth detailed analysis of any notable changes in market trends with respect to such deal terms.
Please note that (i) the findings of our survey are not intended to be an exhaustive review of all terms in the transactions — this survey reports only on those matters that we believe would be most interesting to the deal community; (ii) our observations are based on a review of publicly available information for the transactions; (iii) the transactions discussed herein account for only a portion of M&A activity during the surveyed periods and may not be representative of the broader M&A market; and (iv) our comparative analysis may be impacted by the relatively small sample size and differences in size of the sample groups.
A list of the surveyed transactions can be found in Appendix A.
1 The enterprise values of the 2015–17 Large-Market Transactions ranged from $530.6 million to $18.6 billion, and the enterprise values of the 2015–17 Middle-Market Transactions ranged from $127.0 million to $496.9 million.

Private Equity Buyer/Public Target M&A Deal Study: 2015-17 Review and Comparative Analysis | 3
Key Takeaways
In general, we continue to observe a “market practice” regarding a number of the key deal terms.
Deal Structure• One-step mergers continue to be more popular
than two-step tender offers. Approximately 84% of all 2015–17 Transactions were structured as one-step mergers rather than two-step tender offers followed by back-end mergers, up from 71% of all 2013–14 Transactions. 92% of 2015–17 Large-Market Transactions were structured as one-step mergers, up from 75% of 2013–14 Large-Market Transactions. 70% of the 2015–17 Middle-Market Transactions were structured as one-step mergers, up from 33% observed in 2013–14 Middle-Market Transactions.
• Go-shop provisions were included in approximately 33% of the 2015–17 Large-Market Transactions and 20% of the 2015–17 Middle-Market Transactions as compared to 29% of the 2013–14 Large-Market Transactions and 22% of the 2013–14 Middle-Market Transactions.
- The go-shop periods have lengthened slightly — the average go-shop was 37 days (median: 38 days) for the 2015–17 Transactions as compared to 33 days (median: 30 days) for the 2013–14 Transactions.
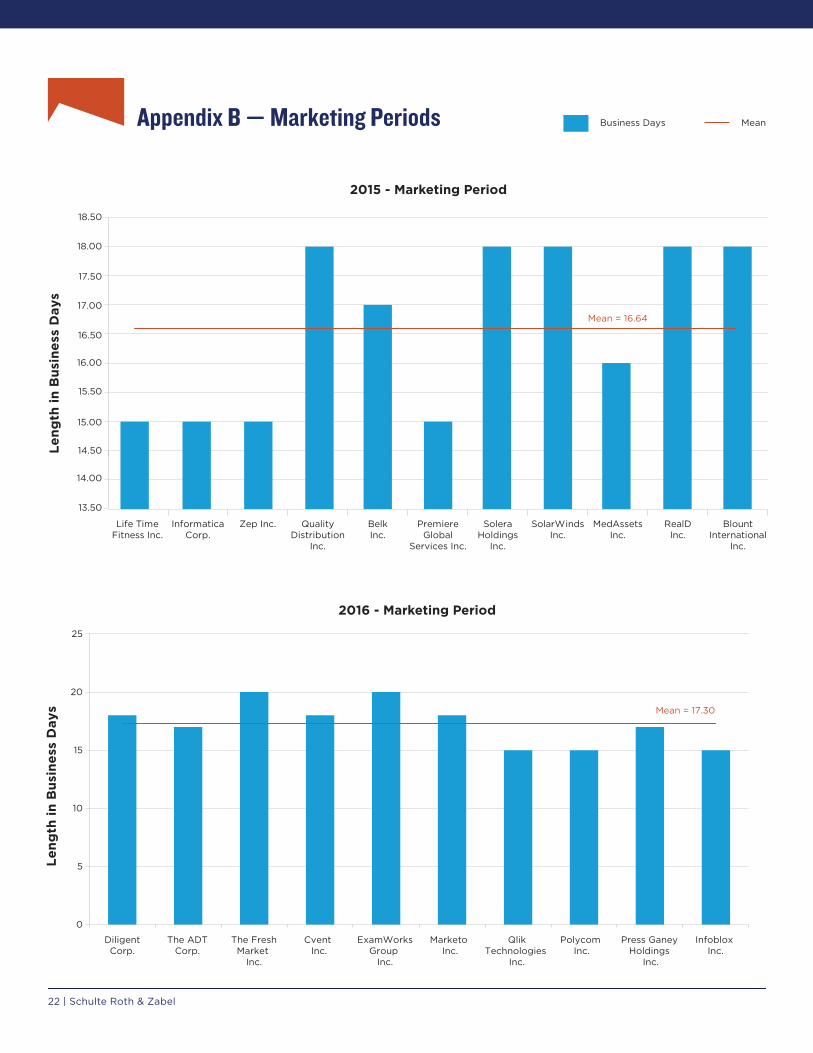
Marketing Period• Consistent with the increasing trend observed
in prior years, a large majority — approximately 81% — of the 2015–17 Large-Market Transactions contained marketing period provisions. In the 2015-17 Middle-Market Transactions, such provisions were considerably more rare. Only 15% of the 2015–17 Middle-Market Transactions contained “marketing period” provisions as compared to 44% of the 2013–14 Middle-Market Transactions. See Appendix B for more information on the length of marketing periods in the 2015–17 Transactions.
Buyer Deal Protections• All of the 2015–17 Transactions provided the buyer
with match rights and all but one with “last look” match rights.
• The target’s break-up fees declined on a mean/median basis:
- For the 2015–17 Large-Market Transactions, the mean break-up fee was 2.4% of target equity value (median: 2.4%) as compared to 3.3% of target equity value (median: 3.2%) for 2013–14 Large-Market Transactions.
- For the 2015–17 Middle-Market Transactions, the mean break-up fee was 3.1% of target equity value (median: 3.2%) as compared to 3.5% of target equity value (median: 3.6%) for 2013–14 Middle-Market Transactions.

4 | Schulte Roth & Zabel
Target Deal Protections• Closing conditions for buyer financing continue to be essentially nonexistent, with specific performance rights and
reverse termination fees constituting the target’s deal protections.
• Approximately 68% of the 2015–17 Transactions (81% of the 2015–17 Large-Market Transactions and 45% of the 2015–17 Middle-Market Transactions, as compared to 83% and 78%, respectively, in 2013–14) gave the target company a limited specific performance right that was available only if (i) the buyer’s closing conditions to the merger agreement were satisfied and (ii) the buyer’s debt financing was available.
• The average size of a buyer’s reverse termination fee (“RTF”) has declined from 6.5% of the target’s equity value in 2013–14 Transactions to an average of 4.5% in 2015–17 Transactions for deals with single-tier RTFs.2
2015–17 “What’s Market” Summary Guide
Deal Term Large Market Middle Market
One-Step Merger Structure #
Go-Shop Provision #
Marketing Period Provision
Match/Last Look Match Rights
Mean Target Break-Up Fee 2.4% 3.1%
Target Only Has a Limited Specific Performance Right
Use of a Single-Tier Buyer RTF Mechanism #
Mean Buyer RTF (Single-Tier Structure) 4.6% 4.3%
Monetary Damages for Buyer Breach Capped at RTF
Key:
: Indicates prevalence in 75% or more of the relevant deals
#: Indicates prevalence in 25% or more but less than 75% of deals
: Indicates less than 25% prevalence
2 All but four of the transactions surveyed which contained RTF provisions were single-tiered.

Private Equity Buyer/Public Target M&A Deal Study: 2015-17 Review and Comparative Analysis | 5
Market Activity — Number and Value of Transactions
As noted in the chart below:
• The average deal value for the surveyed large-market deals has decreased, although the median deal value has increased — with $3.5 billion mean/$1.7 billion median for the 2015–17 Large-Market Transactions as compared to $4.2 billion mean/$1.0 billion median for the 2013–14 Large-Market Transactions. For the middle-market deals, the average value increased while the median value decreased — from $285.8 million mean/$308.4 million median for the 2013–14 Middle-Market Transactions to $321.2 million mean/$300.2 million median for the 2015–17 Middle-Market Transactions.
Quarterly Deal Volume and Mean Equity Value
$1,5
40
$1,4
55
$6
,076
$2,
217
$3,
197
$1,5
33
$1,1
71
$1,3
74
$1,7
98
$4
,79
4
$1,5
23
0
1
2
3
4
5
6
7
8
9
10
$0
$1,000
$2,000
$3,000
$4,000
$5,000
$6,000
$7,000
1 2 3 4 1 2 3 4
Num
ber
of
Tran
sact
ions
Mea
n E
qui
ty V
alue
($
in m
illio
ns)
2015 2016 2017
Mean Equity Value ($ in millions)
Number of Transactions
Quarterly Deal Volume and Mean Equity Value
1 2 3 4
9
3
5 5
4
5 5
6
0
3
7
4
$1,5
40
$1,4
55
$6
,076
$2,
217
$3,
197
$1,5
33
$1,1
71
$1,3
74
$1,7
98
$4
,79
4
$1,5
23
0
1
2
3
4
5
6
7
8
9
10
$0
$1,000
$2,000
$3,000
$4,000
$5,000
$6,000
$7,000
1 2 3 4 1 2 3 4
Num
ber
of
Tran
sact
ions
Mea
n E
qui
ty V
alue
($
in m
illio
ns)
2015 2016 2017
Mean Equity Value ($ in millions)
Number of Transactions
Quarterly Deal Volume and Mean Equity Value
1 2 3 4
9
3
5 5
4
5 5
6
0
3
7
4
6 | Schulte Roth & Zabel
Deal Structure — One-Step Merger vs. Two-Step Tender Offer/Back-End Merger
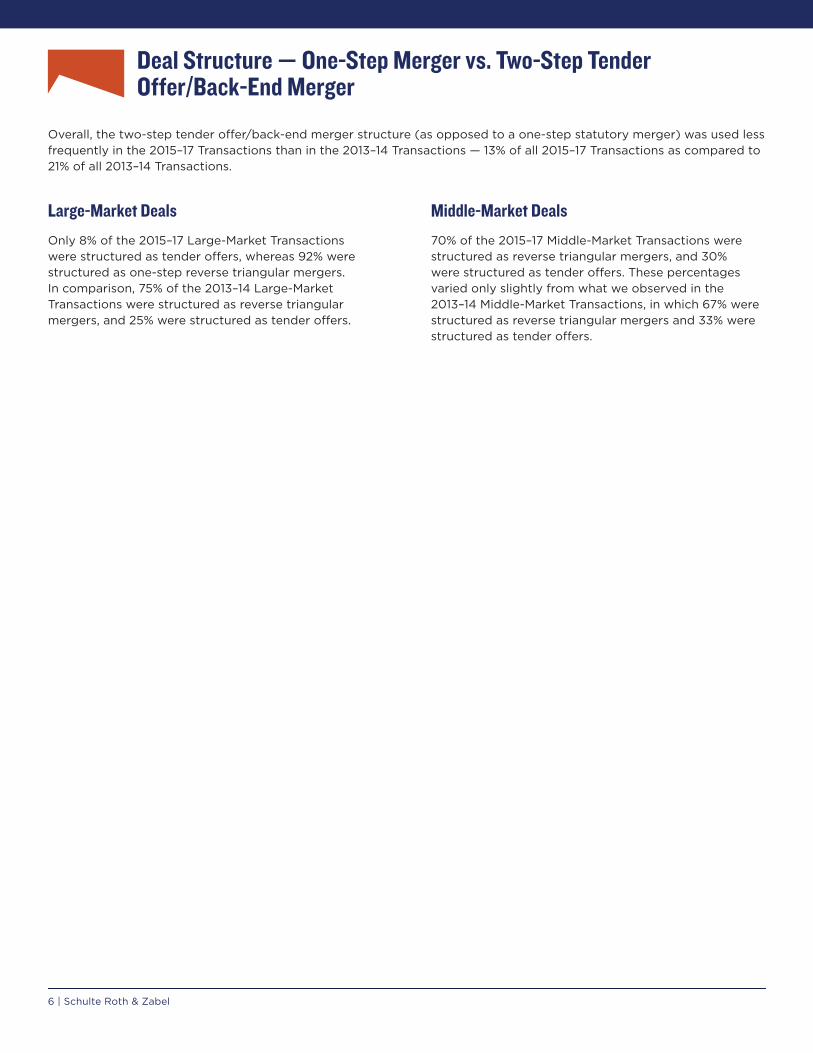
Overall, the two-step tender offer/back-end merger structure (as opposed to a one-step statutory merger) was used less frequently in the 2015–17 Transactions than in the 2013–14 Transactions — 13% of all 2015–17 Transactions as compared to 21% of all 2013–14 Transactions.
Large-Market DealsOnly 8% of the 2015–17 Large-Market Transactions were structured as tender offers, whereas 92% were structured as one-step reverse triangular mergers. In comparison, 75% of the 2013–14 Large-Market Transactions were structured as reverse triangular mergers, and 25% were structured as tender offers.
Middle-Market Deals70% of the 2015–17 Middle-Market Transactions were structured as reverse triangular mergers, and 30% were structured as tender offers. These percentages varied only slightly from what we observed in the 2013–14 Middle-Market Transactions, in which 67% were structured as reverse triangular mergers and 33% were structured as tender offers.
Private Equity Buyer/Public Target M&A Deal Study: 2015-17 Review and Comparative Analysis | 7
Target Fiduciary Duty Issues
Fiduciary Termination RightsConsistent with the 2013–14 Transactions, all of the 2015–17 Transactions included a fiduciary termination right allowing the target to terminate the merger agreement with the buyer in order to enter into an alternative acquisition agreement deemed to be a superior proposal, subject in all cases to payment of a break-up fee and the buyer’s match rights, as described in the Deal Protections for Buyer section that follows.
Go-Shop Provisions
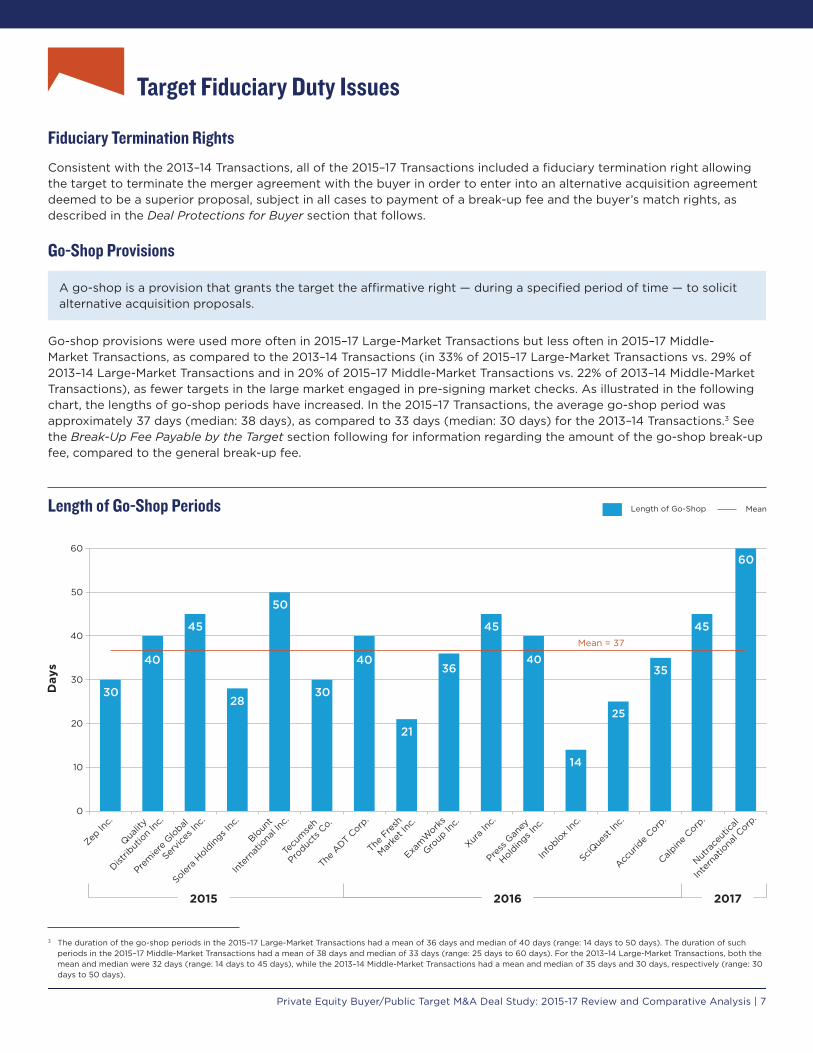
A go-shop is a provision that grants the target the affirmative right — during a specified period of time — to solicit alternative acquisition proposals.
Go-shop provisions were used more often in 2015–17 Large-Market Transactions but less often in 2015–17 Middle-Market Transactions, as compared to the 2013–14 Transactions (in 33% of 2015–17 Large-Market Transactions vs. 29% of 2013–14 Large-Market Transactions and in 20% of 2015–17 Middle-Market Transactions vs. 22% of 2013–14 Middle-Market Transactions), as fewer targets in the large market engaged in pre-signing market checks. As illustrated in the following chart, the lengths of go-shop periods have increased. In the 2015–17 Transactions, the average go-shop period was approximately 37 days (median: 38 days), as compared to 33 days (median: 30 days) for the 2013–14 Transactions.3 See the Break-Up Fee Payable by the Target section following for information regarding the amount of the go-shop break-up fee, compared to the general break-up fee.
Length of Go-Shop Periods
3 The duration of the go-shop periods in the 2015–17 Large-Market Transactions had a mean of 36 days and median of 40 days (range: 14 days to 50 days). The duration of such periods in the 2015–17 Middle-Market Transactions had a mean of 38 days and median of 33 days (range: 25 days to 60 days). For the 2013–14 Large-Market Transactions, both the mean and median were 32 days (range: 14 days to 45 days), while the 2013–14 Middle-Market Transactions had a mean and median of 35 days and 30 days, respectively (range: 30 days to 50 days).
2825
36
30
40
45
50
30
40
21
45
40
14
35
45
60
0
10
20
30
40
50
60
Length of Go-Shop
Mean
Length of “Go-Shop” Periods
Day
s
Mean = 37
Zep In
c.
Qualit
y
Distrib
utio
n In
c.
Prem
iere
Global
Servic
es In
c.
Solera
Holdin
gs Inc
.
Bloun
t
Inte
rnat
iona
l Inc.
Tecu
mse
h
Produc
ts C
o.
The
ADT Corp
.
The
Fresh
Marke
t Inc
.
Exam
Work
s
Group
Inc.
Xura
Inc.
Press
Gan
ey
Holdin
gs Inc
.
Info
blox In
c.
SciQue
st In
c.
Accur
ide
Corp.
Calpin
e Corp
.
Nutra
ceut
ical
Inte
rnat
iona
l Corp
.
2015 2016 2017
8 | Schulte Roth & Zabel
Deal Protections for Buyer
We reviewed the 2015–17 Transactions for provisions designed to protect the buyer against topping bids and target stockholder opposition.
Match Rights and Last Look Rights
Initial match rights provide the buyer with an opportunity to negotiate with the target board during a specific period of time after receipt of notice from the target board of an intended change in recommendation (“CIR”) and propose modified terms that are sufficiently improved so as to preclude the target from effecting a CIR. We note that in In re Smurfit-Stone Container Corp. Shareholder Litigation, C.A. No. 6164 (Del. Ch. May 20, 2011), Vice Chancellor Parsons of the Delaware Chancery Court determined that each of the deal protections agreed to by the target, which included a three-day initial match rights period, were “standard,” whether considered alone or as a group.4
Last look match rights provide the buyer with a further right to negotiate in the event that the other bidder revises its proposed terms.
The terms of the initial match rights were consistent across the 2015–17 Transactions and 2013–14 Transactions. Of the 2015–17 Transactions:
• All had initial match rights (consistent with the 2013–14 Transactions).
• The mean and median time period for initial match rights were 3.6 business days and three business days, respectively,5 which is generally consistent with the initial match rights parameters in 2013–14 Transactions.
The terms of last look match rights were also generally consistent across 2015–17 Transactions and 2013–14 Transactions. All but one of the 2015–17 Transactions had last look match rights. The range of last look match rights was one to seven business days (mean: 2.5 business days; median: two business days), which is consistent with the time periods for last look match rights in the 2013–14 Transactions.
Break-Up Fee Payable by the Target
As with other deal protection devices, Delaware courts have not provided any bright-line rules regarding when a break-up fee will be deemed unreasonable in amount. Nevertheless, practitioners can take comfort that fees in the range of 2% to 4% of equity value are generally permissible. Delaware jurisprudence, most recently in the In re Cogent Inc. Shareholder Litigation, suggests that equity value may be the appropriate metric for calculating a break-up fee where a target has minimal debt. Conversely, where the buyer is assuming a significant amount of a target’s debt, enterprise value may be the appropriate metric. This situation is illustrated by the Macquarie/WCA Waste Corporation transaction (2011), where the target had an enterprise value of $526 million but an equity value of only $154 million (due to its significant debt). The Macquarie/WCA transaction had a two-tier break-up fee: $11 million (2.1% of enterprise value and 7% of equity value) payable in the event of termination for entering into an alternative transaction and $16.5 million (3.2% of enterprise value and 10.7% of equity value) for other specified terminations.
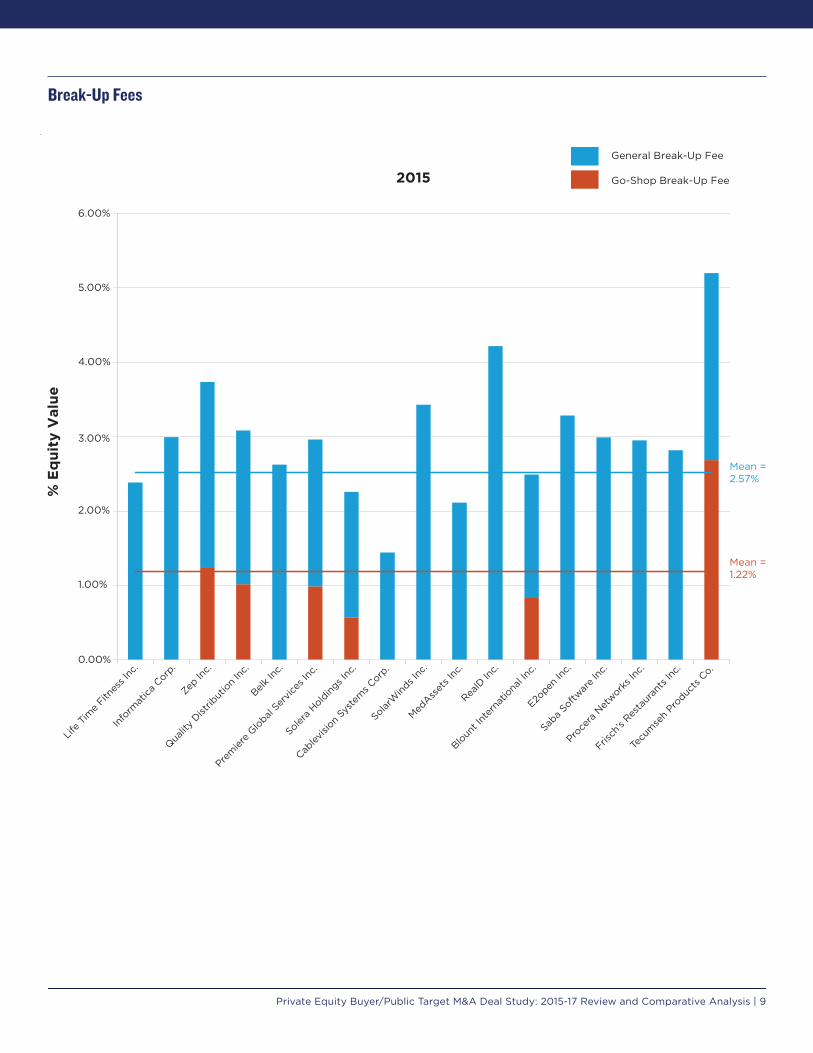
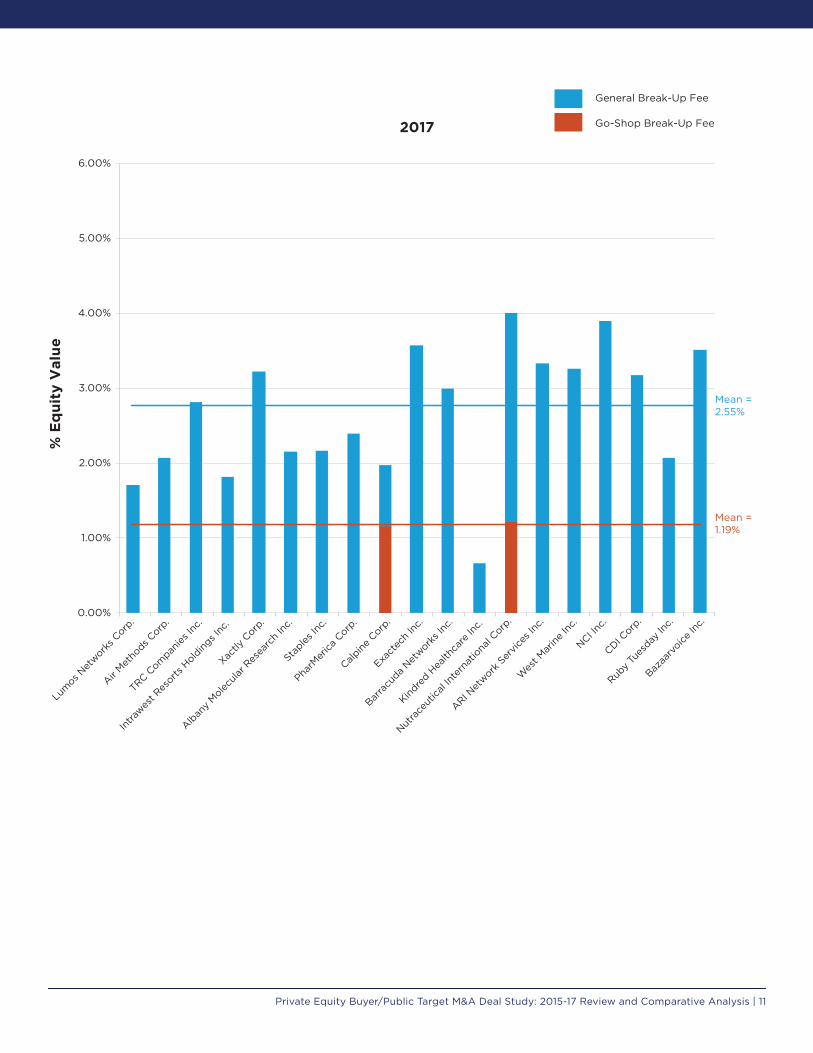
As noted in the following charts:
• For the 2015–17 Large-Market Transactions, both the mean and median break-up fees were 2.4% of equity value, which was lower than 3.3% and 3.2%, respectively, for the 2013–14 Large-Market Transactions.
• For the 2015–17 Middle-Market Transactions, the mean and median break-up fees were 3.1% and 3.2% of equity value, respectively, which also was lower than the 3.5% mean and 3.6% median for the 2013–14 Middle-Market Transactions.6
4 The other deal protection provisions included a no-shop clause and a break-up fee of approximately 3.4% of the target equity value.
5 For the 2015–17 Large-Market Transactions, the mean and median were 3.4 and three business days, respectively. For the 2015–17 Middle-Market Transactions, the mean and median were both four business days, respectively.
6 The mean and median break-up fees for the 2015–17 Middle-Market Transactions both exclude SciQuest Inc.’s acquisition by Accel-KKR LLC, which had a two-tiered break-up fee structure with a lower break-up fee of 4.1% and a higher break-up fee of 8.9%.
Private Equity Buyer/Public Target M&A Deal Study: 2015-17 Review and Comparative Analysis | 9
Break-Up Fees
Add chart here
0.00%
1.00%
2.00%
3.00%
4.00%
5.00%
6.00%
2015
Life
Tim
e Fitn
ess I
nc.
Info
rmat
ica C
orp.
Zep In
c.
Qualit
y Dist
ribut
ion
Inc.
Belk In
c.
Prem
iere
Global
Servic
es In
c.
Solera
Holdin
gs Inc
.
Cablev
ision
Syst
ems C
orp.
SolarW
inds I
nc.
MedAss
ets I
nc.
RealD
Inc.
Bloun
t Int
erna
tiona
l Inc.
E2open
Inc.
Saba
Softwar
e In
c.
Proce
ra N
etwork
s Inc
.
Frisch
’s Res
taur
ants
Inc.
Tecu
mse
h Pro
ducts
Co.
General Break-Up Fee
Go-Shop Break-Up Fee
Back-Up Fees
% E
qui
ty V
alue
Mean = 1.22%
Mean = 2.57%

10 | Schulte Roth & Zabel
0.00%
1.00%
2.00%
3.00%
4.00%
5.00%
6.00%
2016
General Break-Up Fee
Go-Shop Break-Up Fee
Apollo E
ducat
ion
Group
Inc.
Diligen
t Corp
.
The
ADT Corp
.
The
Fresh
Mar
ket I
nc.
Cvent
Inc.
Lexm
ark I
nter
natio
nal In
c.
Exam
Work
s Gro
up In
c.
Xura
Inc.
Marke
to In
c.
Qlik Te
chno
logies
Inc.
Polycom
Inc.
Press
Gan
ey H
oldin
gs Inc
.
Info
blox In
c.
API Tec
hnolo
gies C
orp.
Sym
met
ry S
urgica
l Inc.
Electro
Ren
t Corp
.
Impriv
ata
Inc.
Skullc
andy
Inc.
Accur
ide
Corp.
Back-Up Fees%
Eq
uity
Val
ue
Mean = 1.14%
Mean = 2.76%
Private Equity Buyer/Public Target M&A Deal Study: 2015-17 Review and Comparative Analysis | 11
0.00%
1.00%
2.00%
3.00%
4.00%
5.00%
6.00%
2016
General Break-Up Fee
Go-Shop Break-Up Fee
Apollo E
ducat
ion
Group
Inc.
Diligen
t Corp
.
The
ADT Corp
.
The
Fresh
Mar
ket I
nc.
Cvent
Inc.
Lexm
ark I
nter
natio
nal In
c.
Exam
Work
s Gro
up In
c.
Xura
Inc.
Marke
to In
c.
Qlik Te
chno
logies
Inc.
Polycom
Inc.
Press
Gan
ey H
oldin
gs Inc
.
Info
blox In
c.
API Tec
hnolo
gies C
orp.
Sym
met
ry S
urgica
l Inc.
Electro
Ren
t Corp
.
Impriv
ata
Inc.
Skullc
andy
Inc.
Accur
ide
Corp.
Back-Up Fees
% E
qui
ty V
alue
Mean = 1.14%
Mean = 2.76%
0.00%
1.00%
2.00%
3.00%
4.00%
5.00%
6.00%
2017
General Break-Up Fee
Go-Shop Break-Up Fee
Lum
os Net
works C
orp.
Air Met
hods C
orp.
TRC Com
panies
Inc.
Intra
west R
esorts
Hold
ings I
nc.
Xactly
Corp
.
Alban
y Molec
ular
Res
earc
h In
c.
Stap
les In
c.
PharM
erica
Corp
.
Calpin
e Corp
.
Exact
ech
Inc.
Barra
cuda
Network
s Inc
.
Kindre
d Hea
lthca
re In
c.
Nutra
ceut
ical In
tern
atio
nal C
orp.
ARI Net
work S
ervic
es In
c.
Wes
t Mar
ine
Inc.
NCI Inc
.
CDI Corp
.
Ruby
Tues
day In
c.
Bazaa
rvoice
Inc.
Back-Up Fees
% E
qui
ty V
alue
Mean = 1.19%
Mean = 2.55%
12 | Schulte Roth & Zabel
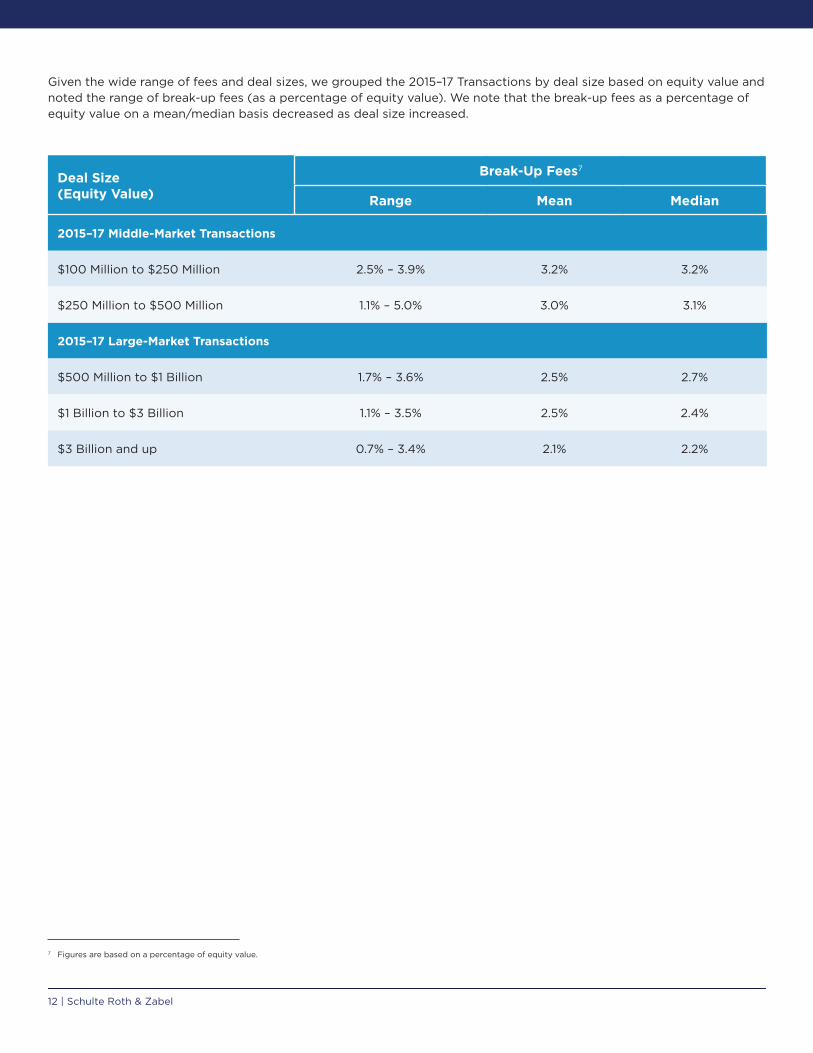
Given the wide range of fees and deal sizes, we grouped the 2015–17 Transactions by deal size based on equity value and noted the range of break-up fees (as a percentage of equity value). We note that the break-up fees as a percentage of equity value on a mean/median basis decreased as deal size increased.7
Deal Size (Equity Value)
Break-Up Fees7
Range Mean Median
2015–17 Middle-Market Transactions
$100 Million to $250 Million 2.5% – 3.9% 3.2% 3.2%
$250 Million to $500 Million 1.1% – 5.0% 3.0% 3.1%
2015–17 Large-Market Transactions
$500 Million to $1 Billion 1.7% – 3.6% 2.5% 2.7%
$1 Billion to $3 Billion 1.1% – 3.5% 2.5% 2.4%
$3 Billion and up 0.7% – 3.4% 2.1% 2.2%
7 Figures are based on a percentage of equity value.

Private Equity Buyer/Public Target M&A Deal Study: 2015-17 Review and Comparative Analysis | 13
Deal Certainty Provisions for the Target
We reviewed the 2015–17 Transactions for provisions that are intended to provide the target with additional certainty of closing.
Target’s Ability to Obtain Specific Performance Against the BuyerOur review of the 2015–17 Transactions included an analysis of specific performance rights afforded to the target.
The limited specific performance remedy is a provision which conditions the target’s ability to force the buyer to close on the buyer’s debt financing being available at closing.
All transactions in our study had at least a limited specific performance remedy (i.e., no deal allowed the buyer to walk away by simply paying a reverse termination fee).
Large-Market DealsThe 2015–17 Large-Market Transactions provided the target with a limited specific performance right against the buyer in 81% of deals surveyed (with 19% providing the target with a full specific performance right). These findings are consistent with recent trends revealing the popularity of limited specific performance rights in larger deals: 83% of the 2013–14 Large-Market Transactions provided the target with limited specific performance rights (with 17% providing the target with a full specific performance right).
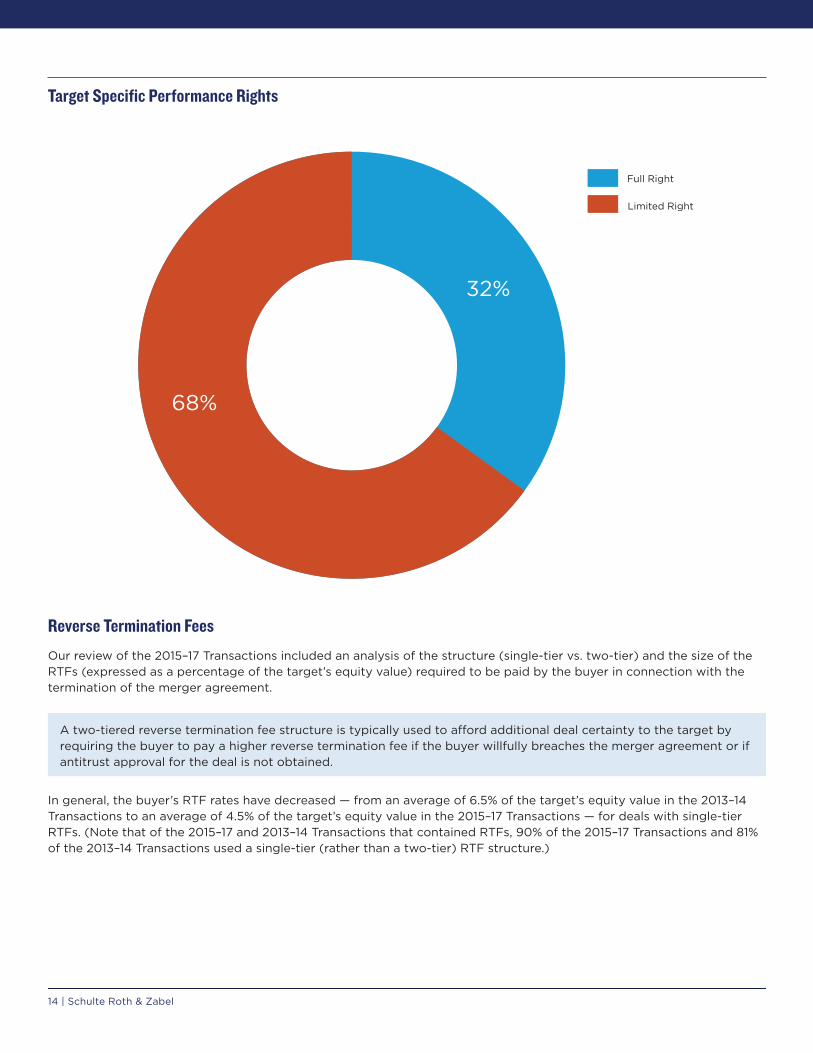
Middle-Market DealsOnly 45% of the 2015–17 Middle-Market Transactions contained a limited specific performance right (whereas full specific performance provisions were present in 55%). The popularity of full specific performance rights marks a drastic shift from the 2013–14 period, where of the Middle-Market Transactions that provided the target with any specific performance rights, 83% contained limited specific performance provisions and only 17% contained full specific performance provisions.
14 | Schulte Roth & Zabel
Target Specific Performance Rights
Full Right
Limited Right
32%
68%
Target Specific Performance
Reverse Termination FeesOur review of the 2015–17 Transactions included an analysis of the structure (single-tier vs. two-tier) and the size of the RTFs (expressed as a percentage of the target’s equity value) required to be paid by the buyer in connection with the termination of the merger agreement.
A two-tiered reverse termination fee structure is typically used to afford additional deal certainty to the target by requiring the buyer to pay a higher reverse termination fee if the buyer willfully breaches the merger agreement or if antitrust approval for the deal is not obtained.
In general, the buyer’s RTF rates have decreased — from an average of 6.5% of the target’s equity value in the 2013–14 Transactions to an average of 4.5% of the target’s equity value in the 2015–17 Transactions — for deals with single-tier RTFs. (Note that of the 2015–17 and 2013–14 Transactions that contained RTFs, 90% of the 2015–17 Transactions and 81% of the 2013–14 Transactions used a single-tier (rather than a two-tier) RTF structure.)

Private Equity Buyer/Public Target M&A Deal Study: 2015-17 Review and Comparative Analysis | 15
Below is a summary of our findings:
Large-Market DealsAs noted in the following chart:
• 86% of the 2015–17 Large-Market Transactions had an RTF (as compared to 92% for the 2013–14 Large-Market Transactions):
- 87% of transactions with an RTF had a single-tier RTF (as compared to 86% for the 2013–14 Large-Market Transactions).
- 11% of transactions with an RTF had a two-tier RTF (as compared to 14% for the 2013–14 Large-Market Transactions). The four deals making up the 11% of deals had a higher RTF payable for the following reasons:
o Apex Technology Co. Ltd., PAG Asia Capital and Legend Capital Management Co. Ltd.’s acquisition of Lexmark International Inc. — any breach, except for failure to obtain governmental merger approval, except in the case of merger approval from the People’s Republic of China, financing failure8 or failure to obtain merger approval from the People’s Republic of China.
o Siris Capital Group LLC’s acquisition of Polycom Inc. — willful breach.
o KKR & Co. LP and Walgreens Boots Alliance Inc.’s acquisition of PharMerica Corporation — willful breach or failure to obtain antitrust approval.
o Canada Pension Plan Investment Board, Access Industries Inc. and Energy Capital Partners’ acquisition of Calpine Corp. — any breach, unless the agreement is terminated due to a lower rating by two rating agencies of the target’s debt instruments.
With respect to the size of the RTFs:
• For transactions with a single-tier RTF, the mean and median were 4.6% and 4.4% of target equity value, respectively (range: 1.4% to 6.9%), as compared to 6.4% and 6.3%, respectively (range: 0.5% to 10.7%), for the 2013–14 Large-Market Transactions. For transactions with a dual-tier RTF, the mean and median were 5.49% and 5.89%, respectively (range: 1.93% to 8.23%), as compared to 9.21% and 4.69%, respectively (range 3.09% to 19.84%), for the 2013–14 Large-Market Transactions.
Middle-Market Deals As noted in the following chart:
• Only 10 of the 20 2015–17 Middle-Market Transactions (50%) had an RTF (as compared to 83% for the 2013–14 Middle-Market Transactions), and each of the 10 transactions with RTFs had a single-tier structure (whereas of the 2013–14 Middle-Market Transactions with RTFs, 73% had a single-tier structure and 27% had a two-tier structure).
With respect to the size of the RTFs:
• The mean and median percentages of target equity value were 4.3% and 5.0%, respectively (range: 1.6% to 6.8%), as compared to 6.4% and 6.3%, respectively (range: 4.3% to 8.0%), for the 2013–14 Middle-Market Transactions with a single-tier RTF.
8 Lexmark is unique in that the agreement expressly provides that either the failure of the parent to comply with the financing covenants or failure of one of the acquirers to obtain shareholder approval for the merger constitutes a material and willful breach by the respective failing party.

16 | Schulte Roth & Zabel
Reverse Termination Fees
90%
10%
Single-Tier
Dual-Tier
Reverse Termination Fees
Reverse Termination Fee Triggers
We reviewed the 2015–17 Transactions with RTFs to analyze the types of RTF triggers. Below is a summary of our findings:
2015–17 Large-Market Transactions with RTFs
In 94% of the transactions with an RTF, the RTF was triggered by buyer’s material breach of a representation, warranty or a covenant in the merger agreement — up from 86% in the 2013–14 transactions. Only one of the 2015-17 Large-Market Transactions limited the RTF to instances where buyer was unable to obtain financing, whereas none of the 2013–14 Large-Market Transactions provided such limitation.
2015–17 Middle Market Transaction with RTFs
In 70% of the transactions with an RTF, the RTF was triggered by buyer’s material breach of a representation, warranty or a covenant in the merger agreement — a decrease from 73% in the 2013–14 transactions. 30% of the 2015–17 Middle-Market Transactions limited the RTF to instances where buyer was unable to obtain financing, whereas none of the 2013–14 Middle-Market Transactions provided such limitation.
Treatment of Buyer’s Willful BreachWe reviewed the 2015–17 Transactions with RTFs to determine whether the target’s damages for buyer’s willful breach were capped and whether “willful breach” was defined. We observed a decrease in Large-Market Transactions that contained a cap on damages for buyer’s willful breach equal to the amount of the RTF, whereas the number of Middle-Market Transactions featuring such a structure increased.

Private Equity Buyer/Public Target M&A Deal Study: 2015-17 Review and Comparative Analysis | 17
2015–17 Large-Market Transactions with RTFs
• Of the deals with RTFs, 90% of them had a specific damages cap, down from 95% in 2013–14. Of those deals with a specific cap, 86% were capped at the single-tier RTF and 14%, each providing for a dual-tier RTF, with capped damages at the higher RTF. Only one deal limited the remedy for buyer’s willful breach to specific performance only.
• Of the deals with RTFs, only 3% of the 2015–17 Large-Market Transactions allowed for damages for buyer’s willful breach that were uncapped, down from 5% of the 2013-14 Large-Market Transactions.9
• Buyer’s willful breach was defined in 52% of the transactions with RTFs, and in 63% of such transactions the definition required the taking of a deliberate act or omission constituting a breach but did not require that the breach be the conscious object of the act or omission.
The formulation of “willful breach” used in these deals is generally consistent with Delaware Chancery Court Vice Chancellor Lamb’s definition of a “knowing and intentional breach” in Hexion Specialty Chemicals, Inc. v. Huntsman Corp., C.A. No. 3841 (Del. Ch. Sept. 29, 2008), holding that a “knowing and intentional” breach means “the taking of a deliberate act, which act constitutes in and of itself a breach of the merger agreement, even if breaching was not the conscious object of the act.” We note that the “knowing and intentional” formulation in Hexion and in these transactions is target-friendly in that it avoids any need to establish that a buyer acted with the intent of breaching the merger agreement, which intent may be very difficult to prove.
2015–17 Middle-Market Transactions with RTFs
• Of the deals with RTFs, 80% of the 2015–17 Middle-Market Deals contained a specific cap on damages for buyer’s willful breach and all but one of those deals were limited to the amount of the RTF, down from 87% of 2013–14 Middle-Market Deals. The only deal that had a specific damages cap and did not limit it to the RTF actually limited damages to an amount less than the RTF.10 No transactions limited the damages for willful breach by buyer to specific performance.
• Only 20% of the transactions with RTFs provided for uncapped damages for buyer’s willful breach, whereas no transaction with an RTF was without a cap in 2013–14.
• In four of the 10 transactions with RTFs, willful breach was defined. In two of these cases, willful breach required intent.
Willful Breach, RTF and Specific PerformanceAs is noted at the beginning of this section, each of the 2015–2017 Transactions had at least a limited specific performance right. In each where the target is able to pursue damages, either explicitly capped or uncapped, it may also pursue specific performance from buyer to complete the transaction. This mechanic is important for transactions that limit the damages for willful breach by buyer to the RTF in order to prevent buyer from entering into an agreement with a set walk price. Without such mechanic, these agreements would essentially be reduced to option contracts.
9 One deal, Informatica Corp.’s acquisition by Permira and the Canada Pension Plan Investment Board, not included in the 6%, provided for uncapped damages only when buyer’s willful breach resulted from fraud by buyer.
10 Monomoy Capital Partners’ acquisition of West Marine Inc. provided for an RTF of $17 million, but limited the damages for intentional breach of the buyer’s covenants to $15 million.
18 | Schulte Roth & Zabel
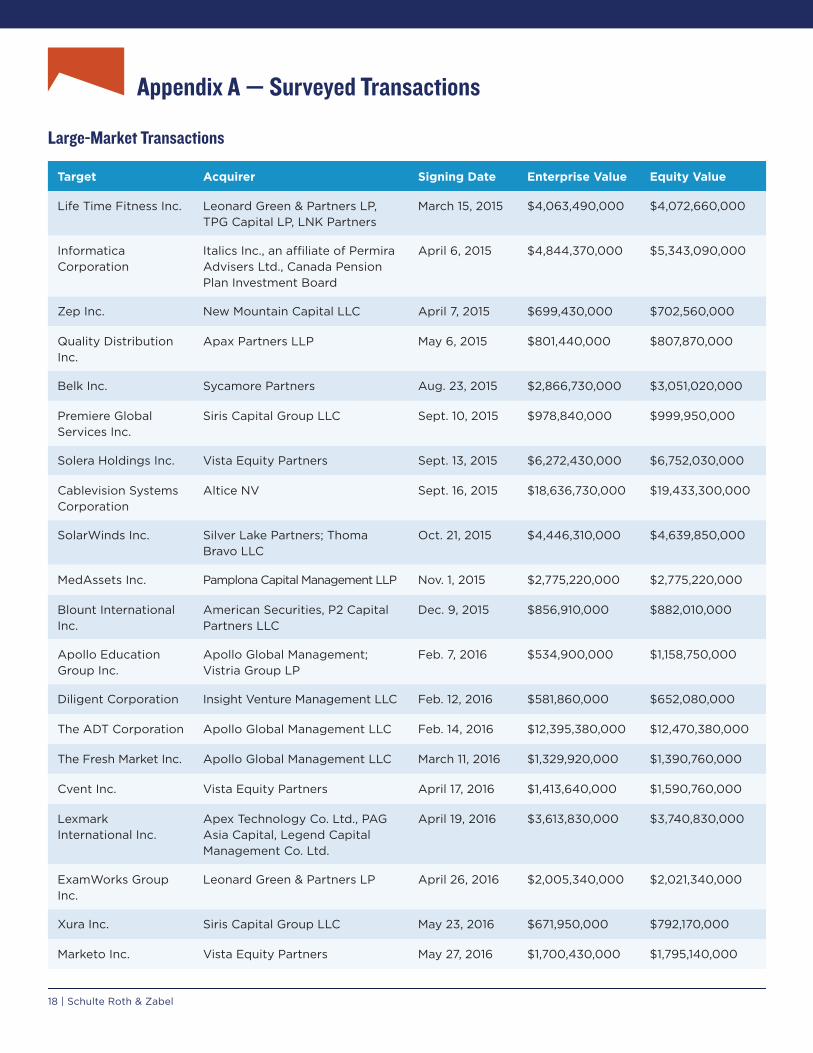
Appendix A — Surveyed Transactions
Large-Market Transactions
Target Acquirer Signing Date Enterprise Value Equity Value
Life Time Fitness Inc. Leonard Green & Partners LP, TPG Capital LP, LNK Partners
March 15, 2015 $4,063,490,000 $4,072,660,000
Informatica Corporation
Italics Inc., an affiliate of Permira Advisers Ltd., Canada Pension Plan Investment Board
April 6, 2015 $4,844,370,000 $5,343,090,000
Zep Inc. New Mountain Capital LLC April 7, 2015 $699,430,000 $702,560,000
Quality Distribution Inc.
Apax Partners LLP May 6, 2015 $801,440,000 $807,870,000
Belk Inc. Sycamore Partners Aug. 23, 2015 $2,866,730,000 $3,051,020,000
Premiere Global Services Inc.
Siris Capital Group LLC Sept. 10, 2015 $978,840,000 $999,950,000
Solera Holdings Inc. Vista Equity Partners Sept. 13, 2015 $6,272,430,000 $6,752,030,000
Cablevision Systems Corporation
Altice NV Sept. 16, 2015 $18,636,730,000 $19,433,300,000
SolarWinds Inc. Silver Lake Partners; Thoma Bravo LLC
Oct. 21, 2015 $4,446,310,000 $4,639,850,000
MedAssets Inc. Pamplona Capital Management LLP Nov. 1, 2015 $2,775,220,000 $2,775,220,000
Blount International Inc.
American Securities, P2 Capital Partners LLC
Dec. 9, 2015 $856,910,000 $882,010,000
Apollo Education Group Inc.
Apollo Global Management; Vistria Group LP
Feb. 7, 2016 $534,900,000 $1,158,750,000
Diligent Corporation Insight Venture Management LLC Feb. 12, 2016 $581,860,000 $652,080,000
The ADT Corporation Apollo Global Management LLC Feb. 14, 2016 $12,395,380,000 $12,470,380,000
The Fresh Market Inc. Apollo Global Management LLC March 11, 2016 $1,329,920,000 $1,390,760,000
Cvent Inc. Vista Equity Partners April 17, 2016 $1,413,640,000 $1,590,760,000
Lexmark International Inc.
Apex Technology Co. Ltd., PAG Asia Capital, Legend Capital Management Co. Ltd.
April 19, 2016 $3,613,830,000 $3,740,830,000
ExamWorks Group Inc.
Leonard Green & Partners LP April 26, 2016 $2,005,340,000 $2,021,340,000
Xura Inc. Siris Capital Group LLC May 23, 2016 $671,950,000 $792,170,000
Marketo Inc. Vista Equity Partners May 27, 2016 $1,700,430,000 $1,795,140,000

Private Equity Buyer/Public Target M&A Deal Study: 2015-17 Review and Comparative Analysis | 19
Target Acquirer Signing Date Enterprise Value Equity Value
Qlik Technologies Inc.
Thoma Bravo LLC June 2, 2016 $2,614,880,000 $2,984,830,000
Polycom Inc. Siris Capital Group LLC July 8, 2016 $1,226,090,000 $1,928,850,000
Press Ganey Holdings Inc.
EQT Partners Inc. Aug. 9, 2016 $2,382,180,000 $2,428,560,000
Infoblox Inc. Vista Equity Partners Sept. 16, 2016 $1,254,310,000 $1,512,410,000
Lumos Networks Corp.
EQT Partners AB Feb. 18, 2017 $869,080,000 $940,730,000
Air Methods Corporation
American Securities LLC March 14, 2017 $2,486,490,000 $2,492,390,000
TRC Companies Inc. New Mountain Capital LLC March 30, 2017 $681,330,000 $687,550,000
Intrawest Resorts Holdings Inc.
Aspen Skiing Company LLC, KSL Advisors LLC
April 7, 2017 $1,369,450,000 $1,561,650,000
Xactly Corporation Vista Equity Partners LLC May 30, 2017 $530,640,000 $574,810,000
Albany Molecular Research Inc.
GTCR LLC, The Carlyle Group LP June 6, 2017 $1,593,510,000 $1,628,710,000
Staples Inc. Sycamore Partners June 28, 2017 $6,613,720,000 $7,903,720,000
PharMerica Corporation
KKR & Co. LP, Walgreens Boots Alliance Inc.
Aug. 1, 2017 $1,363,490,000 $1,376,990,000
Calpine Corporation Canada Pension Plan Investment Board, Access Industries Inc., Energy Capital Partners
Aug. 17, 2017 $17,315,890,000 $17,337,720,000
Exactech Inc. TPG Capital LP Oct. 23, 2017 $709,620,000 $721,340,000
Barracuda Networks Inc.
Thoma Bravo LLC Nov. 26, 2017 $1,405,060,000 $1,611,640,000
Kindred Healthcare Inc.
TPG Capital LP; Welsh, Carson, Anderson & Stowe; Humana Inc.
Dec. 19, 2017 $4,171,180,000 $4,399,620,000
20 | Schulte Roth & Zabel
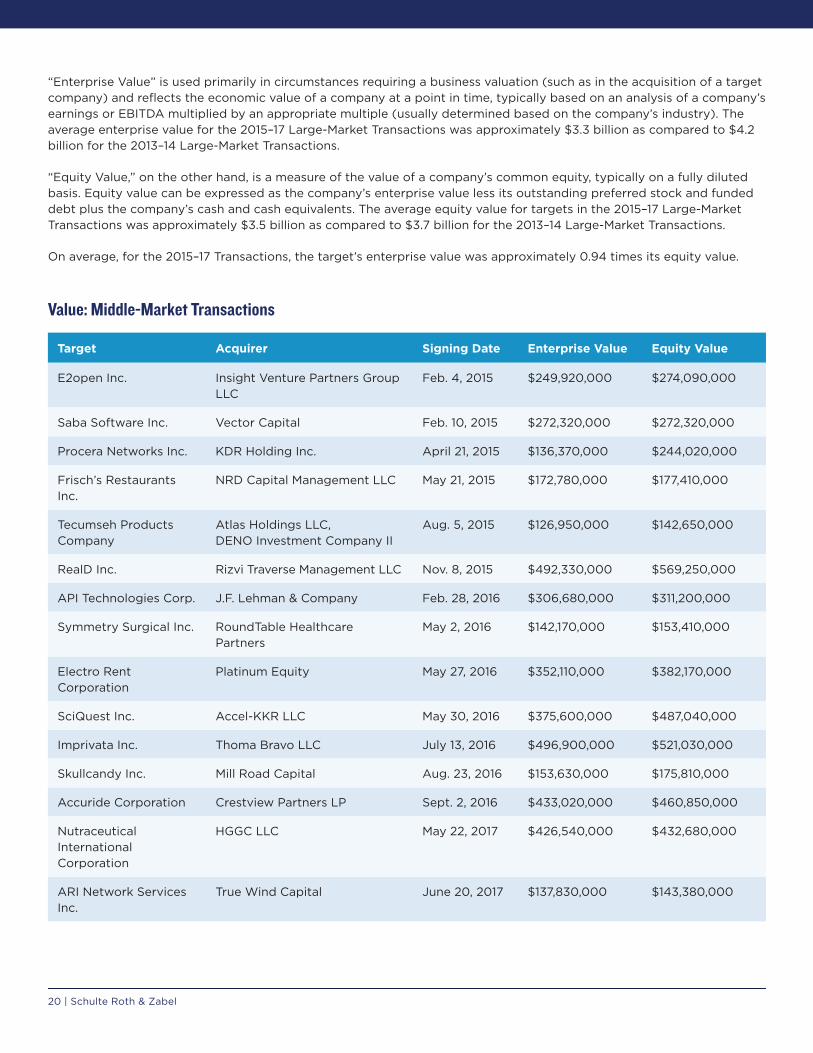
“Enterprise Value” is used primarily in circumstances requiring a business valuation (such as in the acquisition of a target company) and reflects the economic value of a company at a point in time, typically based on an analysis of a company’s earnings or EBITDA multiplied by an appropriate multiple (usually determined based on the company’s industry). The average enterprise value for the 2015–17 Large-Market Transactions was approximately $3.3 billion as compared to $4.2 billion for the 2013–14 Large-Market Transactions.
“Equity Value,” on the other hand, is a measure of the value of a company’s common equity, typically on a fully diluted basis. Equity value can be expressed as the company’s enterprise value less its outstanding preferred stock and funded debt plus the company’s cash and cash equivalents. The average equity value for targets in the 2015–17 Large-Market Transactions was approximately $3.5 billion as compared to $3.7 billion for the 2013–14 Large-Market Transactions.
On average, for the 2015–17 Transactions, the target’s enterprise value was approximately 0.94 times its equity value.
Value: Middle-Market Transactions
Target Acquirer Signing Date Enterprise Value Equity Value
E2open Inc. Insight Venture Partners Group LLC
Feb. 4, 2015 $249,920,000 $274,090,000
Saba Software Inc. Vector Capital Feb. 10, 2015 $272,320,000 $272,320,000
Procera Networks Inc. KDR Holding Inc. April 21, 2015 $136,370,000 $244,020,000
Frisch’s Restaurants Inc.
NRD Capital Management LLC May 21, 2015 $172,780,000 $177,410,000
Tecumseh Products Company
Atlas Holdings LLC, DENO Investment Company II
Aug. 5, 2015 $126,950,000 $142,650,000
RealD Inc. Rizvi Traverse Management LLC Nov. 8, 2015 $492,330,000 $569,250,000
API Technologies Corp. J.F. Lehman & Company Feb. 28, 2016 $306,680,000 $311,200,000
Symmetry Surgical Inc. RoundTable Healthcare Partners
May 2, 2016 $142,170,000 $153,410,000
Electro Rent Corporation
Platinum Equity May 27, 2016 $352,110,000 $382,170,000
SciQuest Inc. Accel-KKR LLC May 30, 2016 $375,600,000 $487,040,000
Imprivata Inc. Thoma Bravo LLC July 13, 2016 $496,900,000 $521,030,000
Skullcandy Inc. Mill Road Capital Aug. 23, 2016 $153,630,000 $175,810,000
Accuride Corporation Crestview Partners LP Sept. 2, 2016 $433,020,000 $460,850,000
Nutraceutical International Corporation
HGGC LLC May 22, 2017 $426,540,000 $432,680,000
ARI Network Services Inc.
True Wind Capital June 20, 2017 $137,830,000 $143,380,000
Private Equity Buyer/Public Target M&A Deal Study: 2015-17 Review and Comparative Analysis | 21
Target Acquirer Signing Date Enterprise Value Equity Value
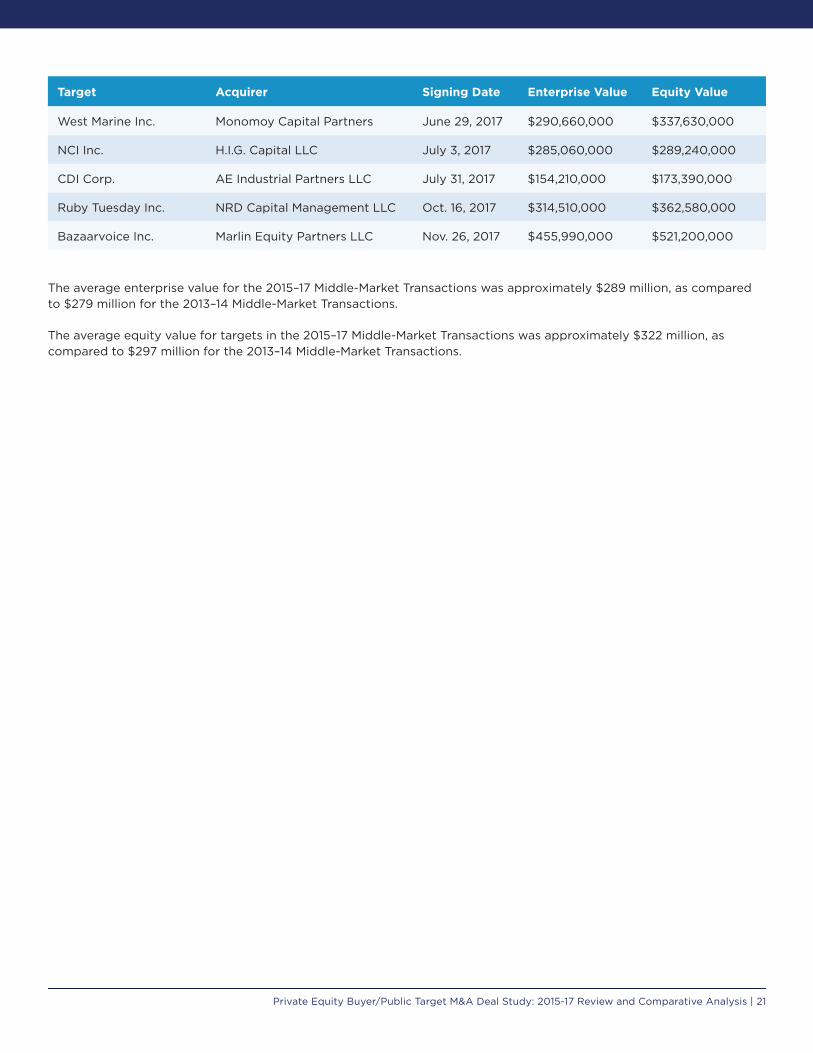
West Marine Inc. Monomoy Capital Partners June 29, 2017 $290,660,000 $337,630,000
NCI Inc. H.I.G. Capital LLC July 3, 2017 $285,060,000 $289,240,000
CDI Corp. AE Industrial Partners LLC July 31, 2017 $154,210,000 $173,390,000
Ruby Tuesday Inc. NRD Capital Management LLC Oct. 16, 2017 $314,510,000 $362,580,000
Bazaarvoice Inc. Marlin Equity Partners LLC Nov. 26, 2017 $455,990,000 $521,200,000
The average enterprise value for the 2015–17 Middle-Market Transactions was approximately $289 million, as compared to $279 million for the 2013–14 Middle-Market Transactions.
The average equity value for targets in the 2015–17 Middle-Market Transactions was approximately $322 million, as compared to $297 million for the 2013–14 Middle-Market Transactions.
22 | Schulte Roth & Zabel
Appendix B — Marketing Periods
13.50
14.00
14.50
15.00
15.50
16.00
16.50
17.00
17.50
18.00
18.50
Business Days
Mean
Life Time Fitness Inc.
Informatica Corp.
Zep Inc. Quality Distribution
Inc.
Belk Inc.
PremiereGlobal
Services Inc.
SoleraHoldings
Inc.
SolarWinds Inc.
MedAssets Inc.
RealD Inc.
Blount International
Inc.
2015 - Marketing Period
Leng
th in
Bus
ines
s D
ays
Mean = 16.64
0
5
10
15
20
25
2016 - Marketing Period
DiligentCorp.
The ADTCorp.
The FreshMarket
Inc.
Cvent Inc.
ExamWorksGroup
Inc.
Marketo Inc.
QlikTechnologies
Inc.
Polycom Inc.
Press Ganey Holdings
Inc.
Infoblox Inc.
Business Days
Mean
Leng
th in
Bus
ines
s D
ays Mean = 17.30
13.50
14.00
14.50
15.00
15.50
16.00
16.50
17.00
17.50
18.00
18.50
Business Days
Mean
Life Time Fitness Inc.
Informatica Corp.
Zep Inc. Quality Distribution
Inc.
Belk Inc.
PremiereGlobal
Services Inc.
SoleraHoldings
Inc.
SolarWinds Inc.
MedAssets Inc.
RealD Inc.
Blount International
Inc.
2015 - Marketing Period
Leng
th in
Bus
ines
s D
ays
Mean = 16.64

Private Equity Buyer/Public Target M&A Deal Study: 2015-17 Review and Comparative Analysis | 23
0
5
10
15
20
25
2017 - Marketing Period
Business Days
Mean
Leng
th in
Bus
ines
s D
ays
Lumos Networks
Corp.
Air Methods
Corp.
TRC Companies
Inc.
Intrawest Resorts
Holdings Inc.
Albany Molecular Research
Inc.
Staples Inc.
PharMerica Corp.
Barracuda Networks
Inc.
Kindred Healthcare
Inc.
RealD Inc.
Accuride Corp.
Bazaarvoice Inc.
Mean = 18.25
13.50
14.00
14.50
15.00
15.50
16.00
16.50
17.00
17.50
18.00
18.50
Business Days
Mean
Life Time Fitness Inc.
Informatica Corp.
Zep Inc. Quality Distribution
Inc.
Belk Inc.
PremiereGlobal
Services Inc.
SoleraHoldings
Inc.
SolarWinds Inc.
MedAssets Inc.
RealD Inc.
Blount International
Inc.
2015 - Marketing Period
Leng
th in
Bus
ines
s D
ays
Mean = 16.64
24 | Schulte Roth & Zabel
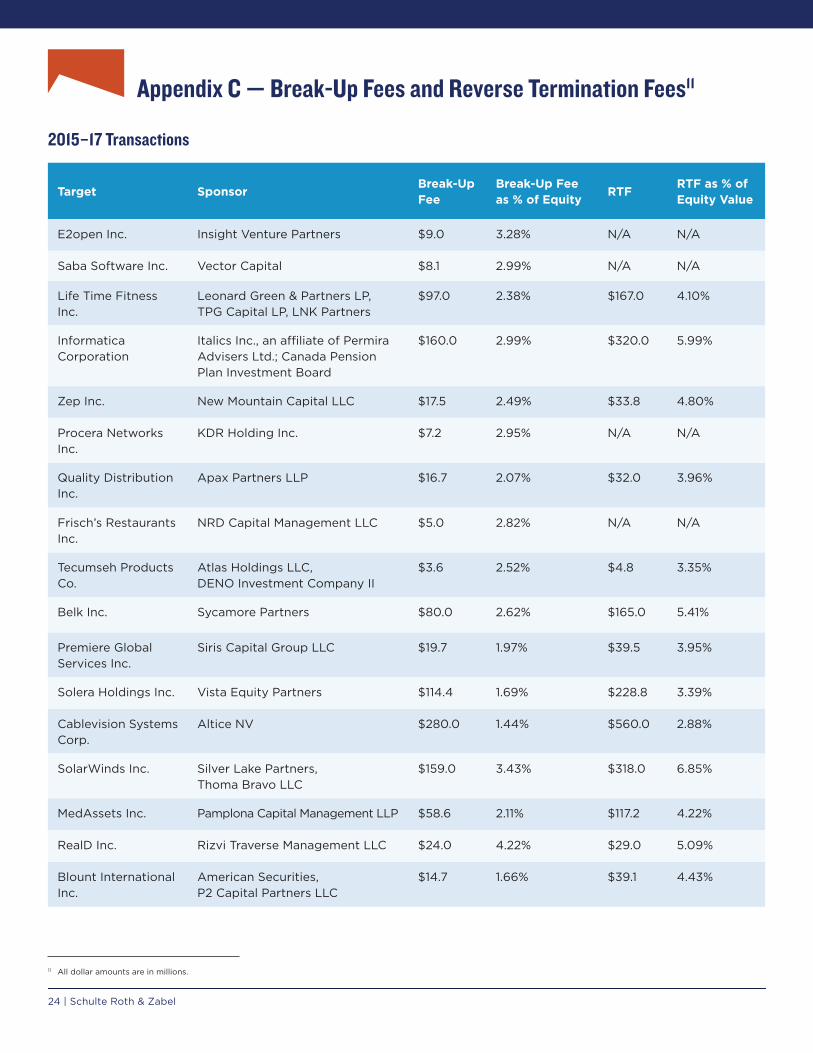
Appendix C — Break-Up Fees and Reverse Termination Fees11
2015–17 Transactions
Target SponsorBreak-Up Fee
Break-Up Fee as % of Equity
RTFRTF as % of Equity Value
E2open Inc. Insight Venture Partners $9.0 3.28% N/A N/A
Saba Software Inc. Vector Capital $8.1 2.99% N/A N/A
Life Time Fitness Inc.
Leonard Green & Partners LP, TPG Capital LP, LNK Partners
$97.0 2.38% $167.0 4.10%
Informatica Corporation
Italics Inc., an affiliate of Permira Advisers Ltd.; Canada Pension Plan Investment Board
$160.0 2.99% $320.0 5.99%
Zep Inc. New Mountain Capital LLC $17.5 2.49% $33.8 4.80%
Procera Networks Inc.
KDR Holding Inc. $7.2 2.95% N/A N/A
Quality Distribution Inc.
Apax Partners LLP $16.7 2.07% $32.0 3.96%
Frisch’s Restaurants Inc.
NRD Capital Management LLC $5.0 2.82% N/A N/A
Tecumseh Products Co.
Atlas Holdings LLC, DENO Investment Company II
$3.6 2.52% $4.8 3.35%
Belk Inc. Sycamore Partners $80.0 2.62% $165.0 5.41%
Premiere Global Services Inc.
Siris Capital Group LLC $19.7 1.97% $39.5 3.95%
Solera Holdings Inc. Vista Equity Partners $114.4 1.69% $228.8 3.39%
Cablevision Systems Corp.
Altice NV $280.0 1.44% $560.0 2.88%
SolarWinds Inc. Silver Lake Partners, Thoma Bravo LLC
$159.0 3.43% $318.0 6.85%
MedAssets Inc. Pamplona Capital Management LLP $58.6 2.11% $117.2 4.22%
RealD Inc. Rizvi Traverse Management LLC $24.0 4.22% $29.0 5.09%
Blount International Inc.
American Securities, P2 Capital Partners LLC
$14.7 1.66% $39.1 4.43%
11 All dollar amounts are in millions.
Private Equity Buyer/Public Target M&A Deal Study: 2015-17 Review and Comparative Analysis | 25
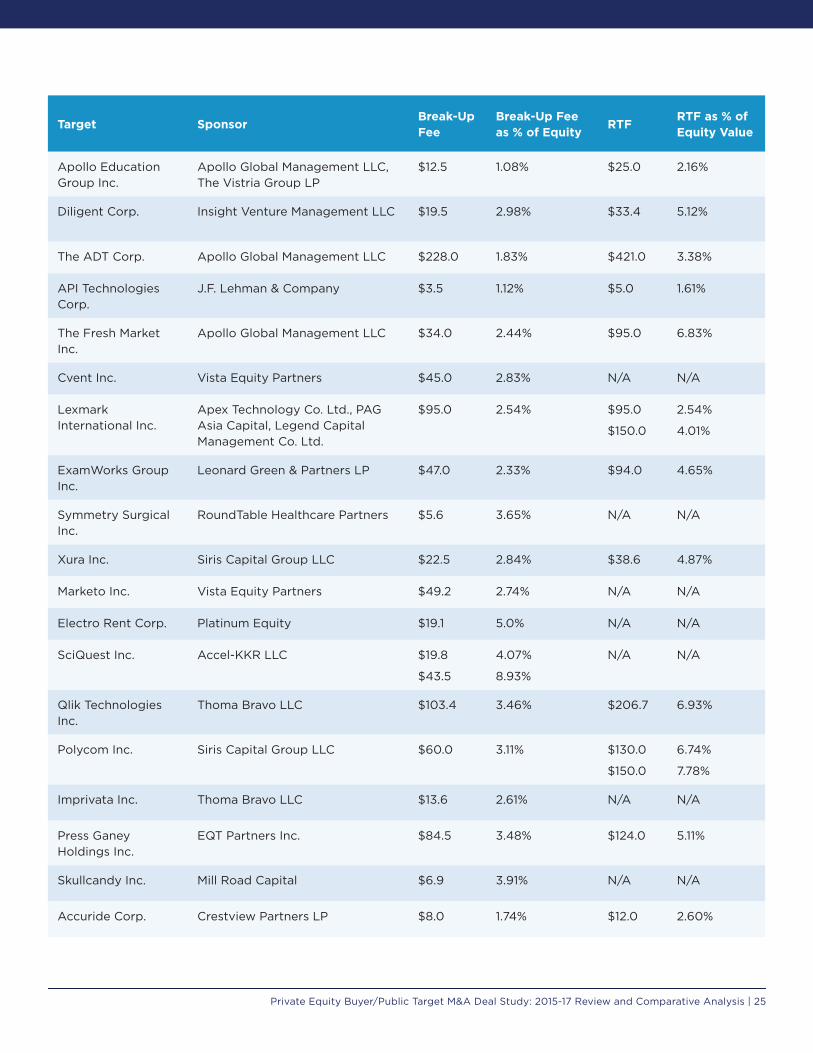
Target SponsorBreak-Up Fee
Break-Up Fee as % of Equity
RTFRTF as % of Equity Value
Apollo Education Group Inc.
Apollo Global Management LLC, The Vistria Group LP
$12.5 1.08% $25.0 2.16%
Diligent Corp. Insight Venture Management LLC $19.5 2.98% $33.4 5.12%
The ADT Corp. Apollo Global Management LLC $228.0 1.83% $421.0 3.38%
API Technologies Corp.
J.F. Lehman & Company $3.5 1.12% $5.0 1.61%
The Fresh Market Inc.
Apollo Global Management LLC $34.0 2.44% $95.0 6.83%
Cvent Inc. Vista Equity Partners $45.0 2.83% N/A N/A
Lexmark International Inc.
Apex Technology Co. Ltd., PAG Asia Capital, Legend Capital Management Co. Ltd.
$95.0 2.54% $95.0
$150.0
2.54%
4.01%
ExamWorks Group Inc.
Leonard Green & Partners LP $47.0 2.33% $94.0 4.65%
Symmetry Surgical Inc.
RoundTable Healthcare Partners $5.6 3.65% N/A N/A
Xura Inc. Siris Capital Group LLC $22.5 2.84% $38.6 4.87%
Marketo Inc. Vista Equity Partners $49.2 2.74% N/A N/A
Electro Rent Corp. Platinum Equity $19.1 5.0% N/A N/A
SciQuest Inc. Accel-KKR LLC $19.8
$43.5
4.07%
8.93%
N/A N/A
Qlik Technologies Inc.
Thoma Bravo LLC $103.4 3.46% $206.7 6.93%
Polycom Inc. Siris Capital Group LLC $60.0 3.11% $130.0
$150.0
6.74%
7.78%
Imprivata Inc. Thoma Bravo LLC $13.6 2.61% N/A N/A
Press Ganey Holdings Inc.
EQT Partners Inc. $84.5 3.48% $124.0 5.11%
Skullcandy Inc. Mill Road Capital $6.9 3.91% N/A N/A
Accuride Corp. Crestview Partners LP $8.0 1.74% $12.0 2.60%
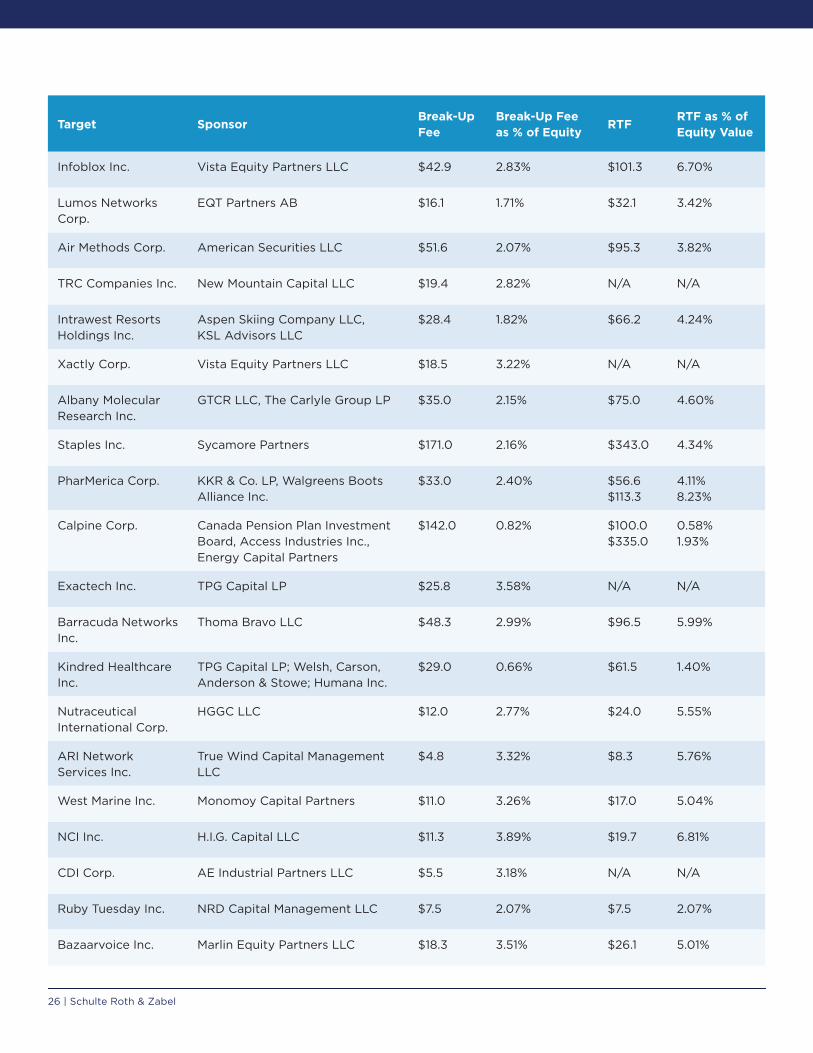
26 | Schulte Roth & Zabel
Target SponsorBreak-Up Fee
Break-Up Fee as % of Equity
RTFRTF as % of Equity Value
Infoblox Inc. Vista Equity Partners LLC $42.9 2.83% $101.3 6.70%
Lumos Networks Corp.
EQT Partners AB $16.1 1.71% $32.1 3.42%
Air Methods Corp. American Securities LLC $51.6 2.07% $95.3 3.82%
TRC Companies Inc. New Mountain Capital LLC $19.4 2.82% N/A N/A
Intrawest Resorts Holdings Inc.
Aspen Skiing Company LLC, KSL Advisors LLC
$28.4 1.82% $66.2 4.24%
Xactly Corp. Vista Equity Partners LLC $18.5 3.22% N/A N/A
Albany Molecular Research Inc.
GTCR LLC, The Carlyle Group LP $35.0 2.15% $75.0 4.60%
Staples Inc. Sycamore Partners $171.0 2.16% $343.0 4.34%
PharMerica Corp. KKR & Co. LP, Walgreens Boots Alliance Inc.
$33.0 2.40% $56.6 $113.3
4.11% 8.23%
Calpine Corp. Canada Pension Plan Investment Board, Access Industries Inc., Energy Capital Partners
$142.0 0.82% $100.0 $335.0
0.58% 1.93%
Exactech Inc. TPG Capital LP $25.8 3.58% N/A N/A
Barracuda Networks Inc.
Thoma Bravo LLC $48.3 2.99% $96.5 5.99%
Kindred Healthcare Inc.
TPG Capital LP; Welsh, Carson, Anderson & Stowe; Humana Inc.
$29.0 0.66% $61.5 1.40%
Nutraceutical International Corp.
HGGC LLC $12.0 2.77% $24.0 5.55%
ARI Network Services Inc.
True Wind Capital Management LLC
$4.8 3.32% $8.3 5.76%
West Marine Inc. Monomoy Capital Partners $11.0 3.26% $17.0 5.04%
NCI Inc. H.I.G. Capital LLC $11.3 3.89% $19.7 6.81%
CDI Corp. AE Industrial Partners LLC $5.5 3.18% N/A N/A
Ruby Tuesday Inc. NRD Capital Management LLC $7.5 2.07% $7.5 2.07%
Bazaarvoice Inc. Marlin Equity Partners LLC $18.3 3.51% $26.1 5.01%

Private Equity Buyer/Public Target M&A Deal Study: 2015-17 Review and Comparative Analysis | 27
Schulte Roth & Zabel’s M&A and Securities Group
Schulte Roth & Zabel’s M&A and Securities Group advises private investment funds, portfolio companies and publicly traded companies in public and private M&A transactions, including leveraged buyouts, “going private” transactions, tender offers and proxy contests, cross-border transactions and leveraged recapitalizations. Our clients include financial and strategic buyers and sellers and financial advisers in domestic and cross-border transactions across a wide range of business sectors, including automotive, airlines, hospitality, banking, chemicals, distribution services, supermarket, financial services, health care, investment management, media, real estate, manufacturing and telecommunications.
Consistently recognized for industry-leading deals, SRZ recently won two “Deal of the Year” awards at the 2018 International M&A Advisor Awards, the “M&A Deal of the Year” award at the 2017 M&A Advisor Awards and two “Deal of the Year” awards at the 2017 Americas M&A Atlas Awards, Middle Markets. Founded in 1969, SRZ is a multidisciplinary law firm with offices in New York, Washington, D.C. and London. The firm is widely regarded as one of the premier legal advisers to private investment funds.
AcknowledgementsA team of Schulte Roth & Zabel lawyers contributed to this effort. The principal author was Richard A. Presutti with associates Matthew J. Gruenberg, Andrew J. Fadale, Stavan S. Desai, William J. Morici and David M. Rothenberg as contributing authors.
M&A and Securities Group Co–Chairs
Stuart D. Freedman+1 [email protected]
Richard A. Presutti+1 [email protected]
M&A and Securities Group Partners
Aneliya S. Crawford+1 [email protected]
Eleazer Klein+1 [email protected]
Antonio L. Diaz-Albertini+1 [email protected]
Robert B. Loper+1 [email protected]
Michael E. Gilligan+1 [email protected]
Marc Weingarten+1 [email protected]
Peter Jonathan Halasz+1 [email protected]

GETTING THE COMPLEX DEALS DONESchulte Roth & Zabel’s M&A and Securities Group helps clients achieve their business objectives by structuring and executing complex deals across a range of industries
Schulte Roth & Zabel LLP | New York | Washington DC | London | www.srz.com
The contents of these materials may constitute attorney advertising under the regulations of various jurisdictions.
Year after year, we represent all types of clients — including financial sponsors, their portfolio companies and publicly traded companies — in a wide variety of award-winning deals, including public and private domestic and cross-border M&A transactions, leveraged buyouts and “going private” transactions, spin-offs and joint ventures, proxy and other control contests and capital markets transactions.
Our lawyers work seamlessly across practice groups to address all aspects of complex mergers and acquisitions, from employment and environmental to antitrust and tax issues. When it comes to the ins and outs of M&A activity, our practical solutions solve the full range of business-critical issues to move deals forward.
Acquisition of Safeway Inc. $9.2 billion
January 2015
Representative Deals
Sale of Home Meridian
International Inc. $100 million
February 2016
Acquisition of Trican Well Service Ltd.’s
U.S. Assets $247 million March 2016
Acquisition ofRevenew Inc.
July 2016
Sale of YP Holdings
July 2017
Acquisitions of Community Health Systems
and IASIS Healthcare September 2017
Sale of OnX Enterprise Solutions
October 2017
Acquisition of Assets of Club Exploria and
Club Exploria Resorts November 2017
Acquisition of stake in El Rancho Supermercado
November 2017
Acquisition of Bazaarvoice Inc.
$521 million February 2018
Acquisition of PricewaterhouseCoopers’ U.S. public sector business
May 2018
Acquisition of GE Healthcare unit
$1.05 billionJuly 2018
Acquisition of 80% of BBVA’s property
portfolio €4 billion Pending
Acquisition of a portfolio of U.K. loans from
Permanent TSB £2.29 billion
November 2016
Sale ofCharter NEX Films
May 2017
Acquisition of Teradata’s Marketing Applications Business
$90 million July 2016
Acquisition of Bushkill Group
May 2017
Acquisition of Tangoe Inc. $256 million June 2017
Acquisition of Sustainable Growth
AdvisersJuly 2018
Sale ofBBB IndustriesAugust 2018
Acquisition ofRockPile Energy Services
July 2017
Acquisition ofstake in HSH Nordbank
Pending
Acquisition of ABC Group Inc.
July 2016Sale of ABC Group Inc.
November 2016
Merger to form Perspecta Inc.
June 2018

This communication is issued by Schulte Roth & Zabel LLP for informational purposes only and does not constitute legal advice or establish an attorney-client relationship. In some jurisdictions, this publication may be considered attorney advertising. ©2018 Schulte Roth & Zabel LLP. All rights reserved. SCHULTE ROTH & ZABEL is the registered trademark of Schulte Roth & Zabel LLP. This communication displays certain trademarks and logos owned by the companies discussed herein. All such trademarks remain property of their respective owners, and are used only directly to identify or describe the companies being discussed herein. Their use is not intended to indicate and in no way indicates any sponsorship, endorsement or affiliation of Schulte Roth & Zabel LLP, on the one hand, and the owners of such trademarks and logos, on the other hand.
Schulte Roth & Zabel New York | Washington DC | Londonwww.srz.com


![DCB Bank Ltd. & Annapurna Microfinance Company seal equity deal [Company Update]](https://img.dokumen.tips/doc/110x75/56d6bcdb1a28ab30168bbf4f/dcb-bank-ltd-annapurna-microfinance-company-seal-equity-deal-company-update.jpg)


