Embed Size (px)
Citation preview

Prism’s Approach to Modeling Natural Catastrophe Risk
Casualty Actuarial Society
November 12, 2007
Mark Rouck, CPA, CFA

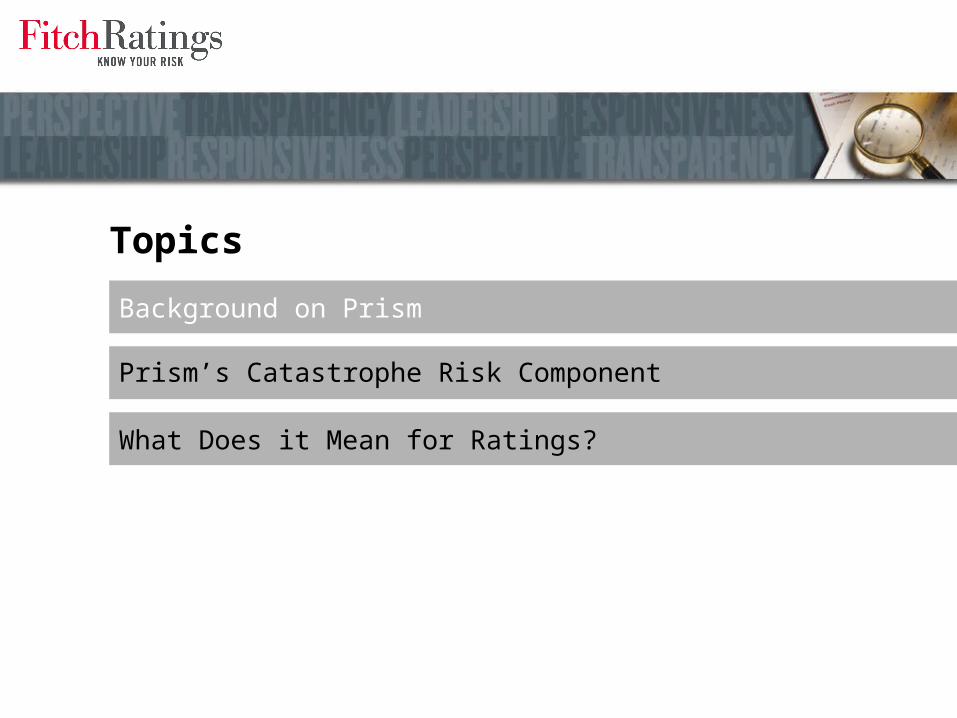
Topics
Background on Prism
Prism’s Catastrophe Risk Component
What Does it Mean for Ratings?
Topics
Background on Prism
Prism’s Catastrophe Risk Component
What Does it Mean for Ratings?
4
Nov-2007Fully Implemented with “cure” period
Nov-2007Fully Implemented with “cure” period
Late 06-Early 07Late 06-Early 07
2nd QUARTER, 20062nd QUARTER, 2006
PRIOR TO 2006PRIOR TO 2006
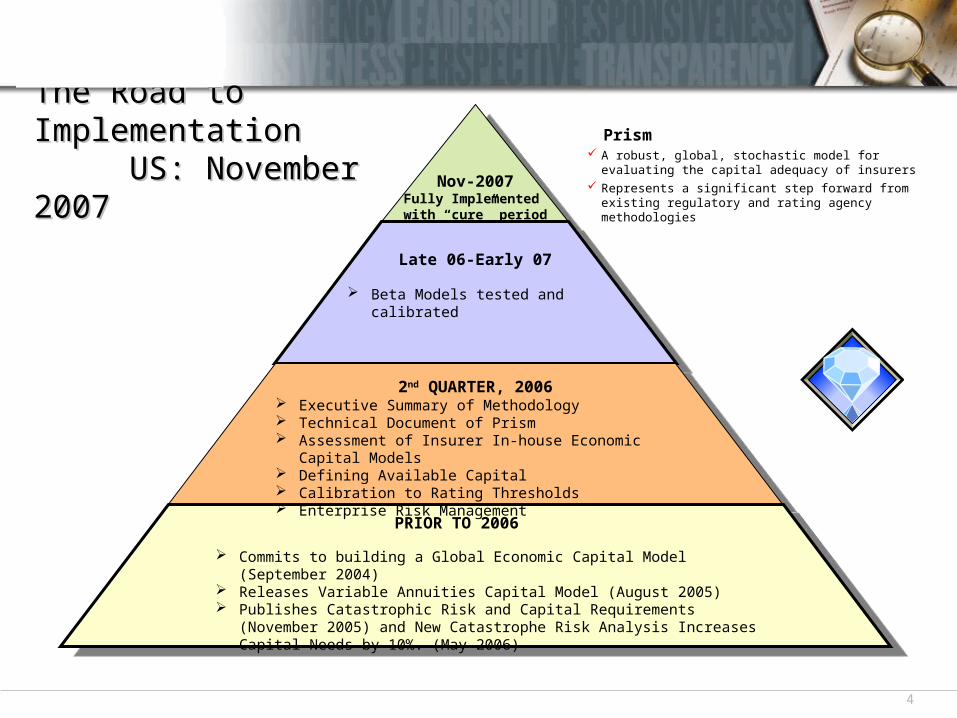
The Road to ImplementationThe Road to Implementation US: November 2007 US: November 2007
Beta Models tested and calibrated
Executive Summary of Methodology Technical Document of Prism Assessment of Insurer In-house Economic Capital Models Defining Available Capital Calibration to Rating Thresholds Enterprise Risk Management
Commits to building a Global Economic Capital Model (September 2004) Releases Variable Annuities Capital Model (August 2005) Publishes Catastrophic Risk and Capital Requirements (November 2005) and New
Catastrophe Risk Analysis Increases Capital Needs by 10%. (May 2006)
Prism A robust, global, stochastic model for evaluating
the capital adequacy of insurers Represents a significant step forward from existing
regulatory and rating agency methodologies
5
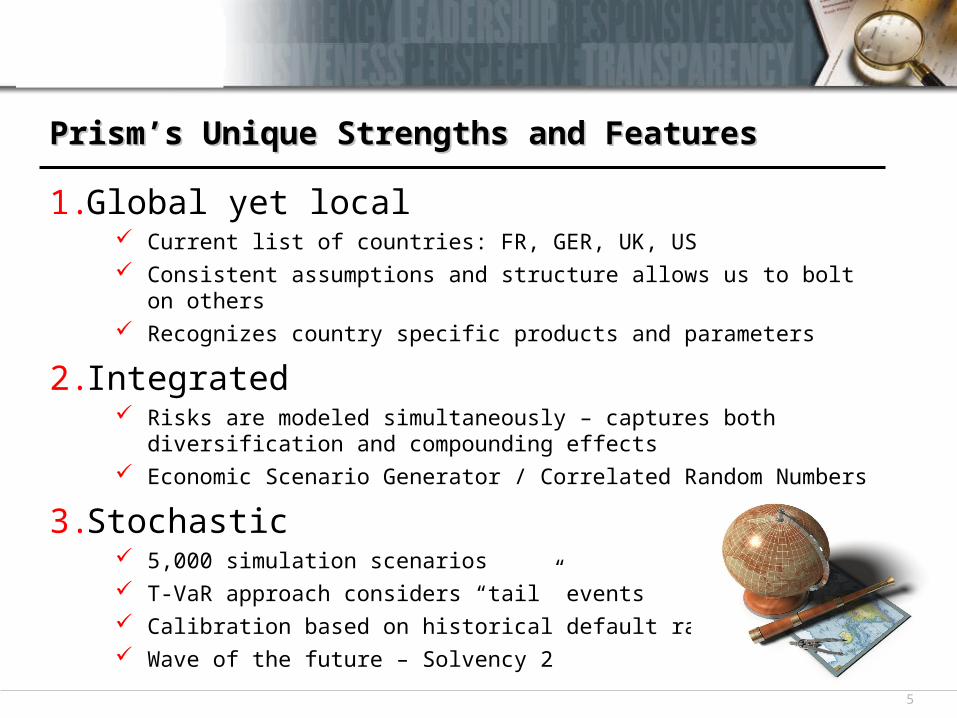
1.Global yet local Current list of countries: FR, GER, UK, US Consistent assumptions and structure allows us to bolt on others Recognizes country specific products and parameters
2. Integrated Risks are modeled simultaneously – captures both diversification and
compounding effects Economic Scenario Generator / Correlated Random Numbers
3.Stochastic 5,000 simulation scenarios T-VaR approach considers “tail” events Calibration based on historical default rates Wave of the future – Solvency 2
Prism’s Unique Strengths and FeaturesPrism’s Unique Strengths and Features

6
Modeling Methods – Risk Elements CapturedModeling Methods – Risk Elements Captured
“Aggregator” Consistent economic scenario set Similar Cat event set Correlated random numbers
Underwriting Risk Use a collective risk
model of frequency and severity of losses.
Relies on ELR, Attachments, Limits
Factors one year of new business.
Underwriting Risk Use a collective risk
model of frequency and severity of losses.
Relies on ELR, Attachments, Limits
Factors one year of new business.
ALM (Market) Risk Incorporates risk-free
yield curve (bonds, mortgages), real estate and equity returns (DAX, FTSE, CAC).
Use a proprietary, integrated scenario generator.
ALM (Market) Risk Incorporates risk-free
yield curve (bonds, mortgages), real estate and equity returns (DAX, FTSE, CAC).
Use a proprietary, integrated scenario generator.
Reserve Risk Incorporates reserve
adequacy analysis Use Mack Method to
Estimate Volatility Utilize several checks
to ensure data integrity
Asbestos & Environmental Losses Evaluated Separately
Reserve Risk Incorporates reserve
adequacy analysis Use Mack Method to
Estimate Volatility Utilize several checks
to ensure data integrity
Asbestos & Environmental Losses Evaluated Separately
Catastrophe Risk Use Company
Provided PMLs Use AIR (Catrader)
software. Consideration of up to
1 in 10,000 event
Catastrophe Risk Use Company
Provided PMLs Use AIR (Catrader)
software. Consideration of up to
1 in 10,000 event
Credit Risk Incorporates defaults,
migration and spread volatility
Use common market indices to establish parameters for asset type and quality
Over 50 asset buckets.
Stochastically model reinsurer default risk
Credit Risk Incorporates defaults,
migration and spread volatility
Use common market indices to establish parameters for asset type and quality
Over 50 asset buckets.
Stochastically model reinsurer default risk
Each Company will potentially have unique risk curves

7
Two Core Outputs Determine Prism ScoresTwo Core Outputs Determine Prism Scores
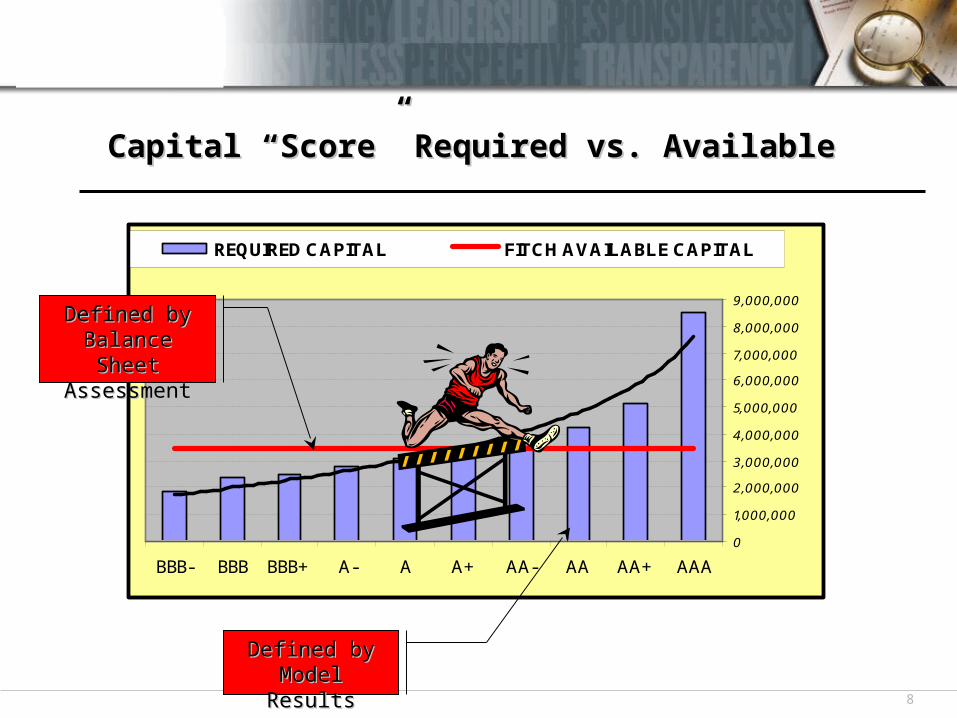
1. Available Capital or “AC” Economic, not accounting based number
What is amount of liquid capital in a controlled run-off situation
2. Required Capital or “RC” Distribution table produced by the simulation
RC is not a single number but a range of outcomes
Derived by applying the appropriate T-VaR against distribution
Simulation calculates PV of cash inflows and outflows over 30 year balance sheet run-off (with one year of new business) Cash outflows: claims and expenses
Cash inflows: investment earnings and premiums on new business
Prism Score is point where AC intersects RC The highest rating level at which that occurs is your Prism Score
8
0
1,000,000
2,000,000
3,000,000
4,000,000
5,000,000
6,000,000
7,000,000
8,000,000
9,000,000
AAAAA+AAAA-A+AA-BBB+BBBBBB-
REQUIRED CAPITAL FITCH AVAILABLE CAPITAL
Capital “Score” Required vs. AvailableCapital “Score” Required vs. Available
Defined by Defined by Model ResultsModel Results
Defined by Defined by Balance Sheet Balance Sheet AssessmentAssessment

9
Prism: 2006 US Non-Life ResultsPrism: 2006 US Non-Life Results
Confirmed overall existing capital assessment of Fitch universe
Limited (~10% of group’s reviewed) Prism related rating actions
Certain sectors performed better than expected e.g. personal auto
PRISM SCORES: DISTRIBUTION AT YEAREND 2006US: Non-Life Groups
Prism Score# of Non-Life
Insurer GroupsPercent of Total
(%)
AAA 20 47 AA+ 7 16 AA 2 5 AA- 1 2 A+ 6 14 A 3 7 A- 4 9 BBB+ 0 0BBB 0 0BBB- 0 0
Non-investment grade 0 -
Total 43 100
Topics
Background on Prism
Prism’s Catastrophe Risk Component
What Does it Mean for Ratings?

11
Prism’s Catastrophe Risk Component
> Insurer provided modeled annual aggregate catastrophe losses at various return periods – Frequency / Severity Assumptions = Near-term
– Demand Surge = Occurrence base
> AIR Catrader models gross annual aggregate catastrophe losses at various return periods based on by state premium distribution and AIR event sets
> Interpolation generates modeled annual aggregate gross loss distribution ranging from 20-10K year return periods

12
Prism’s Catastrophe Risk Component (cont.)
> Catastrophe reinsurance program applied against gross losses to create annual aggregate modeled net loss distribution– Alternatively will use insurers full net annual aggregate
catastrophe loss distribution if provided
> Alternatives to traditional reinsurance (i.e. catastrophe bonds, ILWs) added to catastrophe reinsurance program based on perils and attachment points

13
Prism’s Catastrophe Risk Component (cont.)
> Modeled net catastrophe losses combined with other risk components to determine each scenario’s additional capital needs
YearAsset
BalanceNet
PremiumInvestment
Income ClaimsCAT
Losses
Asset Balance Ending
Added Required Capital NPV
1 5,491 2,013 1,245 3,203 152 5,394 - - 2 5,394 - 216 2,017 - 3,593 - - . 485 - 19 388 - 116 . 116 - 4 153 - (33) 33 22
30 - - - 43 - (43) 43 27
Total 49

Topics
Background on Prism
Prism’s Catastrophe Risk Component
What Does it Mean for Ratings?
15
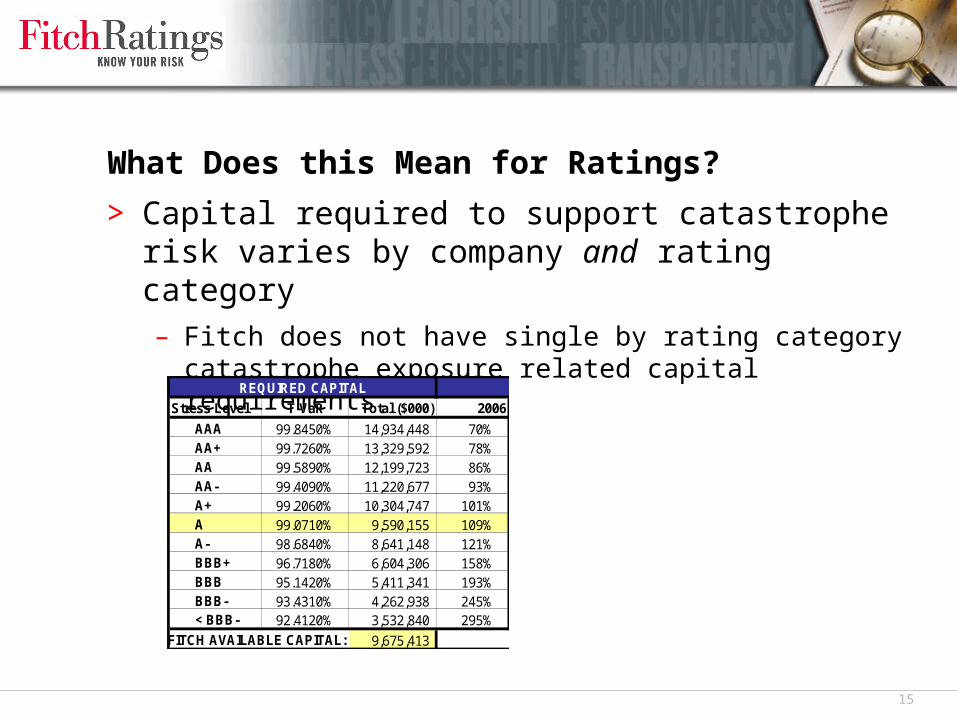
What Does this Mean for Ratings?
> Capital required to support catastrophe risk varies by company and rating category– Fitch does not have single by rating category catastrophe
exposure related capital requirements
Stress Level T-VaR Total ($000) 2006
AAA 99.8450% 14,934,448 70%AA+ 99.7260% 13,329,592 78%AA 99.5890% 12,199,723 86%AA- 99.4090% 11,220,677 93%A+ 99.2060% 10,304,747 101%A 99.0710% 9,590,155 109%A- 98.6840% 8,641,148 121%BBB+ 96.7180% 6,604,306 158%BBB 95.1420% 5,411,341 193%BBB- 93.4310% 4,262,938 245%< BBB- 92.4120% 3,532,840 295%
FITCH AVAILABLE CAPITAL: 9,675,413
REQUIRED CAPITAL

16
What Does this Mean for Ratings? (continued)
> Catastrophe related “stress test” implicitly considered through– Use of annual aggregate modeled catastrophe losses
– T-VaR approach applied to overall required capital distribution
– In unique cases, modeled catastrophe results can also be stressed by shifting company supplied or CATRADER generated loss distributions upward

17
Catastrophe Findings from 2005 Beta Testing
> Insurers with large homeowners or coastal property coverages have tremendous capital exposure to extreme tail events
– For these insurers required capital can materially exceed 100 year and 250 year PML used in factor based models
> Others such as specialty liability underwriters have virtually no catastrophe exposure
> For universe in aggregate, catastrophe related required capital was equal to 8.9% of aggregate exposure
> Ignoring insurers without catastrophe exposure, range of required catastrophe capital / exposure was 6% - 37%
18
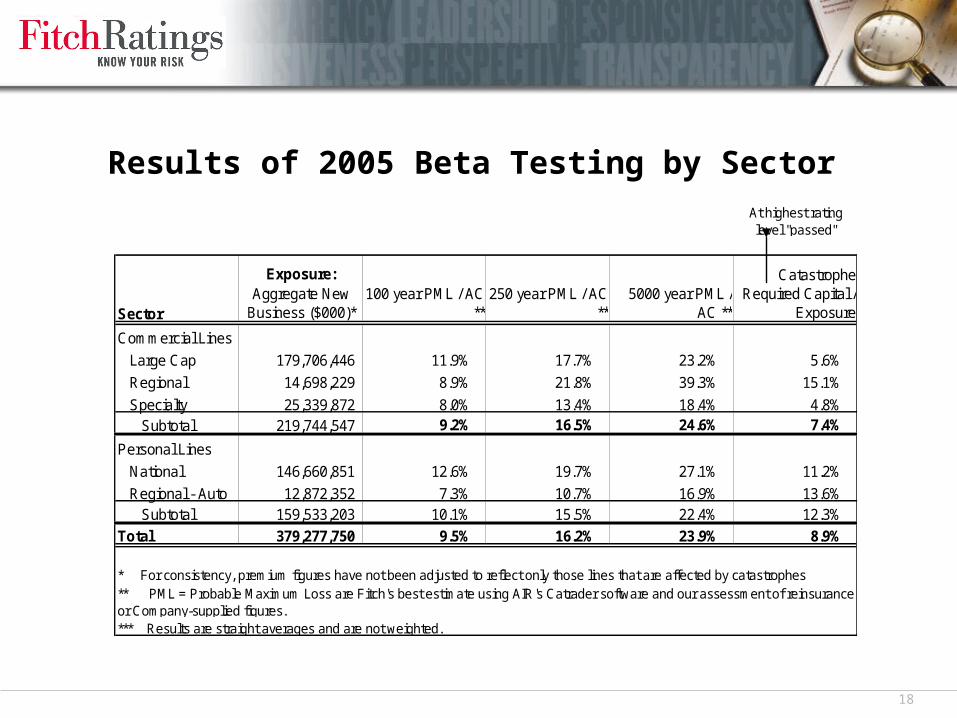
Results of 2005 Beta Testing by SectorAt highest rating level "passed"
Sector
Exposure: Aggregate New
Business ($000)*100 year PML / AC
**250 year PML / AC
**5000 year PML /
AC **
Catastrophe Required Capital /
Exposure
Commercial Lines
Large Cap 179,706,446 11.9% 17.7% 23.2% 5.6%
Regional 14,698,229 8.9% 21.8% 39.3% 15.1%
Specialty 25,339,872 8.0% 13.4% 18.4% 4.8%Subtotal 219,744,547 9.2% 16.5% 24.6% 7.4%
Personal Lines
National 146,660,851 12.6% 19.7% 27.1% 11.2%
Regional - Auto 12,872,352 7.3% 10.7% 16.9% 13.6%Subtotal 159,533,203 10.1% 15.5% 22.4% 12.3%
Total 379,277,750 9.5% 16.2% 23.9% 8.9%
* For consistency, premium figures have not been adjusted to reflect only those lines that are affected by catastrophes
*** Results are straight averages and are not weighted.
** PML = Probable Maximum Loss are Fitch's best estimate using AIR's Catrader software and our assessment of reinsurance or Company-supplied figures.

19
Takeaways
> Fitch uses Prism to determine capital requirements for natural catastrophe risk
> Prism considers modeled annual aggregate catastrophe loss distributions rather than select points along the distribution to develop capital requirements
> Capital required to support catastrophe risk varies by insurer and by rating category
> “Stress Tests” implicitly considered through annual aggregate and T-VaR approaches employed by Prism
20
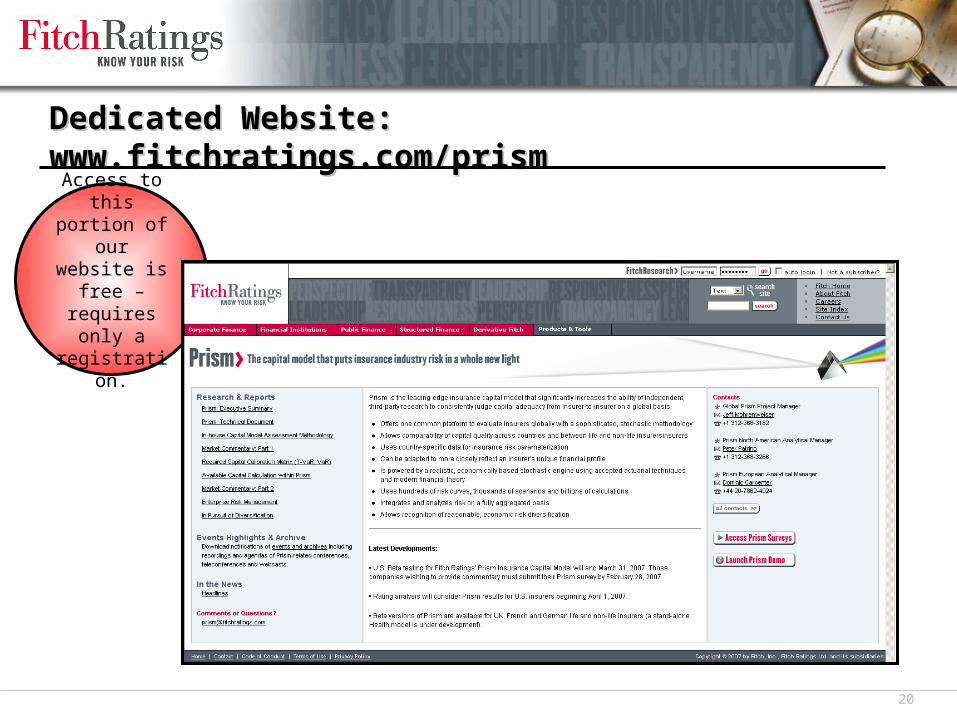
Access to this portion of our
website is free –
requires only a registration.
Dedicated Website: www.fitchratings.com/prismDedicated Website: www.fitchratings.com/prism
The Fitch Group Fitch Ratings Algorithmics Fitch Training
Fitch Ratingswww.fitchratings.com
London101 Finsbury Pavement London EC2A 1RS +44 20 7417 4222
New YorkOne State Street PlazaNew York, NY 10004+1 212 908 0500+1 800 75 FITCH
Singapore7 Temasek Blvd.Singapore 038987+65 6336 6801