Embed Size (px)
Citation preview

Prism Medical (TSX-V – PM)
August 2012Stuart Meldrum, CEOGeorge Chiarucci, CFO

Forward-looking statements
This presentation contains forward-looking statements relating to our operations and to the environment in which we operate and our strategy, action plans and investments, which may involve estimates, forecasts and projections. These statements are not guarantees of future performance and involve risks and uncertainties that are difficult to predict and/or are beyond our control. A number of important factors could cause actual outcomes and results to differ materially from those expressed in these forward-looking statements. These factors include those set forth in this presentation and our other public filings. Consequently, readers should not place any undue reliance on such forward-looking statements. These forward-looking statements are made as of the date of this presentation. Prism Medical is under no obligation to update any forward-looking statements contained herein should material facts change due to new information, future events or other factors. All forward-looking statements attributable to Prism Medical are expressly qualified by these cautionary statements.
2
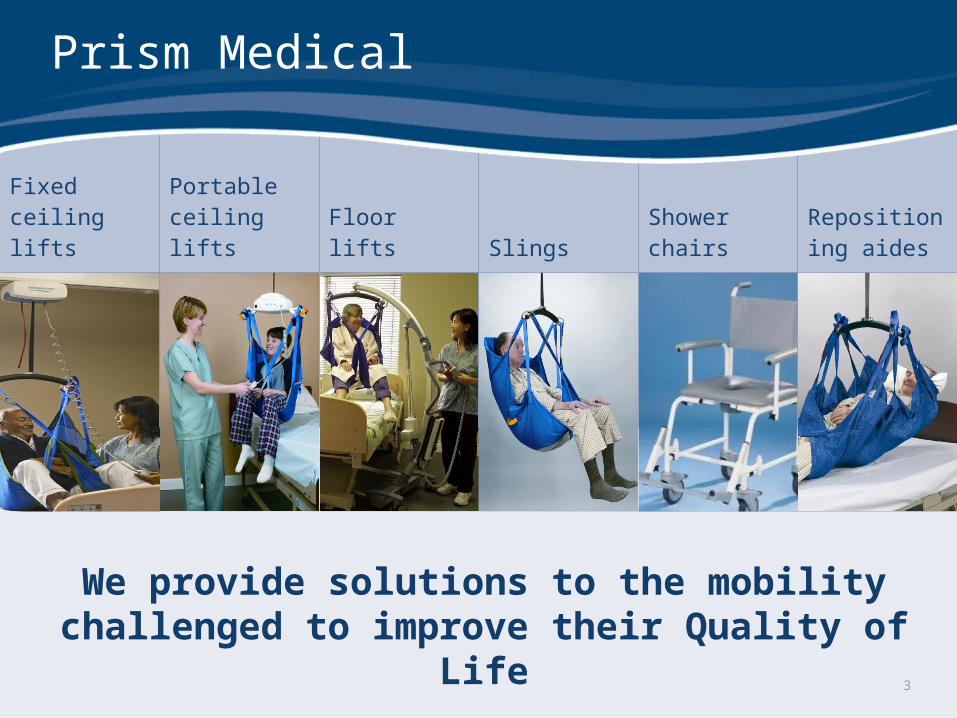
Fixedceiling lifts
Portable ceiling lifts
Floor lifts Slings
Shower chairs
Repositioning aides
3
Prism Medical
We provide solutions to the mobility challenged to improve their Quality of Life

5.3% Yield
Global presence
United Kingdom2 manufacturing facilities6 regional service and training centres
United StatesManufacturing facility5 regional service centresTraining centre
CanadaR&D facilityContracted third party serviceTraining centre
450 employees
$76M 2011 Revenue
$10M 2011 EBITDA
4
17% EPS CAGR last 5 years
August 10, 2012

Growth business
5
Aging population
2011 2030
In 2030, 20% of North Americans will be over 65
First baby Boomers turn 65
65% of healthcare dollars are spent on patients over age 65
25% of those over age 80 are immobile

Strong demand for mobility equipment
6
Acute care
Homecare
Long-term care
Safe patient handling• Reduces caregiver injury
Homecare• Healthcare system wants to
keep patients at home
Two major themes

7
$1Bper yearCost to the US healthcare system due to workers’ compensation
RN injuries due to moving patients
Healthcare cost pressures intensifying
35%moreLong-term care costs are 35% higher than home care
Global economic situation resulting in budgetary pressures on healthcare spending
Homecare can take billions of costs out of the healthcare system
7
38% of RNs suffer back pain that requires leave from work

Vertical integration / Local service
8
Manufacturing• Full range of products
• Engineering and design
Service• Assess
• Installation
• Maintenance
• Training
Sales• Direct
• Dealer channels
Vertical integrationmeans higher margins
Service focus• Recurring revenue• Higher customer satisfaction
One stop shop•Higher customer retention rates•Repeat business / cross sell

h
Growth strategy – organic
9
U.S. market
• Focus on underdeveloped institutional market
• Geographic expansion
• “Made in the USA”
New products
• Distribute a broader range of globally sourced products
• Develop more affordable products at lower cost
Homecare
• Homecare will be the primary delivery channel
• Lead the developing homecare market in North America
• Leverage our extensive UK distribution and service network
9

Meeting demand with innovative products
10
Consumer Lift
• Lift a maximum of 300 lbs
• Direct sales
• ~$2,000 installed
• Portable gantry offers whole house mobility at lower cost
Institutional Lift
• Lift a maximum of 450-1,000 lbs
• Direct sales and independent dealers
• ~$4,000 installed
• Fixed ceiling track for full-room mobility
Designing homecare–specific products tailored tothe North American Market
FPOFPO
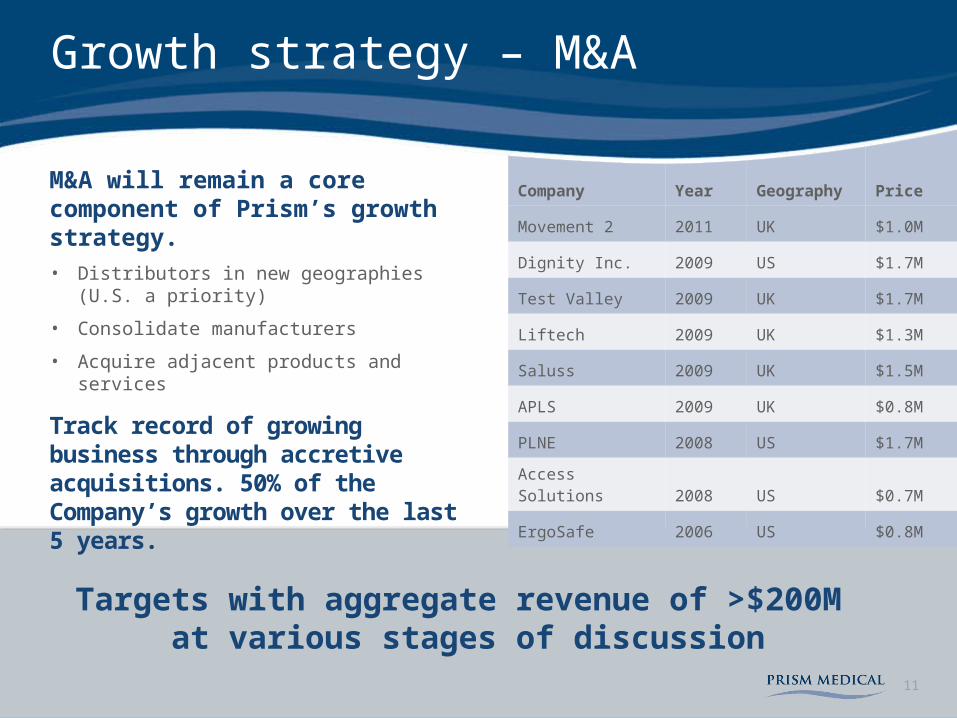
Company Year Geography Price
Movement 2 2011 UK $1.0M
Dignity Inc. 2009 US $1.7M
Test Valley 2009 UK $1.7M
Liftech 2009 UK $1.3M
Saluss 2009 UK $1.5M
APLS 2009 UK $0.8M
PLNE 2008 US $1.7M
Access Solutions 2008 US $0.7M
ErgoSafe 2006 US $0.8M
Growth strategy – M&A
11
M&A will remain a core component of Prism’s growth strategy. • Distributors in new geographies (U.S. a priority)
• Consolidate manufacturers
• Acquire adjacent products and services
Track record of growing business through accretive acquisitions. 50% of the Company’s growth over the last 5 years.
Targets with aggregate revenue of >$200M at various stages of discussion

With recent product and service additions
$800M
$3B
Market opportunity
12

Financials
13
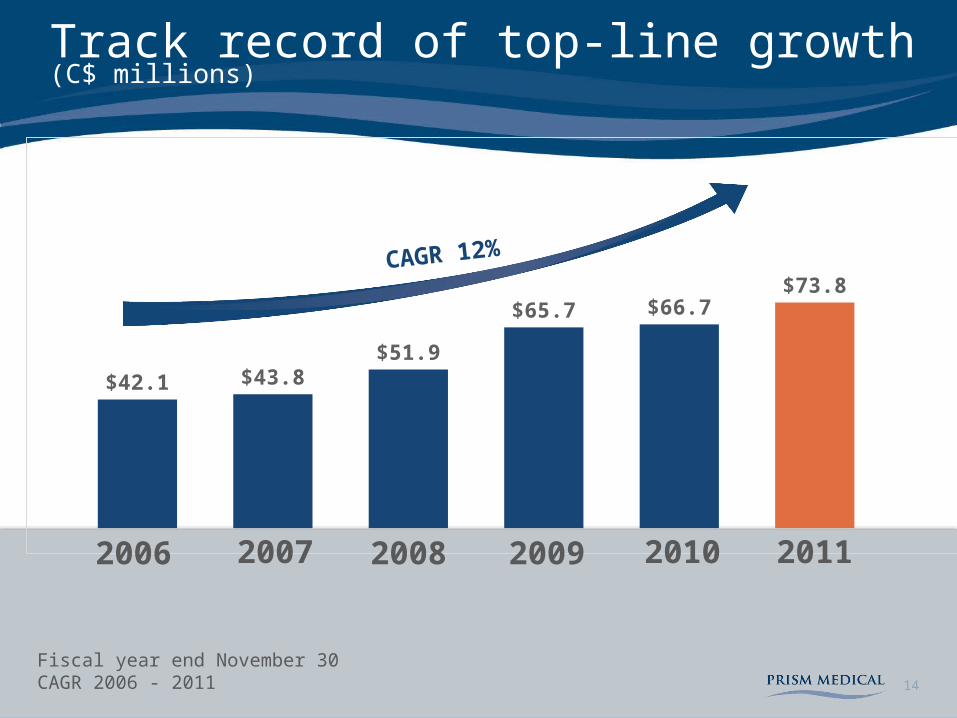
$42.1 $43.8$51.9
$65.7 $66.7$73.8
Track record of top-line growth (C$ millions)
14
20072006 2008 2009 2010
Fiscal year end November 30CAGR 2006 - 2011
2011
CAGR 12%

$42.1 $42.8
$54.1
$71.0$80.0
$89.0
Revenue – foreign exchange impact (C$ millions)
15
20072006 2008 2009 2010
Fiscal year end November 30CAGR 2006 – 2011Data based on constant 2006 exchange rates
2011
CAGR 16%
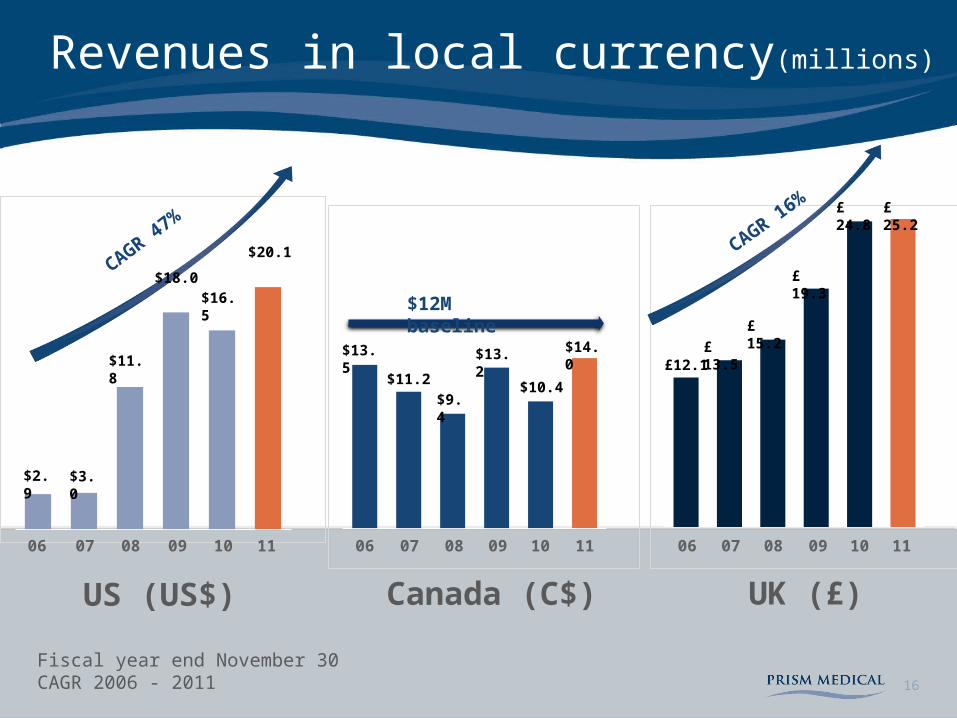
Revenues in local currency(millions)
16
US (US$) UK (£)Canada (C$)
$2.9 $3.0
$11.8
$18.0$16.5
$13.5
$11.2
$9.4
$13.2
$10.4
£12.1£ 13.5
£ 15.2
£ 19.3
£ 24.8
CAGR 47%
$12M baseline
Fiscal year end November 30CAGR 2006 - 2011
$20.1
$14.0
£ 25.2
CAGR 16%
06 07 08 09 10 11 06 07 08 09 10 11 06 07 08 09 10 11

EBITDA (C$ millions)
17
20072006 2008 2009 2010
Fiscal year end November 30CAGR 2006 - 2011
2011
CAGR 14%
$5.2
$7.6
$10.1 $10.3 $8.8
$9.8

Earnings per share (C$ fully diluted)
18
$0.27
$0.45
$0.67 $0.66
$0.52 $0.58
20072006 2008 2009 2010
Fiscal year end November 30CAGR 2006 - 2011
2011
CAGR 17%

In 000’s of C$ except per share data FY 2011 FY 2010 Growth Q2 2012 Q2 2011 Growth
Revenue 73,842 66,657 10.8% 21,912 18,811 16.5%
EBITDA 9,751 8,758 11.3% 2,843 2,768 2.7%
Net income 4,042 3,572 13.2% 1,538 1,143 34.6%
Earnings per share (F.D.) 0.58 0.52 11.5% 0.18 0.16 12.5%
Financial overview(Q2 results under IFRS)
19
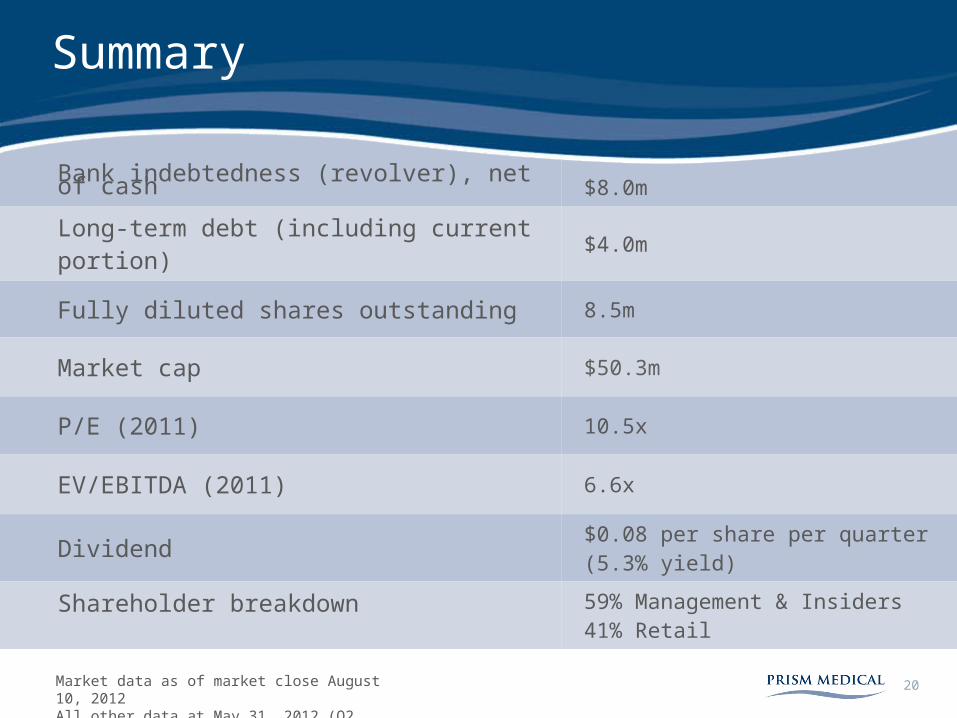
Bank indebtedness (revolver), net of cash $8.0m
Long-term debt (including current portion) $4.0m
Fully diluted shares outstanding 8.5m
Market cap $50.3m
P/E (2011) 10.5x
EV/EBITDA (2011) 6.6x
Dividend $0.08 per share per quarter (5.3% yield)
Shareholder breakdown 59% Management & Insiders41% Retail
Summary
20Market data as of market close August 10, 2012All other data at May 31, 2012 (Q2 2012)

Investment considerations
• Baby boomers aging and focused on quality of life
• Healthcare systems globally under financial pressure
• Growing company in a $3 Billion market
• Track record of accretive M&A in all target markets
• Strong cash flow to support dividend
21
Prism offers improved quality of life at a reduced cost to the healthcare system

Click to edit Master title style
22
Prism Medical Ltd.
Established products and servicein a growing market
Head Office
480 University Avenue, Ste 100 Toronto, Ontario M5G 1V2
George Chiarucci, CFO Tel: (416) 260-2145 ext. 229Email: [email protected]
Babak Pedram, TMX Equicom Tel: (416) 815-0700 ext. 264Email: [email protected]