Embed Size (px)
Citation preview
Priscilla Chan and Mark Zuckerberg San Francisco General Hospital and Trauma Center
Transportation Program, Annual Summary
June 2018
1001 Potrero Avenue, San Francisco, CA 94110
This report was produced by:
Georgina Arias, Transportation Demand Manager
San Francisco Department of Public Health
101 Grove Street, San Francisco, CA 94102
Data analysis was produced by:
San Francisco Department of Public Health,
Fehr & Peers and Adavant Consulting

This page is intentionally left blank

Executive Summary
This report provides a summary of the ZSFG Transportation Program including an analysis of the
2017 travel survey results conducted with employees at ZSFG. These results monitor the
percentage of travelers using a particular type of transportation. The results are key to
informing SFDPH and SFMTA as to progress towards meeting the reduction targets and whether
tweaks to existing or additional courses of action are needed. All Transportation Program
metrics are from October 2016 - October 2017.
Summary
• 49% of staff drive alone, a 4% decrease from 2016
• 2,007 of the 6,260 staff participated in the survey, a 32% response rate
• Home Regions compared to 2016
o North Bay (77, 4%), no change
o San Francisco (941, 46%), 1%
o South Bay (397, 20%), 1%
o East Bay (568, 29%), 1%
• Employees who drive would drive less if these services were offered:
o Private shuttle service to/from SF neighborhoods (439, 14%)
o A discount to use Taxi/Uber/Lyft from Caltrain/Transbay Terminal/Ferry (411, 13%)
o Shuttle service with extended hours (4am-9pm) (334, 11%)
• Employees are most aware of bicycle parking facilities, carshare, pre-tax commuter
benefits, and the NextBus monitors and are least aware of the telecommuting policy
and Rideshare matching.
Drive Alone Mode Share Current vs. Target
53%
49%
47% 47% 47% 47%
41% 41% 41% 41%
39% 39% 39%
35%
40%
45%
50%
55%
2016 2017 2018 2019 2020 2021 2022 2023 2024 2025 2026
Dri
ve A
lon
e M
od
e S
ha
re
Date
Current
Target
This page is intentionally left blank

Table of Contents
Introduction .................................................................................................................................... 1
ZSFG TDM Program ........................................................................................................................ 1
Survey Results ................................................................................................................................ 9
Section 1: Employer .................................................................................................................. 10
Section 2: Employee Home Location ........................................................................................ 10
Section 3: Arrival and Departure Time ..................................................................................... 13
Section 4: How Employees Get to Work ................................................................................... 14
Section 5: TDM Program Opportunities ................................................................................... 18
Section 6: TDM Program Awareness and Use .......................................................................... 19
Section 7: Additional Comments .............................................................................................. 19
Upcoming Campus Activities ....................................................................................................... 21
Conclusion .................................................................................................................................... 21
Appendices ................................................................................................................................... 22

This page is intentionally left blank

1
Introduction
The San Francisco Department of Public Health (SFDPH) is committed to implementing a strong
Transportation Demand Management (TDM) program with the goal of reducing drive alone
vehicle trips to the Priscilla Chan and Mark Zuckerberg San Francisco General Hospital and
Trauma Center (ZSFG). This report provides a summary of the Transportation Program including
an analysis of the annual travel survey conducted with employees at ZSFG which monitors
travel mode split. This report is intended to inform campus leadership of program activities and
travel behavior to better guide transportation planning decisions.
ZSFG is the main public hospital in the City and serves as the only Level I Trauma Center for the
City of San Francisco and parts of San Mateo County. ZSFG is in a partnership with the
University of California, San Francisco (UCSF) and serves as a leading academic medical and
research center. Over 6,0001 employees travel to the ZSFG campus. The ZSFG campus
population is comprised of approximately 1,900 UCSF employees, 3,400 SFDPH employees, and
960 volunteers.
ZSFG True North
The “True North” mission represents ZSFG’s goals to direct all efforts towards caring for our
patients and community. ZSFG’s True North is depicted in Fig. 1. The ZSFG Transportation
Program is part of the hospital’s strategic plan to achieve the True North goals through safety,
quality, care experience, developing people and financial stewardship. SFDPH and UCSF are
working together to ensure that ZSFG attracts and retains quality staff providing the best health
care possible. ZSFG needs to ensure that the campus is fully accessible to staff and the more
than 100,000 patients who visit each year.
ZSFG TDM Program
SFDPH and San Francisco Municipal Transportation Agency (SFMTA) have collaborated to
develop a TDM plan that is consistent with the City’s Transit First policies, TDM legislation, and
which all stakeholders have agreed upon. New courses of action, known as measures, will
reduce drive alone trips and the associated parking demand at the ZSFG campus allowing for
greater patient access and reducing traffic congestion in the community. The plan’s goal is to
reduce the drive alone rate to 30 percent in 10 years. A higher reduction may require
supplementary transportation system updates, TDM measures, and policy revisions as outlined
in the TDM plan. SFDPH is committed to working with SFMTA to work towards reducing drive
alone vehicle trips to ZSFG.
1 Source: DPH ZSFG FY1617 Annual Report
https://www.dropbox.com/sh/8d3hpmr5b5re7ty/AACtxpUGiNxwCRNXHhd8U3bNa?dl=0

2
TDM Program
A workplace TDM program is a set of policies and programs, incentives, tools, and information
to support employees in making sustainable transportation choices for their commute trips.
The TDM program includes SFDPH- and UCSF-led strategies that emphasize sustainable travel
options. Table 1 and Table 2 shows existing and new TDM measures as derived from the ZSFG
Transportation Demand Management Plan and its summary tables, Attachment A; current
utilization is given when metrics are available. Table 3 shows TDM measures above and beyond
the TDM plan. The San Francisco Department of the Environment (SFE) provides some of the
benefits and programs available to SFDPH employees. All metrics are from October 2016 -
October 2017, unless otherwise noted. The employee travel survey was conducted in October
2017.
Figure 1. ZSFG True North

3
Table 1: Existing TDM Measures
Measure Current Utilization
Bicycle Parking
34 lockers, 2 cages, racks throughout campus:
Bike cage registration: 305
Bike cage utilization: 45 west cage, 20 east cage
Traditional lockers: 34 full
Showers
Staff working in these departments have showers available:
Sheriff - Bldg. 2, basement
Environmental Services - GK4 women & GK10 men
Engineering - Bldg. 2, 1st floor
Crafts - Bldg. 10, 1st floor & basement
Food & Nutrition - Bldg. 5, 2nd floor
Residents - Bldg. 5, basement, GE6 women & GF12 men
Car Share
24 total vehicles for personal use only, located in the 23rd
Street Parking Garage.
Getaround: 15 vehicles https://www.getaround.com/
Zipcar: 6 vehicles http://www.zipcar.com/
Scoot: 4 vehicles https://scoot.co/
Pre-Tax Commuter Benefits
October 2017 snapshot of registered users.
DPH-wide: 921 users https://www.wageworks.com/ccsf/
UCSF at ZSFG: 540 users
https://www.commutercheckdirect.com/
Emergency Ride Home
Program
Usage between October 1, 2016 - September 30, 2017
DPH-wide: 4 rides
https://sfenvironment.org/emergency-ride-home
UCSF at ZSFG: unavailable
http://campuslifeservices.ucsf.edu/transportation/services/a
lternative_transportation/emergency_ride_home
Rideshare Match
Registrants of the 511 Ride Match System that work at ZSFG:
October 2016: 39 registrants
October 2017: 32 registrants
http://511.org/carpool-vanpool/findmatch
As of October 2017, the 511 Ride Match System is being
maintained and promoted by 511 for areas that are not well
served by 511’s partner apps, primarily in the North Bay, and
for people who either don’t have smartphones or are not
interested in using the apps. 511 is prioritizing use of the
apps and therefore no upgrades are planned for the system.
Shuttles See Tables 4 & 5
TDM Program Marketing See Tables 6, 7 & 8
Next Bus Monitors 5 monitors in the lobbies of Building 5 and Building 25
Telecommuting Policy
Eligibility to telecommute for all ZSFG employees determined
by job position/requirements and department.

4
Measure Current Utilization
Telecommuting Policy
(continued)
DPH: http://sfdhr.org/telecommute
UCSF: http://ucsfhr.ucsf.edu/files/telecomm_agreement.pdf
Vanpool Program
The UCSF employee vanpool program requires a minimum of
seven participants per vanpool. The driver participates for
free and the riders pay $220-$500 per month per person;
monthly fares are based on the total round-trip miles driven
per day. As of October 2017, zero UCSF vanpools serve ZSFG.
http://www.campuslifeservices.ucsf.edu/transportation/serv
ices/alternative_transportation/vanpools
Zimride
UCSF-specific Zimride (ride sharing) website: unavailable
http://www.campuslifeservices.ucsf.edu/transportation/serv
ices/alternative_transportation/zimride
TDM Program Manager
Providing commute information to employees and
coordinating on-campus TDM services
Contact: [email protected]
Transportation Survey Employee travel survey is conducted annually and mode split
results are shared with SFMTA
Table 2: New TDM Measures
Description Timeframe (Near-term: 0-3 years,
Medium-term: 3-7 years)
Status & Current Utilization
(where applicable)
Increase hourly garage parking
rates Near
1st increase on 7/1/2017,
2nd increase is scheduled for 7/1/2018
Adjust hourly/monthly parking
rates Near
1st increase on 7/1/2017,
2nd increase is scheduled for 7/1/2018
Expand ZSFG Shuttle Service Near
DPH has received a grant from the
Transportation for Clean Air Fund
managed by the San Francisco County
Transportation Authority to increase the
existing shuttle service to include a 5:40
a.m. shuttle pick-up.
Provide additional last-mile
service by alternate means Near Analysis/Design phase of pilot
Add Bike racks on ZSFG shuttles Near Pilot began 10/01/2017 with bike racks
on ZSFG shuttles
Expand number of car share
vehicles on-site for personal travel Near
24 vehicles are available in the 23rd
Street Parking Garage for personal use.
Expand number of car share
vehicles on-site for business travel Near Under study
Implement carpool-only parking
benefits Near Under study

5
Description Timeframe (Near-term: 0-3 years,
Medium-term: 3-7 years)
Status & Current Utilization
(where applicable)
Facilitate and promote greater
use of carpool matching Near
Promoting additional carpool matching
programs:
• Casual Carpool
• Scoop
• Waze Carpool
• MyCommute
Install transportation kiosk(s) Near
ZSFG is exploring the incorporation of
TDM information into a future
wayfinding project for the campus.
Design/procurement phase.
Advertise existing pre-tax
commuter accounts Near Ongoing
Employee Portal Medium
The employee portal is UCSF’s new
source for all commuting needs.
Portal launched spring 2017, kick-off
scheduled for 11/01/2017. Portal for
SFDPH is under study.
Create vanpool service with
benefits for potential users Medium Under study
Provide additional showers and
locker facilities Medium
Under construction summer 2018
Bldg. 5, Rm GL4 & GL8, 2 showers
Install Bay Area Bike Share Station
on campus Medium
Approval of design for north side of 23rd
Street location by SFMTA anticipated
June 2018.
Table 3: Beyond the TDM Plan
Description Status & Current Utilization (where applicable)
4 Bike Link on-demand parking spaces
Parking installed 05/30/17
Unique cards/users: 10
Unique cards/users per space: 2.5
Pilot phase
Bike fix station Design/procurement phase
East bike cage upgrade Design/procurement phase
Bulletin board inside west bike cage Design/procurement phase
Shuttle Service Enhancements
24th St. shuttle contract awarded summer 2017
New contract requirements:
• Performance metrics
o Schedule miss report
o Customer feedback
• Expanded shuttle size
• Bike rack

6
Description Status & Current Utilization (where applicable)
Shuttle Service Enhancements
(continued)
• Mobile app
• Shuttle and driver identification
Next Bus monitor enhancements Updating as needed with current information
Annual employee travel survey
Improving survey distribution by increasing the
number of contacts engaged in setting up outreach
meetings.
San Francisco Sheriff’s Department
Employee Escorts
Monday-Friday, 3pm-11pm, employees call 415-
206-8063 to request an escort to the nearest BART
station, bus stop, parking lot or to their personal
vehicle. Pick-ups are made at the main entrance
turnaround, other locations can be specified.
Requests outside of these hours will be filled as
Sheriff staff are available.
SFDPH and UCSF each have free shuttle service. The services are available to all patients,
visitors, and employees. The shuttles serving ZSFG are listed in Table 4, average daily ridership
is displayed in Table 5.
Table 4: Shuttle Routes & Frequency
Line Provider Route Hours of
Operation
Frequency
(min)
Weekday
Stops
Blue UCSF Parnassus > ZSFG > Mission
Bay > Mission Bay Hospital >
Mount Zion
4:55 AM to 9:30 PM 18 49
Gold UCSF Parnassus > Mount Zion >
Mission Bay > ZSFG 5:25 AM to 9:30 PM 18 46
Yellow UCSF
16th BART > MCB > 20th &
Harrison > ZSFG > 20th &
Harrison
6:07 AM to 8:30 PM 15 46
24th St
BART SFDPH ZSFG > 24th BART
5:40-8:50 AM,
4:15-6:15 PM 20 17
Table 5: Average Daily Shuttle Ridership
2016 2017
Route Oct Nov Dec Jan Feb Mar Apr May Jun Jul Aug Sep Oct
Blue 2384 2312 1895 2394 2134 2687 2663 2949 2797 2795 3102 2734 -
Gold 3813 3421 2592 3707 3366 3822 3756 4012 3823 3971 4365 3884 -
Yellow 1622 1507 1203 1466 1414 1885 1610 1734 1665 1472 1448 1209 -
24th St
BART 161 184 163 149 182 193 183 174 181 156 196 174 225
Note: UCSF October data is unavailable at the time of this report.

7
TDM Program Marketing
The TDM Program Manager is responsible for outreach to all employees on the ZSFG campus to
raise awareness about TDM program elements through information tables, newsletters,
transportation fairs, and web pages. Guests who have participated in events include: San
Francisco Department of the Environment (SFE), UCSF Parking and Transportation Services,
UCSF Sustainability, Sheriff’s Department, SFMTA, Ford GoBike, BikeLink, SF Paratransit, Scoot,
and 511. New transportation promotions are being marketed as they become available such as
the SFE Zipcar membership discount available to SFDPH, the UCSF Zipcar membership discount
available to UCSF, the SFE free Clipper card available to SFDPH, and the electric vehicle
purchase discounts available to UCSF.
The TDM Program Manager is responsible for developing and implementing marketing
initiatives. Table 6 lists these initiatives, frequency, and the number of people exposed to these
activities. The TDM Program Manager also provides specific expertise to hospital led initiatives
that serve employees, patients, and the community, via outreach meetings, these are listed in
Table 7.
Table 6: Marketing & Outreach Initiatives (October 2016-October 2017)
Initiative Instances of Activity Total Audience
UCSF Transportation Newsletter 8 newsletters Approximately 1,900
Bulletin board, Building 5 17 posters Approximately 6,000
Bulletin board, Main Entrance 1 posters Approximately 6,000
Department mail box 2 flyers Approximately 6,000
New Employee Orientation (NEO) 1 presentation and
NEO manual update Approximately 1,000 annually
Fast Facts 10 communications SFDPH-wide
The Bridge 1 communication SFDPH-wide
The Heart 1 communication Approximately 6,000
Bike to Work Day 1 event 150 participants, approximately
20% were bicyclists
Transportation Week/Fair 1 event +800 participants
Table 7: Outreach Meetings
Meeting Participants Frequency
ZSFG Transportation Committee SFDPH, UCSF, SFMTA Bi-weekly
ZSFG Community Meeting SFDPH, UCSF, SFMTA, DPW, public Quarterly
ZSFG Patient Experience Office SFDPH, UCSF, patient advocates Quarterly
ZSFG Care & Hospital Employee’s
Activities, Resources & Service (CHEARS) SFDPH, UCSF Monthly
Mobility Management Steering Committee SFMTA, Transdev, SFDPH,
mobility advocates
Quarterly
SF County Transportation Authority
(SFCTA) Technical Working Group
SFCTA, SF Planning,
public agencies Monthly

8
The main on-line source for transportation information is the Zuckerberg San Francisco General
website, https://zuckerbergsanfranciscogeneral.org; Table 8 displays the website traffic and key
dates that may have caused changes in the traffic. Additional pages include: SFDPH intranet
http://SFDPHnet.in.sfSFDPH.net/, ZSFG intranet http://insidechnsf/, and the UCSF Campus Life
Services website “Affiliate Transit Options”
http://campuslifeservices.ucsf.edu/transportation/services/alternative_transportation/affiliate
_transit_options; website traffic metrics are not available for these pages.
Table 8: Zuckerberg San Francisco General Website Pageviews
2016 2017
Page Oct Nov Dec Jan Feb Mar Apr May Jun Jul Aug Sep Oct
“Getting Here” 777 626 624 796 888 943 695 720 771 753 724 765 781
“Employee
Transportation” 1726 714 382 225 140 202 203 264 328 258 290 380 924
No
tab
le
Da
tes
Tra
vel S
urv
ey
Be
gin
s
- - - - -
UC
SF
Tra
nsp
ort
ati
on
Ne
wsl
ett
er
Be
gin
s
Bik
e t
o W
ork
Da
y
- - -
Tra
nsp
ort
ati
on
We
ek
Tra
vel S
urv
ey
Be
gin
s
Muni Bus & Paratransit Ridership
The TDM Program Manager promotes sustainable transportation options to all patients,
visitors, and employees who travel to ZSFG. This marketing strategy is intended to support care
experience through hospital access and staff development. Table 9 displays Muni bus and
paratransit ridership:
Table 9: Muni Bus & Paratransit Ridership
Agency Service Usage
SFMTA Muni
There are 15 Muni bus stops in the vicinity of ZSFG*.
Average weekday Muni bus boarding at ZSFG:
Fall 2016: 4,469 boarding
Fall 2017: 4,157 boarding
SFMTA SF Paratransit
The number of paratransit rides, pick-ups and drop-offs
in the vicinity of ZSFG*, in 2016:
Paratransit Taxi: 10,835 rides
SF Access Van: 7,050 rides
* “The vicinity of ZSFG,” refers to the surrounding streets including the main and ambulance
entrances, Potrero Avenue, Vermont Street, Utah Street, San Bruno Avenue, and 21st Street –
24th Street.
9
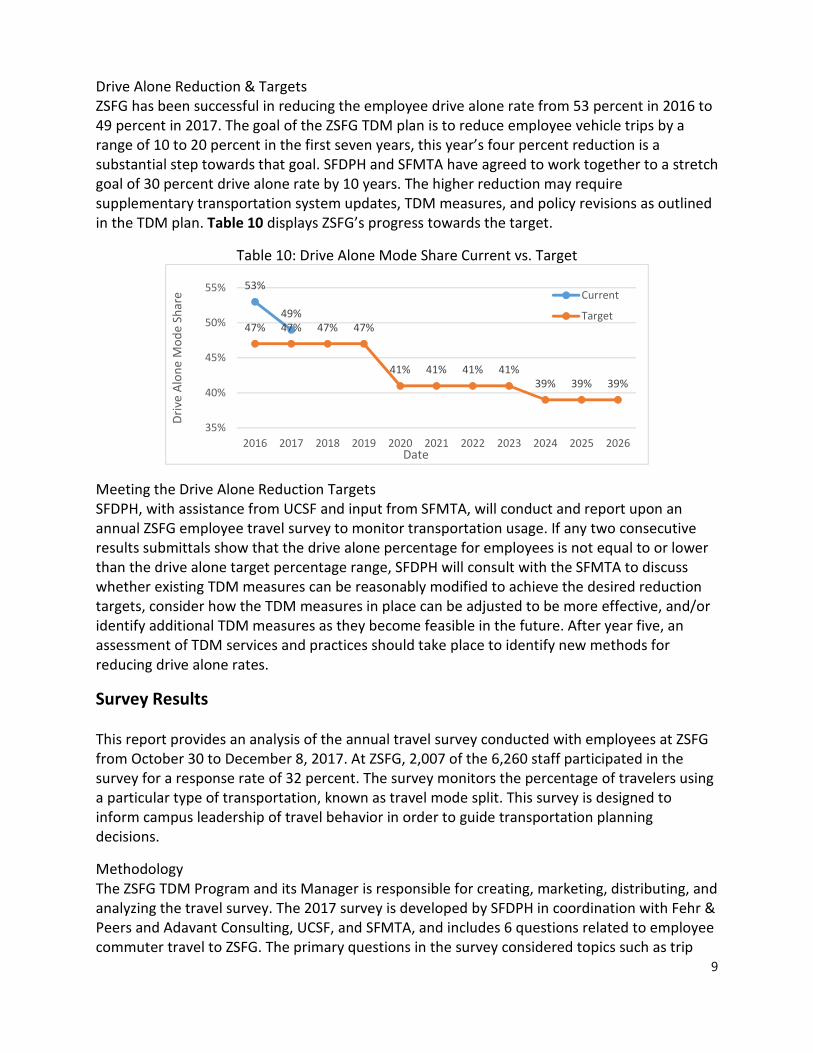
Drive Alone Reduction & Targets
ZSFG has been successful in reducing the employee drive alone rate from 53 percent in 2016 to
49 percent in 2017. The goal of the ZSFG TDM plan is to reduce employee vehicle trips by a
range of 10 to 20 percent in the first seven years, this year’s four percent reduction is a
substantial step towards that goal. SFDPH and SFMTA have agreed to work together to a stretch
goal of 30 percent drive alone rate by 10 years. The higher reduction may require
supplementary transportation system updates, TDM measures, and policy revisions as outlined
in the TDM plan. Table 10 displays ZSFG’s progress towards the target.
Table 10: Drive Alone Mode Share Current vs. Target
Meeting the Drive Alone Reduction Targets
SFDPH, with assistance from UCSF and input from SFMTA, will conduct and report upon an
annual ZSFG employee travel survey to monitor transportation usage. If any two consecutive
results submittals show that the drive alone percentage for employees is not equal to or lower
than the drive alone target percentage range, SFDPH will consult with the SFMTA to discuss
whether existing TDM measures can be reasonably modified to achieve the desired reduction
targets, consider how the TDM measures in place can be adjusted to be more effective, and/or
identify additional TDM measures as they become feasible in the future. After year five, an
assessment of TDM services and practices should take place to identify new methods for
reducing drive alone rates.
Survey Results
This report provides an analysis of the annual travel survey conducted with employees at ZSFG
from October 30 to December 8, 2017. At ZSFG, 2,007 of the 6,260 staff participated in the
survey for a response rate of 32 percent. The survey monitors the percentage of travelers using
a particular type of transportation, known as travel mode split. This survey is designed to
inform campus leadership of travel behavior in order to guide transportation planning
decisions.
Methodology The ZSFG TDM Program and its Manager is responsible for creating, marketing, distributing, and
analyzing the travel survey. The 2017 survey is developed by SFDPH in coordination with Fehr &
Peers and Adavant Consulting, UCSF, and SFMTA, and includes 6 questions related to employee
commuter travel to ZSFG. The primary questions in the survey considered topics such as trip
53%
49%
47% 47% 47% 47%
41% 41% 41% 41%
39% 39% 39%
35%
40%
45%
50%
55%
2016 2017 2018 2019 2020 2021 2022 2023 2024 2025 2026
Dri
ve A
lon
e M
od
e S
ha
re
Date
Current
Target

10
origin and how employees travel to work. More focused questions ask employees who drive
alone to the ZSFG campus, what would motivate them to drive less to understand if employees
might shift how they chose to travel based on changes in circumstances. The ZSFG Employee
Travel Survey 2017 is included in this document as Appendix A.
The survey is distributed to all ZSFG employees via an email connecting to Survey Monkey.
Additional paper copies are made available to employees to encourage as many employees as
possible to complete the survey and to include those employees who have limited access to a
computer during their work day. Over 2,000 survey responses (1,537 via email and 470 on
paper) were collected, representing approximately a third of the total employee population.
Survey Questions, Comparative Results, and Charts
Survey results are presented in this report along with a qualitative comparison to 2016 travel
survey results to identify key trends in employee behavior over the past two years. In the
following sections, boldface questions are taken verbatim from the survey. All charts display the
data as a count of responses and as a percentage of the total. The Fehr & Peers and Adavant
Consulting data analysis is included in this document as Appendix B.
Section 1: Employer
Survey respondents identify their employer as CCSF,
UCSF, Volunteer, or Other as shown in Chart 1.
Volunteer respondents have been included in the
“Other” category and represent 127 (6%) of the
responses.
Section 2: Employee Home Location
Home location has a strong influence on how
employees chose to get to work. Home zip codes
have been converted into county and region based
on U.S. Postal Service data. This information is useful
for identifying groups of employees who could form
carpools and vanpools. Based on the group location,
appropriate transit information can be identified and
made available. The counties that employees travel
from the most are San Francisco, San Mateo, and
Alameda, this is consistent with the 2016 survey results. The home county of all employees is
shown in Chart 2a, the home region is shown in Chart 2b. Chart 2c is a map of employee
density by home zip code.
Travel distance often determines the types of transportation that are most appropriate for
employees. Employees who live within 5 miles of ZSFG are good candidates for walking,
bicycling, and transit. Medium distance commuters, who travel from 6 to 20 miles to work, are
good candidates for transit and carpooling. Vanpooling and carpooling may be good
transportation options for long distance commuters who live more than 20 miles from ZSFG.
Who is your employer? (select only one)
Chart 1: Employer
UCSF
737
37%City and County
of San
Francisco
1073
55%
Other
162
8%

11
What is your home zip code?
Chart 2a: Home Location by County
Chart 2b: Home Location by Region
Note: The San Francisco region is its own county. The East
Bay region consists of Alameda and Contra Costa counties.
The North Bay region consists of Marin, Solano, Sonoma,
and Napa counties. The South Bay region consists of San
Mateo and Santa Clara counties. All other counties are
considered Outside the Bay Area.
166, 15%
112, 10%
32, 3%
5, 0%
463, 43%
237, 22%
10, 1%
30, 3%
9, 1%
11, 1%
147, 20%
48, 7%
20, 3%
1, 0%
362, 50%
120, 17%
9, 1%
7, 1%
4, 1%
3, 0%
355, 18%
172, 9%
55, 3%
7, 0%
909, 46%
378, 19%
22, 1%
39, 2%
14, 1%
7, 0%
0% 10% 20% 30% 40% 50% 60%
Alameda
Contra Costa
Marin
Napa
San Francisco
San Mateo
Santa Clara
Solano
Sonoma
Outside Bay Area
CCSF
UCSF
All Employees
463, 43%
308, 29%
46, 4%
245, 23%
11, 1%
370, 50%
209, 28%
26, 4%
129, 18%
3, 0%
914, 46%
568, 29%
77, 4%
397, 20%
16, 1%
0% 10% 20% 30% 40% 50% 60%
San Francisco
East Bay
North Bay
South Bay
Outside Bay Area
CCSF
UCSF
All Employees

12
Chart 2c: ZSFG Employee Home by Zip Code 2017
Note: Red represents a single individual within a zip code area.

13
Section 3: Arrival and Departure Time
The aggregated proportions of employee’s arrival and departure times to and from the ZSFG
campus throughout a typical day is shown in Chart 3a and Chart 3b.
What time did you normally arrive and leave ZSFG?
Chart 3a: Arrival Times
Chart 3b: Departure Time
19, 2%
310, 29%
506, 47%
45, 4%
15, 1%
36, 3%14, 1%
68, 6%
55, 5%
7, 1%
132, 18%
423, 57%
103, 14%
10, 1%
8, 1%
9, 1% 11, 1%34, 5%28, 1%
460, 23%
999, 51%
177, 9%
37, 2%
53, 3%28, 1% 87, 4%
98, 5%
-10%
0%
10%
20%
30%
40%
50%
60%
70%
Before
6am
6am to
8am
8am to
10am
10am to
12pm
12pm to
2pm
2pm to
4pm
4pm to
6pm
6pm to
8pm
After 8pm
CCSF
UCSF
All Employees
108, 10% 95, 9%
110, 10%
3, 0%
9, 1%
21, 2%
267, 25%253, 24%
193, 18%
60, 8%
96, 13%
27, 4%5, 1%
1, 0%
19, 3%
166, 23%
301, 41%
60, 8%182, 9%
197, 10%
149, 8%
10, 1%
34, 2% 58, 3%
475, 24%
573, 29%
277, 14%
-5%
0%
5%
10%
15%
20%
25%
30%
35%
40%
45%
Before
6am
6am to
8am
8am to
10am
10am to
12pm
12pm to
2pm
2pm to
4pm
4pm to
6pm
6pm to
8pm
After 8pm
CCSF
UCSF
All Employees

14
Not all ZSFG employees work a typical weekday schedule. There are administrative and
research employees (office staff), most of whom work a typical weekday work schedule,
generally arriving between 7 AM and 9 AM, and leaving between 4 PM and 6 PM. ZSFG also has
hospital employees, who typically work on three shifts and some work on weekends. The day
shift is typically from 7 AM to 3:30 PM, the evening shift is typically from 3 PM to 11:30 PM, and
the overnight shift is typically from 11 PM to 7:30 AM.
Most employees arrive to the hospital before 10 AM (office staff and day-shift), though there
are some night arrivals around 6 PM (evening shift). Most employees depart the hospital
between 3 PM and 7 PM (office staff and day shift), which falls within the typical evening
commute for the City. There are also departures in the early morning before 8 AM (overnight
shift) and in the evening after 6 PM (office staff and day shift). In general, SFDPH employees
tend to arrive and depart earlier than UCSF employees due to the nature of their work shifts,
resulting in departures that are spread out over a longer period of time than for UCSF
employees. These patterns are consistent with the 2016 survey results.
Section 4: How Employees Get to Work
Chart 4a shows the type of transportation that ZSFG employees use to travel to and from the
campus. Employees were invited to select more than one answer for their means of travel. For
example, a respondent answered that they use BART and the ZSFG Shuttle from the 24th Street
BART station. Chart 4a summarizes that the individual’s arrival mode for the final leg to campus
is the ZSFG Shuttle. This summary is consistent with data analysis from the previous 2016
survey performed by the consultant Fehr & Peers and Adavant Consulting.
In general, a majority (49 percent) of employees drive alone to the ZSFG campus, followed by
those that arrive by public transit (14 percent), or a shuttle (12 percent). A higher proportion of
SFDPH employees drive alone to work (55 percent) compared to UCSF (43 percent), most likely
due to the possibility of purchasing discounted monthly parking permits available to some
SFDPH employees.2 UCSF employees have a higher proportion of riding the UCSF shuttle and
bicycling.
Current survey results compared to the 2016 survey show a significant four percentage point
decrease in the proportion of employees choosing to drive alone. There are increases of three
percentage points for bicycling and walking. There is a decrease of three percentage points for
riding BART.
2 Source: Collective Bargaining Agreement Between and for Service Employees International Union Local 1021 and the
City and County of San Francisco, July 1, 2014-June 30, 2017, http://www.seiu1021.org/wp-
content/blogs.dir/74/files/2016/03/SanFrancisco_CityandCountyof_CBA_070114-063017.pdf

15
How did you get to ZSFG the last day that you travelled there? (select all that apply)
Chart 4a: Summary of Travel Mode Arriving to ZSFG
Note: Responses to the options, “Carpool driver,” “Carpool passenger,” and “Casual Carpool”
have been broadly grouped into “Carpool.” Responses to the options, “Vanpool (non-UCSF)”
and “UCSF Vanpool” have been broadly grouped into “Vanpool.” “SamTrans” had only 3
responses so it was removed for the purposes of this data summary.
595, 55%
56, 5%
4, 0%
61, 6%
40, 4%
109, 10%
27, 2%
76, 7%
6, 1%
68, 6%
46, 4%
320, 43%
33, 4%
2, 0%
29, 4%
32, 4%
49, 7%
77, 10%
37, 5%
6, 1%
90, 12%
61, 8%
971, 49%
97, 5%
7, 0%
96, 5%
85, 4%
193, 10%
110, 6%
120, 6%
15, 1%
166, 8%
127, 6%
0% 10% 20% 30% 40% 50% 60%
Drive alone
Carpool
Vanpool
Dropped off
(Taxi, Uber, Lyft, etc.)
BART
Muni
UCSF Shuttle
ZSFG Shuttle
Motorcycle/
Scooter
Bike
Walk
CCSF
UCSF
All Employees
16
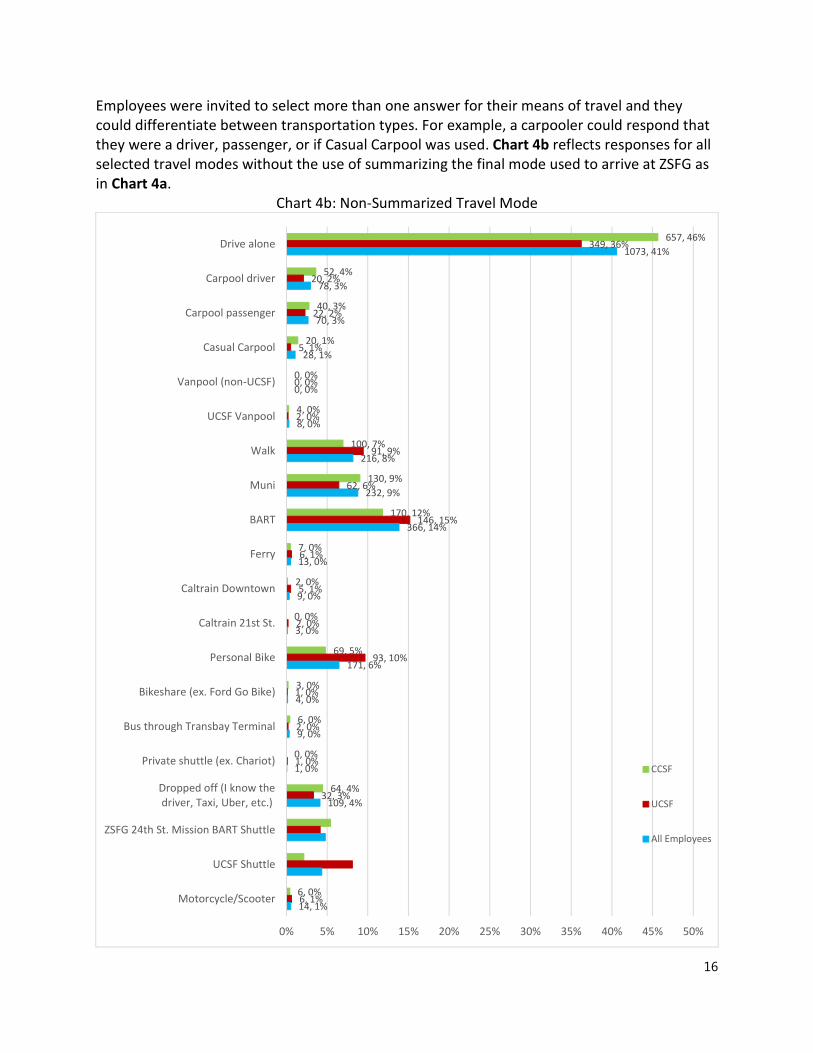
Employees were invited to select more than one answer for their means of travel and they
could differentiate between transportation types. For example, a carpooler could respond that
they were a driver, passenger, or if Casual Carpool was used. Chart 4b reflects responses for all
selected travel modes without the use of summarizing the final mode used to arrive at ZSFG as
in Chart 4a.
Chart 4b: Non-Summarized Travel Mode
657, 46%
52, 4%
40, 3%
20, 1%
0, 0%
4, 0%
100, 7%
130, 9%
170, 12%
7, 0%
2, 0%
0, 0%
69, 5%
3, 0%
6, 0%
0, 0%
64, 4%
6, 0%
349, 36%
20, 2%
22, 2%
5, 1%
0, 0%
2, 0%
91, 9%
62, 6%
146, 15%
6, 1%
5, 1%
2, 0%
93, 10%
1, 0%
2, 0%
1, 0%
32, 3%
6, 1%
1073, 41%
78, 3%
70, 3%
28, 1%
0, 0%
8, 0%
216, 8%
232, 9%
366, 14%
13, 0%
9, 0%
3, 0%
171, 6%
4, 0%
9, 0%
1, 0%
109, 4%
14, 1%
0% 5% 10% 15% 20% 25% 30% 35% 40% 45% 50%
Drive alone
Carpool driver
Carpool passenger
Casual Carpool
Vanpool (non-UCSF)
UCSF Vanpool
Walk
Muni
BART
Ferry
Caltrain Downtown
Caltrain 21st St.
Personal Bike
Bikeshare (ex. Ford Go Bike)
Bus through Transbay Terminal
Private shuttle (ex. Chariot)
Dropped off (I know the
driver, Taxi, Uber, etc.)
ZSFG 24th St. Mission BART Shuttle
UCSF Shuttle
Motorcycle/Scooter
CCSF
UCSF
All Employees

17
Current non-summarized travel mode results compared to 2016 have a similar proportion of
employees choosing to carpool, vanpool, and use Caltrain. The nuances in travel options and
proportions between employers may be small in scale but are useful when tailoring a TDM
marketing message, targeting a specific commuting audience, and in the analysis of parking
space demand.
Chart 4c reflects the three most popular transportation types for all employees by region of
origin.
Chart 4c: Top 3 Transportation Types for All Employees by Region
218, 47%
80, 17%
48, 10%
136, 45%
52, 17%
30, 10%
33, 72%
6, 13%
0, 0%
190, 78%
16, 7%
6, 2%
148, 40%
39, 11%
52, 14%
51, 25%
26, 13%
51, 25%
16, 62%
2, 8%
5, 19%
102, 80%
6, 5%
3, 2%
396, 44%
148, 16%
104, 11%
199, 35%
81, 14%
70, 12%
51, 66%
8, 10%
5, 6%
304, 77%
25, 6%
10, 3%
0% 10% 20% 30% 40% 50% 60% 70% 80% 90%
Drive alone
SF Muni
Personal bike
Drive alone
ZSFG Shuttle
BART
Drive alone
Carpool Driver
Personal bike
Drive alone
Dropped off
Walk
San
Fra
nci
sco
Ea
st B
ay
No
rth
Ba
ySo
uth
Ba
y
CCSF
UCSF
All Employees

18
Section 5: TDM Program Opportunities
Employees who frequently drive alone to ZSFG were asked what would encourage them to
drive less, the results are summarized in Chart 5. This question reframed a question from the
2016 survey to focus only on individuals who drive alone and to reinforce the message that
employees should consider sustainable commuting options.
If you frequently drive alone to work, what would encourage you to drive less? (select all that
apply)
Chart 5: Incentives to Try Sustainable Transportation
218, 12%
255, 14%
177, 10%
129, 7%
118, 7%
192, 11%
180, 10%
56, 3%
108, 6%
215, 12%
150, 8%
93, 9%
145, 14%
83, 8%
78, 7%
59, 6%
68, 6%
119, 11%
58, 5%
100, 9%
153, 14%
104, 10%
334, 11%
439, 14%
276, 9%
217, 7%
188, 6%
272, 9%
310, 10%
126, 4%
225, 7%
411, 13%
267, 9%
0% 2% 4% 6% 8% 10% 12% 14% 16%
Shuttle service with
extended hours, 4am-9pm
Private shuttle service to/from
SF neighborhoods
Help finding people to
Carpool/Vanpool with
App for Carpool/Vanpool
matching and cost sharing
Reserved parking spaces
for Carpool/Vanpool
Discounted parking fees
for Carpool/Vanpool
Use pre-tax money to
pay forUber Pool
Bike parking inside
a locked room
If you don't normally drive,
2 discounted daily
parking passes per month
A discount to use Taxi,
Uber, Lyft from Caltrain,
Transbay Terminal, or Ferry
Other
CCSF
UCSF
All Employees

19
Chart 5 Note: The “Other” category responses included discounts for public transit and TNCs
(Transportation Network Companies), better/safer public transit, additional bike facilities, and
new shuttle service to/from their homes (similar to tech shuttles around the Bay Area).
The three most common sustainable transportation programs that would encourage employees
to change their commute are private shuttle service to/from SF neighborhoods (14 percent), a
discount to use Taxi/TNCs from major transit centers (13 percent), and shuttle service with
extended hours of 4am-9pm (11 percent).
Section 6: TDM Program Awareness and Use
Chart 6 a and b show the level of awareness and extent of use of the transportation benefits
and programs. This question is new to the 2017 survey and is intended to measure employee
knowledge of Transportation Demand Management Program elements and utilization. Later
sections of this report provide an evaluation of the TDM program and metrics are provided
when available. This survey question assists in evaluating program elements where metrics are
unavailable. This questions also makes staff aware of benefits and programs that already exist
to encourage sustainable commuting.
Section 7: Additional Comments
Over a fifth (424) of all survey respondents took the time to write additional comments about
their trip to work. Employees responded candidly and it is encouraged that readers of this
report review Attachment A which lists all responses. The remarks relate to safety, travel time,
convenience, and cost. Below are excerpts which represent reoccurring themes throughout the
comments.
• “Bus #9 in the night is not safe.”
• “Wish I could use public transit that did not significantly increase commute time, plus
uncertainty of public transit options.”
• “Many take their bikes into their offices if possible but vandalism and theft is a
deterrent if not in protected location.”
• “… I have to leave over an hour before I start because I have to allow for enough time
to find all day street parking in the neighborhood. The garage is WAY too expensive, and
the faculty/staff placards are on a 2+ year wait list, and are still too expensive.”
• “Employees should not be charged for parking, it seems pretty ridiculous compared to
all other hospitals.”

20
Do you know about these transportation benefits and
programs? (select all that apply)
Chart 6a: Awareness of Transportation Benefits and Programs
Do you use these transportation benefits and programs?
(select all that apply)
Chart 6b: Use of Transportation Benefits and Programs
677, 20%
309, 9%
427, 12%
488, 14%
341, 10%
212, 6%
237, 7%
420, 12%
186, 5%
135, 4%
510, 20%
205, 8%
362, 14%
368, 14%
235, 9%
136, 5%
204, 8%
377, 15%
117, 5%
79, 3%
1278, 20%
551, 9%
862, 13%
892, 14%
625, 10%
369, 6%
466, 7%
847, 13%
318, 5%
234, 4%
0% 5% 10% 15% 20% 25%
Bicycle parking
(cages, BikeLink, etc.)
Shower facilities
at work
Carshare
(Zipcar, Scoot, etc.)
Pre-tax commuter
benefits
Emergency Ride Home
Rideshare Matching
(ex. 511)
Employee
Transportation
web page
Next Bus monitors
Telecommuting
policy
UCSF Zimride
CCSF
UCSF
All Employees
86, 3%
15, 0%
21, 1%
147, 4%
13, 0%
11, 0%
34, 1%
112, 3%
15, 0%
13, 0%
72, 3%
21, 1%
15, 1%
162, 6%
12, 0%
8, 0%
48, 2%
168, 6%
24, 1%
11, 0%
163, 3%
38, 1%
39, 1%
311, 5%
27, 0%
20, 0%
85, 1%
303, 5%
41, 1%
25, 0%
0% 1% 2% 3% 4% 5% 6% 7%
Bicycle parking
(cages, BikeLink, etc.)
Shower facilities
at work
Carshare
(Zipcar, Scoot, etc.)
Pre-tax commuter
benefits
Emergency Ride Home
Rideshare Matching
(ex. 511)
Employee
Transportation
web page
Next Bus monitors
Telecommuting
policy
UCSF Zimride
CCSF
UCSF
All Employees
21
Upcoming Campus Activities
The next transportation survey will occur fall 2018. In that time, many activities affecting
campus transportation will be in progress. The TDM Program Manager will be working with
SFMTA, SFDPH and UCSF leadership, as well as Campus Facilities to execute the TDM Program.
Operational transportation changes occurring at ZSFG include:
• Installation of an additional bike parking cage
• Carpool parking program Pilot
• Installation of Ford GoBike on 23rd Street
• Shuttle service to the 24th Street BART station will be using a higher capacity shuttle
• Refresh of the Zuckerberg San Francisco General Hospital web site
• Off-site parking will become available
Conclusion
The ZSFG Transportation Program is integral to the True North goals of safety, patient access,
and staff satisfaction, all while maintaining financial stewardship. The TDM Program assessment
presents baseline data for the relative success of the program and will be compared annually to
see trends over time. The employee travel survey allows for monitoring of mode share and is
vital to informing ZSFG, SFDPH, UCSF and SFMTA as to progress towards meeting the reduction
targets. Survey data shows a 3 percent reduction in the drive alone mode share compared to
2016 results. ZSFG continues to support implementation of the TDM Program in order to
reduce the frequency of driving-alone to the campus and relive parking and traffic congestion in
the community.

22
Appendices
Appendix A: ZSFG Employee Travel Survey 2017
23
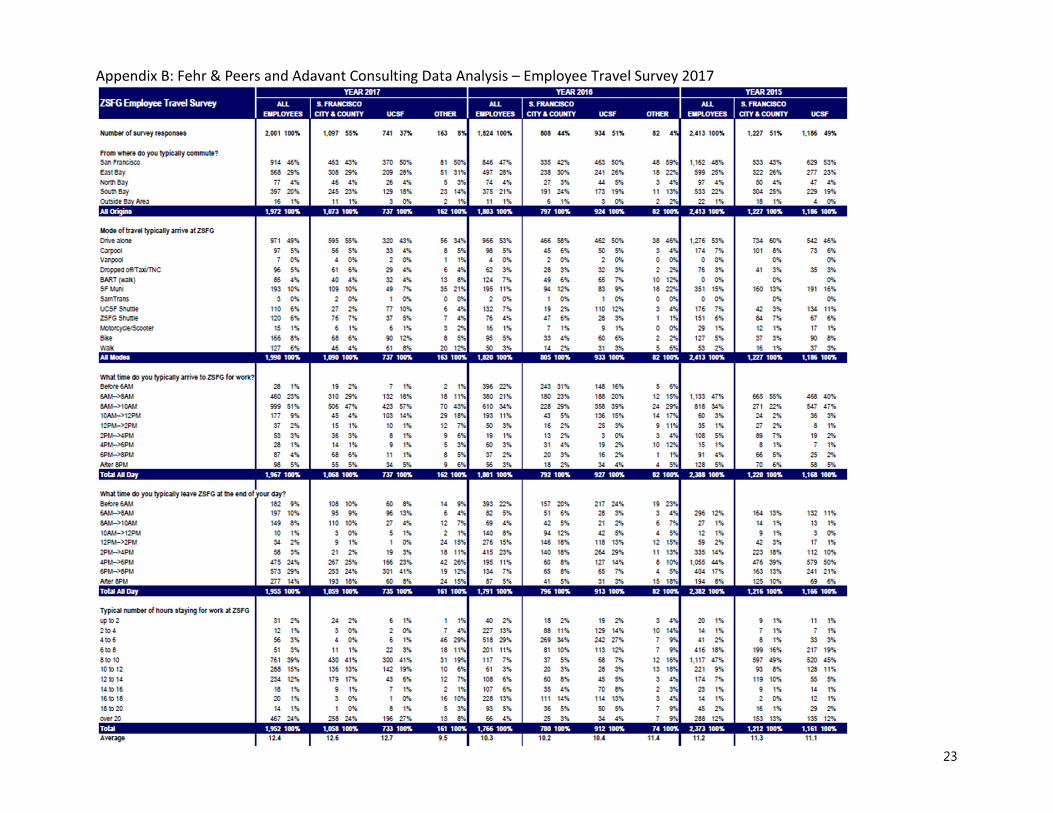
Appendix B: Fehr & Peers and Adavant Consulting Data Analysis – Employee Travel Survey 2017
![arXiv:2003.12218v5 [cs.CL] 15 Apr 202016th, 2020, researchers and leaders from the Allen Institute for AI, Chan Zuckerberg Initiative (CZI), Georgetown University’s Center for Security](https://img.dokumen.tips/doc/110x75/5f609040d3dd5b7700705eff/arxiv200312218v5-cscl-15-apr-2020-16th-2020-researchers-and-leaders-from.jpg)