Embed Size (px)
Citation preview


PRIORITY DEVELOPMENT PROJECT (PDP) SWQMP ii
Template Date: March 16, 2016 Preparation Date: June 19,2017 LUEG:SW PDP SWQMP
This page was left intentionally blank.

PRIORITY DEVELOPMENT PROJECT (PDP) SWQMP iii
Template Date: March 16, 2016 Preparation Date: June 19,2017 LUEG:SW PDP SWQMP
Table of Contents Table of Contents ....................................................................................................................... iii
Attachments ............................................................................................................................... iv
Acronyms ................................................................................................................................... iv
PDP SWQMP Preparer's Certification Page ............................................................................... vi
Submittal Record ..................................................................................................................... viii
Project Vicinity Map ................................................................................................................... ix
Step 1: Project type determination (Standard or Priority Development Project) .................... 1
Step 1.1: Storm Water Quality Management Plan requirements ....................................... 4
Step 1.2: Exemption to PDP definitions ............................................................................ 4
Step 2: Construction Storm Water BMP Checklist ................................................................ 5
Step 3: County of San Diego PDP SWQMP Site Information Checklist ................................ 8
Step 3.1: Description of Existing Site Condition ................................................................ 8
Step 3.2: Description of Existing Site Drainage Patterns .................................................. 9
Step 3.3: Description of Proposed Site Development ......................................................11
Step 3.4: Description of Proposed Site Drainage Patterns ...............................................12
Step 3.5: Potential Pollutant Source Areas ......................................................................13
Step 3.6: Identification and Narrative of Receiving Water and Pollutants of Concern ......14
Step 3.7: Hydromodification Management Requirements ................................................15
Step 3.7.1: Critical Coarse Sediment Yield Areas* ..........................................................16
Step 3.7.2: Flow Control for Post-Project Runoff* ...........................................................17
Step 3.8: Other Site Requirements and Constraints ........................................................18
Step 4: Source Control BMP Checklist ................................................................................19
Step 5: Site Design BMP Checklist ......................................................................................21
Step 6: PDP Structural BMPs ..............................................................................................23
Step 6.1: Description of structural BMP strategy ..............................................................23
Step 6.2: Structural BMP Checklist ..................................................................................25
Step 6.3: Offsite Alternative Compliance Participation Form ............................................26
ATTACHMENT 1 ......................................................................................................................27
BACKUP FOR PDP POLLUTANT CONTROL BMPS ............................................................27
ATTACHMENT 2 ......................................................................................................................29
BACKUP FOR PDP HYDROMODIFICATION CONTROL MEASURES ................................29
ATTACHMENT 3 ......................................................................................................................31

PRIORITY DEVELOPMENT PROJECT (PDP) SWQMP iv
Template Date: March 16, 2016 Preparation Date: June 19,2017 LUEG:SW PDP SWQMP
Structural BMP Maintenance Information ..............................................................................31
ATTACHMENT 4 ......................................................................................................................33
County of San Diego PDP Structural BMP Verification for Permitted Land Development Projects .................................................................................................................................33
ATTACHMENT 5 ......................................................................................................................39
Copy of Plan Sheets Showing Permanent Storm Water BMPs, Source Control, and Site Design ...................................................................................................................................39
ATTACHMENT 6 ......................................................................................................................41
Copy of Project's Drainage Report ........................................................................................41
ATTACHMENT 7 ......................................................................................................................43
Copy of Project's Geotechnical and Groundwater Investigation Report .................................43
Attachments Attachment 1: Backup for PDP Pollutant Control BMPs
Attachment 1a: Storm Water Pollutant Control Worksheet Calculations Attachment 1b: DMA Exhibit Attachment 1c: Individual Structural BMP DMA Mapbook
Attachment 2: Backup for PDP Hydromodification Control Measures Attachment 2a: Flow Control Facility Design Attachment 2b: Hydromodification Management Exhibit Attachment 2c: Management of Critical Coarse Sediment Yield Areas Attachment 2d: Geomorphic Assessment of Receiving Channels (optional) Attachment 2e: Vector Control Plan (if applicable)
Attachment 3: Structural BMP Maintenance Plan Attachment 3a: Structural BMP Maintenance Thresholds and Actions Attachment 3b: Draft Maintenance Agreements / Notifications(when applicable)
Attachment 4: County of San Diego PDP Structural BMP Verification for DPW Permitted Land Development Projects
Attachment 5: Copy of Plan Sheets Showing Permanent Storm Water BMPs Attachment 6: Copy of Project's Drainage Report Attachment 7: Copy of Project's Geotechnical and Groundwater Investigation Report
Acronyms ACP Alternative Compliance Project APN Assessor's Parcel Number BMP Best Management Practice BMP DM Best Management Practice Design Manual HMP Hydromodification Management Plan HSG Hydrologic Soil Group

PRIORITY DEVELOPMENT PROJECT (PDP) SWQMP v
Template Date: March 16, 2016 Preparation Date: June 19,2017 LUEG:SW PDP SWQMP
MS4 Municipal Separate Storm Sewer System N/A Not Applicable NRCS Natural Resources Conservation Service PDCI Private Development Construction Inspection Section PDP Priority Development Project PDS Planning and Development Services PE Professional Engineer RPO Resource Protection Ordinance SC Source Control SD Site Design SDRWQCB San Diego Regional Water Quality Control Board SIC Standard Industrial Classification SWQMP Storm Water Quality Management Plan WMAA Watershed Management Area Analysis WPO Watershed Protection Ordinance WQIP Water Quality Improvement Plan

PRIORITY DEVELOPMENT PROJECT (PDP) SWQMP vi
Template Date: March 16, 2016 Preparation Date: June 19,2017 LUEG:SW PDP SWQMP
PDP SWQMP Preparer's Certification Page Project Name: SHADY OAK Permit Application Number: PDS2016-MPA-001
PREPARER'S CERTIFICATION I hereby declare that I am the Engineer in Responsible Charge of design of storm water best management practices (BMPs) for this project, and that I have exercised responsible charge over the design of the BMPs as defined in Section 6703 of the Business and Professions Code, and that the design is consistent with the PDP requirements of the County of San Diego BMP Design Manual, which is a design manual for compliance with local County of San Diego Watershed Protection Ordinance (Sections 67.801 et seq.) and regional MS4 Permit (California Regional Water Quality Control Board San Diego Region Order No. R9-2013-0001 as amended by R9-2015-0001 and R9-2015-0100) requirements for storm water management. I have read and understand that the County of San Diego has adopted minimum requirements for managing urban runoff, including storm water, from land development activities, as described in the BMP Design Manual. I certify that this PDP SWQMP has been completed to the best of my ability and accurately reflects the project being proposed and the applicable BMPs proposed to minimize the potentially negative impacts of this project's land development activities on water quality. I understand and acknowledge that the plan check review of this PDP SWQMP by County staff is confined to a review and does not relieve me, as the Engineer in Responsible Charge of design of storm water BMPs for this project, of my responsibilities for project design. Engineer of Work's Signature, PE Number & Expiration Date Stephen J. McPartland Print Name TSAC Engineering Company June 19,2017 Date Engineer's Seal:

PRIORITY DEVELOPMENT PROJECT (PDP) SWQMP vii
Template Date: March 16, 2016 Preparation Date: June 19,2017 LUEG:SW PDP SWQMP
This page was left intentionally blank.

PRIORITY DEVELOPMENT PROJECT (PDP) SWQMP viii
Template Date: March 16, 2016 Preparation Date: June 19,2017 LUEG:SW PDP SWQMP
Submittal Record Use this Table to keep a record of submittals of this PDP SWQMP. Each time the PDP SWQMP is re-submitted, provide the date and status of the project. In column 4 summarize the changes that have been made or indicate if response to plancheck comments is included. When applicable, insert response to plancheck comments behind this page. Preliminary Design / Planning / CEQA Submittal Number
Date Summary of Changes
1 August 23,2016 Initial Submittal
2 January 20,2017 Second Submittal
3 April 24,2017 Third Submittal
4 June 19,2017 Final Submittal
Final Design Submittal Number
Date Summary of Changes
1 Initial Submittal
2
3
4
Plan Changes Submittal Number
Date Summary of Changes
1 Initial Submittal
2
3
4

PRIORITY DEVELOPMENT PROJECT (PDP) SWQMP ix
Template Date: March 16, 2016 Preparation Date: June 19,2017 LUEG:SW PDP SWQMP
Project Vicinity Map Project Name: Shady Oak Record ID: PDS2016-MPA-001

PRIORITY DEVELOPMENT PROJECT (PDP) SWQMP 1 of 44
Template Date: March 16, 2016 Preparation Date: June 19, 2017 LUEG:SW PDP SWQMP
Step 1: Project type determination (Standard or Priority Development Project)
Is the project part of another Priority Development Project (PDP)? ( Yes No If so, a PDP SWQMP is required. Go to Step 2. The project is (select one): New Development Redevelopment1 The total proposed newly created or replaced impervious area is: 170,985 ft2 The total existing (pre-project) impervious area is: 37,945 ft2 The total area disturbed by the project is: 246,878 ft2 If the total area disturbed by the project is 1 acre (43,560 sq. ft.) or more OR the project is part of a larger common plan of development disturbing 1 acre or more, a Waste Discharger Identification (WDID) number must be obtained from the State Water Resources Control Board. WDID: N/A SWPPP will be prepared at Final Engineering Is the project in any of the following categories, (a) through (f)?2 Yes
No
(a) New development projects that create 10,000 square feet or more of impervious surfaces
3(collectively over the entire project site). This includes commercial, industrial, residential, mixed-use, and public development projects on public or private land.
Yes
No
(b) Redevelopment projects that create and/or replace 5,000 square feet or more of impervious surface (collectively over the entire project site on an existing site of 10,000 square feet or more of impervious surfaces). This includes commercial, industrial, residential, mixed-use, and public development projects on public or private land.
Yes
No
(c) New and redevelopment projects that create and/or replace 5,000 square feet or more of impervious surface (collectively over the entire project site), and support one or more of the following uses:
(i) Restaurants. This category is defined as a facility that sells prepared foods and drinks for consumption, including stationary lunch counters and refreshment stands selling prepared foods and drinks for immediate consumption (Standard Industrial Classification (SIC) code 5812).
(ii) Hillside development projects. This category includes development on any natural slope that is twenty-five percent or greater.
(iii) Parking lots. This category is defined as a land area or facility for the temporary parking or storage of motor vehicles used personally, for business, or for commerce.
(iv) Streets, roads, highways, freeways, and driveways. This category is defined as any paved impervious surface used for the transportation of automobiles, trucks, motorcycles, and other vehicles.
1 Redevelopment is defined as: The creation and/or replacement of impervious surface on an already developed
site. Examples include the expansion of a building footprint, road widening, the addition to or replacement of a structure, and creation or addition of impervious surfaces. Replacement of impervious surfaces includes any activity that is not part of a routine maintenance activity where impervious material(s) are removed, exposing underlying soil during construction. Redevelopment does not include routine maintenance activities, such as trenching and resurfacing associated with utility work; pavement grinding; resurfacing existing roadways; new sidewalks construction; pedestrian ramps; or bike lanes on existing roads; and routine replacement of damaged pavement, such as pothole repair.
2 Applicants should note that any development project that will create and/or replace 10,000 square feet or more of impervious surface (collectively over the entire project site) is considered a new development.
3 For solar energy farm projects, the area of the solar panels does not count toward the total impervious area of the site.

PRIORITY DEVELOPMENT PROJECT (PDP) SWQMP 2 of 44
Template Date: March 16, 2016 Preparation Date: June 19, 2017 LUEG:SW PDP SWQMP

PRIORITY DEVELOPMENT PROJECT (PDP) SWQMP 3 of 44
Template Date: March 16, 2016 Preparation Date: June 19, 2017 LUEG:SW PDP SWQMP
Project type determination (continued)
Yes
No
(d) New or redevelopment projects that create and/or replace 2,500 square feet or more of impervious surface (collectively over the entire project site), and discharging directly to an Environmentally Sensitive Area (ESA). “Discharging directly to” includes flow that is conveyed overland a distance of 200 feet or less from the project to the ESA, or conveyed in a pipe or open channel any distance as an isolated flow from the project to the ESA (i.e. not commingled with flows from adjacent lands).
Note: ESAs are areas that include but are not limited to all Clean Water Act Section 303(d) impaired water bodies; areas designated as Areas of Special Biological Significance by the State Water Board and San Diego Water Board; State Water Quality Protected Areas; water bodies designated with the RARE beneficial use by the State Water Board and San Diego Water Board; and any other equivalent environmentally sensitive areas which have been identified by the Copermittees. See BMP Design Manual Section 1.4.2 for additional guidance.
Yes
No
(e) New development projects, or redevelopment projects that create and/or replace 5,000 square feet or more of impervious surface, that support one or more of the following uses:
(i) Automotive repair shops. This category is defined as a facility that is categorized in any one of the following SIC codes: 5013, 5014, 5541, 7532-7534, or 7536-7539.
(ii) Retail gasoline outlets (RGOs). This category includes RGOs that meet the following criteria: (a) 5,000 square feet or more or (b) a projected Average Daily Traffic (ADT) of 100 or more vehicles per day.
Yes
No
(f) New or redevelopment projects that result in the disturbance of one or more acres of land and are expected to generate pollutants post construction.
Note: See BMP Design Manual Section 1.4.2 for additional guidance. Does the project meet the definition of one or more of the Priority Development Project categories (a) through (f) listed above?
No – the project is not a Priority Development Project (Standard Project). Yes – the project is a Priority Development Project (PDP).
Further guidance may be found in Chapter 1 and Table 1-2 of the BMP Design Manual. The following is for redevelopment PDPs only: The area of existing (pre-project) impervious area at the project site is: N/A ft2 (A) The total proposed newly created or replaced impervious area is N/A ft2 (B) Percent impervious surface created or replaced (B/A)*100: N/A % The percent impervious surface created or replaced is (select one based on the above calculation):
less than or equal to fifty percent (50%) – only newly created or replaced impervious areas are considered a PDP and subject to stormwater requirements
OR greater than fifty percent (50%) – the entire project site is considered a PDP and subject to
stormwater requirements

PRIORITY DEVELOPMENT PROJECT (PDP) SWQMP 4 of 44
Template Date: March 16, 2016 Preparation Date: June 19, 2017 LUEG:SW PDP SWQMP
Step 1.1: Storm Water Quality Management Plan requirements Step Answer Progression
Is the project a Standard Project, Priority Development Project (PDP), or exception to PDP definitions? To answer this item, complete Step 1 Project Type Determination Checklist on Pages 1 and 2, and see PDP exemption information below. For further guidance, see Section 1.4 of the BMP Design Manual in its entirety.
Standard Project
Standard Project requirements apply, including Standard Project SWQMP. Complete Standard Project SWQMP.
PDP
PDP with ACP
Standard and PDP requirements apply, including PDP SWQMP. Complete PDP SWQMP. If participating in offsite alternative compliance, complete Step 6.3 and an ACP SWQMP.
PDP Exemption
Go to Step 1.2 below.
Step 1.2: Exemption to PDP definitions Is the project exempt from PDP definitions based on either of the following:
Projects that are only new or retrofit paved sidewalks, bicycle lanes, or trails that meet the following criteria:
(i) Designed and constructed to direct storm water runoff to adjacent vegetated areas, or other non-erodible permeable areas; OR
(ii) Designed and constructed to be hydraulically disconnected from paved streets or roads [i.e., runoff from the new improvement does not drain directly onto paved streets or roads]; OR
(iii) Designed and constructed with permeable pavements or surfaces in accordance with County of San Diego Guidance on Green Infrastructure;
If so: Standard Project requirements apply, AND any additional requirements specific to the type of project. County concurrence with the exemption is required. Provide discussion and list any additional requirements below in this form. Complete Standard Project SWQMP
Projects that are only retrofitting or redeveloping existing paved alleys, streets or roads that are designed and constructed in accordance with the County of San Diego Guidance on Green Infrastructure.
Complete Green Streets PDP Exempt SWQMP.
Discussion / justification, and additional requirements for exceptions to PDP definitions, if applicable:

PRIORITY DEVELOPMENT PROJECT (PDP) SWQMP 5 of 44
Template Date: March 16, 2016 Preparation Date: June 19, 2017 LUEG:SW PDP SWQMP
Step 2: Construction Storm Water BMP Checklist Minimum Required Standard Construction Storm Water BMPs
If you answer “Yes” to any of the questions below, your project is subject to Table 1 on the following page (Minimum Required Standard Construction Stormwater BMPs). As noted in Table 1, please select at least the minimum number of required BMPs, or as many as are feasible for your project. If no BMP is selected, an explanation must be given in the box provided. The following questions are intended to aid in determining construction BMP requirements for your project. Note: All selected BMPs below must be included on the BMP plan incorporated into the construction plan sets. 1. Will there be soil disturbing activities that will result in exposed soil areas? (This includes minor grading and trenching.) Reference Table 1 Items A, B, D, and E Note: Soil disturbances NOT considered significant include, but are not limited to, change in use, mechanical/electrical/plumbing activities, signs, temporary trailers, interior remodeling, and minor tenant improvement.
Yes No
2. Will there be asphalt paving, including patching? Reference Table 1 Items D and F
Yes No
3. Will there be slurries from mortar mixing, coring, or concrete saw cutting? Reference Table 1 Items D and F
Yes No
4. Will there be solid wastes from concrete demolition and removal, wall construction, or form work? Reference Table 1 Items D and F
Yes No
5. Will there be stockpiling (soil, compost, asphalt, concrete, solid waste) for over 24 hours? Reference Table 1 Items D and F
Yes No
6. Will there be dewatering operations? Reference Table 1 Items C and D
Yes No
7. Will there be temporary on-site storage of construction materials, including mortar mix, raw landscaping and soil stabilization materials, treated lumber, rebar, and plated metal fencing materials? Reference Table 1 Items E and F
Yes No
8. Will trash or solid waste product be generated from this project? Reference Table 1 Item F
Yes No
9. Will construction equipment be stored on site (e.g.: fuels, oils, trucks, etc.?) Reference Table 1 Item F
Yes No
10. Will Portable Sanitary Services (“Porta-potty”) be used on the site? Reference Table 1 Item F
Yes No

PRIORITY DEVELOPMENT PROJECT (PDP) SWQMP 6 of 44
Template Date: March 16, 2016 Preparation Date: June 19, 2017 LUEG:SW PDP SWQMP
Table 1. Construction Storm Water BMP Checklist
Minimum Required Best Management Practices
(BMPs)
CALTRANS SW
Handbook4 Detail or
County Std. Detail
BMP
Selected
Reference sheet No.’s where each selected BMP is shown on the
plans. If no BMP is selected, an
explanation must be provided. A. Select Erosion Control Method for Disturbed Slopes (choose at least one for the appropriate season) Vegetation Stabilization Planting5 (Summer)
SS-2, SS-4 The project is currently in the entitlement stage. Erosion Control Plans will be prepared in final engineering. The checked items are the anticipated BMPs during final engineering.
Hydraulic Stabilization Hydroseeding2 (Summer)
SS-4
Bonded Fiber Matrix or Stabilized Fiber Matrix6 (Winter)
SS-3
Physical Stabilization Erosion Control Blanket3 (Winter)
SS-7
B. Select erosion control method for disturbed flat areas (slope < 5%) (choose at least one) County Standard Lot Perimeter Protection Detail
PDS 6597, SC-2
The project is currently in the entitlement stage. Erosion Control Plans will be prepared in final engineering. The checked items are the anticipated BMPs during final engineering.
Will use erosion control measures from Item A on flat areas also
SS-3, 4, 7
County Standard Desilting Basin (must treat all site runoff)
PDS 6608, SC-2
Mulch, straw, wood chips, soil application
SS-6, SS-8
4 State of California Department of Transportation (Caltrans). 2003. Storm Water Quality Handbooks, Construction
Site Best Management Practices (BMPs) Manual. March. Available online at: http://www.dot.ca.gov/hq/construc/stormwater/manuals.htm.
5 If Vegetation Stabilization (Planting or Hydroseeding) is proposed for erosion control it may be installed between May 1st and August 15th. Slope irrigation is in place and needs to be operable for slopes >3 feet. Vegetation must be watered and established prior to October 1st. The owner must implement a contingency physical BMP by August 15th if vegetation establishment does not occur by that date. If landscaping is proposed, erosion control measures must also be used while landscaping is being established. Established vegetation must have a subsurface mat of intertwined mature roots with a uniform vegetative coverage of 70 percent of the natural vegetative coverage or more on all disturbed areas.
6 All slopes over three feet must have established vegetative cover prior to final permit approval. 7 County of San Diego, Planning & Development Services. 2012. Standard Lot Perimeter Protection Design
System. Building Division. PDS 659. Available online at http://www.sandiegocounty.gov/pds/docs/pds659.pdf. 8 County of San Diego, Planning & Development Services. 2012. County Standard Desilting Basin for Disturbed
Areas of 1 Acre or Less Building Division. PDS 659. Available online at http://www.sandiegocounty.gov/pds/docs/pds660.pdf.

PRIORITY DEVELOPMENT PROJECT (PDP) SWQMP 7 of 44
Template Date: March 16, 2016 Preparation Date: June 19, 2017 LUEG:SW PDP SWQMP
Table 1. Construction Storm Water BMP Checklist (continued)
Minimum Required Best Management Practices
(BMPs)
CALTRANS SW Handbook
Detail or County Std.
Detail
BMP
Selected
Reference sheet No.’s where each selected BMP is shown on the
plans. If no BMP is selected, an
explanation must be provided. C. If runoff or dewatering operation is concentrated, velocity must be controlled using an energy dissipater Energy Dissipater Outlet Protection9
SS-10
D. Select sediment control method for all disturbed areas (choose at least one) Silt Fence SC-1 The project is currently in the
entitlement stage. Erosion Control Plans will be prepared in final engineering. The checked items are the anticipated BMPs during final engineering.
Fiber Rolls (Straw Wattles) SC-5 Gravel & Sand Bags SC-6 & 8 Dewatering Filtration NS-2 Storm Drain Inlet Protection SC-10 Engineered Desilting Basin (sized for 10-year flow)
SC-2
E. Select method for preventing offsite tracking of sediment (choose at least one) Stabilized Construction Entrance TC-1 The project is currently in the
entitlement stage. Erosion Control Plans will be prepared in final engineering. The checked items are the anticipated BMPs during final engineering.
Construction Road Stabilization TC-2 Entrance/Exit Tire Wash TC-3 Entrance/Exit Inspection & Cleaning Facility
TC-1
Street Sweeping and Vacuuming SC-7
F. Select the general site management BMPs F.1 Materials Management Material Delivery & Storage WM-1
Spill Prevention and Control WM-4 F.2 Waste Management10 Waste Management Concrete Waste Management
WM-8
Solid Waste Management WM-5 Sanitary Waste Management WM-9 Hazardous Waste Management WM-6 Note: The Construction General Permit (Order No. 2009-0009-DWQ) also requires all projects not subject to the BMP Design Manual to comply with runoff reduction requirements through the implementation of post-construction BMPs as described in Section XIII of the order.
9 Regional Standard Drawing D-40 – Rip Rap Energy Dissipater is also acceptable for velocity reduction. 10 Not all projects will have every waste identified. The applicant is responsible for identifying wastes that will be
onsite and applying the appropriate BMP. For example, if concrete will be used, BMP WM-8 must be selected.

PRIORITY DEVELOPMENT PROJECT (PDP) SWQMP 8 of 44
Template Date: March 16, 2016 Preparation Date: June 19, 2017 LUEG:SW PDP SWQMP
Step 3: County of San Diego PDP SWQMP Site Information Checklist
Step 3.1: Description of Existing Site Condition Project Watershed (Complete Hydrologic Unit, Area, and Subarea Name with Numeric Identifier)
San Luis Rey Hydrologic Unit, Lower San Luis Hydrologic Area, Valley Center Hydrologic Subarea 903.14
Current Status of the Site (select all that apply): Existing development Previously graded but not built out Demolition completed without new construction Agricultural or other non-impervious use Vacant, undeveloped/natural
Description / Additional Information: Residential home has been demolished, lot is vacant Existing Land Cover Includes (select all that apply and provide each area on site):
Vegetative Cover N/A Acres (N/A Square Feet) Non-Vegetated Pervious Areas 4.80 Acres ( 208,933 Square Feet) Impervious Areas 0.87 Acres (37,945 Square Feet)
Description / Additional Information: Impervious area consists of portion of AC Pavement that will be removed and/or replaced within Mirar De Valle as part of 10.5’ RW dedication and existing pavement on Old Mirar De Valle which are offsite improvements, refer to Section D-D of Tentative Map Title Sheet and sheet 4 “Secondary Fire Access Plan”. Old Mirar De Valle is designed as a secondary fire access plan and is only to be constructed if Street A of Park Circle TM 5603 is not constructed prior to Shady Oak project. For purposes of this report, Old Mirar De Valle are included in the calculations. Underlying Soil belongs to Hydrologic Soil Group (select all that apply):
NRCS Type A NRCS Type B NRCS Type C NRCS Type D
Approximate Depth to Groundwater (GW) (or N/A if no infiltration is used): N/A GW Depth < 5 feet 5 feet < GW Depth < 10 feet 10 feet < GW Depth < 20 feet GW Depth > 20 feet

PRIORITY DEVELOPMENT PROJECT (PDP) SWQMP 9 of 44
Template Date: March 16, 2016 Preparation Date: June 19, 2017 LUEG:SW PDP SWQMP
Existing Natural Hydrologic Features (select all that apply): Watercourses Seeps Springs Wetlands None Other
Description / Additional Information: No significant hydrologic features exist within the site.
Step 3.2: Description of Existing Site Drainage Patterns How is storm water runoff conveyed from the site? At a minimum, this description should answer:
(1) Whether existing drainage conveyance is natural or urban; (2) Is runoff from offsite conveyed through the site? if yes, quantify all offsite drainage areas, design flows, and locations where offsite flows enter the project site, and summarize how such flows are conveyed through the site; (3) Provide details regarding existing project site drainage conveyance network, including any existing storm drains, concrete channels, swales, detention facilities, storm water treatment facilities, natural or constructed channels; and (4) Identify all discharge locations from the existing project site along with a summary of conveyance system size and capacity for each of the discharge locations. Provide summary of the pre-project drainage areas and design flows to each of the existing runoff discharge locations.

PRIORITY DEVELOPMENT PROJECT (PDP) SWQMP 10 of 44
Template Date: March 16, 2016 Preparation Date: June 19, 2017 LUEG:SW PDP SWQMP
Describe existing site drainage patterns: The property does not contain an existing drainage system. In Pre-project condition, a portion of the hillside south of the project sheet flows onto the site and confluences with site flows in a northeasterly direction, eventually confluencing with surrounding flows associated with Mirar De Valle and low density residential areas to the south. Flows discharge to the north of Mirar De Valle via a 3- 8’ (W) x 2’ (H) RCB constructed as part of Mirar de Valle Improvements (CG 4307). Runoff continues its course north eventually converging with Moosa Canyon Creek.

PRIORITY DEVELOPMENT PROJECT (PDP) SWQMP 11 of 44
Template Date: March 16, 2016 Preparation Date: June 19, 2017 LUEG:SW PDP SWQMP
Step 3.3: Description of Proposed Site Development Project Description / Proposed Land Use and/or Activities: The project proposes the construction of 47 single family residential homes and associated surface improvements which include removal of existing AC pavement and AC Berm along Mirar De Valle, construction of internal streets/alleys and halfwidth improvements of future Road 19 on the Easterly end of the property. Old Mirar De Valle is designed as a secondary fire access plan and is only to be constructed if Street A of Park Circle TM 5603 is not constructed prior to Shady Oak project. Decomposed granite pathways are part of the improvements on Mirar De Valle, Street A “Road 19” and Street B. List/describe proposed impervious features of the project (e.g., buildings, roadways, parking lots, courtyards, athletic courts, other impervious features): The anticipated impervious features for the project are AC pavement, curb and gutter,rooftops, retaining walls and concrete pathways from the homes.
List/describe proposed pervious features of the project (e.g., landscape areas): The proposed pervious features are biofiltration basins along the northerly portion of the site, landscaped areas and DG walkways within the parkway of Mirar De Valle, Street A “Road 19” and Street B. Slopes associated with the construction of Road 19 and Old Mirar De Valle and pervious areas surrounding the residential homes and the Oak tree that is being preserved.
Does the project include grading and changes to site topography? Yes No
Description / Additional Information: The site is slopes gently in a northeasterly direction. The proposed grading will mimic this approach and sheet flow all runoff into biofiltration basins along the northerly property boundary.
Insert acreage or square feet for the different land cover types in the table below:
Change in Land Cover Type Summary Land Cover Type Existing
(acres or ft2) Proposed (acres or ft2)
Percent Change
Vegetation 4.8 Ac 1.74 Ac -64 Pervious (non-vegetated) Impervious 0.87 Ac 3.93 Ac 351%

PRIORITY DEVELOPMENT PROJECT (PDP) SWQMP 12 of 44
Template Date: March 16, 2016 Preparation Date: June 19, 2017 LUEG:SW PDP SWQMP
Step 3.4: Description of Proposed Site Drainage Patterns Does the project include changes to site drainage (e.g., installation of new storm water conveyance systems)?
Yes No
If yes, provide details regarding the proposed project site drainage conveyance network, including storm drains, concrete channels, swales, detention facilities, storm water treatment facilities, natural or constructed channels, and the method for conveying offsite flows through or around the proposed project site. Identify all discharge locations from the proposed project site along with a summary of the conveyance system size and capacity for each of the discharge locations. Provide a summary of pre- and post-project drainage areas and design flows to each of the runoff discharge locations. Reference the drainage study for detailed calculations. Describe proposed site drainage patterns: The proposed project will mimic the existing drainage patterns, which flow in a northeasterly direction. Runoff from the Shady Oak site will sheet flow into a biofiltration basins along the northerly portion of the site. Street A “Road 19” will be directed to the biofiltration basins via reverse curb outlet and ditch for treatment. The existing pavement and portion of Street A won’t be directed into the Biofiltration Basins, however, the areas have been accounted for in the calculations as “Alternative onsite compliance”. Once treated, the flows will be piped into a proposed curb inlet on Mirar de Valle used to capture offsite flows. The mainline will continue its course east until discharging into a channel associated with the Park Circle Project, County of San Diego Tract No. 5603. Old Mirar De Valle is designed as a secondary fire access plan and is only to be constructed if Street A of Park Circle TM 5603 is not constructed prior to Shady Oak project. Two proposed drainage pipes on Old Mirar De Valle will be used to transport Offsite coarse sediment that sheet flows across Old Mirar De Valle in the existing condition. In order to not comingle flows, Old Mirar De Valle has been raised and directed towards the north. Pollutant and flow control requirements will be satisfied by tree wells within the existing 60’ IOD on Old Mirar De Valle. The overflow from the tree wells will spill over and continue its coarse to the north to the existing 3-2’(h)x8’(w) box culverts on Mirar De Valle where it converges with flows from the Shady Oak site. The pre and post project drainage area is 31.8 Acres. In the pre-project condition, 63.9 CFS discharge into the property north of Mirar de Valle via 3-2’ (h) x 8’ (w) box culverts. In the post project condition, 63.9 CFS (66.1 CFS undetained) will discharge into the box culverts, which have capacity for 128.5 CFS as shown on the As-Builts (CG 4307, TM 5039-2). The increase in runoff will be mitigated by detaining within the biofiltration basins. In order to detain 2.2 cfs, 0.06 acre-feet (2613 ft3) of volume is required. This will be accomplished by allowing 6” of ponding above the Hydromodification volume within the biofiltration basins. Detailed outlet works will be designed in the Final Engineering stage .Refer to Drainage Study titled “Preliminary Drainage Study for Shady Oak” prepared by TSAC Engineering for pre project and post-project flows.

PRIORITY DEVELOPMENT PROJECT (PDP) SWQMP 13 of 44
Template Date: March 16, 2016 Preparation Date: June 19, 2017 LUEG:SW PDP SWQMP
Step 3.5: Potential Pollutant Source Areas Identify whether any of the following features, activities, and/or pollutant source areas will be present (select all that apply). Select “Other” if the project is a phased development and provide a description:
On-site storm drain inlets Interior floor drains and elevator shaft sump pumps Interior parking garages Need for future indoor & structural pest control Landscape/Outdoor Pesticide Use Pools, spas, ponds, decorative fountains, and other water features Food service Refuse areas Industrial processes Outdoor storage of equipment or materials Vehicle and Equipment Cleaning Vehicle/Equipment Repair and Maintenance Fuel Dispensing Areas Loading Docks Fire Sprinkler Test Water Miscellaneous Drain or Wash Water Plazas, sidewalks, and parking lots Other (provide description)
Description / Additional Information: The proposed project will construct 47 single family residences, therefore only the checked items are anticipated.

PRIORITY DEVELOPMENT PROJECT (PDP) SWQMP 14 of 44
Template Date: March 16, 2016 Preparation Date: June 19, 2017 LUEG:SW PDP SWQMP
Step 3.6: Identification and Narrative of Receiving Water and Pollutants of Concern
Describe flow path of storm water from the project site discharge location(s), through urban storm conveyance systems as applicable, to receiving creeks, rivers, and lagoons as applicable, and ultimate discharge to the Pacific Ocean (or bay, lagoon, lake or reservoir, as applicable): Runoff will sheet flow northerly into Biofiltration Basins along the northerly portion of the site. Once treated, the flows will be piped into a proposed curb inlet on Mirar de Valle used to capture offsite flows. The mainline will continue its course east until discharging into a channel associated with the Park Circle Project, County of San Diego Tract No. 5603. Flows will then comingle with flows from the Park Circle Site prior to discharging to Moosa Creek, which intersects Park Circle Project. Flows from Moosa Creek will flow west, eventually converging with San Luis Rey River, eventually outleting to the Pacific Ocean. List any 303(d) impaired water bodies11 within the path of storm water from the project site to the Pacific Ocean (or bay, lagoon, lake or reservoir, as applicable), identify the pollutant(s)/stressor(s) causing impairment, and identify any TMDLs and/or Highest Priority Pollutants from the WQIP for the impaired water bodies:
303(d) Impaired Water Body Pollutant(s)/Stressor(s) TMDLs / WQIP Highest
Priority Pollutant Moosa Canyon Creek Phosphorus, toxicity Bacteria San Luis Rey River, Lower Benthic community effects,
Bifenthrin, Indicator Bacteria, Chloride, Phosporus, Total Dissolved Solids, Nitrogen, Toxicity
Bacteria
Pacific Ocean Shoreline Enterococcus, Fiscal Coliform, Total Coliform
Bacteria
Identification of Project Site Pollutants* *Identification of project site pollutants below is only required if flow-thru treatment BMPs are implemented onsite in lieu of retention or biofiltration BMPs. Note the project must also participate in an alternative compliance program (unless prior lawful approval to meet earlier PDP requirements is demonstrated). Identify pollutants expected from the project site based on all proposed use(s) of the site (see BMP Design Manual Appendix B.6):
Pollutant Not Applicable to the Project Site
Anticipated from the Project Site
Also a Receiving Water Pollutant of
Concern Sediment
Nutrients
Heavy Metals
Organic Compounds
11 The current list of Section 303(d) impaired water bodies can be found at
http://www.waterboards.ca.gov/water_issues/programs/water_quality_assessment/#impaired

PRIORITY DEVELOPMENT PROJECT (PDP) SWQMP 15 of 44
Template Date: March 16, 2016 Preparation Date: June 19, 2017 LUEG:SW PDP SWQMP
Trash & Debris
Oxygen Demanding Substances
Oil & Grease
Bacteria & Viruses
Pesticides
Step 3.7: Hydromodification Management Requirements Do hydromodification management requirements apply (see Section 1.6 of the BMP Design Manual)?
Yes, hydromodification management requirements for flow control and preservation of critical coarse sediment yield areas are applicable. No, the project will discharge runoff directly to existing underground storm drains discharging directly to water storage reservoirs, lakes, enclosed embayments, or the Pacific Ocean. No, the project will discharge runoff directly to conveyance channels whose bed and bank are concrete-lined all the way from the point of discharge to water storage reservoirs, lakes, enclosed embayments, or the Pacific Ocean. No, the project will discharge runoff directly to an area identified as appropriate for an exemption by the WMAA12 for the watershed in which the project resides.
Description / Additional Information (to be provided if a 'No' answer has been selected above):
12 The Watershed Management Area Analysis (WMAA) is an optional element for inclusion in the Water Quality
Improvement Plans (WQIPs) described in the 2013 MS4 Permit [Provision B.3.b.(4)]. It is available online at the Project Clean Water website: http://www.projectcleanwater.org/index.php?option=com_content&view=article&id=248

PRIORITY DEVELOPMENT PROJECT (PDP) SWQMP 16 of 44
Template Date: March 16, 2016 Preparation Date: June 19, 2017 LUEG:SW PDP SWQMP
Step 3.7.1: Critical Coarse Sediment Yield Areas* *This Section only required if hydromodification management requirements apply
Projects must satisfy critical coarse sediment yield area (CCSYA) requirements by characterizing the project as one of the scenario-types presented below and satisfying associated criteria. Projects must appropriately satisfy all requirements for identification, avoidance, and bypass, OR may alternatively elect to demonstrate no net impact.
Scenario 1: Project is subject to and in compliance with RPO requirements (without utilization of RPO exemptions 86.604(e)(2)(cc) or 86.604(e)(3) that result in impacts to more than 15% of the project-scale CCSYAs).
Identify: Project has identified both onsite and upstream CCSYAs as areas that are coarse, ≥25% slope, and ≥50’ tall. (Optional refinement methods may be performed per guidance in Section H.1.2). AND, Avoid: Project has avoided onsite CCSYAs per existing RPO steep slope encroachment criteria. AND, Bypass: Project has demonstrated that both onsite and upstream CCSYAs are bypassed through or around the project site with a 2 year peak storm velocity of 3 feet per second or greater. OR, No Net Impact: Project does not satisfy all Scenario 1 criteria above and must alternatively demonstrate no net impact to the receiving water.
Scenario 2: Project is entirely exempt/not subject to RPO requirements without utilization of RPO exemptions 86.604(e)(2)(cc) or 86.604(e)(3).
Identify: Project has identified upstream CCSYAs that are coarse, ≥25% slope, and ≥50’ tall. (Optional refinement methods may be performed per guidance in Section H.1.2). AND, Avoid: Project is not required to avoid onsite CCSYAs as none were identified in the previous step. AND, Bypass: Project has demonstrated that upstream CCSYAs are bypassed through or around the project site with a 2 year peak storm velocity of 3 feet per second or greater. OR, No Net Impact: Project does not satisfy all Scenario 2 criteria above and must alternatively demonstrate no net impact to the receiving water. (Skip to next row).
Scenario 3: Project utilizes exemption(s) via RPO Section 86.604(e)(2)(cc) or 86.604(e)(3) and impacts more than 15% of the project-scale CCSYAs.
No Net Impact: Project is not eligible for traditional methods of identification, avoidance, and bypass. Project must demonstrate no net impact to the receiving water.

PRIORITY DEVELOPMENT PROJECT (PDP) SWQMP 17 of 44
Template Date: March 16, 2016 Preparation Date: June 19, 2017 LUEG:SW PDP SWQMP
Critical Coarse Sediment Yield Areas Continued Demonstrate No Net Impact
If the project elects to satisfy CCSYA criteria through demonstration of no net impact to the receiving water. Applicants must identify the methods utilized from the list below and provide supporting documentation in Attachment 2c of the SWQMP. Check all that are applicable.
N/A, the project appropriately identifies, avoids, and bypasses CCSYAs. Project has performed additional analysis to demonstrate that impacts to CCSYAs satisfy the
no net impact standard of Ep/Sp≤1.1. Project has provided alternate mapping of CCSYAs. Project has implemented additional onsite hydromodification flow control measures. Project has implemented an offsite stream rehabilitation project to offset impacts. Project has implemented other applicant-proposed mitigation measures.
Step 3.7.2: Flow Control for Post-Project Runoff* *This Section only required if hydromodification management requirements apply
List and describe point(s) of compliance (POCs) for flow control for hydromodification management (see Section 6.3.1). For each POC, provide a POC identification name or number correlating to the project's HMP Exhibit and a receiving channel identification name or number correlating to the project's HMP Exhibit. The project will be discharging all onsite and offsite flow into a channel associated with the Park Circle Project, County of San Diego Tract No. 5603. Therefore, only one Point of Compliance will be present.
Has a geomorphic assessment been performed for the receiving channel(s)? No, the low flow threshold is 0.1Q2 (default low flow threshold) Yes, the result is the low flow threshold is 0.1Q2 Yes, the result is the low flow threshold is 0.3Q2 Yes, the result is the low flow threshold is 0.5Q2
If a geomorphic assessment has been performed, provide title, date, and preparer: Discussion / Additional Information: (optional)

PRIORITY DEVELOPMENT PROJECT (PDP) SWQMP 18 of 44
Template Date: March 16, 2016 Preparation Date: June 19, 2017 LUEG:SW PDP SWQMP
Step 3.8: Other Site Requirements and Constraints When applicable, list other site requirements or constraints that will influence storm water management design, such as zoning requirements including setbacks and open space, or local codes governing minimum street width, sidewalk construction, allowable pavement types, and drainage requirements.
Optional Additional Information or Continuation of Previous Sections As Needed This space provided for additional information or continuation of information from previous sections as needed.

PRIORITY DEVELOPMENT PROJECT (PDP) SWQMP 19 of 44
Template Date: March 16, 2016 Preparation Date: June 19, 2017 LUEG:SW PDP SWQMP
Step 4: Source Control BMP Checklist Source Control BMPs
All development projects must implement source control BMPs 4.2.1 through 4.2.6 where applicable and feasible. See Chapter 4.2 and Appendix E of the County BMP Design Manual for information to implement source control BMPs shown in this checklist. Answer each category below pursuant to the following:
"Yes" means the project will implement the source control BMP as described in Chapter 4.2 and/or Appendix E of the County BMP Design Manual. Discussion / justification is not required.
"No" means the BMP is applicable to the project but it is not feasible to implement. Discussion / justification must be provided.
"N/A" means the BMP is not applicable at the project site because the project does not include the feature that is addressed by the BMP (e.g., the project has no outdoor materials storage areas). Discussion / justification must be provided.
Source Control Requirement Applied? 4.2.1 Prevention of Illicit Discharges into the MS4 Yes No N/A Discussion / justification if 4.2.1 not implemented:
4.2.2 Storm Drain Stenciling or Signage Yes No N/A Discussion / justification if 4.2.2 not implemented:
4.2.3 Protect Outdoor Materials Storage Areas from Rainfall, Run-On, Runoff, and Wind Dispersal
Yes No N/A
Discussion / justification if 4.2.3 not implemented: The project proposes construction of 47 single family residential units. Outdoor material storage areas are not anticipated.
4.2.4 Protect Materials Stored in Outdoor Work Areas from Rainfall, Run-On, Runoff, and Wind Dispersal
Yes No N/A
Discussion / justification if 4.2.4 not implemented: The project proposes construction of 47 single family residential units. Outdoor work areas are not anticipated.

PRIORITY DEVELOPMENT PROJECT (PDP) SWQMP 20 of 44
Template Date: March 16, 2016 Preparation Date: June 19, 2017 LUEG:SW PDP SWQMP
Source Control Requirement Applied? 4.2.5 Protect Trash Storage Areas from Rainfall, Run-On, Runoff, and Wind Dispersal
Yes No N/A
Discussion / justification if 4.2.5 not implemented: 4.2.6 Additional BMPs Based on Potential Sources of Runoff Pollutants (must answer for each source listed below):
A. On-site storm drain inlets Yes No N/A B. Interior floor drains and elevator shaft sump pumps Yes No N/A C. Interior parking garages Yes No N/A D. Need for future indoor & structural pest control Yes No N/A E. Landscape/outdoor pesticide use Yes No N/A F. Pools, spas, ponds, fountains, and other water
features Yes No N/A
G. Food service Yes No N/A H. Refuse areas Yes No N/A I. Industrial processes Yes No N/A J. Outdoor storage of equipment or materials Yes No N/A K. Vehicle and equipment cleaning Yes No N/A L. Vehicle/equipment repair and maintenance Yes No N/A M. Fuel dispensing areas Yes No N/A N. Loading docks Yes No N/A O. Fire sprinkler test water Yes No N/A P. Miscellaneous drain or wash water Yes No N/A Q. Plazas, sidewalks, and parking lots Yes No N/A
Discussion / justification if 4.2.6 not implemented. Clearly identify which sources of runoff pollutants are discussed. Justification must be provided for all "No" answers shown above. The project proposes construction of 47 single family residential units. Items b-c, f-n and p are not anticipated.
Note: Show all source control measures described above that are included in design capture volume calculations in the plan sheets of Attachment 5.

PRIORITY DEVELOPMENT PROJECT (PDP) SWQMP 21 of 44
Template Date: March 16, 2016 Preparation Date: June 19, 2017 LUEG:SW PDP SWQMP
Step 5: Site Design BMP Checklist Site Design BMPs
All development projects must implement site design BMPs SD-A through SD-H where applicable and feasible. See Chapter 4.3 and Appendix E of the County BMP Design Manual for information to implement site design BMPs shown in this checklist. Answer each category below pursuant to the following:
"Yes" means the project will implement the site design BMP as described in Chapter 4.3 and/or Appendix E of the County BMP Design Manual. Discussion / justification is not required.
"No" means the BMP is applicable to the project but it is not feasible to implement. Discussion / justification must be provided.
"N/A" means the BMP is not applicable at the project site because the project does not include the feature that is addressed by the BMP (e.g., the project site has no existing natural areas to conserve). Discussion / justification must be provided.
Site Design Requirement Applied? 4.3.1 Maintain Natural Drainage Pathways and Hydrologic Features
Yes No N/A
Discussion / justification if 4.3.1 not implemented: There are no natural drainage pathways within the project site.
4.3.2 Conserve Natural Areas, Soils, and Vegetation Yes No N/A Discussion / justification if 4.3.2 not implemented:
4.3.3 Minimize Impervious Area Yes No N/A Discussion / justification if 4.3.3 not implemented: Approximately 70% of the project site is impervious.
4.3.4 Minimize Soil Compaction Yes No N/A Discussion / justification if 4.3.4 not implemented: Approximately 70% of the project site is impervious surfaces including pavement, and buildings. Compaction of the existing soil will only be done where necessary to support these structural components. 4.3.5 Impervious Area Dispersion Yes No N/A Discussion / justification if 4.3.5 not implemented:

PRIORITY DEVELOPMENT PROJECT (PDP) SWQMP 22 of 44
Template Date: March 16, 2016 Preparation Date: June 19, 2017 LUEG:SW PDP SWQMP
Site Design Requirement Applied? 4.3.6 Runoff Collection Yes No N/A Discussion / justification if 4.3.6 not implemented: Runoff from the site will sheet flow into the biofiltration basin for treatment. The site consists of Type C and Type D soils which provide low infiltration rates. Permeable pavement is not a practical use for this project. If a liner was used for the permeable pavement, it would serve the same purpose as the biofiltration basin. Since there is sufficient area in the biofiltration basin, permeable pavement will not be used. 4.3.7 Landscaping with Native or Drought Tolerant Species Yes No N/A Discussion / justification if 4.3.7 not implemented:
4.3.8 Harvesting and Using Precipitation Yes No N/A Discussion / justification if 4.3.8 not implemented: Rain Barrels and/or Cisterns will be encouraged for use by the homeowners, however enforcement of their use and maintenance will be of concern. At this preliminary stage, biofiltration will be used to meet the site design, pollutant control and flow control requirements for the project site. Note: Show all site design measures described above that are included in design capture volume calculations in the plan sheets of Attachment 5.

PRIORITY DEVELOPMENT PROJECT (PDP) SWQMP 23 of 44
Template Date: March 16, 2016 Preparation Date: June 19, 2017 LUEG:SW PDP SWQMP
Step 6: PDP Structural BMPs All PDPs must implement structural BMPs for storm water pollutant control (see Chapter 5 of the BMP Design Manual). Selection of PDP structural BMPs for storm water pollutant control must be based on the selection process described in Chapter 5. PDPs subject to hydromodification management requirements must also implement structural BMPs for flow control for hydromodification management (see Chapter 6 of the BMP Design Manual). Both storm water pollutant control and flow control for hydromodification management can be achieved within the same structural BMP(s).
PDP structural BMPs must be verified by the County at the completion of construction. This may include requiring the project owner or project owner's representative and engineer of record to certify construction of the structural BMPs (see Section 1.12 of the BMP Design Manual). PDP structural BMPs must be maintained into perpetuity, and the County must confirm the maintenance (see Section 7 of the BMP Design Manual).
Use this section to provide narrative description of the general strategy for structural BMP implementation at the project site in the box below. Then complete the PDP structural BMP summary information sheet (Step 6.2) for each structural BMP within the project (copy the BMP summary information sheet [Step 6.2] as many times as needed to provide summary information for each individual structural BMP).
Step 6.1: Description of structural BMP strategy Describe the general strategy for structural BMP implementation at the site. This information must describe how the steps for selecting and designing storm water pollutant control BMPs presented in Section 5.1 of the BMP Design Manual were followed, and the results (type of BMPs selected). For projects requiring hydromodification flow control BMPs, indicate whether pollutant control and flow control BMPs are integrated or separate. At the end of this discussion provide a summary of all the structural BMPs within the project including the type and number. The BMP feasibility analysis (Worksheet B.3-1) was performed and results were that Biofiltration BMPs be implemented. The anticipated demand for the project to implement capture & reuse was less than what was available. Furthermore, the site consists of hydrologic soils C and D, which provide low infiltration rates, therefore infiltration was deemed infeasible. The Biofiltration basin on site is bound by retaining walls and is adjacent to homes. Partial retention of water in type C and D soils has the potential to undermine the structural stability of the wall retaining the building pad and parkway from Mirar De Valle. Harvest and reuse was considered but determined to be impractical due to the difficulty of enforcement on individual homeowners. The biofiltration BMPs(BF-1), have been implemented onsite to treat onsite flows. Treated flows from the Biofiltration BMPs discharge into a proposed storm drain mainline on Mirar De Valle containing offsite flows prior to discharging to a channel associated with the Park Circle Project, County of San Diego Tract No 5603. The biofiltration basins will integrate pollutant and source control measures. (Continue on following page as necessary.)

PRIORITY DEVELOPMENT PROJECT (PDP) SWQMP 24 of 44
Template Date: March 16, 2016 Preparation Date: June 19, 2017 LUEG:SW PDP SWQMP
Description of structural BMP strategy continued (Page reserved for continuation of description of general strategy for structural BMP
implementation at the site) (Continued from previous page)

PRIORITY DEVELOPMENT PROJECT (PDP) SWQMP 25 of 44
Template Date: March 16, 2016 Preparation Date: June 19, 2017 LUEG:SW PDP SWQMP
Step 6.2: Structural BMP Checklist (Copy this page as needed to provide information for each individual proposed
structural BMP) Structural BMP ID No. LID-Onsite1-4, LID-Old-MDV Construction Plan Sheet No. TM Shts. 2-4 Type of structural BMP:
Retention by harvest and use (HU-1) Retention by infiltration basin (INF-1) Retention by bioretention (INF-2) Retention by permeable pavement (INF-3) Partial retention by biofiltration with partial retention (PR-1) Biofiltration (BF-1) Biofiltration with Nutrient Sensitive Media Design (BF-2) Proprietary Biofiltration (BF-3) meeting all requirements of Appendix F Flow-thru treatment control with prior lawful approval to meet earlier PDP requirements (provide BMP type/description in discussion section below) Flow-thru treatment control included as pre-treatment/forebay for an onsite retention or biofiltration BMP (provide BMP type/description and indicate which onsite retention or biofiltration BMP it serves in discussion section below) Flow-thru treatment control with alternative compliance (provide BMP type/description in discussion section below) Detention pond or vault for hydromodification management Other (describe in discussion section below)
Purpose: Pollutant control only Hydromodification control only Combined pollutant control and hydromodification control Pre-treatment/forebay for another structural BMP Other (describe in discussion section below)
Who will certify construction of this BMP? Provide name and contact information for the party responsible to sign BMP verification forms (See Section 1.12 of the BMP Design Manual)
Property owner to identify/contract third party during final engineering.
Who will be the final owner of this BMP?
HOA Property Owner County Other (describe)
Who will maintain this BMP into perpetuity?
HOA Property Owner County Other (describe)
What Category (1-4) is the Structural BMP? Refer to the Category definitions in Section 7.3 of the BMP DM. Attach the appropriate maintenance agreement in Attachment 3.
2
Discussion (as needed): Tree Wells on Old Mirar De Valle will treat pollutant control and hydromodification requirements. (Continue on subsequent pages as necessary)

PRIORITY DEVELOPMENT PROJECT (PDP) SWQMP 26 of 44
Template Date: March 16, 2016 Preparation Date: June 19, 2017 LUEG:SW PDP SWQMP
Step 6.3: Offsite Alternative Compliance Participation Form PDP INFORMATION Record ID:
Assessor's Parcel Number(s) [APN(s)]
What are your PDP Pollutant Control Debits? *See Attachment 1 of the PDP SWQMP
What are your PDP HMP Debits? (if applicable) *See Attachment 2 of the PDP SWQMP
ACP Information Record ID:
Assessor's Parcel Number(s) [APN(s)]
Project Owner/Address
What are your ACP Pollutant Control Credits? *See Attachment 1 of the ACP SWQMP
What are your ACP HMP Debits? (if applicable) *See Attachment 2 of the ACP SWQMP
Is your ACP in the same watershed as your PDP?
Yes No
Will your ACP project be completed prior to the completion of the PDP?
Yes No
Does your ACP account for all Deficits generated by the PDP?
Yes No (PDP and/or ACP must be
redesigned to account for all deficits generated by the PDP.
What is the difference between your PDP debits and ACP Credits? *(ACP Credits -Total PDP Debits = Total Earned Credits)

PRIORITY DEVELOPMENT PROJECT (PDP) SWQMP 27 of 44
Template Date: March 16, 2016 Preparation Date: June 19, 2017 LUEG:SW PDP SWQMP - Attachments
ATTACHMENT 1
BACKUP FOR PDP POLLUTANT CONTROL BMPS
This is the cover sheet for Attachment 1.
Indicate which Items are Included behind this cover sheet: Attachment Sequence Contents Checklist Attachment 1a Storm Water Pollutant Control
Worksheet Calculations -Worksheet B.3-1 (Required) -Worksheet B.1-1 (Required) -Worksheet B.4-1 (if applicable) -Worksheet B.4-2 (if applicable) -Worksheet B.5-1 (if applicable) -Worksheet B.5-2 (if applicable) -Worksheet B.5-3 (if applicable) -Worksheet B.6-1 (if applicable) -Summary Worksheet (optional)
Included
Attachment 1b Form I-8, Categorization of Infiltration Feasibility Condition (Required unless the project will use harvest and use BMPs) Refer to Appendices C and D of the BMP Design Manual to complete Form I-8.
Included Not included because the entire project will use harvest and use BMPs
Attachment 1c DMA Exhibit (Required) See DMA Exhibit Checklist on the back of this Attachment cover sheet.
Included
Attachment 1d Individual Structural BMP DMA Mapbook (Required) -Place each map on 8.5”x11” paper. -Show at a minimum the DMA, Structural BMP, and any existing hydrologic features within the DMA.
Included

PRIORITY DEVELOPMENT PROJECT (PDP) SWQMP 28 of 44
Template Date: March 16, 2016 Preparation Date: June 19, 2017 LUEG:SW PDP SWQMP - Attachments
Use this checklist to ensure the required information has been included on the DMA Exhibit:
The DMA Exhibit must identify:
Underlying hydrologic soil group Approximate depth to groundwater Existing natural hydrologic features (watercourses, seeps, springs, wetlands) Critical coarse sediment yield areas to be protected Existing topography and impervious areas Existing and proposed site drainage network and connections to drainage offsite Proposed demolition Proposed grading Proposed impervious features Proposed design features and surface treatments used to minimize imperviousness Drainage management area (DMA) boundaries, DMA ID numbers, and DMA areas (square footage or acreage), and DMA type (i.e., drains to BMP, self-retaining, or self-mitigating) Potential pollutant source areas and corresponding required source controls (see Chapter 4, Appendix E.1, and Step 3.5) Structural BMPs (identify location, structural BMP ID#, type of BMP, and size/detail)

DMA Name POC BMP TYPE Soil TypeTotal DMA Area (ft2)
DMA Pervious
Area
DMA Impervious Area % Impervious
Runoff Factor
(TABLE G.2-1)
DMA Area x Runoff Factor
C (runoff factor) d (1) DG Path Type
CDG Path Type D Type C Imp Type D Imp Type C
perviousType D
pervious TOTAL
17,569 1.00 17,569
51,153 0.10 5,115
Area (Acres) 1.58
3,559 1.00 3,559
1,636 0.10 164
Area (Acres) 0.12
1,760 1.00 1,760
927 0.10 93
Area (Acres) 0.06
8,782 1.00 8,782
3,588 0.10 359
Area (Acres) 0.28
29,462 1.00 29,462
16,881 0.10 1,688
Area (Acres) 1.06
244 1.00 244
1,229 0.10 123
Area (Acres) 0.03
859 1.00 859
2,030 0.10 203
Area (Acres) 0.07
28,730 1.00 28,730
16,174 0.10 1,617
Area (Acres) 1.03
29,522 1.00 29,522
18,301 0.10 1,830
Area (Acres) 1.10
39,305 1.00 39,305
26,880 0.10 2,688
Area (Acres) 1.52
11,193 1.00 11,193
2,206 0.10 221
Area (Acres) 0.31
Total Area (Acres) 7.16 1,142 8,128 51,449 119,536 70,558 62,656 313,469
(1) 85th percentile, 24- hr storm event rainfall depth (inches), refer to section B.1.3 of San Diego Model BMP Design Manual(2) Area consists of Mirar De Valle and Old Mirar De Valle improvements, existing impervious area within SWMM model consists of existing pavement
0.75
TREE WELLSD 13,399
84% 0.85 0.75
BIOFILTRATION BASIND 47,823
62% 0.66
D 66,185 59% 0.63 0.75
Onsite-3 POC-1
Old-MDV POC-1
MDV-3 POC-1 BIOFILTRATION BASIN
Onsite-1 POC-1 BIOFILTRATION BASIN
Onsite-2 POC-1
Onsite-4 POC-1 BIOFILTRATION BASIN
BIOFILTRATION BASIN
BIOFILTRATION BASINPOC-1MDV-1 (2)
C 46,343 64% 0.67 0.75
26% 0.33 0.75
C 5,195 69% 0.72 0.75
C 68,722
3,559 1,760 818 732
17,569 51,153
0.75
D 2,687 66% 0.69 0.75
2,383
POC-1MDV-2 BIOFILTRATION BASIN 818 195
68,722
7,882
12,370
47,8161,155
D 1,473 17% 0.25 0.75
324 74 29,462 244 16,557
1,2058,782D 12,370
71% 0.74
C 2,889 30% 0.37 0.75
D 44,904 64% 0.68 0.75
14,894 47,7931,280 859 28,730 2,030
17,021 47,8231,280 29,522
66,185
11,193 3,685 14,878
2,916 39,305 23,964

Category # Description Value Units
0 Design Capture Volume for Entire Project Site 12,656 cubic-feet1 Proposed Development Type Residential unitless2 Number of Residents or Employees at Proposed Development 141 #3 Total Planted Area within Development 30,178 sq-ft4 Water Use Category for Proposed Planted Areas Low unitless5 Is Average Site Design Infiltration Rate ≤0.500 Inches per Hour? Yes yes/no6 Is Average Site Design Infiltration Rate ≤0.010 Inches per Hour? Yes yes/no7 Is Infiltration of the Full DCV Anticipated to Produce Negative Impacts? Yes yes/no8 Is Infiltration of Any Volume Anticipated to Produce Negative Impacts? Yes yes/no9 36-Hour Toilet Use Per Resident or Employee 1.86 cubic-feet10 Subtotal: Anticipated 36 Hour Toilet Use 263 cubic-feet11 Anticipated 1 Acre Landscape Use Over 36 Hours 52.14 cubic-feet12 Subtotal: Anticipated Landscape Use Over 36 Hours 36 cubic-feet13 Total Anticipated Use Over 36 Hours 299 cubic-feet14 Total Anticipated Use / Design Capture Volume 0.02 cubic-feet15 Are Full Capture and Use Techniques Feasible for this Project? No unitless16 Is Full Retention Feasible for this Project? No yes/no17 Is Partial Retention Feasible for this Project? No yes/no
Result 18 Feasibility Category 5 1, 2, 3, 4, 5
Worksheet B.3-1 General Notes:
H. PDPs participating in an offsite alternative compliance program are not held to the feasibility categories presented herein.
Capture & Use Inputs
Automated Worksheet B.3-1: Project-Scale BMP Feasibility Analysis (V1.3)
C. Feasibility Category 1: Applicant must implement capture & use, retention, and/or infiltration elements for the entire DCV.D. Feasibility Category 2: Applicant must implement capture & use elements for the entire DCV.E. Feasibility Category 3: Applicant must implement retention and/or infiltration elements for all DMAs with Design Infiltration Rates greater than 0.50 in/hr.
B. Negative impacts associated with retention may include geotechnical, groundwater, water balance, or other issues identified by a geotechnical engineer and substantiated through completion of Form I-8.
Infiltration Inputs
G. Feasibility Category 5: Applicant must implement standard lined biofiltration BMPs sized at ≥3% of the effective impervious tributary area for all DMAs with Design Infiltration Rates of 0.010 in/hr or less. Applicants may also be permitted to implement reduced size and/or specialized biofiltration BMPs provided additional criteria identified in "Supplemental Retention Criteria for Non-Standard Biofiltration BMPs" are satisfied.
A. Applicants may use this worksheet to determine the types of structural BMPs that are acceptable for implementation at their project site (as required in Section 5 of the BMPDM). User input should be provided for yellow shaded cells, values for all other cells will be automatically generated. Projects demonstrating feasibility or potential feasibility via this worksheet are encouraged to incorporate capture and use features in their project.
F. Feasibility Category 4: Applicant must implement standard unlined biofiltration BMPs sized at ≥3% of the effective impervious tributary area for all DMAs with Design Infiltration Rates of 0.011 to 0.50 in/hr. Applicants may be permitted to implement lined BMPs, reduced size BMPs, and/or specialized biofiltration BMPs provided additional criteria identified in "Supplemental Retention Criteria for Non-Standard Biofiltration BMPs" are satisfied.
Calculations

Category # Description i ii iii iv v vi vii viii ix x Units0 Drainage Basin ID or Name Onsite-1 Onsite-2 Onsite-3 Onsite-4 Old-MDV unitless
1 Basin Drains to the Following BMP Type Biofiltration Biofiltration Biofiltration Biofiltration n/a unitless
2 85th Percentile 24-hr Storm Depth 0.75 0.75 0.75 0.75 1.50 inches3 Design Infiltration Rate Recommended by Geotechnical Engineer in/hr4 Impervious Surfaces Not Directed to Dispersion Area (C=0.90) 47,275 34,908 38,304 39,305 11,193 sq-ft5 Semi-Pervious Surfaces Not Serving as Dispersion Area (C=0.30) 398 2,293 3,663 2,916 sq-ft6 Engineered Pervious Surfaces Not Serving as Dispersion Area (C=0.10) sq-ft7 Natural Type A Soil Not Serving as Dispersion Area (C=0.10) sq-ft8 Natural Type B Soil Not Serving as Dispersion Area (C=0.14) sq-ft9 Natural Type C Soil Not Serving as Dispersion Area (C=0.23) 67,710 2,848 sq-ft10 Natural Type D Soil Not Serving as Dispersion Area (C=0.30) 1,155 15,626 18,226 23,964 3,685 sq-ft11 Does Tributary Incorporate Dispersion, Tree Wells, and/or Rain Barrels? No No No No Yes yes/no12 Impervious Surfaces Directed to Dispersion Area per SD-B (Ci=0.90) sq-ft13 Semi-Pervious Surfaces Serving as Dispersion Area per SD-B (Ci=0.30) sq-ft14 Engineered Pervious Surfaces Serving as Dispersion Area per SD-B (Ci=0.10) sq-ft15 Natural Type A Soil Serving as Dispersion Area per SD-B (Ci=0.10) sq-ft16 Natural Type B Soil Serving as Dispersion Area per SD-B (Ci=0.14) sq-ft17 Natural Type C Soil Serving as Dispersion Area per SD-B (Ci=0.23) sq-ft18 Natural Type D Soil Serving as Dispersion Area per SD-B (Ci=0.30) sq-ft19 Number of Tree Wells Proposed per SD-A 5 #20 Average Mature Tree Canopy Diameter 25 ft21 Number of Rain Barrels Proposed per SD-E #22 Average Rain Barrel Size gal23 Does BMP Overflow to Stormwater Features in Downstream Drainage? No No No No No No No No No No unitless24 Identify Downstream Drainage Basin Providing Treatment in Series unitless25 Percent of Upstream Flows Directed to Downstream Dispersion Areas percent26 Upstream Impervious Surfaces Directed to Dispersion Area (Ci=0.90) 0 0 0 0 0 0 0 0 0 0 cubic-feet27 Upstream Impervious Surfaces Not Directed to Dispersion Area (C=0.90) 0 0 0 0 0 0 0 0 0 0 cubic-feet28 Total Tributary Area 116,538 55,675 60,193 66,185 14,878 0 0 0 0 0 sq-ft29 Initial Runoff Factor for Standard Drainage Areas 0.50 0.67 0.68 0.66 0.75 0.00 0.00 0.00 0.00 0.00 unitless30 Initial Runoff Factor for Dispersed & Dispersion Areas 0.00 0.00 0.00 0.00 0.00 0.00 0.00 0.00 0.00 0.00 unitless31 Initial Weighted Runoff Factor 0.50 0.67 0.68 0.66 0.75 0.00 0.00 0.00 0.00 0.00 unitless32 Initial Design Capture Volume 3,642 2,331 2,558 2,730 1,395 0 0 0 0 0 cubic-feet33 Total Impervious Area Dispersed to Pervious Surface 0 0 0 0 0 0 0 0 0 0 sq-ft34 Total Pervious Dispersion Area 0 0 0 0 0 0 0 0 0 0 sq-ft35 Ratio of Dispersed Impervious Area to Pervious Dispersion Area n/a n/a n/a n/a n/a n/a n/a n/a n/a n/a ratio36 Adjustment Factor for Dispersed & Dispersion Areas 1.00 1.00 1.00 1.00 1.00 1.00 1.00 1.00 1.00 1.00 ratio37 Runoff Factor After Dispersion Techniques 0.50 0.67 0.68 0.66 0.75 n/a n/a n/a n/a n/a unitless38 Design Capture Volume After Dispersion Techniques 3,642 2,331 2,558 2,730 1,395 0 0 0 0 0 cubic-feet39 Total Tree Well Volume Reduction 0 0 0 0 1,450 0 0 0 0 0 cubic-feet40 Total Rain Barrel Volume Reduction 0 0 0 0 0 0 0 0 0 0 cubic-feet41 Final Adjusted Runoff Factor 0.50 0.67 0.68 0.66 0.00 0.00 0.00 0.00 0.00 0.00 unitless42 Final Effective Tributary Area 58,269 37,302 40,931 43,682 0 0 0 0 0 0 sq-ft43 Initial Design Capture Volume Retained by Site Design Elements 0 0 0 0 1,450 0 0 0 0 0 cubic-feet44 Final Design Capture Volume Tributary to BMP 3,642 2,331 2,558 2,730 0 0 0 0 0 0 cubic-feet
Worksheet B.1-1 General Notes:
False
FalseFalse
Automated Worksheet B.1-1: Calculation of Design Capture Volume (V1.3)
A. Applicants may use this worksheet to calculate design capture volumes for up to 10 drainage areas User input must be provided for yellow shaded cells, values for all other cells will be automatically generated, errors/notifications will be highlighted in red and summarized below. Upon completion of this worksheet, proceed to the appropriate BMP Sizing worksheet(s).
Dispersion Area, Tree Well & Rain Barrel
Inputs(Optional)
Standard Drainage Basin
Inputs
Results
Tree & Barrel Adjustments
Initial Runoff Factor
Calculation
Dispersion Area
Adjustments
Treatment Train Inputs &
Calculations
False

Category # Description i ii iii iv v vi vii viii ix x Units0 Drainage Basin ID or Name Onsite-1 Onsite-2 Onsite-3 Onsite-4 - - - - - - sq-ft1 Design Infiltration Rate Recommended by Geotechnical Engineer 0.000 0.000 0.000 0.000 - - - - - - in/hr2 Effective Tributary Area 58,269 37,302 40,931 43,682 - - - - - - sq-ft3 Minimum Biofiltration Footprint Sizing Factor 0.030 0.030 0.030 0.030 - - - - - - ratio4 Design Capture Volume Tributary to BMP 3,642 2,331 2,558 2,730 - - - - - - cubic-feet5 Is Biofiltration Basin Impermeably Lined or Unlined? Lined Lined Lined Lined unitless6 Provided Biofiltration BMP Surface Area 1,750 1,138 1,230 1,312 sq-ft7 Provided Surface Ponding Depth 12 12 12 12 inches8 Provided Soil Media Thickness 18 18 18 18 inches9 Provided Depth of Gravel Above Underdrain Invert 12 12 12 12 inches10 Diameter of Underdrain or Hydromod Orifice (Select Smallest) 1.60 0.60 1.20 0.60 inches11 Provided Depth of Gravel Below the Underdrain 3 3 3 3 inches12 Volume Infiltrated Over 6 Hour Storm 0 0 0 0 0 0 0 0 0 0 cubic-feet13 Soil Media Pore Space Available for Retention 0.05 0.05 0.05 0.05 0.05 0.05 0.05 0.05 0.05 0.05 unitless14 Gravel Pore Space Available for Retention 0.00 0.00 0.00 0.00 0.00 0.00 0.00 0.00 0.00 0.00 unitless15 Effective Retention Depth 0.90 0.90 0.90 0.90 0.00 0.00 0.00 0.00 0.00 0.00 inches16 Calculated Retention Storage Drawdown (Including 6 Hr Storm) 120 120 120 120 0 0 0 0 0 0 hours17 Volume Retained by BMP 131 85 92 98 0 0 0 0 0 0 cubic-feet18 Fraction of DCV Retained 0.04 0.04 0.04 0.04 0.00 0.00 0.00 0.00 0.00 0.00 ratio19 Portion of Retention Performance Standard Satisfied 0.05 0.05 0.05 0.05 0.00 0.00 0.00 0.00 0.00 0.00 ratio20 Fraction of DCV Retained (normalized to 36-hr drawdown) 0.02 0.02 0.02 0.02 0.00 0.00 0.00 0.00 0.00 0.00 ratio21 Design Capture Volume Remaining for Biofiltration 3,569 2,284 2,507 2,675 0 0 0 0 0 0 cubic-feet22 Max Hydromod Flow Rate through Underdrain 0.1246 0.0176 0.0702 0.0176 n/a n/a n/a n/a n/a n/a CFS23 Max Soil Filtration Rate Allowed by Underdrain Orifice 3.08 0.67 2.47 0.58 n/a n/a n/a n/a n/a n/a in/hr24 Soil Media Filtration Rate per Specifications 5.00 5.00 5.00 5.00 5.00 5.00 5.00 5.00 5.00 5.00 in/hr25 Soil Media Filtration Rate to be used for Sizing 3.08 0.67 2.47 0.58 5.00 5.00 5.00 5.00 5.00 5.00 in/hr26 Depth Biofiltered Over 6 Hour Storm 18.45 4.01 14.80 3.48 30.00 30.00 30.00 30.00 30.00 30.00 inches27 Soil Media Pore Space Available for Biofiltration 0.20 0.20 0.20 0.20 0.20 0.20 0.20 0.20 0.20 0.20 unitless28 Effective Depth of Biofiltration Storage 20.40 20.40 20.40 20.40 0.00 0.00 0.00 0.00 0.00 0.00 inches29 Drawdown Time for Surface Ponding 4 18 5 21 0 0 0 0 0 0 hours30 Drawdown Time for Effective Biofiltration Depth 7 30 8 35 0 0 0 0 0 0 hours31 Total Depth Biofiltered 38.85 24.41 35.20 23.88 30.00 30.00 30.00 30.00 30.00 30.00 inches32 Option 1 - Biofilter 1.50 DCV: Target Volume 5,354 3,426 3,761 4,013 0 0 0 0 0 0 cubic-feet33 Option 1 - Provided Biofiltration Volume 5,354 2,315 3,608 2,611 0 0 0 0 0 0 cubic-feet34 Option 2 - Store 0.75 DCV: Target Volume 2,677 1,713 1,880 2,006 0 0 0 0 0 0 cubic-feet35 Option 2 - Provided Storage Volume 2,677 1,713 1,880 2,006 0 0 0 0 0 0 cubic-feet36 Portion of Biofiltration Performance Standard Satisfied 1.00 1.00 1.00 1.00 0.00 0.00 0.00 0.00 0.00 0.00 ratio37 Do Site Design Elements and BMPs Satisfy Annual Retention Requirements? Yes Yes Yes Yes - - - - - - yes/no38 Overall Portion of Performance Standard Satisfied 1.00 1.00 1.00 1.00 0.00 0.00 0.00 0.00 0.00 0.00 ratio39 This BMP Overflows to the Following Drainage Basin - - - - - - - - - - unitless40 Deficit of Effectively Treated Stormwater 0 0 0 0 n/a n/a n/a n/a n/a n/a cubic-feet
Worksheet B.5-1 General Notes:
False
Retention Calculations
Automated Worksheet B.5-1: Sizing Lined or Unlined Biofiltration BMPs (V1.3)
False
BMP Inputs
False
Biofiltration Calculations
A. Applicants may use this worksheet to size Lined or Unlined Biofiltration BMPs (BF-1, PR-1) for up to 10 basins. User input must be provided for yellow shaded cells, values for blue cells are automatically populated based on user inputs from previous worksheets, values for all other cells will be automatically generated, errors/notifications will be highlighted in red/orange and summarized below. BMPs fully satisfying the pollutant control performance standards will have a deficit treated volume of zero and be highlighted in green.
False
False
False
False
Result
False
False

Category # Description i ii iii iv v vi vii viii ix x Units
0 Drainage Basin ID or Name Onsite-1 Onsite-2 Onsite-3 Onsite-4 Old-MDV - - - - - unitless
1 85th Percentile Storm Depth 0.75 0.75 0.75 0.75 1.50 - - - - - inches
2 Design Infiltration Rate Recommended by Geotechnical Engineer 0.000 0.000 0.000 0.000 0.000 - - - - - in/hr
3 Total Tributary Area 116,538 55,675 60,193 66,185 14,878 - - - - - sq-ft
4 85th Percentile Storm Volume (Rainfall Volume) 7,284 3,480 3,762 4,137 1,860 - - - - - cubic-feet
5 Initial Weighted Runoff Factor 0.50 0.67 0.68 0.66 0.75 - - - - - unitless
6 Initial Design Capture Volume 3,642 2,331 2,558 2,730 1,395 - - - - - cubic-feet
7 Dispersion Area Reductions 0 0 0 0 0 - - - - - cubic-feet
8 Tree Well and Rain Barrel Reductions 0 0 0 0 1,450 - - - - - cubic-feet
9 Effective Area Tributary to BMP 58,269 37,302 40,931 43,682 0 - - - - - square feet
10 Final Design Capture Volume Tributary to BMP 3,642 2,331 2,558 2,730 0 - - - - - cubic-feet
11 Basin Drains to the Following BMP Type Biofiltration Biofiltration Biofiltration Biofiltration n/a - - - - - unitless
12 Volume Retained by BMP(normalized to 36 hour drawdown) 73 47 51 55 0 - - - - - cubic-feet
13 Total Fraction of Initial DCV Retained within DMA 0.02 0.02 0.02 0.02 1.04 - - - - - fraction
14 Percent of Average Annual Runoff Retention Provided 3.0% 3.0% 3.0% 3.0% 81.5% - - - - - %
15 Percent of Average Annual Runoff Retention Required 1.5% 1.5% 1.5% 1.5% 1.5% - - - - - %
Performance Standard
16 Percent of Pollution Control Standard Satisfied 100.0% 100.0% 100.0% 100.0% 100.0% - - - - - %
17 Discharges to Secondary Treatment in Drainage Basin - - - - - - - - - - unitless
18 Impervious Surface Area Still Requiring Treatment 0 0 0 0 0 - - - - - square feet
19 Impervious Surfaces Directed to Downstream Dispersion Area - - - - - - - - - - square feet
20 Impervious Surfaces Not Directed to Downstream Dispersion Area - - - - - - - - - - square feet
Result 21 Deficit of Effectively Treated Stormwater 0 0 0 0 0 - - - - - cubic-feet
Total Volume Reductions
-Congratulations, all specified drainage basins and BMPs are in compliance with stormwater pollutant control requirements. Include 11x17 color prints of this summary sheet and supporting worksheet calculations as part of the SWQMP submittal package.
Summary of Stormwater Pollutant Control Calculations (V1.3)
Initial DCV
Site Design Volume
Reductions
General Info
BMP Volume Reductions
Treatment Train
False
All fields in this summary worksheet are populated based on previous user inputs. If applicable, drainage basin elements that require revisions and/or supplemental information outside the scope of these worksheets are highlighted in orange and summairzed in the red text below. If all drainage basins achieve full compliance without a need for supplemental information, a green message will appear below.
Summary Notes:
FalseFalseFalseFalse
False

Canopy Diameter Area Ft3 Soil Per Canopy ft Ft3 required Depth (ft) Width (ft) Length (ft) Ft3 provided Trees Req (1)
5 19.63 2 39.25 4 14 1 56 13510 78.50 2 157 4 14 3 168 3415 176.63 2 353.25 4 14 6.5 364 1420 314.00 2 628 4 14 11.5 644 825 490.63 2 981.25 4 14 18 1008 530 706.50 2 1413 4 14 25.25 1414 4
Street Trees Calculations
(1) Trees required per Worksheet B.1-1

Appendix I: Forms and Checklists
I-3 February 26, 2016
Categorization of Infiltration Feasibility Condition Form I-8
Part 1 - Full Infiltration Feasibility Screening Criteria
Would infiltration of the full design volume be feasible from a physical perspective without any undesirable consequences that cannot be reasonably mitigated?
Note that it is not necessary to investigate each and every criterion in the worksheet if infiltration is precluded. Instead a letter of justification from a geotechnical professional familiar with the local conditions substantiating any geotechnical issues will be required.
Criteria Screening Question Yes No
1Is the estimated reliable infiltration rate below proposed facility locations greater than 0.5 inches per hour? The response to this Screening Question must be based on a comprehensive evaluation of the factors presented in Appendix C.2 and Appendix D.
Provide basis:
Summarize findings of studies; provide reference to studies, calculations, maps, data sources, etc. Provide narrative discussion of study/data source applicability.
2
Can infiltration greater than 0.5 inches per hour be allowed without increasing risk of geotechnical hazards (slope stability, groundwater mounding, utilities, or other factors) that cannot be mitigated to an acceptable level? The response to this Screening Question must be based on a comprehensive evaluation of the factors presented in Appendix C.2.
Provide basis:
Summarize findings of studies; provide reference to studies, calculations, maps, data sources, etc. Provide narrative discussion of study/data source applicability.
x
x
The site is situated within hydrologic soil group "C" which is has low infiltration rates.
The biofiltration basins are bound by retaining walls and 2:1 slopes retaining Mirar De Valleparkway and residential pads. A 6' CMU soundwall will be constructed at the PL of theresidential lots. The structural integrity of the walls and slope will be undermined byproposing infiltration as the existing soils are type C and D which provide low infiltration rates.

Appendix I: Forms and Checklists
I-4 February 26, 2016
Form I-8 Page 2 of 4 Criteria Screening Question Yes No
3
Can infiltration greater than 0.5 inches per hour be allowed without increasing risk of groundwater contamination (shallow water table, storm water pollutants or other factors) that cannot be mitigated to an acceptable level? The response to this Screening Question must be based on a comprehensive evaluation of the factors presented in Appendix C.3.
Provide basis:
Summarize findings of studies; provide reference to studies, calculations, maps, data sources, etc. Provide narrative discussion of study/data source applicability.
4
Can infiltration greater than 0.5 inches per hour be allowed without causing potential water balance issues such as change of seasonality of ephemeral streams or increased discharge of contaminated groundwater to surface waters? The response to this Screening Question must be based on a comprehensive evaluation of the factors presented in Appendix C.3.
Provide basis:
Summarize findings of studies; provide reference to studies, calculations, maps, data sources, etc. Provide narrative discussion of study/data source applicability.
Part 1 Result*
If all answers to rows 1 - 4 are “Yes” a full infiltration design is potentially feasible. The feasibility screening category is Full Infiltration
If any answer from row 1-4 is “No”, infiltration may be possible to some extent but would not generally be feasible or desirable to achieve a “full infiltration” design. Proceed to Part 2
*To be completed using gathered site information and best professional judgment considering the definition of MEP inthe MS4 Permit. Additional testing and/or studies may be required by Agency/Jurisdictions to substantiate findings
x
x
The biofiltration basins are bound by retaining walls and 2:1 slopes retaining Mirar De Valleparkway and residential pads. A 6' CMU soundwall will be constructed at the PL of theresidential lots. The structural integrity of the walls and slope will be undermined byproposing infiltration as the existing soils are type C and D which provide low infiltration rates.
The biofiltration basins are bound by retaining walls and 2:1 slopes retaining Mirar De Valleparkway and residential pads. A 6' CMU soundwall will be constructed at the PL of theresidential lots. The structural integrity of the walls and slope will be undermined byproposing infiltration as the existing soils are type C and D which provide low infiltration rates.

Appendix I: Forms and Checklists
I-5 February 26, 2016
Form I-8 Page 3 of 4
Part 2 – Partial Infiltration vs. No Infiltration Feasibility Screening Criteria
Would infiltration of water in any appreciable amount be physically feasible without any negative consequences that cannot be reasonably mitigated?
Criteria Screening Question Yes No
5
Do soil and geologic conditions allow for infiltration in any appreciable rate or volume? The response to this Screening Question must be based on a comprehensive evaluation of the factors presented in Appendix C.2 and Appendix D.
Provide basis:
Summarize findings of studies; provide reference to studies, calculations, maps, data sources, etc. Provide narrative discussion of study/data source applicability and why it was not feasible to mitigate low infiltration rates.
6
Can Infiltration in any appreciable quantity be allowed without increasing risk of geotechnical hazards (slope stability, groundwater mounding, utilities, or other factors) that cannot be mitigated to an acceptable level? The response to this Screening Question must be based on a comprehensive evaluation of the factors presented in Appendix C.2.
Provide basis:
Summarize findings of studies; provide reference to studies, calculations, maps, data sources, etc. Provide narrative discussion of study/data source applicability and why it was not feasible to mitigate low infiltration rates.
x
x
The biofiltration basins are bound by retaining walls and 2:1 slopes retaining Mirar De Valleparkway and residential pads. A 6' CMU soundwall will be constructed at the PL of theresidential lots. The structural integrity of the walls and slope will be undermined byproposing infiltration as the existing soils are type C and D which provide low infiltration rates.
The biofiltration basins are bound by retaining walls and 2:1 slopes retaining Mirar De Valleparkway and residential pads. A 6' CMU soundwall will be constructed at the PL of theresidential lots. The structural integrity of the walls and slope will be undermined byproposing infiltration as the existing soils are type C and D which provide low infiltration rates.

Appendix I: Forms and Checklists
I-6 February 26, 2016
Form I-8 Page 4 of 4
Criteria Screening Question Yes No
7
Can Infiltration in any appreciable quantity be allowed without posing significant risk for groundwater related concerns (shallow water table, storm water pollutants or other factors)? The response to this Screening Question must be based on a comprehensive evaluation of the factors presented in Appendix C.3.
Provide basis:
Summarize findings of studies; provide reference to studies, calculations, maps, data sources, etc. Provide narrative discussion of study/data source applicability and why it was not feasible to mitigate low infiltration rates.
8 Can infiltration be allowed without violating downstream water rights? The response to this Screening Question must be based on a comprehensive evaluation of the factors presented in Appendix C.3.
Provide basis:
Summarize findings of studies; provide reference to studies, calculations, maps, data sources, etc. Provide narrative discussion of study/data source applicability and why it was not feasible to mitigate low infiltration rates.
Part 2 Result*
If all answers from row 1-4 are yes then partial infiltration design is potentially feasible. The feasibility screening category is Partial Infiltration.
If any answer from row 5-8 is no, then infiltration of any volume is considered to be infeasible within the drainage area. The feasibility screening category is No Infiltration.
*To be completed using gathered site information and best professional judgment considering the definition of MEP in the MS4 Permit. Additional testing and/or studies may be required by Agency/Jurisdictions to substantiate findings
noinfiltration
x
x
There are no known downstream water rights issues.
Based on the geotechnical investigation, groundwater was not encountered based on thesubsurface explorations.

Appendix B: Storm Water Pollutant Control Hydrologic Calculations and Sizing Methods
B-5 February 2016
Figure B.1-1: 85th Percentile 24-hour Isopluvial Map
SITE

OLD MIRAR DE VALLESECTION F-F
ONSITE-2
MDV-1 MDV-3
LID-OMDV(5-25' TREE CANOPYTREE WELLS)
ONSITE-3 ONSITE-4
MDV-2
LEGEND
*BIOFILTRATION BASIN ADJACENTADJACENT TO ALLEY
MIRAR DEVALLE
*BIOFILTRATION BASIN ADJACENTTO RESIDENTIAL PAD
MIRAR DEVALLE
TABLE A
BIOFILTRATION BASIN ORIFICE LOCATIONS
2DMA EXHIBIT FOR SHADY OAK
1
NOTES
BIOFILTRATION BASIN PLAN AND SECTION VIEW

22DMA EXHIBIT FOR SHADY OAK

33° 12' 40'' N11
7° 2
' 15'
' W33° 12' 40'' N
117°
2' 6
'' W
33° 12' 35'' N
117°
2' 1
5'' W
33° 12' 35'' N
117°
2' 6
'' W
N
Map projection: Web Mercator Corner coordinates: WGS84 Edge tics: UTM Zone 11N WGS84
Feet
MetersMap Scale: 1:1,040 if printed on A landscape (11" x 8.5") sheet.
Soil Map may not be valid at this scale.


Appendix E: BMP Design Fact Sheets
E-63 February 2016
E.12 BF-1 Biofiltration
Description
Biofiltration (Bioretention with underdrain) facilities are vegetated surface water systems that filter water through vegetation, and soil or engineered media prior to discharge via underdrain or overflow to the downstream conveyance system. Bioretention with underdrain facilities are commonly incorporated into the site within parking lot landscaping, along roadsides, and in open spaces. Because these types of facilities have limited or no infiltration, they are typically designed to provide enough hydraulic head to move flows through the underdrain connection to the storm drain system. Treatment is achieved through filtration, sedimentation, sorption, biochemical processes and plant uptake.
Typical bioretention with underdrain components include:
Inflow distribution mechanisms (e.g, perimeter flow spreader or filter strips) Energy dissipation mechanism for concentrated inflows (e.g., splash blocks or riprap) Shallow surface ponding for captured flows Side slope and basin bottom vegetation selected based on expected climate and ponding depth Non-floating mulch layer (Optional) Media layer (planting mix or engineered media) capable of supporting vegetation growth Filter course layer consisting of aggregate to prevent the migration of fines into uncompacted native soils or the aggregate storage layer Aggregate storage layer with underdrain(s) Impermeable liner or uncompacted native soils at the bottom of the facility
MS4 Permit Category Biofiltration Manual Category Biofiltration Applicable Performance Standard Pollutant Control Flow Control Primary Benefits Treatment Volume Reduction (Incidental) Peak Flow Attenuation (Optional)

Appendix E: BMP Design Fact Sheets
E-64 February 2016
Overflow structure
Typical plan and Section view of a Biofiltration BMP

Appendix E: BMP Design Fact Sheets
E-65 February 2016
Design Adaptations for Project Goals
Biofiltration Treatment BMP for storm water pollutant control. The system is lined or un-lined to provide incidental infiltration, and an underdrain is provided at the bottom to carry away filtered runoff. This configuration is considered to provide biofiltration treatment via flow through the media layer. Storage provided above the underdrain within surface ponding, media, and aggregate storage is considered included in the biofiltration treatment volume. Saturated storage within the aggregate storage layer can be added to this design by raising the underdrain above the bottom of the aggregate storage layer or via an internal weir structure designed to maintain a specific water level elevation.
Integrated storm water flow control and pollutant control configuration. The system can be designed to provide flow rate and duration control by primarily providing increased surface ponding and/or having a deeper aggregate storage layer above the underdrain. This will allow for significant detention storage, which can be controlled via inclusion of an outlet structure at the downstream end of the underdrain.
Design Criteria and Considerations
Bioretention with underdrain must meet the following design criteria. Deviations from the below criteria may be approved at the discretion of the [City Engineer] if it is determined to be appropriate:
Siting and Design Intent/Rationale Placement observes geotechnical recommendations regarding potential hazards (e.g., slope stability, landslides, liquefaction zones) and setbacks (e.g., slopes, foundations, utilities).
Must not negatively impact existing site geotechnical concerns.
An impermeable liner or other hydraulic restriction layer is included if site constraints indicate that infiltration or lateral flows should not be allowed.
Lining prevents storm water from impacting groundwater and/or sensitive environmental or geotechnical features. Incidental infiltration, when allowable, can aid in pollutant removal and groundwater recharge.
Contributing tributary area shall be ≤ 5 acres (≤ 1 acre preferred).
Bigger BMPs require additional design features for proper performance.
Contributing tributary area greater than 5 acres may be allowed at the discretion of the [City Engineer} if the following conditions are met: 1) incorporate design features (e.g. flow spreaders) to

Appendix E: BMP Design Fact Sheets
E-66 February 2016
Siting and Design Intent/Rationale minimizing short circuiting of flows in the BMP and 2) incorporate additional design features requested by the [City Engineer] for proper performance of the regional BMP.
Finish grade of the facility is ≤ 2%. Flatter surfaces reduce erosion and channelization within the facility.
Surface Ponding
Surface ponding is limited to a 24-hour drawdown time.
Surface ponding limited to 24 hours for plant health. Surface ponding drawdown time greater than 24-hours but less than 96 hours may be allowed at the discretion of the [City Engineer] if certified by a landscape architect or agronomist.
Surface ponding depth is ≥ 6 and ≤ 12 inches.
Surface ponding capacity lowers subsurface storage requirements. Deep surface ponding raises safety concerns.
Surface ponding depth greater than 12 inches (for additional pollutant control or surface outlet structures or flow-control orifices) may be allowed at the discretion of the [City Engineer] if the following conditions are met: 1) surface ponding depth drawdown time is less than 24 hours; and 2) safety issues and fencing requirements are considered (typically ponding greater than 18” will require a fence and/or flatter side slopes) and 3) potential for elevated clogging risk is considered.
A minimum of 12 inches of freeboard is provided.
Freeboard provides room for head over overflow structures and minimizes risk of uncontrolled surface discharge.
Side slopes are stabilized with vegetation and are = 3H:1V or shallower.
Gentler side slopes are safer, less prone to erosion, able to establish vegetation more quickly and easier to maintain.
Vegetation

Appendix E: BMP Design Fact Sheets
E-67 February 2016
Siting and Design Intent/Rationale
Plantings are suitable for the climate and expected ponding depth. A plant list to aid in selection can be found in Appendix E.20.
Plants suited to the climate and ponding depth are more likely to survive.
An irrigation system with a connection to water supply should be provided as needed.
Seasonal irrigation might be needed to keep plants healthy.
Mulch (Optional or Mandatory – Dependent on jurisdiction)
A minimum of 3 inches of well-aged, shredded hardwood mulch that has been stockpiled or stored for at least 12 months is provided.
Mulch will suppress weeds and maintain moisture for plant growth. Aging mulch kills pathogens and weed seeds and allows the beneficial microbes to multiply.
Media Layer
Media maintains a minimum filtration rate of 5 in/hr over lifetime of facility. An initial filtration rate of 8 to 12 in/hr is recommended to allow for clogging over time; the initial filtration rate should not exceed 12 inches per hour.
A filtration rate of at least 5 inches per hour allows soil to drain between events. The initial rate should be higher than long term target rate to account for clogging over time. However an excessively high initial rate can have a negative impact on treatment performance, therefore an upper limit is needed.
Media is a minimum 18 inches deep, meeting either of these two media specifications:
City of San Diego Storm Water Standards Appendix F (February 2016, unless superseded by more recent edition) or County of San Diego Low Impact Development Handbook: Appendix G -Bioretention Soil Specification (June 2014, unless superseded by more recent edition).
Alternatively, for proprietary designs and custom media mixes not meeting the media specifications contained in the 2016 City Storm Water Standards or County LID Manual, the media meets the pollutant treatment performance criteria in Section F.1.
A deep media layer provides additional filtration and supports plants with deeper roots.
Standard specifications shall be followed.
For non-standard or proprietary designs, compliance with F.1 ensures that adequate treatment performance will be provided.
Media surface area is 3% of contributing area times adjusted runoff factor or greater. Unless
Greater surface area to tributary area ratios: a) maximizes volume retention as

Appendix E: BMP Design Fact Sheets
E-68 February 2016
Siting and Design Intent/Rationale demonstrated that the BMP surface area can be smaller than 3%.
required by the MS4 Permit and b) decrease loading rates per square foot and therefore increase longevity.
Adjusted runoff factor is to account for site design BMPs implemented upstream of the BMP (such as rain barrels, impervious area dispersion, etc.). Refer to Appendix B.2 guidance.
Use Worksheet B.5-1 Line 26 to estimate the minimum surface area required per this criteria.
Where receiving waters are impaired or have a TMDL for nutrients, the system is designed with nutrient sensitive media design (see fact sheet BF-2).
Potential for pollutant export is partly a function of media composition; media design must minimize potential for export of nutrients, particularly where receiving waters are impaired for nutrients.
Filter Course Layer
A filter course is used to prevent migration of fines through layers of the facility. Filter fabric is not used.
Migration of media can cause clogging of the aggregate storage layer void spaces or subgrade. Filter fabric is more likely to clog.
Filter course is washed and free of fines. Washing aggregate will help eliminate fines that could clog the facility and impede infiltration.
Filter course calculations assessing suitability for particle migration prevention have been completed.
Gradation relationship between layers can evaluate factors (e.g., bridging, permeability, and uniformity) to determine if particle sizing is appropriate or if an intermediate layer is needed.
Aggregate Storage Layer Class 2 Permeable per Caltrans specification 68-1.025 is recommended for the storage layer. Washed, open-graded crushed rock may be used, however a 4-6 inch washed pea gravel filter course layer at the top of the crushed rock is required.
Washing aggregate will help eliminate fines that could clog the aggregate storage layer void spaces or subgrade.

Appendix E: BMP Design Fact Sheets
E-69 February 2016
Siting and Design Intent/Rationale The depth of aggregate provided (12-inch typical) and storage layer configuration is adequate for providing conveyance for underdrain flows to the outlet structure.
Proper storage layer configuration and underdrain placement will minimize facility drawdown time.
Inflow, Underdrain, and Outflow Structures
Inflow, underdrains and outflow structures are accessible for inspection and maintenance.
Maintenance will prevent clogging and ensure proper operation of the flow control structures.
Inflow velocities are limited to 3 ft/s or less or use energy dissipation methods. (e.g., riprap, level spreader) for concentrated inflows.
High inflow velocities can cause erosion, scour and/or channeling.
Curb cut inlets are at least 12 inches wide, have a 4-6 inch reveal (drop) and an apron and energy dissipation as needed.
Inlets must not restrict flow and apron prevents blockage from vegetation as it grows in. Energy dissipation prevents erosion.
Underdrain outlet elevation should be a minimum of 3 inches above the bottom elevation of the aggregate storage layer.
A minimal separation from subgrade or the liner lessens the risk of fines entering the underdrain and can improve hydraulic performance by allowing perforations to remain unblocked.
Minimum underdrain diameter is 6 inches. Smaller diameter underdrains are prone to clogging.
Underdrains are made of slotted, PVC pipe conforming to ASTM D 3034 or equivalent or corrugated, HDPE pipe conforming to AASHTO 252M or equivalent.
Slotted underdrains provide greater intake capacity, clog resistant drainage, and reduced entrance velocity into the pipe, thereby reducing the chances of solids migration.
An underdrain cleanout with a minimum 6-inch diameter and lockable cap is placed every 250 to 300 feet as required based on underdrain length.
Properly spaced cleanouts will facilitate underdrain maintenance.
Overflow is safely conveyed to a downstream storm drain system or discharge point Size overflow structure to pass 100-year peak flow for on-line infiltration basins and water quality peak flow for off-line basins.
Planning for overflow lessens the risk of property damage due to flooding.

Appendix E: BMP Design Fact Sheets
E-70 February 2016
Conceptual Design and Sizing Approach for Storm Water Pollutant Control Only
To design bioretention with underdrain for storm water pollutant control only (no flow control required), the following steps should be taken:
1. Verify that siting and design criteria have been met, including placement requirements, contributing tributary area, maximum side and finish grade slopes, and the recommended media surface area tributary ratio.
2. Calculate the DCV per Appendix B based on expected site design runoff for tributary areas.
3. Use the sizing worksheet presented in Appendix B.5 to size biofiltration BMPs.
Conceptual Design and Sizing Approach when Storm Water Flow Control is Applicable
Control of flow rates and/or durations will typically require significant surface ponding and/or aggregate storage volumes, and therefore the following steps should be taken prior to determination of storm water pollutant control design. Pre-development and allowable post-project flow rates and durations should be determined as discussed in Chapter 6 of the manual.
1. Verify that siting and design criteria have been met, including placement requirements, contributing tributary area, maximum side and finish grade slopes, and the recommended media surface area tributary ratio.
2. Iteratively determine the facility footprint area, surface ponding and/or aggregate storage layer depth required to provide detention storage to reduce flow rates and durations to allowable limits. Flow rates and durations can be controlled from detention storage by altering outlet structure orifice size(s) and/or water control levels. Multi-level orifices can be used within an outlet structure to control the full range of flows.
3. If bioretention with underdrain cannot fully provide the flow rate and duration control required by this manual, an upstream or downstream structure with significant storage volume such as an underground vault can be used to provide remaining controls.
4. After bioretention with underdrain has been designed to meet flow control requirements, calculations must be completed to verify if storm water pollutant control requirements to treat the DCV have been met.

Appendix E: BMP Design Fact Sheets
E-71 February 2016
E.13 BF-2 Nutrient Sensitive Media Design Some studies of bioretention with underdrains have observed export of nutrients, particularly inorganic nitrogen (nitrate and nitrite) and dissolved phosphorus. This has been observed to be a short-lived phenomenon in some studies or a long term issue in some studies. The composition of the soil media, including the chemistry of individual elements is believed to be an important factor in the potential for nutrient export. Organic amendments, often compost, have been identified as the most likely source of nutrient export. The quality and stability of organic amendments can vary widely. The biofiltration media specifications contained in the County of San Diego Low Impact Development Handbook: Appendix G -Bioretention Soil Specification (June 2014, unless superseded by more recent edition) and the City of San Diego Low Impact Development Design Manual (page B-18) (July 2011, unless superseded by more recent edition) were developed with consideration of the potential for nutrient export. These specifications include criteria for individual component characteristics and quality in order to control the overall quality of the blended mixes. As of the publication of this manual, the June 2014 County of San Diego specifications provide more detail regarding mix design and quality control. The City and County specifications noted above were developed for general purposes to meet permeability and treatment goals. In cases where the BMP discharges to receiving waters with nutrient impairments or nutrient TMDLs, the biofiltration media should be designed with the specific goal of minimizing the potential for export of nutrients from the media. Therefore, in addition to adhering to the City or County media specifications, the following guidelines should be followed:
1. Select plant palette to minimize plant nutrient needs
A landscape architect or agronomist should be consulted to select a plant palette that minimizes nutrient needs. Utilizing plants with low nutrient needs results in less need to enrich the biofiltration soil mix. If nutrient quantity is then tailored to plants with lower nutrient needs, these plants will generally have less competition from weeds, which typically need higher nutrient content. The following practices are recommended to minimize nutrient needs of the plant palette:
Utilize native, drought-tolerant plants and grasses where possible. Native plants generally have a broader tolerance for nutrient content, and can be longer lived in leaner/lower nutrient soils.
Start plants from smaller starts or seed. Younger plants are generally more tolerant of lower nutrient levels and tend to help develop soil structure as they grow. Given the lower cost of smaller plants, the project should be able to accept a plant mortality rate that is somewhat higher than starting from larger plants and providing high organic content.
2. Minimize excess nutrients in media mix

Appendix E: BMP Design Fact Sheets
E-72 February 2016
Once the low-nutrient plant palette is established (item 1), the landscape architect and/or agronomist should be consulted to assist in the design of a biofiltration media to balance the interests of plant establishment, water retention capacity (irrigation demand), and the potential for nutrient export. The following guidelines should be followed:
The mix should not exceed the nutrient needs of plants. In conventional landscape design, the nutrient needs of plants are often exceeded intentionally in order to provide a factor of safety for plant survival. This practice must be avoided in biofiltration media as excess nutrients will increase the chance of export. The mix designer should keep in mind that nutrients can be added later (through mulching, tilling of amendments into the surface), but it is not possible to remove nutrients, once added.
The actual nutrient content and organic content of the selected organic amendment source should be determined when specifying mix proportions. Nutrient content (i.e., C:N ratio; plant extractable nutrients) and organic content (i.e, % organic material) are relatively inexpensive to measure via standard agronomic methods and can provide important information about mix design. If mix design relies on approximate assumption about nutrient/organic content and this is not confirmed with testing (or the results of prior representative testing), it is possible that the mix could contain much more nutrient than intended.
Nutrients are better retained in soils with higher cation exchange capacity. Cation exchange capacity can be increased through selection of organic material with naturally high cation exchange capacity, such as peat or coconut coir pith, and/or selection of inorganic material with high cation exchange capacity such as some sands or engineered minerals (e.g., low P-index sands, zeolites, rhyolites, etc). Including higher cation exchange capacity materials would tend to reduce the net export of nutrients. Natural silty materials also provide cation exchange capacity; however potential impacts to permeability need to be considered.
Focus on soil structure as well as nutrient content. Soil structure is loosely defined as the ability of the soil to conduct and store water and nutrients as well as the degree of aeration of the soil. Soil structure can be more important than nutrient content in plant survival and biologic health of the system. If a good soil structure can be created with very low amounts of organic amendment, plants survivability should still be provided. While soil structure generally develops with time, biofiltration media can be designed to promote earlier development of soil structure. Soil structure is enhanced by the use of amendments with high humus content (as found in well-aged organic material). In addition, soil structure can be enhanced through the use of organic material with a distribution of particle sizes (i.e., a more heterogeneous mix).
Consider alternatives to compost. Compost, by nature, is a material that is continually evolving and decaying. It can be challenging to determine whether tests previously done on a given compost stock are still representative. It can also be challenging to determine how the

Appendix E: BMP Design Fact Sheets
E-73 February 2016
properties of the compost will change once placed in the media bed. More stable materials such as aged coco coir pith, peat, biochar, shredded bark, and/or other amendments should be considered.
With these considerations, it is anticipated that less than 10 percent organic amendment by volume could be used, while still balancing plant survivability and water retention. If compost is used, designers should strongly consider utilizing less than 10 percent by volume.
3. Design with partial retention and/or internal water storage
An internal water storage zone, as described in Fact Sheet PR-1 is believed to improve retention of nutrients. For lined systems, an internal water storage zone worked by providing a zone that fluctuates between aerobic and anaerobic conditions, resulting in nitrification/denitrification. In soils that will allow infiltration, a partial retention design (PR-1) allows significant volume reduction and can also promote nitrification/denitrification. Acknowledgment: This fact sheet has been adapted from the Orange County Technical Guidance Document (May 2011). It was originally developed based on input from: Deborah Deets, City of Los Angeles Bureau of Sanitation, Drew Ready, Center for Watershed Health, Rick Fisher, ASLA, City of Los Angeles Bureau of Engineering, Dr. Garn Wallace, Wallace Laboratories, Glen Dake, GDML, and Jason Schmidt, Tree People. The guidance provided herein does not reflect the individual opinions of any individual listed above and should not be cited or otherwise attributed to those listed.

PRIORITY DEVELOPMENT PROJECT (PDP) SWQMP 29 of 44
Template Date: March 16, 2016 Preparation Date: June 19, 2017 LUEG:SW PDP SWQMP - Attachments
ATTACHMENT 2
BACKUP FOR PDP HYDROMODIFICATION CONTROL MEASURES
This is the cover sheet for Attachment 2.
Mark this box if this attachment is empty because the project is exempt from PDP hydromodification management requirements.
Indicate which Items are Included behind this cover sheet:
Attachment Sequence Contents Checklist Attachment 2a Flow Control Facility Design, including
Structural BMP Drawdown Calculations and Overflow Design Summary (Required) See Chapter 6 and Appendix G of the BMP Design Manual
Included Submitted as separate stand-alone document
Attachment 2b Hydromodification Management Exhibit (Required)
Included See Hydromodification Management Exhibit Checklist on the back of this Attachment cover sheet.
Attachment 2c Management of Critical Coarse Sediment Yield Areas See Section 6.2 and Appendix H of the BMP Design Manual.
Exhibit depicting onsite and/or upstream sources of critical coarse sediment as mapped by Regional or Jurisdictional approaches outlined in Appendix H.1 AND, Demonstration that the project effectively avoids and bypasses sources of mapped critical coarse sediment per approaches outlined in Appendix H.2 and H.3. OR, Demonstration that project does not generate a net impact on the receiving water per approaches outlined in Appendix H.4.
Attachment 2d Geomorphic Assessment of Receiving Channels (Optional) See Section 6.3.4 of the BMP Design Manual.
Not performed Included Submitted as separate stand-alone document
Attachment 2e Vector Control Plan (Required when structural BMPs will not drain in 96 hours)
Included Not required because BMPs will drain in less than 96 hours

PRIORITY DEVELOPMENT PROJECT (PDP) SWQMP 30 of 44
Template Date: March 16, 2016 Preparation Date: June 19, 2017 LUEG:SW PDP SWQMP - Attachments
Use this checklist to ensure the required information has been included on the Hydromodification Management Exhibit:
The Hydromodification Management Exhibit must identify:
Underlying hydrologic soil group Approximate depth to groundwater Existing natural hydrologic features (watercourses, seeps, springs, wetlands) Critical coarse sediment yield areas to be protected Existing topography Existing and proposed site drainage network and connections to drainage offsite Proposed grading Proposed impervious features Proposed design features and surface treatments used to minimize imperviousness Point(s) of Compliance (POC) for Hydromodification Management Existing and proposed drainage boundary and drainage area to each POC (when necessary, create separate exhibits for pre-development and post-project conditions)
Structural BMPs for hydromodification management (identify location, type of BMP, and size/detail)

PR
IVAT
E
VALL
EY
CE
NTE
R
CY
PR
ES
S R
IDG
E
MIRAR DE VALLE
CHARLAN
BANBURY
BE
RR
Y R
UN
SUG
AR BU
SH
PRIVATE
PR
IVAT
E
PRIVATE
PRIVATE
PR
IVAT
E
PRIVATE
BE
RR
Y R
UN
Source: Esri, DigitalGlobe, GeoEye, Earthstar Geographics, CNES/Airbus DS, USDA, USGS, AEX, Getmapping, Aerogrid, IGN, IGP, swisstopo, and the GIS UserCommunity
LegendSHADY OAK
Lot Lines
Roads
Coarse Sedimentq Shady Oak Offsite Coarse Sediment

SWMM Model Inputs

Appendix G: Guidance for Continuous Simulation and Hydromodification Management Sizing Factors
G-5 February 2016
Figure G.1-2: California Irrigation Management Information System "Reference Evapotranspiration Zones"
PROJECT SITE

Appendix G: Guidance for Continuous Simulation and Hydromodification Management Sizing Factors
G-6 June 2015
Table G.1-1: Monthly Average Reference Evapotranspiration by ETo Zone (inches/month and inches/day) for use in SWMM Models for Hydromodification Management Studies in San Diego County
CIMIS Zones 1, 4, 6, 9, and 16 (See CIMIS ETo Zone Map)
January February March April May June July August Septembe
r October Novembe
r December
Zone in/month in/month in/month in/month in/month in/month in/month in/month in/month in/month in/month in/month
1 0.93 1.4 2.48 3.3 4.03 4.5 4.65 4.03 3.3 2.48 1.2 0.62
4 1.86 2.24 3.41 4.5 5.27 5.7 5.89 5.58 4.5 3.41 2.4 1.86
6 1.86 2.24 3.41 4.8 5.58 6.3 6.51 6.2 4.8 3.72 2.4 1.86
9 2.17 2.8 4.03 5.1 5.89 6.6 7.44 6.82 5.7 4.03 2.7 1.86
16 1.55 2.52 4.03 5.7 7.75 8.7 9.3 8.37 6.3 4.34 2.4 1.55
January February March April May June July August Septembe
r October Novembe
r December
Days 31 28 31 30 31 30 31 31 30 31 30 31
Zone in/day in/day in/day in/day in/day in/day in/day in/day in/day in/day in/day in/day
1 0.030 0.050 0.080 0.110 0.130 0.150 0.150 0.130 0.110 0.080 0.040 0.020
4 0.060 0.080 0.110 0.150 0.170 0.190 0.190 0.180 0.150 0.110 0.080 0.060
6 0.060 0.080 0.110 0.160 0.180 0.210 0.210 0.200 0.160 0.120 0.080 0.060
9 0.070 0.100 0.130 0.170 0.190 0.220 0.240 0.220 0.190 0.130 0.090 0.060
16 0.050 0.090 0.130 0.190 0.250 0.290 0.300 0.270 0.210 0.140 0.080 0.050

POC-1
Pre-Project
Post-Project
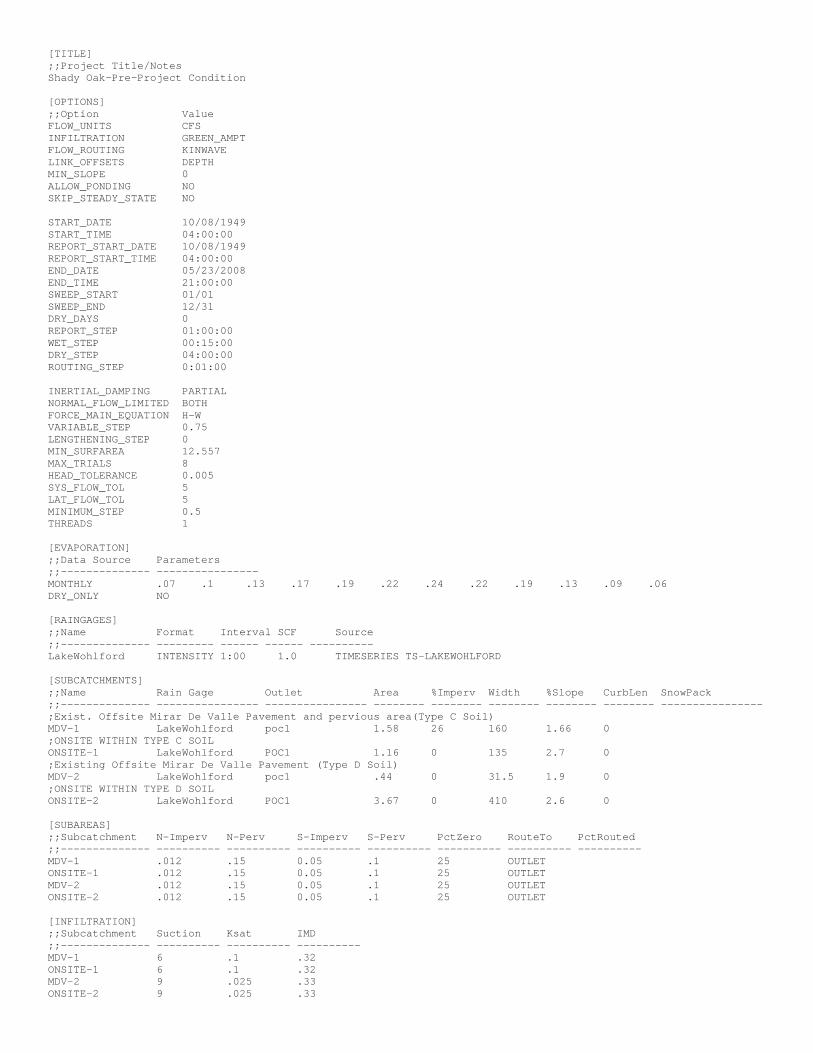
[TITLE] ;;Project Title/Notes Shady Oak-Pre-Project Condition [OPTIONS] ;;Option Value FLOW_UNITS CFS INFILTRATION GREEN_AMPT FLOW_ROUTING KINWAVE LINK_OFFSETS DEPTH MIN_SLOPE 0 ALLOW_PONDING NO SKIP_STEADY_STATE NO START_DATE 10/08/1949 START_TIME 04:00:00 REPORT_START_DATE 10/08/1949 REPORT_START_TIME 04:00:00 END_DATE 05/23/2008 END_TIME 21:00:00 SWEEP_START 01/01 SWEEP_END 12/31 DRY_DAYS 0 REPORT_STEP 01:00:00 WET_STEP 00:15:00 DRY_STEP 04:00:00 ROUTING_STEP 0:01:00 INERTIAL_DAMPING PARTIAL NORMAL_FLOW_LIMITED BOTH FORCE_MAIN_EQUATION H-W VARIABLE_STEP 0.75 LENGTHENING_STEP 0 MIN_SURFAREA 12.557 MAX_TRIALS 8 HEAD_TOLERANCE 0.005 SYS_FLOW_TOL 5 LAT_FLOW_TOL 5 MINIMUM_STEP 0.5 THREADS 1 [EVAPORATION] ;;Data Source Parameters ;;-------------- ---------------- MONTHLY .07 .1 .13 .17 .19 .22 .24 .22 .19 .13 .09 .06 DRY_ONLY NO [RAINGAGES] ;;Name Format Interval SCF Source ;;-------------- --------- ------ ------ ---------- LakeWohlford INTENSITY 1:00 1.0 TIMESERIES TS-LAKEWOHLFORD [SUBCATCHMENTS] ;;Name Rain Gage Outlet Area %Imperv Width %Slope CurbLen SnowPack ;;-------------- ---------------- ---------------- -------- -------- -------- -------- -------- ---------------- ;Exist. Offsite Mirar De Valle Pavement and pervious area(Type C Soil) MDV-1 LakeWohlford poc1 1.58 26 160 1.66 0 ;ONSITE WITHIN TYPE C SOIL ONSITE-1 LakeWohlford POC1 1.16 0 135 2.7 0 ;Existing Offsite Mirar De Valle Pavement (Type D Soil) MDV-2 LakeWohlford poc1 .44 0 31.5 1.9 0 ;ONSITE WITHIN TYPE D SOIL ONSITE-2 LakeWohlford POC1 3.67 0 410 2.6 0 [SUBAREAS] ;;Subcatchment N-Imperv N-Perv S-Imperv S-Perv PctZero RouteTo PctRouted ;;-------------- ---------- ---------- ---------- ---------- ---------- ---------- ---------- MDV-1 .012 .15 0.05 .1 25 OUTLET ONSITE-1 .012 .15 0.05 .1 25 OUTLET MDV-2 .012 .15 0.05 .1 25 OUTLET ONSITE-2 .012 .15 0.05 .1 25 OUTLET [INFILTRATION] ;;Subcatchment Suction Ksat IMD ;;-------------- ---------- ---------- ---------- MDV-1 6 .1 .32 ONSITE-1 6 .1 .32 MDV-2 9 .025 .33 ONSITE-2 9 .025 .33

[OUTFALLS] ;;Name Elevation Type Stage Data Gated Route To ;;-------------- ---------- ---------- ---------------- -------- ---------------- POC1 0 FREE NO [TIMESERIES] ;;Name Date Time Value ;;-------------- ---------- ---------- ---------- TS-LAKEWOHLFORD FILE "lakewohlford.dat" [REPORT] ;;Reporting Options INPUT NO CONTROLS NO SUBCATCHMENTS ALL NODES ALL LINKS ALL [TAGS] [MAP] DIMENSIONS 0.000 0.000 10000.000 10000.000 Units None [COORDINATES] ;;Node X-Coord Y-Coord ;;-------------- ------------------ ------------------ POC1 3112.544 5193.435 [VERTICES] ;;Link X-Coord Y-Coord ;;-------------- ------------------ ------------------ [Polygons] ;;Subcatchment X-Coord Y-Coord ;;-------------- ------------------ ------------------ MDV-1 1846.951 6306.099 ONSITE-1 3941.312 6386.651 MDV-2 2928.654 6352.129 ONSITE-2 4631.761 6352.129 [SYMBOLS] ;;Gage X-Coord Y-Coord ;;-------------- ------------------ ------------------ LakeWohlford 3112.544 6916.764

[TITLE] ;;Project Title/Notes Shady Oak-Post-Project Condition [OPTIONS] ;;Option Value FLOW_UNITS CFS INFILTRATION GREEN_AMPT FLOW_ROUTING KINWAVE LINK_OFFSETS DEPTH MIN_SLOPE 0 ALLOW_PONDING NO SKIP_STEADY_STATE NO START_DATE 10/08/1949 START_TIME 04:00:00 REPORT_START_DATE 10/08/1949 REPORT_START_TIME 04:00:00 END_DATE 05/23/2008 END_TIME 21:00:00 SWEEP_START 01/01 SWEEP_END 12/31 DRY_DAYS 0 REPORT_STEP 01:00:00 WET_STEP 00:15:00 DRY_STEP 04:00:00 ROUTING_STEP 0:01:00 INERTIAL_DAMPING PARTIAL NORMAL_FLOW_LIMITED BOTH FORCE_MAIN_EQUATION H-W VARIABLE_STEP 0.75 LENGTHENING_STEP 0 MIN_SURFAREA 12.557 MAX_TRIALS 8 HEAD_TOLERANCE 0.005 SYS_FLOW_TOL 5 LAT_FLOW_TOL 5 MINIMUM_STEP 0.5 THREADS 1 [EVAPORATION] ;;Data Source Parameters ;;-------------- ---------------- MONTHLY .07 .1 .13 .17 .19 .22 .24 .22 .19 .13 .09 .06 DRY_ONLY NO [RAINGAGES] ;;Name Format Interval SCF Source ;;-------------- --------- ------ ------ ---------- LakeWohlford INTENSITY 1:00 1.0 TIMESERIES TS-LAKEWOHLFORD [SUBCATCHMENTS] ;;Name Rain Gage Outlet Area %Imperv Width %Slope CurbLen SnowPack ;;-------------- ---------------- ---------------- -------- -------- -------- -------- -------- ---------------- ;Exist. Offsite Mirar De Valle Pavement (Type C Soil) MDV-1 LakeWohlford LID-ONSITE-1 1.58 26 160 1.66 0 ;ONSITE WITHIN TYPE C SOIL ONSITE-1 LakeWohlford LID-ONSITE-1 1.06 62 128 1.6 0 ;Existing Offsite Mirar De Valle Pavement (Type D Soil) MDV-2 LakeWohlford LID-ONSITE-2 .18 67 31.5 1.9 0 ;ONSITE WITHIN TYPE D SOIL ONSITE-2 LakeWohlford LID-ONSITE-2 1.044 64 128 1.8 0 ;Biofiltration Basin 1 LID-ONSITE-1 LakeWohlford ONSITE-1-DIV .04 0 17.3 0 0 ;Biofiltration Basin 4 LID-ONSITE-4 LakeWohlford ONSITE-4-DIV .033 0 13.3 0 0 ;Biofiltration Basin 3 LID-ONSITE-3 LakeWohlford ONSITE-3-DIV .031 0 13.3 0 0 ;Biofiltration Basin 2 LID-ONSITE-2 LakeWohlford ONSITE-2-DIV .032 0 13.3 0 0 MDV-3 LakeWohlford LID-ONSITE-3 .28 71 31.5 1.67 0 ONSITE-3 LakeWohlford LID-ONSITE-3 1.04 62 128 2.1 0 ONSITE-4 LakeWohlford LID-ONSITE-4 1.467 59 128 2.75 0 ;2:1 Slope from Residential Pads to Basin ONSITE-2-SLOPE LakeWohlford LID-ONSITE-2 .021 0 6.8 50 0 ONSITE-3-SLOPE LakeWohlford LID-ONSITE-3 .023 0 6.8 50 0 ONSITE-4-SLOPE LakeWohlford LID-ONSITE-4 .018 0 6.8 50 0

[SUBAREAS] ;;Subcatchment N-Imperv N-Perv S-Imperv S-Perv PctZero RouteTo PctRouted ;;-------------- ---------- ---------- ---------- ---------- ---------- ---------- ---------- MDV-1 .012 .15 0.05 .1 25 OUTLET ONSITE-1 .012 .15 0.05 .1 25 OUTLET MDV-2 .012 .15 0.05 .1 25 OUTLET ONSITE-2 .012 .15 0.05 .1 25 OUTLET LID-ONSITE-1 .012 .15 0.05 .1 25 OUTLET LID-ONSITE-4 .012 .15 0.05 .1 25 OUTLET LID-ONSITE-3 .012 .15 0.05 .1 25 OUTLET LID-ONSITE-2 .012 .15 0.05 .1 25 OUTLET MDV-3 .012 .15 0.05 .1 25 OUTLET ONSITE-3 .012 .15 0.05 .1 25 OUTLET ONSITE-4 .012 .15 0.05 .1 25 OUTLET ONSITE-2-SLOPE .012 .15 0.05 .1 25 OUTLET ONSITE-3-SLOPE .012 .15 0.05 .1 25 OUTLET ONSITE-4-SLOPE .012 .15 0.05 .1 25 OUTLET [INFILTRATION] ;;Subcatchment Suction Ksat IMD ;;-------------- ---------- ---------- ---------- MDV-1 6 .075 .32 ONSITE-1 6 .075 .32 MDV-2 9 .01875 .33 ONSITE-2 9 .01875 .33 LID-ONSITE-1 6 .075 .32 LID-ONSITE-4 9 .01875 .33 LID-ONSITE-3 9 .01875 .33 LID-ONSITE-2 9 .01875 .33 MDV-3 9 .01875 .33 ONSITE-3 9 .01875 .33 ONSITE-4 9 .01875 .33 ONSITE-2-SLOPE 9 .01875 .33 ONSITE-3-SLOPE 9 .01875 .33 ONSITE-4-SLOPE 9 .025 .33 [LID_CONTROLS] ;;Name Type/Layer Parameters ;;-------------- ---------- ---------- LID-ONSITE-1 BC LID-ONSITE-1 SURFACE 12 0.0 0 0 5 LID-ONSITE-1 SOIL 18 .4 0.2 0.1 5 5 1.5 LID-ONSITE-1 STORAGE 12 .67 0 0 LID-ONSITE-1 DRAIN .4831 0.5 0 6 LID-ONSITE-2 BC LID-ONSITE-2 SURFACE 13.41 0 0 0 5 LID-ONSITE-2 SOIL 18 0.4 0.2 0.1 5 5 1.5 LID-ONSITE-2 STORAGE 12 .67 0 0 LID-ONSITE-2 DRAIN .0846 0.5 0 6 LID-ONSITE-3 BC LID-ONSITE-3 SURFACE 12.18 0.0 0 0 5 LID-ONSITE-3 SOIL 18 0.4 0.2 0.1 5 5 1.5 LID-ONSITE-3 STORAGE 12 .67 0 0 LID-ONSITE-3 DRAIN .3756 0.5 0 6 LID-ONSITE-4 BC LID-ONSITE-4 SURFACE 12.21 0.0 0 0 5 LID-ONSITE-4 SOIL 18 .4 0.2 0.1 5 5 1.5 LID-ONSITE-4 STORAGE 12 .67 0 0 LID-ONSITE-4 DRAIN .0875 0.5 0 6 [LID_USAGE] ;;Subcatchment LID Process Number Area Width InitSat FromImp ToPerv RptFile DrainTo ;;-------------- ---------------- ------- ---------- ---------- ---------- ---------- ---------- ------------------------ ---------------- LID-ONSITE-1 LID-ONSITE-1 1 1742.40 0 0 0 0 LID-ONSITE-4 LID-ONSITE-4 1 1437.48 0 0 0 0 LID-ONSITE-3 LID-ONSITE-3 1 1350.36 0 0 0 0 LID-ONSITE-2 LID-ONSITE-2 1 1393.92 0 0 0 0 [OUTFALLS] ;;Name Elevation Type Stage Data Gated Route To ;;-------------- ---------- ---------- ---------------- -------- ---------------- POC1 0 FREE NO [DIVIDERS]

;;Name Elevation Diverted Link Type Parameters ;;-------------- ---------- ---------------- ---------- ---------- ONSITE-1-DIV 0 BYPASS-1 CUTOFF .1101 0 0 0 0 ONSITE-2-DIV 0 BYPASS-2 CUTOFF .0156 0 0 0 0 ONSITE-3-DIV 0 BYPASS-3 CUTOFF .0621 0 0 0 0 ONSITE-4-DIV 0 BYPASS-4 CUTOFF .0156 0 0 0 0 [STORAGE] ;;Name Elev. MaxDepth InitDepth Shape Curve Name/Params N/A Fevap Psi Ksat IMD ;;-------------- -------- ---------- ----------- ---------- ---------------------------- -------- -------- -------- -------- ONSITE-1-STORAGE 0 1 0 TABULAR StorageCurve-1 0 0 ONSITE-2-STORAGE 0 1 0 TABULAR StorageCurve-2 0 0 ONSITE-3-STORAGE 0 1 0 TABULAR StorageCurve-3 0 0 ONSITE-4-STORAGE 0 1 0 TABULAR StorageCurve-4 0 0 [CONDUITS] ;;Name From Node To Node Length Roughness InOffset OutOffset InitFlow MaxFlow ;;-------------- ---------------- ---------------- ---------- ---------- ---------- ---------- ---------- ---------- BYPASS-1 ONSITE-1-DIV ONSITE-1-STORAGE 400 0.01 0 0 0 0 UNDERDRAIN ONSITE-1-DIV POC1 400 0.013 0 0 0 0 BYPASS-2 ONSITE-2-DIV ONSITE-2-STORAGE 400 0.01 0 0 0 0 UNDERDRAIN-2 ONSITE-2-DIV POC1 400 0.01 0 0 0 0 BYPASS-3 ONSITE-3-DIV ONSITE-3-STORAGE 400 0.01 0 0 0 0 BYPASS-4 ONSITE-4-DIV ONSITE-4-STORAGE 400 0.01 0 0 0 0 UNDERDRAIN-3 ONSITE-3-DIV POC1 400 0.01 0 0 0 0 UNDERDRAIN-4 ONSITE-4-DIV POC1 400 0.01 0 0 0 0 [OUTLETS] ;;Name From Node To Node Offset Type QTable/Qcoeff Qexpon Gated ;;-------------- ---------------- ---------------- ---------- --------------- ---------------- ---------- -------- MIDFLOW-1 ONSITE-1-STORAGE POC1 0 TABULAR/DEPTH RatingCurve-1 NO MIDFLOW-2 ONSITE-2-STORAGE POC1 0 TABULAR/DEPTH RatingCurve-2 NO MIDFLOW-3 ONSITE-3-STORAGE POC1 0 TABULAR/DEPTH RatingCurve-3 NO MIDFLOW-4 ONSITE-4-STORAGE POC1 0 TABULAR/DEPTH RatingCurve-4 NO [XSECTIONS] ;;Link Shape Geom1 Geom2 Geom3 Geom4 Barrels Culvert ;;-------------- ------------ ---------------- ---------- ---------- ---------- ---------- ---------- BYPASS-1 DUMMY 0 0 0 0 1 UNDERDRAIN CIRCULAR 0.33 0 0 0 1 BYPASS-2 DUMMY 0 0 0 0 1 UNDERDRAIN-2 CIRCULAR 0.33 0 0 0 1 BYPASS-3 DUMMY 0 0 0 0 1 BYPASS-4 DUMMY 0 0 0 0 1 UNDERDRAIN-3 CIRCULAR 0.33 0 0 0 1 UNDERDRAIN-4 CIRCULAR 0.33 0 0 0 1 [CURVES] ;;Name Type X-Value Y-Value ;;-------------- ---------- ---------- ---------- RatingCurve-1 Rating 0 0.000 RatingCurve-1 0.083 0.030 RatingCurve-1 0.167 0.043 RatingCurve-1 0.250 0.052 RatingCurve-1 0.333 0.061 RatingCurve-1 0.417 0.068 RatingCurve-1 0.500 0.074 RatingCurve-1 0.583 0.080 RatingCurve-1 0.667 0.086 RatingCurve-1 0.750 0.091 RatingCurve-1 0.833 0.762 RatingCurve-1 0.917 1.985 RatingCurve-1 1.000 3.566 ; RatingCurve-2 Rating 0 0.000 RatingCurve-2 0.083 0.030 RatingCurve-2 0.167 0.043 RatingCurve-2 0.250 0.052 RatingCurve-2 0.333 0.061 RatingCurve-2 0.417 0.068 RatingCurve-2 0.500 0.074 RatingCurve-2 0.583 0.080 RatingCurve-2 0.667 0.086 RatingCurve-2 0.750 0.091

RatingCurve-2 0.833 0.762 RatingCurve-2 0.917 1.985 RatingCurve-2 1.000 3.566 ; RatingCurve-3 Rating 0 0.000 RatingCurve-3 0.083 0.030 RatingCurve-3 0.167 0.043 RatingCurve-3 0.250 0.052 RatingCurve-3 0.333 0.061 RatingCurve-3 0.417 0.068 RatingCurve-3 0.500 0.074 RatingCurve-3 0.583 0.080 RatingCurve-3 0.667 0.086 RatingCurve-3 0.750 0.091 RatingCurve-3 0.833 0.762 RatingCurve-3 0.917 1.985 RatingCurve-3 1.000 3.566 ; RatingCurve-4 Rating 0 0.000 RatingCurve-4 0.083 0.030 RatingCurve-4 0.167 0.043 RatingCurve-4 0.250 0.052 RatingCurve-4 0.333 0.061 RatingCurve-4 0.417 0.068 RatingCurve-4 0.500 0.074 RatingCurve-4 0.583 0.080 RatingCurve-4 0.667 0.086 RatingCurve-4 0.750 0.091 RatingCurve-4 0.833 0.762 RatingCurve-4 0.917 1.985 RatingCurve-4 1.000 3.566 ; StorageCurve-1 Storage 0 1750.00 StorageCurve-1 0.083 1750.00 StorageCurve-1 0.167 1750.00 StorageCurve-1 0.250 1750.00 StorageCurve-1 0.333 1750.00 StorageCurve-1 0.417 1750.00 StorageCurve-1 0.500 1750.00 StorageCurve-1 0.583 1750.00 StorageCurve-1 0.667 1750.00 StorageCurve-1 0.750 1750.00 StorageCurve-1 0.833 1750.00 StorageCurve-1 0.917 1750.00 StorageCurve-1 1.000 1750.00 ; StorageCurve-2 Storage 0 1203.13 StorageCurve-2 0.083 1224.87 StorageCurve-2 0.167 1246.71 StorageCurve-2 0.250 1268.64 StorageCurve-2 0.333 1290.66 StorageCurve-2 0.417 1312.77 StorageCurve-2 0.500 1334.98 StorageCurve-2 0.583 1357.29 StorageCurve-2 0.667 1379.69 StorageCurve-2 0.750 1402.19 StorageCurve-2 0.833 1424.78 StorageCurve-2 0.917 1447.56 StorageCurve-2 1.000 1470.43 ; StorageCurve-3 Storage 0 1244.61 StorageCurve-3 0.083 1256.51 StorageCurve-3 0.167 1268.32 StorageCurve-3 0.250 1280.06 StorageCurve-3 0.333 1291.71 StorageCurve-3 0.417 1303.29 StorageCurve-3 0.500 1314.79 StorageCurve-3 0.583 1326.20 StorageCurve-3 0.667 1337.54 StorageCurve-3 0.750 1348.81 StorageCurve-3 0.833 1360.00 StorageCurve-3 0.917 1371.10 StorageCurve-3 1.000 1382.13 ; StorageCurve-4 Storage 0 1337.34 StorageCurve-4 0.083 1348.95 StorageCurve-4 0.167 1360.48 StorageCurve-4 0.250 1374.36 StorageCurve-4 0.333 1385.72

StorageCurve-4 0.417 1394.56 StorageCurve-4 0.500 1405.77 StorageCurve-4 0.583 1416.89 StorageCurve-4 0.667 1427.93 StorageCurve-4 0.750 1438.89 StorageCurve-4 0.833 1449.77 StorageCurve-4 0.917 1460.57 StorageCurve-4 1.000 1471.30 [TIMESERIES] ;;Name Date Time Value ;;-------------- ---------- ---------- ---------- TS-LAKEWOHLFORD FILE "lakewohlford.dat" [REPORT] ;;Reporting Options INPUT NO CONTROLS NO SUBCATCHMENTS ALL NODES ALL LINKS ALL [TAGS] [MAP] DIMENSIONS 0.000 0.000 10000.000 10000.000 Units None [COORDINATES] ;;Node X-Coord Y-Coord ;;-------------- ------------------ ------------------ POC1 3880.179 750.280 ONSITE-1-DIV -1869.965 3049.482 ONSITE-2-DIV 3241.881 3807.391 ONSITE-3-DIV 7094.361 4349.827 ONSITE-4-DIV 10903.337 3383.199 ONSITE-1-STORAGE -2779.056 1277.330 ONSITE-2-STORAGE 489.068 3245.109 ONSITE-3-STORAGE 4585.731 3831.991 ONSITE-4-STORAGE 8866.513 4280.783 [VERTICES] ;;Link X-Coord Y-Coord ;;-------------- ------------------ ------------------ [Polygons] ;;Subcatchment X-Coord Y-Coord ;;-------------- ------------------ ------------------ MDV-1 -3216.341 6283.084 ONSITE-1 -1708.861 6260.069 MDV-2 247.411 6329.114 ONSITE-2 2157.652 6375.144 LID-ONSITE-1 -2215.190 4844.649 LID-ONSITE-4 10604.143 5155.351 LID-ONSITE-3 7140.391 5408.516 LID-ONSITE-2 2180.667 4913.694 MDV-3 5149.597 6501.726 ONSITE-3 6243.001 6651.736 ONSITE-4 10005.754 6789.413 ONSITE-2-SLOPE 3481.013 6340.621 ONSITE-3-SLOPE 7980.437 6559.264 ONSITE-4-SLOPE 12353.280 6616.801 [SYMBOLS] ;;Gage X-Coord Y-Coord ;;-------------- ------------------ ------------------ LakeWohlford 3112.544 6916.764

SWMM - LID Control Calculations
PARAMETER ABBREV.
Ponding Depth PD 12 in 12 in 12 in 12 inBioretention Soil Layer S 18 in 18 in 18 in 18 in
Gravel Layer G 12 in 12 in 12 in 12 in3.5 ft 3.5 ft 3.5 ft 3.5 ft42 in 42 in 42 in 42 in
Orifice Coefficient cg 0.6 -- 0.6 -- 0.6 -- 0.6 --Low Flow Orifice Diameter D 1.6 in 0.6 in 1.2 in 0.6 in
Drain exponent n 0.5 -- 0.5 -- 0.5 -- 0.5 --
Flow Rate (volumetric) Q 0.125 cfs 0.018 cfs 0.070 cfs 0.018 cfs
Ponding Depth Surface Area APD 1750 ft2 1405 ft2 1266 ft2 1359 ft2
AS, AG 1750 ft2 1138 ft2 1230 ft2 1312 ft2
Porosity of Bioretention Soil n 0.40 - 0.40 - 0.40 - 0.40 -
Effective Ponding Depth PDeff 12.00 in 13.41 in 12.18 in 12.21 inFlow Coefficient C 0.4831 -- 0.0846 -- 0.3756 -- 0.0875 --
Cutoff Flow Qcutoff 0.1101 cfs 0.0156 cfs 0.0621 cfs 0.0156 cfs
TOTAL
Bioretention Surface Area
LID Onsite-4("Bio-Retention
Cell")
LID Onsite-1("Bio-Retention
Cell")
LID Onsite-2("Bio-Retention Cell")
LID Onsite-3("Bio-Retention
Cell")

Ponding Depth, h
(feet)Area (ft2)
Ponding Depth, h
(feet)Area (ft2)
Ponding Depth, h
(feet)Area (ft2)
Ponding Depth, h
(feet)Area (ft2)
0 1750.00 0 1203.13 0 1244.61 0 1337.34 Area at 3" above bottom of basin
0.083 1750.00 0.083 1224.87 0.083 1256.51 0.083 1348.95
0.167 1750.00 0.167 1246.71 0.167 1268.32 0.167 1360.48
0.250 1750.00 0.250 1268.64 0.250 1280.06 0.250 1374.36
0.333 1750.00 0.333 1290.66 0.333 1291.71 0.333 1385.72
0.417 1750.00 0.417 1312.77 0.417 1303.29 0.417 1394.56
0.500 1750.00 0.500 1334.98 0.500 1314.79 0.500 1405.77
0.583 1750.00 0.583 1357.29 0.583 1326.20 0.583 1416.89
0.667 1750.00 0.667 1379.69 0.667 1337.54 0.667 1427.93
0.750 1750.00 0.750 1402.19 0.750 1348.81 0.750 1438.89
0.833 1750.00 0.833 1424.78 0.833 1360.00 0.833 1449.77
0.917 1750.00 0.917 1447.56 0.917 1371.10 0.917 1460.57
1.000 1750.00 1.000 1470.43 1.000 1382.13 1.000 1471.30
1.083 1750.00 1.083 1493.40 1.083 1393.09 1.083 1481.94
1.167 1750.00 1.167 1516.47 1.167 1403.97 1.167 1492.51
1.250 1750.00 1.250 1539.65 1.250 1414.78 1.250 1503.00
1.333 1750.00 1.333 1562.93 1.333 1423.76 1.333 1513.42
1.417 1750.00 1.417 1586.32 1.417 1436.15 1.417 1523.75
1.500 1750.00 1.500 1609.81 1.500 1446.80 1.500 1534.02
1.583 1750.00 1.583 1633.41 1.583 1448.81 1.583 1544.20
1.667 1750.00 1.667 1657.13 1.667 1457.46 1.667 1554.32
1.750 1750.00 1.750 1680.97 1.750 1468.24 1.750 1556.75
LID Onsite-1 LID Onsite-2 LID Onsite-3 LID Onsite-4

Ponding Depth, h (feet) Orifice Capacity(ft3/sec) Weir Capacity (ft3/sec) Total Outflow (ft3/sec)
0 0.000 0.000
0.083 0.030 0.030
0.167 0.043 0.043
0.250 0.052 0.052
0.333 0.061 0.061
0.417 0.068 0.068
0.500 0.074 0.074
0.583 0.080 0.080
0.667 0.086 0.086
0.750 0.091 0.091
0.833 0.096 0.666117873 0.762
0.917 0.101 1.88406586 1.985
1.000 0.105 3.46125 3.566
3
0.6
2
0.022
9.23
Weir equation, Q = CwLe(h)3/2
Orifice equation, Q = CoAe(2gh)1/2
Orifice Diameter (inches)
Orifice Area,Ae (ft2)
Type I Catch Basin Effective Length, Le (ft)
Weir Coefficient, Cw
Orifice Coefficient, Co

SWMM Model Outputs

EPA STORM WATER MANAGEMENT MODEL - VERSION 5.1 (Build 5.1.010) -------------------------------------------------------------- Shady Oak-Pre-Project Condition ********************************************************* NOTE: The summary statistics displayed in this report are based on results found at every computational time step, not just on results from each reporting time step. ********************************************************* **************** Analysis Options **************** Flow Units ............... CFS Process Models: Rainfall/Runoff ........ YES RDII ................... NO Snowmelt ............... NO Groundwater ............ NO Flow Routing ........... NO Water Quality .......... NO Infiltration Method ...... GREEN_AMPT Starting Date ............ OCT-08-1949 04:00:00 Ending Date .............. MAY-23-2008 21:00:00 Antecedent Dry Days ...... 0.0 Report Time Step ......... 01:00:00 Wet Time Step ............ 00:15:00 Dry Time Step ............ 04:00:00 ************************** Volume Depth Runoff Quantity Continuity acre-feet inches ************************** --------- ------- Total Precipitation ...... 571.884 1001.840 Evaporation Loss ......... 21.274 37.268 Infiltration Loss ........ 436.724 765.063 Surface Runoff ........... 118.696 207.935 Final Storage ............ 0.001 0.002 Continuity Error (%) ..... -0.841 ************************** Volume Volume Flow Routing Continuity acre-feet 10^6 gal ************************** --------- --------- Dry Weather Inflow ....... 0.000 0.000 Wet Weather Inflow ....... 118.696 38.679 Groundwater Inflow ....... 0.000 0.000 RDII Inflow .............. 0.000 0.000 External Inflow .......... 0.000 0.000 External Outflow ......... 118.696 38.679 Flooding Loss ............ 0.000 0.000 Evaporation Loss ......... 0.000 0.000 Exfiltration Loss ........ 0.000 0.000 Initial Stored Volume .... 0.000 0.000 Final Stored Volume ...... 0.000 0.000 Continuity Error (%) ..... 0.000 *************************** Subcatchment Runoff Summary *************************** -------------------------------------------------------------------------------------------------------- Total Total Total Total Total Total Peak Runoff Precip Runon Evap Infil Runoff Runoff Runoff Coeff Subcatchment in in in in in 10^6 gal CFS -------------------------------------------------------------------------------------------------------- MDV-1 1001.84 0.00 44.74 681.11 280.97 12.05 1.59 0.280 ONSITE-1 1001.84 0.00 10.12 919.60 73.70 2.32 1.07 0.074 MDV-2 1001.84 0.00 42.70 763.91 206.66 2.47 0.39 0.206 ONSITE-2 1001.84 0.00 41.98 752.50 219.07 21.83 3.99 0.219 Analysis begun on: Tue Jun 13 13:21:26 2017 Analysis ended on: Tue Jun 13 13:21:46 2017 Total elapsed time: 00:00:20

EPA STORM WATER MANAGEMENT MODEL - VERSION 5.1 (Build 5.1.010) -------------------------------------------------------------- Shady Oak-Post-Project Condition ********************************************************* NOTE: The summary statistics displayed in this report are based on results found at every computational time step, not just on results from each reporting time step. ********************************************************* **************** Analysis Options **************** Flow Units ............... CFS Process Models: Rainfall/Runoff ........ YES RDII ................... NO Snowmelt ............... NO Groundwater ............ NO Flow Routing ........... YES Ponding Allowed ........ NO Water Quality .......... NO Infiltration Method ...... GREEN_AMPT Flow Routing Method ...... KINWAVE Starting Date ............ OCT-08-1949 04:00:00 Ending Date .............. MAY-23-2008 21:00:00 Antecedent Dry Days ...... 0.0 Report Time Step ......... 01:00:00 Wet Time Step ............ 00:15:00 Dry Time Step ............ 04:00:00 Routing Time Step ........ 60.00 sec ************************** Volume Depth Runoff Quantity Continuity acre-feet inches ************************** --------- ------- Initial LID Storage ...... 0.020 0.036 Total Precipitation ...... 571.800 1001.840 Evaporation Loss ......... 64.001 112.134 Infiltration Loss ........ 206.918 362.537 Surface Runoff ........... 77.310 135.453 LID Drainage ............. 227.964 399.412 Final Storage ............ 0.138 0.241 Continuity Error (%) ..... -0.789 ************************** Volume Volume Flow Routing Continuity acre-feet 10^6 gal ************************** --------- --------- Dry Weather Inflow ....... 0.000 0.000 Wet Weather Inflow ....... 305.273 99.478 Groundwater Inflow ....... 0.000 0.000 RDII Inflow .............. 0.000 0.000 External Inflow .......... 0.000 0.000 External Outflow ......... 132.393 43.142 Flooding Loss ............ 174.595 56.895 Evaporation Loss ......... 0.000 0.000 Exfiltration Loss ........ 0.000 0.000 Initial Stored Volume .... 0.000 0.000 Final Stored Volume ...... 0.003 0.001 Continuity Error (%) ..... -0.563 ******************************** Highest Flow Instability Indexes ******************************** All links are stable. ************************* Routing Time Step Summary ************************* Minimum Time Step : 60.00 sec Average Time Step : 60.00 sec Maximum Time Step : 60.00 sec Percent in Steady State : 0.00 Average Iterations per Step : 1.02

Percent Not Converging : 0.00 *************************** Subcatchment Runoff Summary *************************** -------------------------------------------------------------------------------------------------------- Total Total Total Total Total Total Peak Runoff Precip Runon Evap Infil Runoff Runoff Runoff Coeff Subcatchment in in in in in 10^6 gal CFS -------------------------------------------------------------------------------------------------------- MDV-1 1001.84 0.00 46.97 670.59 289.41 12.42 1.68 0.289 ONSITE-1 1001.84 0.00 96.02 341.76 572.24 16.47 1.32 0.571 MDV-2 1001.84 0.00 111.45 219.77 681.47 3.33 0.23 0.680 ONSITE-2 1001.84 0.00 109.88 242.33 658.92 18.68 1.36 0.658 LID-ONSITE-1 1001.84 26596.03 1133.69 0.00 26460.21 28.74 2.84 0.959 LID-ONSITE-4 1001.84 28085.28 1160.38 0.00 27911.48 25.01 1.75 0.960 LID-ONSITE-3 1001.84 28273.42 1137.55 0.00 28132.50 23.68 1.61 0.961 LID-ONSITE-2 1001.84 25532.23 1154.29 0.00 25365.41 22.04 1.46 0.956 MDV-3 1001.84 0.00 117.93 195.77 697.22 5.30 0.37 0.696 ONSITE-3 1001.84 0.00 107.35 255.69 648.29 18.31 1.35 0.647 ONSITE-4 1001.84 0.00 105.16 276.61 628.67 25.04 1.89 0.628 ONSITE-2-SLOPE 1001.84 0.00 42.14 661.17 307.25 0.18 0.03 0.307 ONSITE-3-SLOPE 1001.84 0.00 42.23 662.20 305.85 0.19 0.03 0.305 ONSITE-4-SLOPE 1001.84 0.00 33.56 723.40 253.19 0.12 0.02 0.253 *********************** LID Performance Summary *********************** -------------------------------------------------------------------------------------------------------------------- Total Evap Infil Surface Drain Initial Final Continuity Inflow Loss Loss Outflow Outflow Storage Storage Error Subcatchment LID Control in in in in in in in % -------------------------------------------------------------------------------------------------------------------- LID-ONSITE-1 LID-ONSITE-1 27597.87 1133.73 0.00 3910.50 22550.68 1.80 5.82 -0.00 LID-ONSITE-4 LID-ONSITE-4 29087.12 1160.42 0.00 10724.64 17187.87 1.80 16.87 -0.00 LID-ONSITE-3 LID-ONSITE-3 29275.26 1137.59 0.00 4661.76 23471.77 1.80 7.07 -0.00 LID-ONSITE-2 LID-ONSITE-2 26534.07 1154.33 0.00 8528.17 16838.17 1.80 16.02 -0.00 ****************** Node Depth Summary ****************** --------------------------------------------------------------------------------- Average Maximum Maximum Time of Max Reported Depth Depth HGL Occurrence Max Depth Node Type Feet Feet Feet days hr:min Feet --------------------------------------------------------------------------------- POC1 OUTFALL 0.04 0.33 0.33 9 15:54 0.33 ONSITE-1-DIV DIVIDER 0.01 0.33 0.33 9 15:19 0.33 ONSITE-2-DIV DIVIDER 0.03 0.33 0.33 9 16:31 0.33 ONSITE-3-DIV DIVIDER 0.01 0.33 0.33 9 15:23 0.33 ONSITE-4-DIV DIVIDER 0.03 0.33 0.33 9 15:59 0.33 ONSITE-1-STORAGE STORAGE 0.00 0.96 0.96 15822 13:16 0.92 ONSITE-2-STORAGE STORAGE 0.00 0.88 0.88 15822 13:09 0.87 ONSITE-3-STORAGE STORAGE 0.00 0.89 0.89 15822 13:05 0.87 ONSITE-4-STORAGE STORAGE 0.00 0.90 0.90 15822 13:16 0.88 ******************* Node Inflow Summary ******************* ------------------------------------------------------------------------------------------------- Maximum Maximum Lateral Total Flow Lateral Total Time of Max Inflow Inflow Balance Inflow Inflow Occurrence Volume Volume Error

Node Type CFS CFS days hr:min 10^6 gal 10^6 gal Percent ------------------------------------------------------------------------------------------------- POC1 OUTFALL 0.00 7.45 15822 13:16 0 43.1 0.000 ONSITE-1-DIV DIVIDER 2.84 2.84 15822 13:16 28.7 28.7 0.000 ONSITE-2-DIV DIVIDER 1.46 1.46 15822 13:16 22 22 0.002 ONSITE-3-DIV DIVIDER 1.61 1.61 15822 13:16 23.7 23.7 0.000 ONSITE-4-DIV DIVIDER 1.75 1.75 15822 13:16 25 25 0.002 ONSITE-1-STORAGE STORAGE 0.00 2.73 15822 13:16 0 4.75 0.145 ONSITE-2-STORAGE STORAGE 0.00 1.45 15822 13:16 0 7.96 0.084 ONSITE-3-STORAGE STORAGE 0.00 1.55 15822 13:16 0 4.98 0.108 ONSITE-4-STORAGE STORAGE 0.00 1.73 15822 13:16 0 10.6 0.085 ********************** Node Surcharge Summary ********************** Surcharging occurs when water rises above the top of the highest conduit. --------------------------------------------------------------------- Max. Height Min. Depth Hours Above Crown Below Rim Node Type Surcharged Feet Feet --------------------------------------------------------------------- ONSITE-1-DIV DIVIDER 513905.00 0.330 0.000 ONSITE-2-DIV DIVIDER 513905.00 0.330 0.000 ONSITE-3-DIV DIVIDER 513905.00 0.330 0.000 ONSITE-4-DIV DIVIDER 513905.00 0.330 0.000 ONSITE-1-STORAGE STORAGE 513905.00 0.955 0.045 ONSITE-2-STORAGE STORAGE 513905.00 0.881 0.119 ONSITE-3-STORAGE STORAGE 513905.00 0.888 0.112 ONSITE-4-STORAGE STORAGE 513905.00 0.900 0.100 ********************* Node Flooding Summary ********************* Flooding refers to all water that overflows a node, whether it ponds or not. -------------------------------------------------------------------------- Total Maximum Maximum Time of Max Flood Ponded Hours Rate Occurrence Volume Volume Node Flooded CFS days hr:min 10^6 gal 1000 ft3 -------------------------------------------------------------------------- ONSITE-1-DIV 18462.18 0.11 4873 02:52 22.501 0.000 ONSITE-2-DIV 44271.13 0.01 4873 02:42 8.794 0.000 ONSITE-3-DIV 20998.77 0.06 4873 02:54 16.470 0.000 ONSITE-4-DIV 44715.23 0.01 4873 02:40 9.126 0.000 ********************** Storage Volume Summary ********************** -------------------------------------------------------------------------------------------------- Average Avg Evap Exfil Maximum Max Time of Max Maximum Volume Pcnt Pcnt Pcnt Volume Pcnt Occurrence Outflow Storage Unit 1000 ft3 Full Loss Loss 1000 ft3 Full days hr:min CFS -------------------------------------------------------------------------------------------------- ONSITE-1-STORAGE 0.002 0 0 0 1.673 96 15822 13:16 2.71 ONSITE-2-STORAGE 0.003 0 0 0 1.164 87 15822 13:08 1.46 ONSITE-3-STORAGE 0.002 0 0 0 1.163 88 15822 13:04 1.57 ONSITE-4-STORAGE 0.004 0 0 0 1.259 90 15822 13:16 1.73 *********************** Outfall Loading Summary *********************** ----------------------------------------------------------- Flow Avg Max Total Freq Flow Flow Volume Outfall Node Pcnt CFS CFS 10^6 gal ----------------------------------------------------------- POC1 11.39 0.03 7.45 43.139 ----------------------------------------------------------- System 11.39 0.03 7.45 43.139

******************** Link Flow Summary ******************** ----------------------------------------------------------------------------- Maximum Time of Max Maximum Max/ Max/ |Flow| Occurrence |Veloc| Full Full Link Type CFS days hr:min ft/sec Flow Depth ----------------------------------------------------------------------------- BYPASS-1 DUMMY 2.73 15822 13:16 UNDERDRAIN CONDUIT 0.00 20600 14:14 0.09 1.08 1.00 BYPASS-2 DUMMY 1.45 15822 13:16 UNDERDRAIN-2 CONDUIT 0.00 6728 21:19 0.10 1.08 1.00 BYPASS-3 DUMMY 1.55 15822 13:16 BYPASS-4 DUMMY 1.73 15822 13:16 UNDERDRAIN-3 CONDUIT 0.00 3762 02:47 0.12 1.08 1.00 UNDERDRAIN-4 CONDUIT 0.00 15129 20:25 0.10 1.08 1.00 MIDFLOW-1 DUMMY 2.71 15822 13:16 MIDFLOW-2 DUMMY 1.46 15822 13:09 MIDFLOW-3 DUMMY 1.57 15822 13:05 MIDFLOW-4 DUMMY 1.73 15822 13:16 ************************* Conduit Surcharge Summary ************************* ---------------------------------------------------------------------------- Hours Hours --------- Hours Full -------- Above Full Capacity Conduit Both Ends Upstream Dnstream Normal Flow Limited ---------------------------------------------------------------------------- UNDERDRAIN 18466.90 18466.90 18466.90 18117.90 18466.90 UNDERDRAIN-2 44650.97 44650.97 44650.97 45257.82 44650.97 UNDERDRAIN-3 21032.67 21032.67 21032.67 20810.83 21032.67 UNDERDRAIN-4 45055.77 45055.77 45055.77 45707.45 45055.77 Analysis begun on: Wed Jun 14 15:57:44 2017 Analysis ended on: Wed Jun 14 16:00:17 2017 Total elapsed time: 00:02:33

Shady Oak POC-1
Peak Flow Frequency Summary
Return Period (years)
Pre-development Qpeak(cfs)
Post-project - Mitigated Q(cfs)
Reduction Q (cfs)
LF = 0.1*Q2 0.241 0.198 0.043
2-year 2.406 1.979 0.427
3-year 2.885 2.524 0.361
4-year 3.351 3.069 0.282
5-year 3.760 3.502 0.258
6-year 3.824 3.673 0.151
7-year 3.921 3.799 0.122
8-year 4.160 4.021 0.139
9-year 4.301 4.198 0.102
10-year 4.316 4.308 0.008

Q10 (4.316 cfs)
Q5 (3.76 cfs)
Q2 (2.406 cfs)
Qlf (0.241 cfs)
0.000
0.500
1.000
1.500
2.000
2.500
3.000
3.500
4.000
4.500
5.000
0 1 2 3 4 5 6 7 8 9 10
Peak
Flo
w (c
fs)
Return Period in Years
Shady Oak Peak Flow Frequency Curves -POC1
Pre-development Qpeak Post-project Mitigated Qpeak

Shady Oak POC-1
Low-flow Threshold: 10%0.1xQ2 (Pre): 0.241 cfs
Q10 (Pre): 4.316 cfsOrdinate #: 100
Incremental Q (Pre): 0.04075 cfsTotal Hourly Data: 513905 hours The proposed BMP: PASSED
Beginning of Interval
Pre-develop. Flow(cfs)
Pre-develop. Hours
Pre-develop.% Time Exceeding
Post-project Hours
Post-project% Time Exceeding
Percentage Pass/Fail
1 0.241 1487 2.89E-03 1122 2.18E-03 75% Pass2 0.281 1331 2.59E-03 920 1.79E-03 69% Pass3 0.322 1180 2.30E-03 729 1.42E-03 62% Pass4 0.363 1073 2.09E-03 558 1.09E-03 52% Pass5 0.404 978 1.90E-03 473 9.20E-04 48% Pass6 0.444 893 1.74E-03 414 8.06E-04 46% Pass7 0.485 816 1.59E-03 396 7.71E-04 49% Pass8 0.526 748 1.46E-03 372 7.24E-04 50% Pass9 0.567 678 1.32E-03 350 6.81E-04 52% Pass
10 0.607 625 1.22E-03 331 6.44E-04 53% Pass11 0.648 589 1.15E-03 312 6.07E-04 53% Pass12 0.689 561 1.09E-03 295 5.74E-04 53% Pass13 0.730 535 1.04E-03 280 5.45E-04 52% Pass14 0.770 501 9.75E-04 267 5.20E-04 53% Pass15 0.811 472 9.18E-04 250 4.86E-04 53% Pass16 0.852 439 8.54E-04 244 4.75E-04 56% Pass17 0.893 416 8.09E-04 232 4.51E-04 56% Pass18 0.933 392 7.63E-04 222 4.32E-04 57% Pass19 0.974 371 7.22E-04 206 4.01E-04 56% Pass20 1.015 341 6.64E-04 184 3.58E-04 54% Pass21 1.056 317 6.17E-04 169 3.29E-04 53% Pass22 1.096 296 5.76E-04 152 2.96E-04 51% Pass23 1.137 280 5.45E-04 141 2.74E-04 50% Pass24 1.178 256 4.98E-04 133 2.59E-04 52% Pass25 1.219 240 4.67E-04 126 2.45E-04 53% Pass26 1.259 231 4.49E-04 121 2.35E-04 52% Pass27 1.300 211 4.11E-04 120 2.34E-04 57% Pass28 1.341 198 3.85E-04 114 2.22E-04 58% Pass29 1.382 184 3.58E-04 112 2.18E-04 61% Pass30 1.422 175 3.41E-04 108 2.10E-04 62% Pass31 1.463 163 3.17E-04 105 2.04E-04 64% Pass32 1.504 156 3.04E-04 98 1.91E-04 63% Pass33 1.545 145 2.82E-04 92 1.79E-04 63% Pass34 1.585 136 2.65E-04 87 1.69E-04 64% Pass35 1.626 130 2.53E-04 81 1.58E-04 62% Pass36 1.667 120 2.34E-04 76 1.48E-04 63% Pass37 1.708 116 2.26E-04 70 1.36E-04 60% Pass38 1.748 110 2.14E-04 68 1.32E-04 62% Pass39 1.789 105 2.04E-04 66 1.28E-04 63% Pass40 1.830 99 1.93E-04 63 1.23E-04 64% Pass41 1.871 93 1.81E-04 62 1.21E-04 67% Pass42 1.912 87 1.69E-04 61 1.19E-04 70% Pass43 1.952 81 1.58E-04 60 1.17E-04 74% Pass44 1.993 76 1.48E-04 59 1.15E-04 78% Pass45 2.034 73 1.42E-04 54 1.05E-04 74% Pass46 2.075 70 1.36E-04 52 1.01E-04 74% Pass47 2.115 67 1.30E-04 51 9.92E-05 76% Pass48 2.156 65 1.26E-04 49 9.53E-05 75% Pass49 2.197 61 1.19E-04 47 9.15E-05 77% Pass50 2.238 59 1.15E-04 46 8.95E-05 78% Pass51 2.278 56 1.09E-04 43 8.37E-05 77% Pass52 2.319 51 9.92E-05 38 7.39E-05 75% Pass53 2.360 48 9.34E-05 37 7.20E-05 77% Pass

Shady Oak POC-1
Beginning of Interval
Pre-develop. Flow(cfs)
Pre-develop. Hours
Pre-develop.% Time Exceeding
Post-project Hours
Post-project% Time Exceeding
Percentage Pass/Fail
54 2.401 47 9.15E-05 35 6.81E-05 74% Pass55 2.441 45 8.76E-05 34 6.62E-05 76% Pass56 2.482 42 8.17E-05 33 6.42E-05 79% Pass57 2.523 40 7.78E-05 31 6.03E-05 78% Pass58 2.564 38 7.39E-05 29 5.64E-05 76% Pass59 2.604 36 7.01E-05 28 5.45E-05 78% Pass60 2.645 35 6.81E-05 28 5.45E-05 80% Pass61 2.686 34 6.62E-05 28 5.45E-05 82% Pass62 2.727 33 6.42E-05 27 5.25E-05 82% Pass63 2.767 33 6.42E-05 26 5.06E-05 79% Pass64 2.808 31 6.03E-05 26 5.06E-05 84% Pass65 2.849 29 5.64E-05 25 4.86E-05 86% Pass66 2.890 28 5.45E-05 24 4.67E-05 86% Pass67 2.930 27 5.25E-05 24 4.67E-05 89% Pass68 2.971 27 5.25E-05 23 4.48E-05 85% Pass69 3.012 26 5.06E-05 21 4.09E-05 81% Pass70 3.053 24 4.67E-05 19 3.70E-05 79% Pass71 3.093 23 4.48E-05 17 3.31E-05 74% Pass72 3.134 21 4.09E-05 17 3.31E-05 81% Pass73 3.175 20 3.89E-05 17 3.31E-05 85% Pass74 3.216 19 3.70E-05 17 3.31E-05 89% Pass75 3.256 19 3.70E-05 17 3.31E-05 89% Pass76 3.297 19 3.70E-05 16 3.11E-05 84% Pass77 3.338 18 3.50E-05 16 3.11E-05 89% Pass78 3.379 16 3.11E-05 16 3.11E-05 100% Pass^79 3.419 16 3.11E-05 16 3.11E-05 100% Pass^80 3.460 15 2.92E-05 15 2.92E-05 100% Pass^81 3.501 14 2.72E-05 15 2.92E-05 107% Pass^82 3.542 14 2.72E-05 12 2.34E-05 86% Pass83 3.582 14 2.72E-05 11 2.14E-05 79% Pass84 3.623 13 2.53E-05 11 2.14E-05 85% Pass85 3.664 12 2.34E-05 11 2.14E-05 92% Pass86 3.705 12 2.34E-05 9 1.75E-05 75% Pass87 3.745 12 2.34E-05 8 1.56E-05 67% Pass88 3.786 10 1.95E-05 8 1.56E-05 80% Pass89 3.827 9 1.75E-05 8 1.56E-05 89% Pass90 3.868 8 1.56E-05 8 1.56E-05 100% Pass^91 3.908 8 1.56E-05 7 1.36E-05 88% Pass92 3.949 8 1.56E-05 7 1.36E-05 88% Pass93 3.990 8 1.56E-05 7 1.36E-05 88% Pass94 4.031 8 1.56E-05 7 1.36E-05 88% Pass95 4.071 7 1.36E-05 7 1.36E-05 100% Pass^96 4.112 7 1.36E-05 7 1.36E-05 100% Pass^97 4.153 7 1.36E-05 6 1.17E-05 86% Pass98 4.194 7 1.36E-05 6 1.17E-05 86% Pass99 4.234 7 1.36E-05 6 1.17E-05 86% Pass
100 4.275 7 1.36E-05 6 1.17E-05 86% Pass

0.200
0.300
0.400
0.500
0.600
0.700
0.800
0.900
1.000
5.00E-05 5.00E-04 5.00E-03
Flow
(cfs
)
% Time Exceeding
Shady Oak Flow Duration Curves - POC1

CD of SWMM Electronic Files

PRIORITY DEVELOPMENT PROJECT (PDP) SWQMP 31 of 44
Template Date: March 16, 2016 Preparation Date: June 19, 2017 LUEG:SW PDP SWQMP - Attachments
ATTACHMENT 3
Structural BMP Maintenance Information
This is the cover sheet for Attachment 3.
Indicate which Items are Included behind this cover sheet: Attachment Sequence Contents Checklist Attachment 3a Structural BMP Maintenance Plan
(Required)
Included See Structural BMP Maintenance Information Checklist on the back of this Attachment cover sheet.
Attachment 3b Draft Stormwater Maintenance Notification / Agreement (when applicable)
Included Not Applicable

PRIORITY DEVELOPMENT PROJECT (PDP) SWQMP 32 of 44
Template Date: March 16, 2016 Preparation Date: June 19, 2017 LUEG:SW PDP SWQMP - Attachments
Use this checklist to ensure the required information has been included in the Structural BMP Maintenance Information Attachment:
Attachment 3a must identify:
Specific maintenance indicators and actions for proposed structural BMP(s). This must be based on Section 7.7 of the BMP Design Manual and enhanced to reflect actual proposed components of the structural BMP(s)
How to access the structural BMP(s) to inspect and perform maintenance Features that are provided to facilitate inspection (e.g., observation ports, cleanouts, silt
posts, or other features that allow the inspector to view necessary components of the structural BMP and compare to maintenance thresholds)
Manufacturer and part number for proprietary parts of structural BMP(s) when applicable Maintenance thresholds specific to the structural BMP(s), with a location-specific frame
of reference (e.g., level of accumulated materials that triggers removal of the materials, to be identified based on viewing marks on silt posts or measured with a survey rod with respect to a fixed benchmark within the BMP)
Recommended equipment to perform maintenance When applicable, necessary special training or certification requirements for inspection
and maintenance personnel such as confined space entry or hazardous waste management
Attachment 3b: For all Structural BMPs, Attachment 3b must include a draft maintenance agreement in the County’s standard format depending on the Category (PDP applicant to contact County staff to obtain the current maintenance agreement forms). Refer to Section 7.3 in the BMP Design Manual for a description of the different categories.

Attachment 3a
Maintenance Indicators and Actions
Maintenance shall be per “Summary of Standard Inspection and Maintenance for BF-1 Biofiltration” provided in the following sheet.
Accessibility to Structural BMPs
Maintenance crews to access the biolfiltration basins through Alleys A-D. Vehicles shall park at the end of the alleys and access the basins through a gate in the 6’ CMU sound wall.
Inspection Facilitation Features
Cleanouts at the upstream end of the biofiltration basins and Grated Inlets at the downstream end are provided for each biofiltration basin.
Responsible Party for Maintenance and Funding Mechanism
Structural BMPs will be the responsibility of the developer up until a Homeowner Association is established. The Homeowner Association will charge homeowners a monthly fee for the upkeep of the project which includes maintenance of the Structural BMPs.

BF-1 Biofiltration
BMP MAINTENANCE FACT SHEET FOR
STRUCTURAL BMP BF-1 BIOFILTRATION Biofiltration facilities are vegetated surface water systems that filter water through vegetation, and soil or engineered media prior to discharge via underdrain or overflow to the downstream conveyance system. Biofiltration facilities have limited or no infiltration. They are typically designed to provide enough hydraulic head to move flows through the underdrain connection to the storm drain system. Typical biofiltration components include:
Inflow distribution mechanisms (e.g., perimeter flow spreader or filter strips) Energy dissipation mechanism for concentrated inflows (e.g., splash blocks or riprap) Shallow surface ponding for captured flows Side slope and basin bottom vegetation selected based on climate and ponding depth Non-floating mulch layer Media layer (planting mix or engineered media) capable of supporting vegetation growth Filter course layer consisting of aggregate to prevent the migration of fines into uncompacted native soils or the aggregate storage layer Aggregate storage layer with underdrain(s) Impermeable liner or uncompacted native soils at the bottom of the facility Overflow structure
Normal Expected Maintenance Biofiltration requires routine maintenance to: remove accumulated materials such as sediment, trash or debris; maintain vegetation health; maintain infiltration capacity of the media layer; replenish mulch; and maintain integrity of side slopes, inlets, energy dissipators, and outlets. A summary table of standard inspection and maintenance indicators is provided within this Fact Sheet. Non-Standard Maintenance or BMP Failure If any of the following scenarios are observed, the BMP is not performing as intended to protect downstream waterways from pollution and/or erosion. Corrective maintenance, increased inspection and maintenance, BMP replacement, or a different BMP type will be required.
The BMP is not drained between storm events. Surface ponding longer than approximately 24 hours following a storm event may be detrimental to vegetation health, and surface ponding longer than approximately 96 hours following a storm event poses a risk of vector (mosquito) breeding. Poor drainage can result from clogging of the media layer, filter course, aggregate storage layer, underdrain, or outlet structure. The specific cause of the drainage issue must be determined and corrected. Sediment, trash, or debris accumulation greater than 25% of the surface ponding volume within one month. This means the load from the tributary drainage area is too high, reducing BMP function or clogging the BMP. This would require pretreatment measures within the tributary area draining to the BMP to intercept the materials. Pretreatment components, especially for sediment, will extend the life of components that are more expensive to replace such as media, filter course, and aggregate layers. Erosion due to concentrated storm water runoff flow that is not readily corrected by adding erosion control blankets, adding stone at flow entry points, or minor re-grading to restore proper drainage according to the original plan. If the issue is not corrected by restoring the BMP to the original plan and grade, the [City Engineer] shall be contacted prior to any additional repairs or reconstruction.
BF-1 Page 1 of 11 January 12, 2017

BF-1 Biofiltration
Other Special Considerations Biofiltration is a vegetated structural BMP. Vegetated structural BMPs that are constructed in the vicinity of, or connected to, an existing jurisdictional water or wetland could inadvertently result in creation of expanded waters or wetlands. As such, vegetated structural BMPs have the potential to come under the jurisdiction of the United States Army Corps of Engineers, SDRWQCB, California Department of Fish and Wildlife, or the United States Fish and Wildlife Service. This could result in the need for specific resource agency permits and costly mitigation to perform maintenance of the structural BMP. Along with proper placement of a structural BMP, routine maintenance is key to preventing this scenario.
BF-1 Page 2 of 11 January 12, 2017

BF-1 Biofiltration
SUMMARY OF STANDARD INSPECTION AND MAINTENANCE FOR BF-1 BIOFILTRATION
The property owner is responsible to ensure inspection, operation and maintenance of permanent BMPs on their property unless responsibility has been formally transferred to an agency, community facilities district, homeowners association, property owners association, or other special district. Maintenance frequencies listed in this table are average/typical frequencies. Actual maintenance needs are site-specific, and maintenance may be required more frequently. Maintenance must be performed whenever needed, based on maintenance indicators presented in this table. The BMP owner is responsible for conducting regular inspections to see when maintenance is needed based on the maintenance indicators. During the first year of operation of a structural BMP, inspection is recommended at least once prior to August 31 and then monthly from September through May. Inspection during a storm event is also recommended. After the initial period of frequent inspections, the minimum inspection and maintenance frequency can be determined based on the results of the first year inspections.
Threshold/Indicator Maintenance Action Typical Maintenance Frequency Accumulation of sediment, litter, or debris Remove and properly dispose of accumulated materials,
without damage to the vegetation or compaction of the media layer.
Inspect monthly. If the BMP is 25% full* or more in one month, increase inspection frequency to monthly plus after every 0.1-inch or larger storm event. Remove any accumulated materials found at each inspection.
Obstructed inlet or outlet structure Clear blockage. Inspect monthly and after every 0.5-inch or larger storm event. Remove any accumulated materials found at each inspection.
Damage to structural components such as weirs, inlet or outlet structures
Repair or replace as applicable Inspect annually. Maintenance when needed.
Poor vegetation establishment Re-seed, re-plant, or re-establish vegetation per original plans.
Inspect monthly. Maintenance when needed.
Dead or diseased vegetation Remove dead or diseased vegetation, re-seed, re-plant, or re-establish vegetation per original plans.
Inspect monthly. Maintenance when needed.
Overgrown vegetation Mow or trim as appropriate. Inspect monthly. Maintenance when needed.
2/3 of mulch has decomposed, or mulch has been removed
Remove decomposed fraction and top off with fresh mulch to a total depth of 3 inches.
Inspect monthly. Replenish mulch annually, or more frequently when needed based on inspection.
*“25% full” is defined as ¼ of the depth from the design bottom elevation to the crest of the outflow structure (e.g., if the height to the outflow opening is 12 inches from the bottom elevation, then the materials must be removed when there is 3 inches of accumulation – this should be marked on the outflow structure).
BF-1 Page 3 of 11 January 12, 2017

BF-1 Biofiltration
SUMMARY OF STANDARD INSPECTION AND MAINTENANCE FOR BF-1 BIOFILTRATION (Continued from previous page) Threshold/Indicator Maintenance Action Typical Maintenance Frequency
Erosion due to concentrated irrigation flow Repair/re-seed/re-plant eroded areas and adjust the irrigation system.
Inspect monthly. Maintenance when needed.
Erosion due to concentrated storm water runoff flow Repair/re-seed/re-plant eroded areas, and make appropriate corrective measures such as adding erosion control blankets, adding stone at flow entry points, or minor re-grading to restore proper drainage according to the original plan. If the issue is not corrected by restoring the BMP to the original plan and grade, the [City Engineer] shall be contacted prior to any additional repairs or reconstruction.
Inspect after every 0.5-inch or larger storm event. If erosion due to storm water flow has been observed, increase inspection frequency to after every 0.1-inch or larger storm event. Maintenance when needed. If the issue is not corrected by restoring the BMP to the original plan and grade, the [City Engineer] shall be contacted prior to any additional repairs or reconstruction.
Standing water in BMP for longer than 24 hours following a storm event
Surface ponding longer than approximately 24 hours following a storm event may be detrimental to vegetation health
Make appropriate corrective measures such as adjusting irrigation system, removing obstructions of debris or invasive vegetation, clearing underdrains, or repairing/replacing clogged or compacted soils.
Inspect monthly and after every 0.5-inch or larger storm event. If standing water is observed, increase inspection frequency to after every 0.1-inch or larger storm event. Maintenance when needed.
Presence of mosquitos/larvae For images of egg rafts, larva, pupa, and adult mosquitos, see http://www.mosquito.org/biology
If mosquitos/larvae are observed: first, immediately remove any standing water by dispersing to nearby landscaping; second, make corrective measures as applicable to restore BMP drainage to prevent standing water.
If mosquitos persist following corrective measures to remove standing water, or if the BMP design does not meet the 96-hour drawdown criteria due to release rates controlled by an orifice installed on the underdrain, the [City Engineer] shall be contacted to determine a solution. A different BMP type, or a Vector Management Plan prepared with concurrence from the County of San Diego Department of Environmental Health, may be required.
Inspect monthly and after every 0.5-inch or larger storm event. If mosquitos are observed, increase inspection frequency to after every 0.1-inch or larger storm event. Maintenance when needed.
Underdrain clogged Clear blockage. Inspect if standing water is observed for longer than 24-96 hours following a storm event. Maintenance when needed.
BF-1 Page 4 of 11 January 12, 2017

BF-1 Biofiltration
References American Mosquito Control Association.
http://www.mosquito.org/ California Storm Water Quality Association (CASQA). 2003. Municipal BMP Handbook.
https://www.casqa.org/resources/bmp-handbooks/municipal-bmp-handbook County of San Diego. 2014. Low Impact Development Handbook.
http://www.sandiegocounty.gov/content/sdc/dpw/watersheds/susmp/lid.html San Diego County Copermittees. 2016. Model BMP Design Manual, Appendix E, Fact Sheet BF-1.
http://www.projectcleanwater.org/index.php?option=com_content&view=article&id=250&Itemid=220
BF-1 Page 5 of 11 January 12, 2017

BF-1 Biofiltration
Page Intentionally Blank for Double-Sided Printing
BF-1 Page 6 of 11 January 12, 2017

BF-1 Biofiltration
Date: Inspector: BMP ID No.: Permit No.: APN(s): Property / Development Name:
Responsible Party Name and Phone Number:
Property Address of BMP:
Responsible Party Address:
INSPECTION AND MAINTENANCE CHECKLIST FOR BF-1 BIOFILTRATION PAGE 1 of 5
Threshold/Indicator Maintenance Recommendation Date Description of Maintenance Conducted Accumulation of sediment, litter, or debris
Maintenance Needed?
YES NO N/A
Remove and properly dispose of accumulated materials, without damage to the vegetation
If sediment, litter, or debris accumulation exceeds 25% of the surface ponding volume within one month (25% full*), add a forebay or other pre-treatment measures within the tributary area draining to the BMP to intercept the materials.
Other / Comments:
Poor vegetation establishment
Maintenance Needed?
YES NO N/A
Re-seed, re-plant, or re-establish vegetation per original plans
Other / Comments:
*“25% full” is defined as ¼ of the depth from the design bottom elevation to the crest of the outflow structure (e.g., if the height to the outflow opening is 12 inches from the bottom elevation, then the materials must be removed when there is 3 inches of accumulation – this should be marked on the outflow structure).
BF-1 Page 7 of 11 January 12, 2017

BF-1 Biofiltration
Date: Inspector: BMP ID No.: Permit No.: APN(s):
INSPECTION AND MAINTENANCE CHECKLIST FOR BF-1 BIOFILTRATION PAGE 2 of 5 Threshold/Indicator Maintenance Recommendation Date Description of Maintenance Conducted
Dead or diseased vegetation
Maintenance Needed?
YES NO N/A
Remove dead or diseased vegetation, re-seed, re-plant, or re-establish vegetation per original plans
Other / Comments:
Overgrown vegetation
Maintenance Needed?
YES NO N/A
Mow or trim as appropriate
Other / Comments:
2/3 of mulch has decomposed, or mulch has been removed
Maintenance Needed?
YES NO N/A
Remove decomposed fraction and top off with fresh mulch to a total depth of 3 inches
Other / Comments:
BF-1 Page 8 of 11 January 12, 2017

BF-1 Biofiltration
Date: Inspector: BMP ID No.: Permit No.: APN(s):
INSPECTION AND MAINTENANCE CHECKLIST FOR BF-1 BIOFILTRATION PAGE 3 of 5 Threshold/Indicator Maintenance Recommendation Date Description of Maintenance Conducted
Erosion due to concentrated irrigation flow
Maintenance Needed?
YES NO N/A
Repair/re-seed/re-plant eroded areas and adjust the irrigation system
Other / Comments:
Erosion due to concentrated storm water runoff flow
Maintenance Needed?
YES NO N/A
Repair/re-seed/re-plant eroded areas, and make appropriate corrective measures such as adding erosion control blankets, adding stone at flow entry points, or minor re-grading to restore proper drainage according to the original plan
If the issue is not corrected by restoring the BMP to the original plan and grade, the [City Engineer] shall be contacted prior to any additional repairs or reconstruction
Other / Comments:
BF-1 Page 9 of 11 January 12, 2017

BF-1 Biofiltration
Date: Inspector: BMP ID No.: Permit No.: APN(s):
INSPECTION AND MAINTENANCE CHECKLIST FOR BF-1 BIOFILTRATION PAGE 4 of 5 Threshold/Indicator Maintenance Recommendation Date Description of Maintenance Conducted
Obstructed inlet or outlet structure
Maintenance Needed?
YES NO N/A
Clear blockage
Other / Comments:
Underdrain clogged (inspect underdrain if standing water is observed for longer than 24-96 hours following a storm event)
Maintenance Needed?
YES NO N/A
Clear blockage
Other / Comments:
Damage to structural components such as weirs, inlet or outlet structures
Maintenance Needed?
YES NO N/A
Repair or replace as applicable
Other / Comments:
BF-1 Page 10 of 11 January 12, 2017

BF-1 Biofiltration
Date: Inspector: BMP ID No.: Permit No.: APN(s):
INSPECTION AND MAINTENANCE CHECKLIST FOR BF-1 BIOFILTRATION PAGE 5 of 5 Threshold/Indicator Maintenance Recommendation Date Description of Maintenance Conducted
Standing water in BMP for longer than 24-96 hours following a storm event*
Surface ponding longer than approximately 24 hours following a storm event may be detrimental to vegetation health
Maintenance Needed?
YES NO N/A
Make appropriate corrective measures such as adjusting irrigation system, removing obstructions of debris or invasive vegetation, clearing underdrains, or repairing/replacing clogged or compacted soils
Other / Comments:
Presence of mosquitos/larvae For images of egg rafts, larva, pupa, and adult mosquitos, see http://www.mosquito.org/biology
Maintenance Needed?
YES NO N/A
Apply corrective measures to remove standing water in BMP when standing water occurs for longer than 24-96 hours following a storm event.**
Other / Comments:
*Surface ponding longer than approximately 24 hours following a storm event may be detrimental to vegetation health, and surface ponding longer than approximately 96 hours following a storm event poses a risk of vector (mosquito) breeding. Poor drainage can result from clogging of the media layer, filter course, aggregate storage layer, underdrain, or outlet structure. The specific cause of the drainage issue must be determined and corrected. **If mosquitos persist following corrective measures to remove standing water, or if the BMP design does not meet the 96-hour drawdown criteria due to release rates controlled by an orifice installed on the underdrain, the [City Engineer] shall be contacted to determine a solution. A different BMP type, or a Vector Management Plan prepared with concurrence from the County of San Diego Department of Environmental Health, may be required.
BF-1 Page 11 of 11 January 12, 2017

PRIORITY DEVELOPMENT PROJECT (PDP) SWQMP 33 of 44
Template Date: March 16, 2016 Preparation Date: June 19, 2017 LUEG:SW PDP SWQMP - Attachments
ATTACHMENT 4
County of San Diego PDP Structural BMP Verification for Permitted Land Development Projects

PRIORITY DEVELOPMENT PROJECT (PDP) SWQMP 34 of 44
Template Date: March 16, 2016 Preparation Date: June 19, 2017 LUEG:SW PDP SWQMP - Attachments
This page was left intentionally blank.

PRIORITY DEVELOPMENT PROJECT (PDP) SWQMP 35 of 44
Template Date: March 16, 2016 Preparation Date: June 19, 2017 LUEG:SW PDP SWQMP - Attachments
County of San Diego BMP Design Manual Verification Form Project Summary Information
Project Name Shady Oak
Record ID (e.g., grading/improvement plan number)
PDS2016-MPA-001
Project Address
27522 Valley Center Road] Valley Center,Ca 92082
Assessor's Parcel Number(s) (APN(s)) 186-270-01
Project Watershed (Complete Hydrologic Unit, Area, and Subarea Name with Numeric Identifier)
San Luis Rey Hydrologic Unit, Lower San Luis Hydrologic Area, Valley Center Hydrologic Subarea 903.14
Responsible Party for Construction Phase Developer's Name Touchstone Communities
Address
9909 Mira Mesa Boulevard, Suite 150] San Diego, Ca 92127
Email Address [email protected]
Phone Number (858) 586-0414
Engineer of Work Stephen J. McPartland
Engineer's Phone Number (858) 762-9611 Responsible Party for Ongoing Maintenance
Owner's Name(s)* Touchstone Development, LLC
Address
9909 Mira Mesa Boulevard, Suite 150] San Diego, Ca 92127
Email Address [email protected]
Phone Number (858) 586-0414 *Note: If a corporation or LLC, provide information for principal partner or Agent for Service of Process. If an HOA, provide information for the Board or property manager at time of project closeout.

PRIORITY DEVELOPMENT PROJECT (PDP) SWQMP 36 of 44
Template Date: March 16, 2016 Preparation Date: June 19, 2017 LUEG:SW PDP SWQMP - Attachments
County of San Diego BMP Design Manual Verification Form Page 2 of 4 Stormwater Structural Pollutant Control & Hydromodification Control BMPs*
(List all from SWQMP)
Description/Type of Structural BMP
Plan Sheet
#
STRUCT-URAL BMP
ID#
Maint-enance
Category
Maintenance Agreement
Recorded Doc # Revisions
Biofiltration basin, BF-1,BF-2
TM shts. 2-3
LID-ONSITE-1
Two
Biofiltration Basin, BF-1,BF-2
TM shts. 2-3
LID-ONSITE-2
Two
Biofiltration Basin, BF-1,BF-2
TM shts. 2-3
LID-ONSITE-3
Two
Biofiltration Basin, BF-1,BF-2
TM shts. 2-3
LID-ONSITE-4
Two
Tree Well, SD-1 TM sht. 4
LID-OLD-MDV
*All Priority Development Projects (PDPs) require a Structural BMP Note: If this is a partial verification of Structural BMPs, provide a list and map denoting Structural BMPs that have already been submitted, those for this submission, and those anticipated in future submissions.

PRIORITY DEVELOPMENT PROJECT (PDP) SWQMP 37 of 44
Template Date: March 16, 2016 Preparation Date: June 19, 2017 LUEG:SW PDP SWQMP - Attachments
County of San Diego BMP Design Manual Verification Form Page 3 of 4 Checklist for Applicant to submit to PDCI:
Copy of the final accepted SWQMP and any accepted addendum. Copy of the most current plan showing the Stormwater Structural BMP Table,
plans/cross-section sheets of the Structural BMPs and the location of each verified as-built Structural BMP.
Photograph of each Structural BMP. Photograph(s) of each Structural BMP during the construction process to illustrate
proper construction. Copy of the approved Structural BMP maintenance agreement and associated security
By signing below, I certify that the Structural BMP(s) for this project have been constructed and all BMPs are in substantial conformance with the approved plans and applicable regulations. I understand the County reserves the right to inspect the above BMPs to verify compliance with the approved plans and Watershed Protection Ordinance (WPO). Should it be determined that the BMPs were not constructed to plan or code, corrective actions may be necessary before permits can be closed. Please sign your name and seal. Professional Engineer's Printed Name: Professional Engineer's Signed Name: Date:
[SEAL]

PRIORITY DEVELOPMENT PROJECT (PDP) SWQMP 38 of 44
Template Date: March 16, 2016 Preparation Date: June 19, 2017 LUEG:SW PDP SWQMP - Attachments
County of San Diego BMP Design Manual Verification Form Page 4 of 4 COUNTY - OFFICIAL USE ONLY: For PDCI: Verification Package #: PDCI Inspector: Date Project has/expects to close: Date verification received from EOW: By signing below, PDCI Inspector concurs that every noted Structural BMP has been installed per plan. PDCI Inspector’s Signature: _______________________________ Date: FOR WPP: Date Received from PDCI: WPP Submittal Reviewer: WPP Reviewer concurs that the information provided for the following Structural BMPs is acceptable to enter into the Structural BMP Maintenance verification inventory:
List acceptable Structural BMPs:
WPP Reviewer’s Signature: Date:

PRIORITY DEVELOPMENT PROJECT (PDP) SWQMP 39 of 44
Template Date: March 16, 2016 Preparation Date: June 19, 2017 LUEG:SW PDP SWQMP - Attachments
ATTACHMENT 5
Copy of Plan Sheets Showing Permanent Storm Water BMPs, Source Control, and Site Design
This is the cover sheet for Attachment 5.
Use this checklist to ensure the required information has been included on the plans:
The plans must identify:
Structural BMP(s) with ID numbers matching Step 6 Summary of PDP Structural BMPs The grading and drainage design shown on the plans must be consistent with the delineation of DMAs shown on the DMA exhibit
Details and specifications for construction of structural BMP(s) Signage indicating the location and boundary of structural BMP(s) as required by County staff
How to access the structural BMP(s) to inspect and perform maintenance Features that are provided to facilitate inspection (e.g., observation ports, cleanouts, silt posts, or other features that allow the inspector to view necessary components of the structural BMP and compare to maintenance thresholds)
Manufacturer and part number for proprietary parts of structural BMP(s) when applicable Maintenance thresholds specific to the structural BMP(s), with a location-specific frame of reference (e.g., level of accumulated materials that triggers removal of the materials, to be identified based on viewing marks on silt posts or measured with a survey rod with respect to a fixed benchmark within the BMP)
Recommended equipment to perform maintenance When applicable, necessary special training or certification requirements for inspection and maintenance personnel such as confined space entry or hazardous waste management
Include landscaping plan sheets showing vegetation requirements for vegetated structural BMP(s)
All BMPs must be fully dimensioned on the plans When proprietary BMPs are used, site-specific cross section with outflow, inflow, and model number must be provided. Photocopies of general brochures are not acceptable.
Include all source control and site design measures described in Steps 4 and 5 of the SWQMP. Can be included as a separate exhibit as necessary.

PRIORITY DEVELOPMENT PROJECT (PDP) SWQMP 40 of 44
Template Date: March 16, 2016 Preparation Date: June 19, 2017 LUEG:SW PDP SWQMP - Attachments
This page was left intentionally blank.

PRIORITY DEVELOPMENT PROJECT (PDP) SWQMP 41 of 44
Template Date: March 16, 2016 Preparation Date: June 19, 2017 LUEG:SW PDP SWQMP - Attachments
ATTACHMENT 6
Copy of Project's Drainage Report
This is the cover sheet for Attachment 6. If hardcopy or CD is not attached, the following information should be provided: Title: Prepared By: Date:

Preliminary Drainage Study
for
Shady Oak
Project No.:
PDS2016-TM-5614
PDS2016-REZ-16-005
PDS2016-STP-16-019
Prepared For:
Touchstone Communities
9909 Mira Mesa Blvd., Suite 150
San Diego, CA 92131
Mr. Kerry Garza
Prepared By:
TSAC Job No. 2142

Declaration of Responsible Charge
I hereby declare that I am the Civil Engineer of Work for this project. That I have exercised
responsible charge over the design of the project as defined in Section 6703 of the business and
professions code, and that the design is consistent with current standards.
I understand that the check of the Drainage Report by the County of San Diego is confined to a
review only and does not relieve me, as Engineer of Work, of my responsibilities for project
design.
_____________________________________________________________
Stephen J. McPartland RCE 35109 Date

TABLE OF CONTENTS
1.0 Introduction….……………………………………………………………………………1-2
2.0 Hydrologic Methodology and Criteria..…………………………………………………..3-5
3.0 Hydrologic Results………………………………………………………………………..5-6
4.0 Conclusion..……………………………………………………………………………….6
Tables:
Table 3.1: Summary of Pre-Post Project 100-Year Peak Discharge Rates for Shady Oak
Appendices:
Appendix A: Hydrologic Reference Materials
Appendix B: 100-Year Pre-Project Condition Hydrologic Output
Appendix C: 100-Year Post-Project Condition Output
Appendix D: HEC-1 Detention Calculations
Map Pockets:
Map Pocket 1: Pre-Project Hydrologic Unit Work Map for Shady Oak
Map Pocket 2: Post-Project Hydrologic Unit Work Map for Shady Oak

1
INTRODUCTION 1.0
The project site fronts Mirar De Valle Road and is located approximately 600 feet west of Valley
Center Road and is bounded by open space and low density residential from the south and west.
Refer to the Vicinity Map shown at the end of this section. The site is characterized by gentle
and uniform topography with elevations ranging from 1316 to 1297 feet above mean sea level.
The site is relatively flat with gentle to moderate sloping towards the northeast. The project
proposes to develop a vacant lot into a residential subdivision consisting of 47 residential lots,
private internal streets,alleys and associated offsite improvements. Offsite improvements include
the removal of existing AC berm and portion of AC pavement fronting the property on Mirar De
Valle. Curb and gutter is proposed in the frontage along with a 5’ decomposed granite pathway.
Old Mirar De Valle is designed as a secondary fire access plan and is only to be constructed if
Street A of Park Circle TM 5603 is not constructed prior to Shady Oak project.
Shady Oak is located within Valley Center Hydrologic Sub-Area (HSA 903.14), which is part of
the Lower San Luis Hydrologic Area (HA 903.10) and San Luis Rey Hydrologic Unit (HU
903.00).
In Pre-project condition, a portion of the hillside south of the project sheet flows onto the site and
confluences with site flows in a northeasterly direction, eventually converging with surrounding
flows associated with Mirar De Valle and low density residential areas to the south. Flows
discharge to the north of Mirar De Valle via a 3- 8’ (W) x 2’ (H) RCB constructed as part of
Mirar de Valle Improvements (CG 4307). Runoff continues its course north eventually
discharging into Moosa Canyon Creek. Flows continue west on Moosa Canyon Creek eventually
joining with San Luis Rey River which ultimately outlets to the Pacific Ocean.
In the Post-project condition, drainage areas and patterns will not be altered or diverted. Offsite
flows will be bypassed and not comingle with project runoff. Storm water runoff from the project
will flow into Treatment Control BMPs along the sites frontage. The increase of impervious
surfaces will generate additional runoff. However, through the use of Low Impact Development
(LID) practices, Treatment Control BMPs and discharge limiting orifices, flows leaving the site
will be detained to be equal or less than pre-project condition.

2
STORM WATER PLAN REQUIREMENTS 1.1
The site design BMPs, source control and treatment control BMPs utilized to address water
quality and hydromodification requirements have been designed in accordance to the February
2016 County of San Diego BMP Design Manual. Refer to the Storm Water Quality Management
Plan (SWQMP) titled, “Major Storm Water Quality Management Plan (Major SWQMP) for
Shady Oak”, prepared by TSAC Engineering.
VICINITY MAP 1.2

3
HYDROLOGIC METHODOLOGY AND CRITERIA 2.0
This study has been prepared consistent with current County of San Diego’s ordinances and
procedures. All components of the study are designed to convey storm water based on a 100-year
flood event. The anticipated storm runoff has been calculated using the Rational Method based
on the 2003 County of San Diego Hydrology Manual.
The Rational Method (RM) is a mathematical formula used to determine the maximum runoff
rate from a given rainfall. It has particular application in urban storm drainage, where it is used
to estimate peak runoff rates from small urban and rural watersheds for the design of storm
drains and small drainage structures.
The RM formula estimates the peak rate of runoff at any location in a watershed as a function of
the drainage area (A), runoff coefficient (C), and rainfall intensity (I) for a duration equal to the
time of concentration (Tc), which is the time required for water to flow from the most remote
point of the basin to the location being analyzed. The RM formula is expressed as follows:
Q = C I A
Q = peak discharge, cubic feet per second (cfs)
C = runoff coefficient, based on San Diego County Hydrology Manual (Refer to Appendix A)
I = Rainfall intensity (in/hr) (Refer to Appendix A)
A = Drainage Area, (Acres)
The RM formula is based on the assumption that for constant rainfall intensity, the peak
discharge rate at a point will occur when the raindrop that falls at the most upstream point in the
tributary drainage basin arrives at the point of interest.
Runoff coefficients (C) based on land use and soil types were obtained from the San Diego
County Hydrology Manual, Table 3-1. Soil types were determined from the Hydrology Soils

4
Map provided in Appendix A as well as the US Department of Agriculture (USDA) Soil Survey
program. This runoff coefficient was then multiplied by the percentage of total area (A) included
in that class.
The rainfall intensity (I) can be determined from the County of San Diego Intensity-Duration
Design Chart. The 6-hour storm rainfall amount (P6) and 24-hour storm rainfall amount (P24),
were determined from the isopluvial maps provided in Appendix A. Intensity can also be
calculated using the following equation:
I = 7.44 (P6) (D-.645)
I = Intensity (inches/hour)
P6 = 6 Hour Precipitation (inches)
D = Duration in minutes (use Tc)
The Time of Concentration (Tc) is the time required for runoff to flow from the most remote part
of the drainage area to the point of interest. The Tc is composed of two components: initial time
of concentration (Ti) and travel time (Tt). The Ti is the time required for runoff to travel across
the surface of the most remote subarea in the study, or “initial subarea.” The Tt is the time
required for the runoff to flow in a watercourse or series of watercourses from the initial subarea
to the point of interest. For the RM, the Tc at any point within the drainage area is given by:
Tc = Ti + Tt
The Civilcadd/Civil Design Engineering Software, based on the 2003 County of San Diego
Hydrology Manual, was used to determine on-site 100-year, 6-hour peak flow rates.
The Civil Design Hydrology Program is a computer-aided design program in which the user
develops a node-link model of the watershed. The hydrologic model is developed by creating
independent node-link models of each interior drainage basin and linking these sub-models
together at confluence points. The program has the capability to perform calculations for 11

5
hydrologic processes. These processes are assigned code numbers that appear in the results. The
code numbers and their significance are as follows:
Subarea Hydrologic Processes (Codes)
Code 1: Initial subarea input, top of stream
Code 2: Street flow thru subarea, includes subarea runoff
Code 3: Addition of runoff from subarea to stream
Code 4: Street Inlet + parallel street & pipe flow + area
Code 5: Pipeflow travel time (program estimated pipesize)
Code 6: Pipeflow travel time (user specified pipesize)
Code 7: Improved channel travel time (open or box)
Code 8: Irregular channel travel time
Code 9: User specified entry of data at a point
Code 10: Confluence at downstream point in current stream
Code 11: Confluence at main stream
HYDROLOGIC RESULTS 3.0
The 100-year 6-hour peak flow rates for the pre- and post-project conditions can be found in
Table 3.1. Drainage Basin boundaries, and drainage areas can be found on the workmaps
titled,“Pre-Project Hydrologic Workmap for Shady Oak” and “Post-Project Hydrologic
Workmap for Shady Oak”, located in Map Pocket 1 and 2.
Pre-project and post-project hydrologic analyses have been performed for the 100-year storm
event. For the purpose of this drainage report one major drainage basin has been identified,

6
herein referred to as Drainage Basin 100. The proposed project will mimic the existing drainage
patterns, which flow in a northeasterly direction. Onsite runoff will sheet flow northerly into
Biofiltration Basins proposed along the northerly portion of the site. Once treated, the flows will
be piped into a proposed curb inlet on Mirar de Valle used to capture offsite flows.The mainline
will continue its course east until discharging into a channel proposed with the Park Circle
Project, County of San Diego Tract No. 5603.
Table 3.1 summarizes the results of the 100-year pre-project and post-project hydrologic
analyses for Shady Oak.
Table 3.1: Summary of Pre- and Post-Project 100-Year Peak Discharge Rates
Node Number
Area (acres) Q100 (cfs) Q100 with mitigation
(cfs) Tc (min) I (in/hr)
Pre-Project/ Post-Project (undetained)
105/105 31.8/31.8 63.9 /66.1 63.9 14.5/14.5 5.0/5.0
CONCLUSION 4.0 This preliminary drainage report presents the 100-year, 6-hour post-project hydrologic analyses
for the Shady Oak Project. The post project condition peak discharge rates were determined
using the Rational Method based on the hydrologic methodology and criteria described in the
San Diego County Hydrology Manual, dated June 2003.
As designed, the development will not alter the natural drainage path or divert any water from
the existing natural conditions or drainage boundaries. Runoff from the Shady Oak site will sheet
flow into a biofiltration basins along the northerly portion of the site. Street A “Road 19” will be
directed to the biofiltration basins via reverse curb outlet and ditch for treatment.
Old Mirar De Valle is designed as a secondary fire access plan and is only to be constructed if
Street A of Park Circle TM 5603 is not constructed prior to Shady Oak project. A biofiltration
basin has been designed for this alternative.
On and offsite runoff ultimately discharge to the Moosa Canyon Creek. Once treated, onsite
flows will be piped into a proposed curb inlet on Mirar de Valle used to capture offsite flows.

7
The mainline will continue its course east until discharging into a channel associated with the
Park Circle Project, County of San Diego Tract No. 5603.
The basins have been designed to meet the Water Quality and Hydromodification standards. By
treating and detaining flows on-site, downstream impacts such as erosion and sedimentation will
be nonexistent.
The pre and post project drainage area is 31.8 Acres. In the pre-project condition, 63.9 CFS
discharge into the property north of Mirar de Valle via 3-2’ (h) x 8’ (w) box culverts. In the post
project condition, 63.9 CFS (66.1 CFS undetained) will discharge into the box culverts, which
have capacity for 128.5 CFS as shown on the As-Builts (CG 4307, TM 5039-2). The increase in
runoff will be mitigated by detaining within the biofiltration basins. In order to detain 2.2 cfs,
0.06 acre-feet (2613 ft3) of volume is required. This will be accomplished by allowing 6” of
ponding above the Hydromodification volume within the biofiltration basins. Detailed outlet
works will be designed in the Final Engineering stage.
The project site is located south of Moosa Canyon Creek and out of the 100-year flood hazard
area as shown on the FIRM provided in Appendix A.

Appendix A: Hydrologic Reference Material

3674
180
3674
270
3674
360
3674
450
3674
540
3674
630
3674
720
3674
810
3674
900
3674
180
3674
270
3674
360
3674
450
3674
540
3674
630
3674
720
3674
810
3674
900
496400 496490 496580 496670 496760 496850 496940
496400 496490 496580 496670 496760 496850 496940
33° 12' 47'' N11
7° 2
' 19'
' W33° 12' 47'' N
117°
1' 5
7'' W
33° 12' 22'' N
117°
2' 1
9'' W
33° 12' 22'' N
117°
1' 5
7'' W
N
Map projection: Web Mercator Corner coordinates: WGS84 Edge tics: UTM Zone 11N WGS840 150 300 600 900
Feet0 50 100 200 300
MetersMap Scale: 1:3,700 if printed on A portrait (8.5" x 11") sheet.
SOIL TYPE D
SOIL TYPE C


![County of San Diego PRIORITY DEVELOPMENT … DEVELOPMENT PROJECT (PDP) SWQMP iii Template Date: March 16, 2016 Preparation Date: [INSERT DATE OF SWQMP] LUEG:SW PDP SWQMP Table of …](https://img.dokumen.tips/doc/110x75/5ab6e5fe7f8b9a86428e2a17/county-of-san-diego-priority-development-development-project-pdp-swqmp-iii.jpg)