Embed Size (px)
Citation preview
EtherBoy Overview
EtherBoy is a powerful real-time network monitoring and management utility. It provides insights and answers to a large number of network management and usage questions. EtherBoy provides an intuitive real-time display of network activities as well as offering the potential to focus on specific protocol suites, filter network traffic and to produce complete logs of all Ethernet communications.
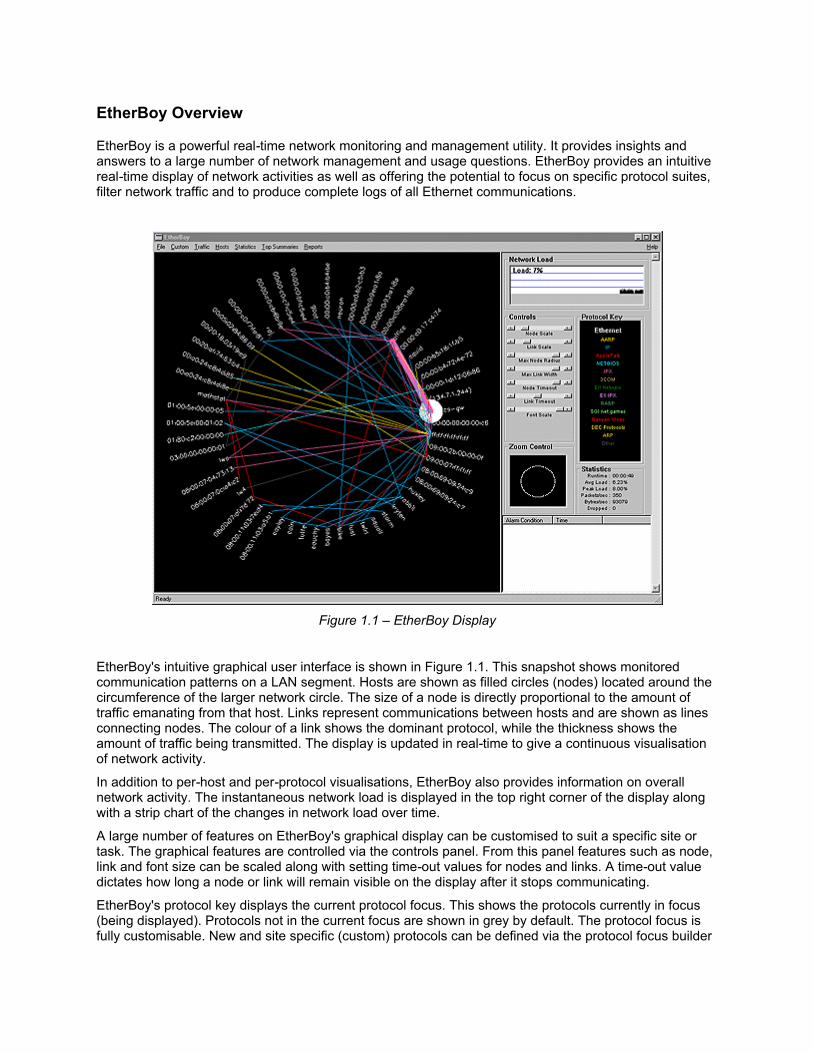
Figure 1.1 – EtherBoy Display
EtherBoy's intuitive graphical user interface is shown in Figure 1.1. This snapshot shows monitored communication patterns on a LAN segment. Hosts are shown as filled circles (nodes) located around the circumference of the larger network circle. The size of a node is directly proportional to the amount of traffic emanating from that host. Links represent communications between hosts and are shown as lines connecting nodes. The colour of a link shows the dominant protocol, while the thickness shows the amount of traffic being transmitted. The display is updated in real-time to give a continuous visualisation of network activity.
In addition to per-host and per-protocol visualisations, EtherBoy also provides information on overall network activity. The instantaneous network load is displayed in the top right corner of the display along with a strip chart of the changes in network load over time.
A large number of features on EtherBoy's graphical display can be customised to suit a specific site or task. The graphical features are controlled via the controls panel. From this panel features such as node, link and font size can be scaled along with setting time-out values for nodes and links. A time-out value dictates how long a node or link will remain visible on the display after it stops communicating.
EtherBoy's protocol key displays the current protocol focus. This shows the protocols currently in focus (being displayed). Protocols not in the current focus are shown in grey by default. The protocol focus is fully customisable. New and site specific (custom) protocols can be defined via the protocol focus builder

built into EtherBoy and added to an existing or new protocol focus.
When a large amount of data is displayed on EtherBoy's graphical display it may become difficult to visualise the data. To solve this problem a Zoom Control window is provided. From the zoom window regions of the larger display can be selected for closer investigation.
The statistics window shows runtime statistics for the EtherBoy application. Statistics are displayed reporting the application runtime, the average and peak network load, the current packets and bytes per second being transmitted and an indication of the efficiency (number of packets dropped) of EtherBoy.
The panel in the bottom right corner of the screen is the alarms panel. It provides a scrolling window of alarm notification strings and timestamps as they occur. Alarms are fully customisable and can be configured for network events including use of a protocol or application as well as a variety of network performance statistics.
EtherBoy records information of all traffic monitored and can provide full communication summaries. These communication summaries can be processed off-line to provide statistics for each monitoring session.
The menu interface provides access to some of EtherBoy's more advanced features. From the menus, EtherBoy can display both the host name and the manufacturer of the network devices. Features such as this can provide invaluable information to the network manager, however, they can also increase the screen complexity. As the complexity of the EtherBoy display grows, it may be necessary to zoom in on a particular area of the display for closer inspection.
Figure 1.2 shows EtherBoy zoomed in on the top right corner of the network display, with both the name of the host and manufacturer displayed.
Figure 1.2 – EtherBoy zooming
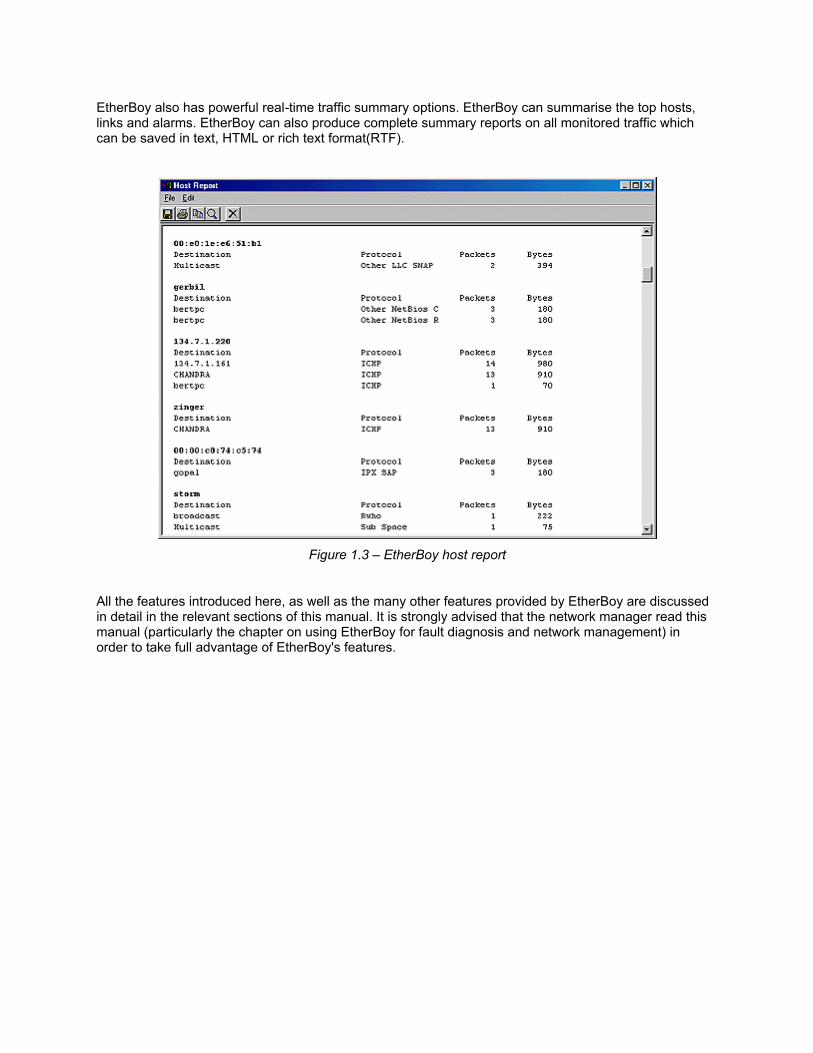
EtherBoy also has powerful real-time traffic summary options. EtherBoy can summarise the top hosts, links and alarms. EtherBoy can also produce complete summary reports on all monitored traffic which can be saved in text, HTML or rich text format(RTF).
Figure 1.3 – EtherBoy host report
All the features introduced here, as well as the many other features provided by EtherBoy are discussed in detail in the relevant sections of this manual. It is strongly advised that the network manager read this manual (particularly the chapter on using EtherBoy for fault diagnosis and network management) in order to take full advantage of EtherBoy's features.

Using EtherBoy
An Overview of the EtherBoy Screen
Load Graph
Protocol Key
Network Statistics
Sliders
Zoom Control
Alarm window
An Overview of the EtherBoy Screen
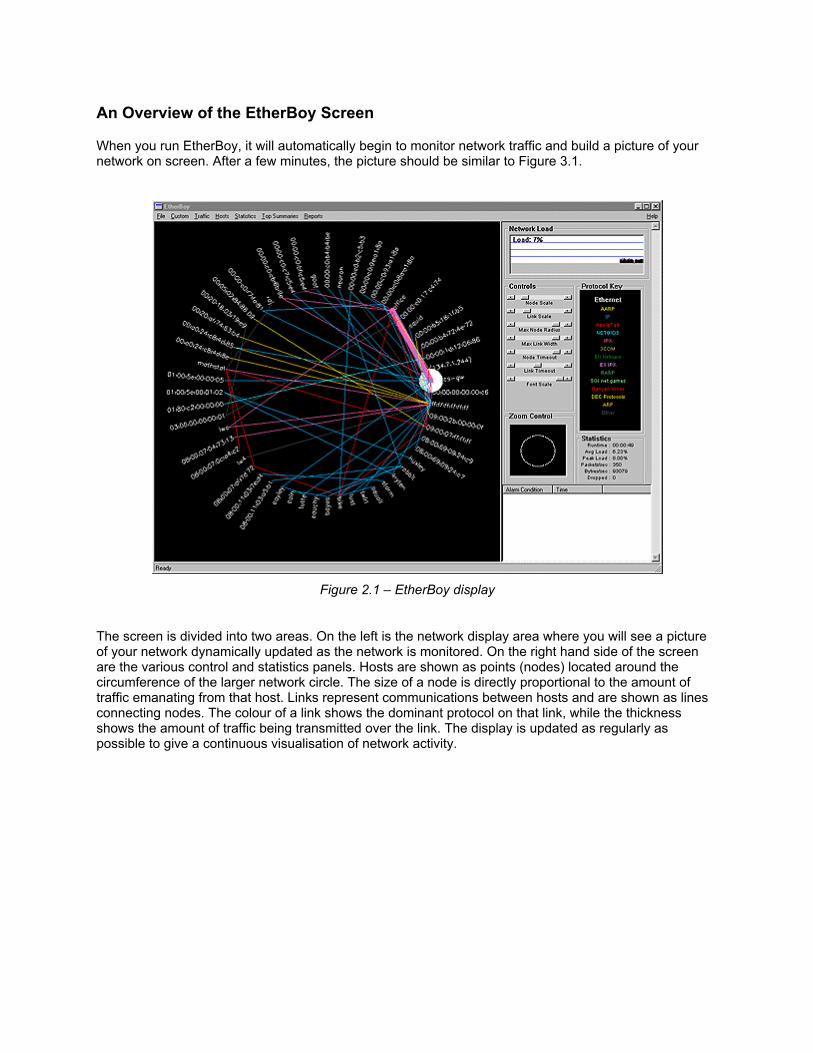
When you run EtherBoy, it will automatically begin to monitor network traffic and build a picture of your network on screen. After a few minutes, the picture should be similar to Figure 3.1.
Figure 2.1 – EtherBoy display
The screen is divided into two areas. On the left is the network display area where you will see a picture of your network dynamically updated as the network is monitored. On the right hand side of the screen are the various control and statistics panels. Hosts are shown as points (nodes) located around the circumference of the larger network circle. The size of a node is directly proportional to the amount of traffic emanating from that host. Links represent communications between hosts and are shown as lines connecting nodes. The colour of a link shows the dominant protocol on that link, while the thickness shows the amount of traffic being transmitted over the link. The display is updated as regularly as possible to give a continuous visualisation of network activity.
Load Graph
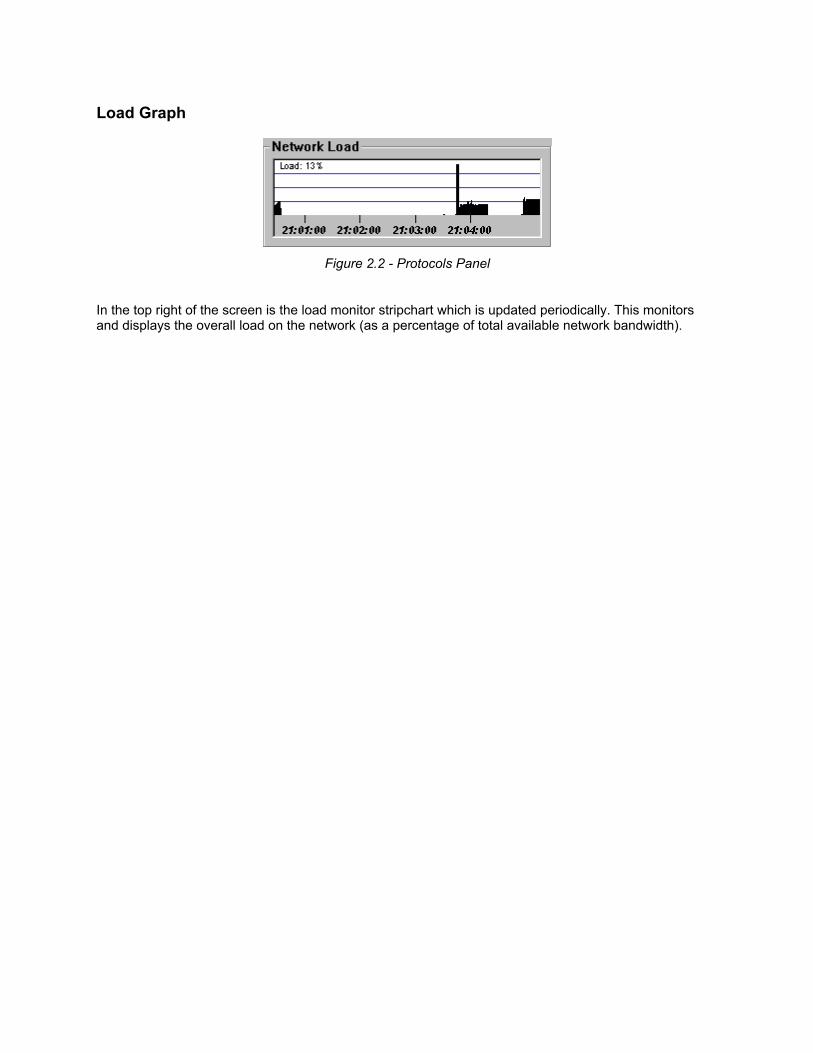
Figure 2.2 - Protocols Panel
In the top right of the screen is the load monitor stripchart which is updated periodically. This monitors and displays the overall load on the network (as a percentage of total available network bandwidth).
Protocol Key
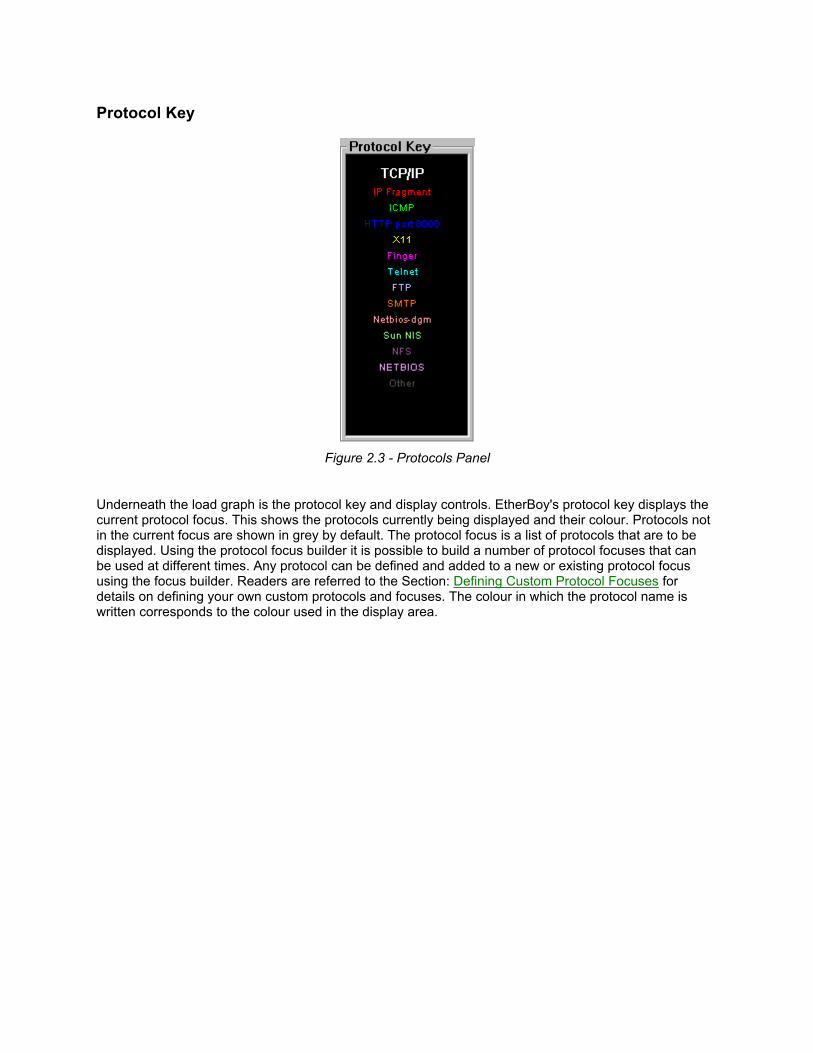
Figure 2.3 - Protocols Panel
Underneath the load graph is the protocol key and display controls. EtherBoy's protocol key displays the current protocol focus. This shows the protocols currently being displayed and their colour. Protocols not in the current focus are shown in grey by default. The protocol focus is a list of protocols that are to be displayed. Using the protocol focus builder it is possible to build a number of protocol focuses that can be used at different times. Any protocol can be defined and added to a new or existing protocol focus using the focus builder. Readers are referred to the Section: Defining Custom Protocol Focuses for details on defining your own custom protocols and focuses. The colour in which the protocol name is written corresponds to the colour used in the display area.
Network Statistics
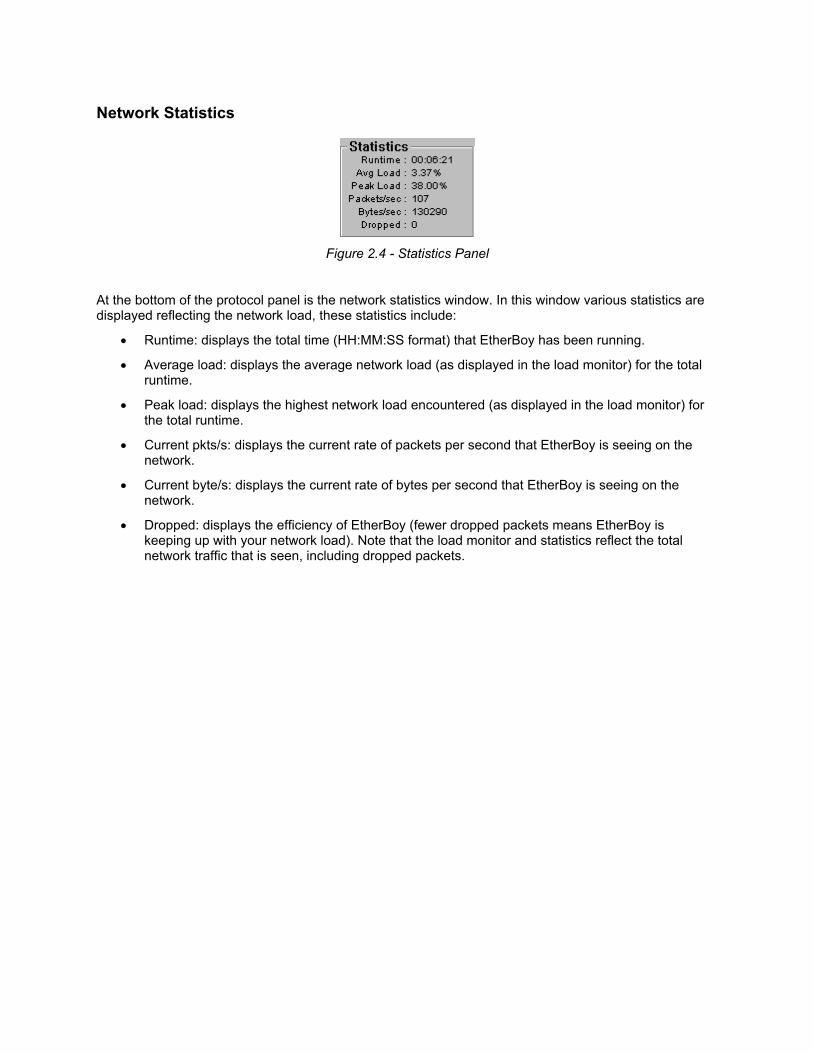
Figure 2.4 - Statistics Panel
At the bottom of the protocol panel is the network statistics window. In this window various statistics are displayed reflecting the network load, these statistics include:
• Runtime: displays the total time (HH:MM:SS format) that EtherBoy has been running.
• Average load: displays the average network load (as displayed in the load monitor) for the total runtime.
• Peak load: displays the highest network load encountered (as displayed in the load monitor) for the total runtime.
• Current pkts/s: displays the current rate of packets per second that EtherBoy is seeing on the network.
• Current byte/s: displays the current rate of bytes per second that EtherBoy is seeing on the network.
• Dropped: displays the efficiency of EtherBoy (fewer dropped packets means EtherBoy is keeping up with your network load). Note that the load monitor and statistics reflect the total network traffic that is seen, including dropped packets.

Sliders
Figure 2.5 - Controls Panel
Next to the protocol key are the various screen control sliders. These enable the user to control the look and feel of EtherBoy's visual display. The Controls provided are as follows:
• Node scale: this effects the size of a host (node) when its is communicating traffic. The size of node is proportional to the number of bytes of data per second being transmitted from the host. Altering this control will scale the size of the host relative to this figure.
• Link scale: this effects the size of a link between nodes when they are communicating. The size of link is proportional to the number of bytes of data per second being transmitted on the link. Altering this control will scale the size of the link relative to this figure.
• Max Node Radius: sets a limit on how large a host can get when it is displayed.
• Max Link Width: sets a limit on how large a link can get when it is displayed.
• Node Time-out: governs how long a node stays visible on the screen after it has stopped transmitting
• Link Time-out: governs how long a link stays visible on the screen after communications ceases.
• Font Scale: controls the size of the font used to display text on the screen

Zoom Control
Figure 2.6 - Zoom Box
Below the Controls is the zoom control. This allows the user to zoom-in on areas of interest and move around the screen when zoomed in. A zoom is selected by clicking the left mouse button and (with the button depressed) dragging the desired box. The box can be moved around the screen using the right mouse button. Clicking the left button again will turn zooming off.

Alarm window
Figure 2.7 - Alarms Window
Below the zoom control is the alarm window. This window continuously displays alarm notification strings and times as alarms occur. Alarm notification strings are defined with an alarm and allow the administrator to know exactly which alarm has activated. Alarms can also be configured to play audio (.wav) files as well as display the notification string. Custom alarms can be defined for most network events. Alarms are defined using the alarms builder (available from the Custom menu). For details on building your own custom alarms users are referred to the "Customising EtherBoy - Custom Alarms" Section.
Menus and Options
EtherBoy can perform many different functions that are explained in this section.
File Menu
Custom Menu
Traffic Menu
Hosts Menu
Statistics Menu
Traffic Summaries Menu
Traffic Reports Menu
File Menu
The File menu allows the user to choose a different a different network adapter to monitor, set the application preferences or quit the program.
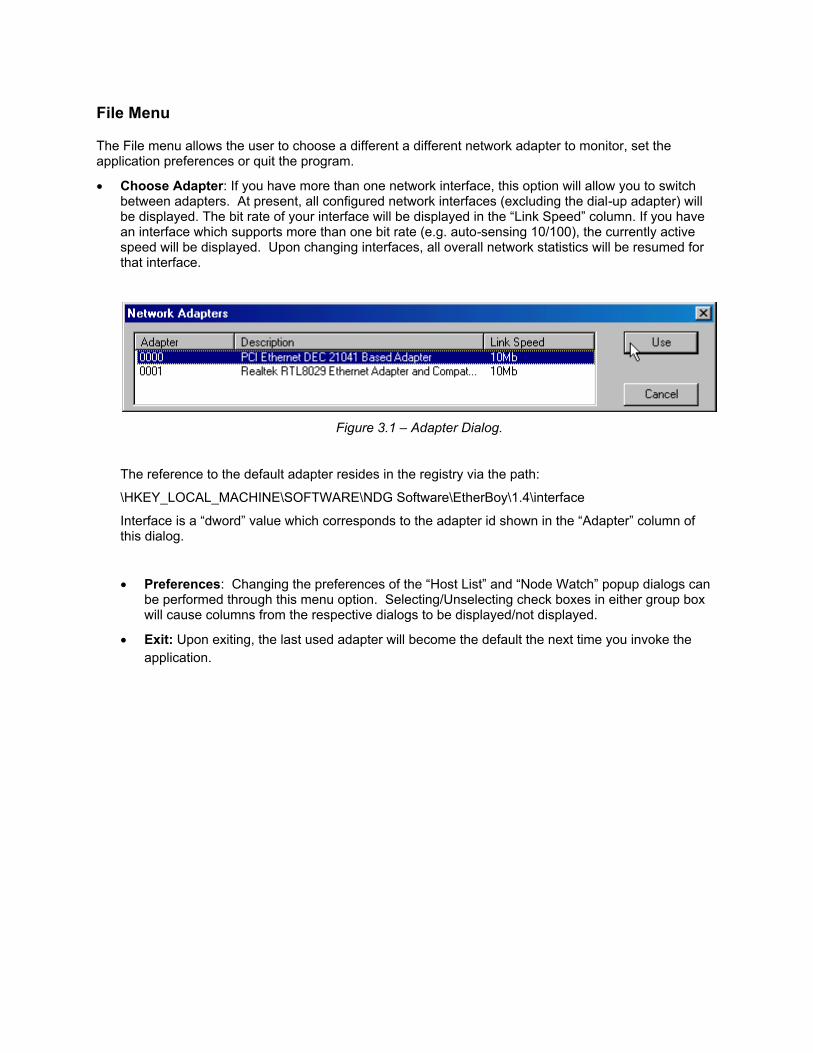
• Choose Adapter: If you have more than one network interface, this option will allow you to switch between adapters. At present, all configured network interfaces (excluding the dial-up adapter) will be displayed. The bit rate of your interface will be displayed in the “Link Speed” column. If you have an interface which supports more than one bit rate (e.g. auto-sensing 10/100), the currently active speed will be displayed. Upon changing interfaces, all overall network statistics will be resumed for that interface.
Figure 3.1 – Adapter Dialog.
The reference to the default adapter resides in the registry via the path:
\HKEY_LOCAL_MACHINE\SOFTWARE\NDG Software\EtherBoy\1.4\interface
Interface is a “dword” value which corresponds to the adapter id shown in the “Adapter” column of this dialog.
• Preferences: Changing the preferences of the “Host List” and “Node Watch” popup dialogs can be performed through this menu option. Selecting/Unselecting check boxes in either group box will cause columns from the respective dialogs to be displayed/not displayed.
• Exit: Upon exiting, the last used adapter will become the default the next time you invoke the application.

Custom Menu
This menu allows access to EtherBoy's user customisation features.
The Protocol Focus Builder allows the user to define a subset of protocols that EtherBoy will use to create the network graph (see Defining Custom Protocol Focuses).
The Alarms Builder allows the user to create alarms base on a variety of network events (see Defining Custom Alarms).
Traffic Menu
The Traffic menu controls how the volume of traffic is represented in the network display. There are two options:
• Packets: If traffic is displayed by packets then packets of any size equally affect the display.
• Bytes: If traffic is displayed by bytes then the size of the packets is taken into account when calculating the traffic flow to be displayed.
Example: Consider a data transfer between two hosts using ftp. Because ftp uses TCP, a reliable service, each data packet sent is acknowledged resulting in approximately the same amount of packets being produced by each host. Since the data packets will generally be larger than the acknowledgements then the volume of traffic (bytes) generated by the sender will be much greater than that of the recipient.

Hosts Menu
The host’s menu controls how the host will appear on the network display. There are five options:
• MAC Address: This option displays hosts by MAC address rather than by name regardless of whether EtherBoy resolved the address or not.
• IP Address: EtherBoy automatically discovers the IP addresses of hosts talking the IP protocol. This option displays hosts using IP by their corresponding IP address. If the host has no associated IP address then the MAC address is shown.
• IP Name: EtherBoy can automatically resolve IP addresses to names. This feature is enabled in the preferences section. If an IP name exists for a host this option will display the name; otherwise the MAC address is displayed.
• Local Name: This option displays hosts by their local name rather than their Ethernet address. EtherBoy resolves the local name by searching the name table database (see link). If no local name exists for a host the MAC address is displayed.
• Best Name: This option tries to display the most meaningful name/address available for any given host and could be thought of as a combination of all the above methods. Names will be applied in the following order: Local name, IP name, IP address, and MAC address.
• Manufacturer: This option toggles the manufacturer names on the network display. When the manufacturer option is enabled the name of the manufacturer of the Ethernet hardware in each host is determined by looking up the manufacturer file if the manufacturer option is turned on then the option will be ticked in the Hosts menu.
Note that because of screen resolution restrictions, manufacturer names may be difficult to read. Using the zoom functions to enlarge a specific screen area can alleviate this. In practice the manufacturers option is only turned on when needed as the additional display overhead slows the redraw rate.
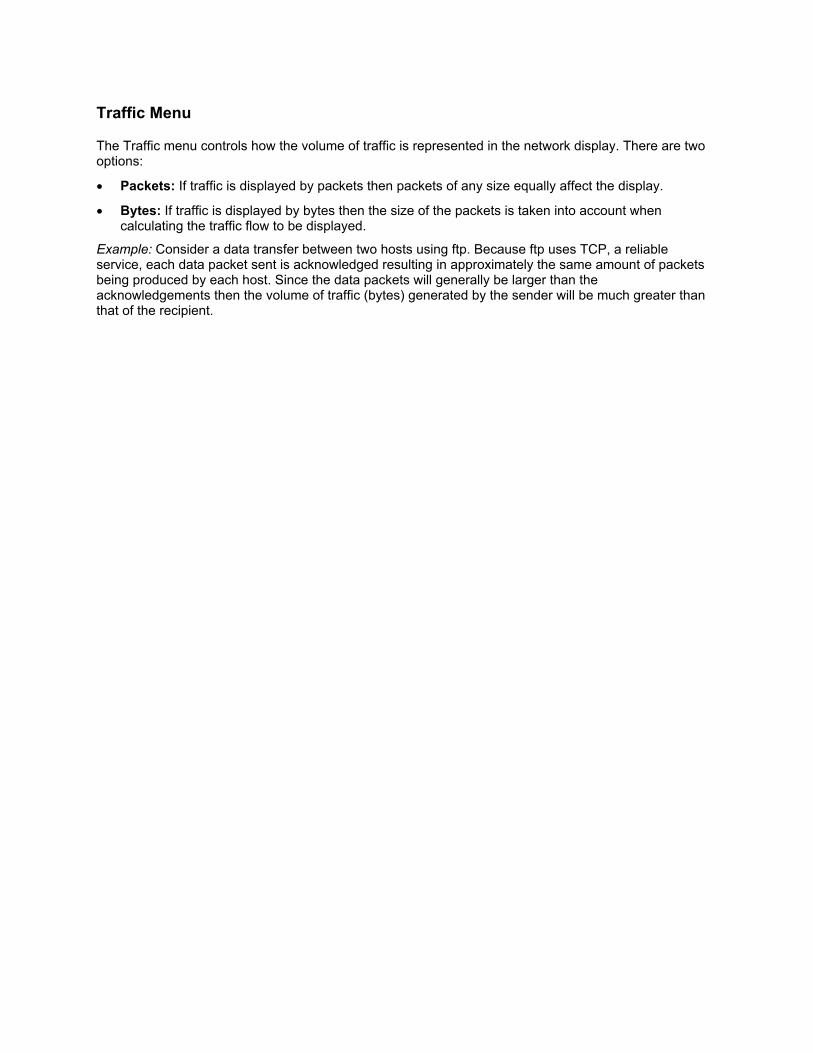
• Host List: This option displays a popup menu containing a summary of all host activity. This table can be sorted by any field by clicking on the appropriate column header.
This window is automatically updated every 15 minutes an update can be forced by clicking on the update button in the toolbar of the window.
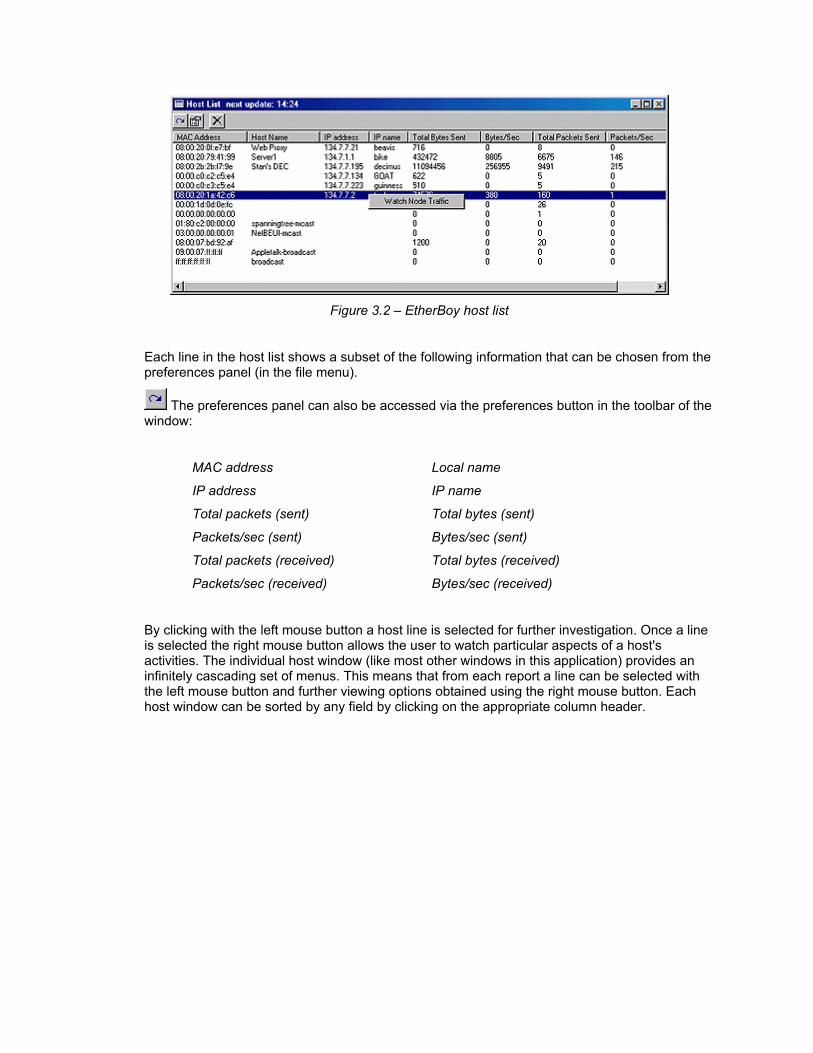
Figure 3.2 – EtherBoy host list
Each line in the host list shows a subset of the following information that can be chosen from the preferences panel (in the file menu).
The preferences panel can also be accessed via the preferences button in the toolbar of the window:
MAC address Local name
IP address IP name
Total packets (sent) Total bytes (sent)
Packets/sec (sent) Bytes/sec (sent)
Total packets (received) Total bytes (received)
Packets/sec (received) Bytes/sec (received)
By clicking with the left mouse button a host line is selected for further investigation. Once a line is selected the right mouse button allows the user to watch particular aspects of a host's activities. The individual host window (like most other windows in this application) provides an infinitely cascading set of menus. This means that from each report a line can be selected with the left mouse button and further viewing options obtained using the right mouse button. Each host window can be sorted by any field by clicking on the appropriate column header.
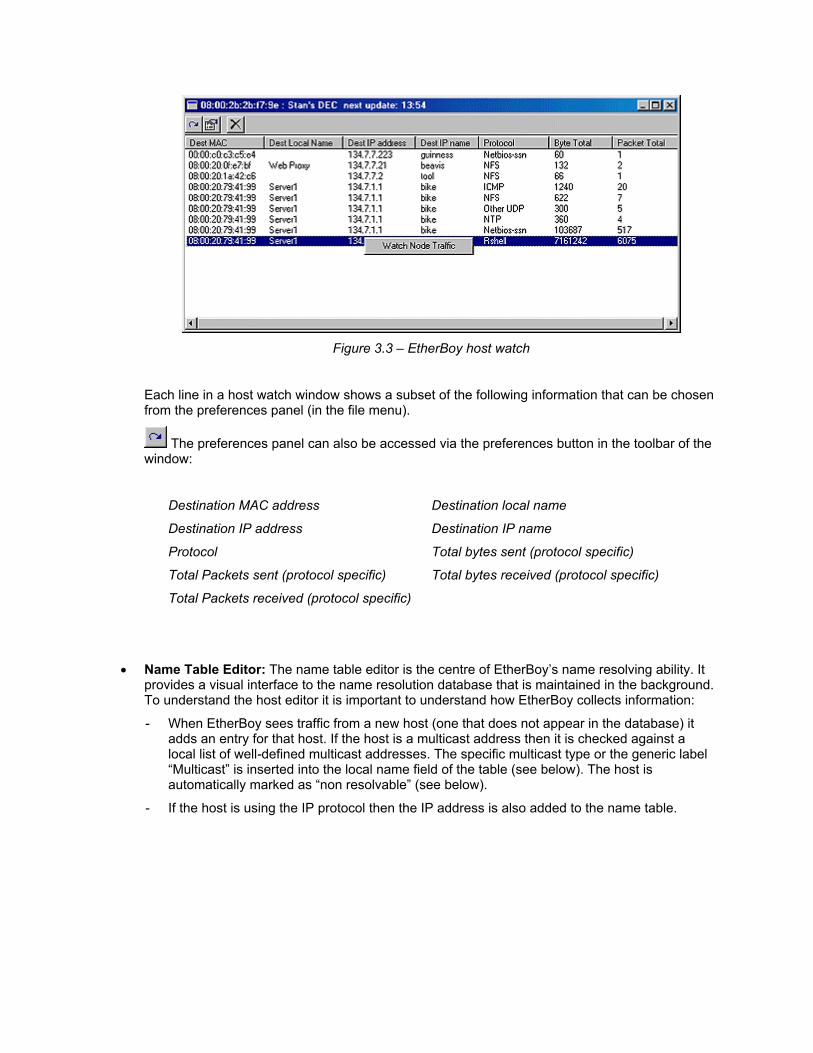
Figure 3.3 – EtherBoy host watch
Each line in a host watch window shows a subset of the following information that can be chosen from the preferences panel (in the file menu).
The preferences panel can also be accessed via the preferences button in the toolbar of the window:
Destination MAC address Destination local name
Destination IP address Destination IP name
Protocol Total bytes sent (protocol specific)
Total Packets sent (protocol specific) Total bytes received (protocol specific)
Total Packets received (protocol specific)
• Name Table Editor: The name table editor is the centre of EtherBoy’s name resolving ability. It provides a visual interface to the name resolution database that is maintained in the background. To understand the host editor it is important to understand how EtherBoy collects information:
- When EtherBoy sees traffic from a new host (one that does not appear in the database) it adds an entry for that host. If the host is a multicast address then it is checked against a local list of well-defined multicast addresses. The specific multicast type or the generic label “Multicast” is inserted into the local name field of the table (see below). The host is automatically marked as “non resolvable” (see below).
- If the host is using the IP protocol then the IP address is also added to the name table.
- If DNS name resolution is enabled in the preferences then EtherBoy will issue a DNS request to try to resolve the IP address to an IP name. If the name resolves then this name is truncated (to the local portion of the name) and added to the table.
- An additional column is also available (referred to as local name) that allows the user to assign an additional, more meaningful name to a given entry.
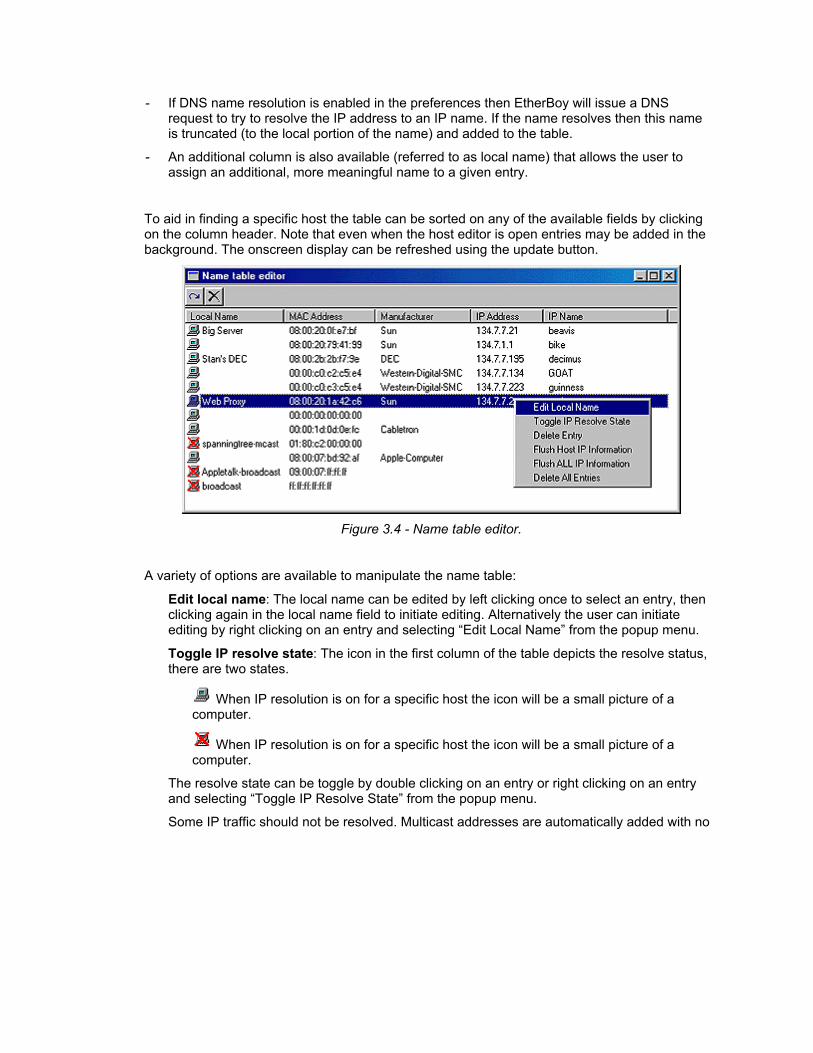
To aid in finding a specific host the table can be sorted on any of the available fields by clicking on the column header. Note that even when the host editor is open entries may be added in the background. The onscreen display can be refreshed using the update button.
Figure 3.4 - Name table editor.
A variety of options are available to manipulate the name table:
Edit local name: The local name can be edited by left clicking once to select an entry, then clicking again in the local name field to initiate editing. Alternatively the user can initiate editing by right clicking on an entry and selecting “Edit Local Name” from the popup menu.
Toggle IP resolve state: The icon in the first column of the table depicts the resolve status, there are two states.
When IP resolution is on for a specific host the icon will be a small picture of a computer.
When IP resolution is on for a specific host the icon will be a small picture of a computer.
The resolve state can be toggle by double clicking on an entry or right clicking on an entry and selecting “Toggle IP Resolve State” from the popup menu.
Some IP traffic should not be resolved. Multicast addresses are automatically added with no

IP resolution. In addition to this IP routers/gateways resolve state should be disabled to prevent erroneous output. If this is not the case then EtherBoy will report the devices IP address as that of the first inbound IP packet coming through the gateway.
Delete Entry: By right clicking on an entry and selecting “Delete Entry” from the popup menu the user can delete any one entry.
Flush Host IP information: Unlike MAC addresses IP addresses/names are configurable and this information may change over time. By selection this option from the popup menu the user can flush all IP information (address and name) from the name table forcing EtherBoy to rediscover IP names and addresses.
Flush All IP information: By selecting this option from the popup menu the user can flush all IP information from the database forcing EtherBoy to rediscover IP names and addresses. A final warning dialog will appear before the information is flushed.
Delete All entries: By selecting this option the user can remove all entries from the name database. A final warning dialog will appear before the information is deleted.

Statistics Menu
The statistics menu contains options that affect the time period that the network display reflects. These options are:
• Dynamic: In dynamic mode EtherBoy shows the current traffic within a time frame specified with the sliders in the control panel (see link). Once the hosts and/or links have exceeded this time period without producing any traffic they timeout and disappear.
• Cumulative: In cumulative mode all traffic is shown since EtherBoy was started. This allows the user to see all traffic and hosts that have been active during the current run.

Traffic Summaries Menu
This menu allows access to summaries of data. For all menus in this section the left mouse button selects a line of interest and the right mouse button selects further information for the line.
• Top Senders: This option shows the top hosts which transmit the most traffic. Further host information can be obtained by clicking the left mouse button.
All menus are infinitely cascading i.e. from each menu you can continue to click with the mouse to obtain further viewing options for data.
Figure 3.5 – EtherBoy top senders.
• Top Receivers: This option shows the top hosts which receive the most traffic. Further host information can be obtained by clicking the left mouse button.
All menus are infinitely cascading i.e. from each menu you can continue to click with the mouse to obtain further viewing options for data.
• Top Links: This option shows top links based upon the number of bytes traversing the link. By clicking with the mouse further information for the host can be obtained including:
- Source hosts' traffic
- Destination hosts' traffic
All menus are infinitely cascading i.e. from each menu you can continue to click with the mouse to obtain further viewing options for data.
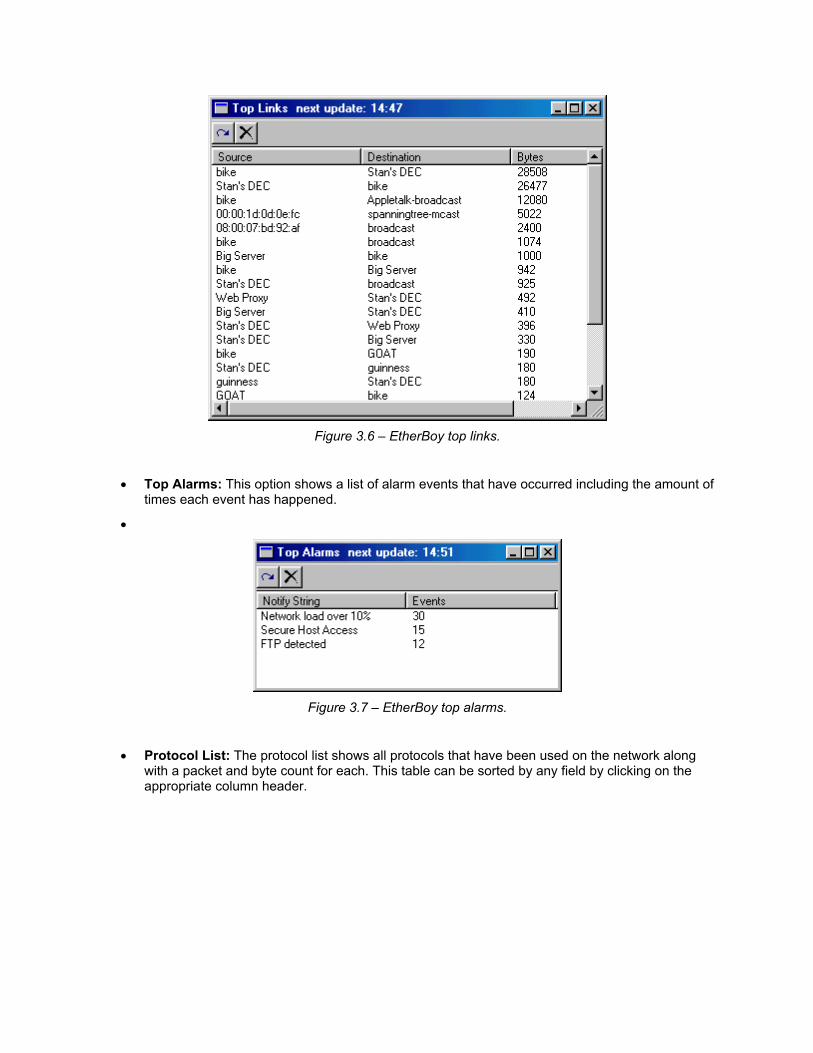
Figure 3.6 – EtherBoy top links.
• Top Alarms: This option shows a list of alarm events that have occurred including the amount of times each event has happened.
•
Figure 3.7 – EtherBoy top alarms.
• Protocol List: The protocol list shows all protocols that have been used on the network along with a packet and byte count for each. This table can be sorted by any field by clicking on the appropriate column header.
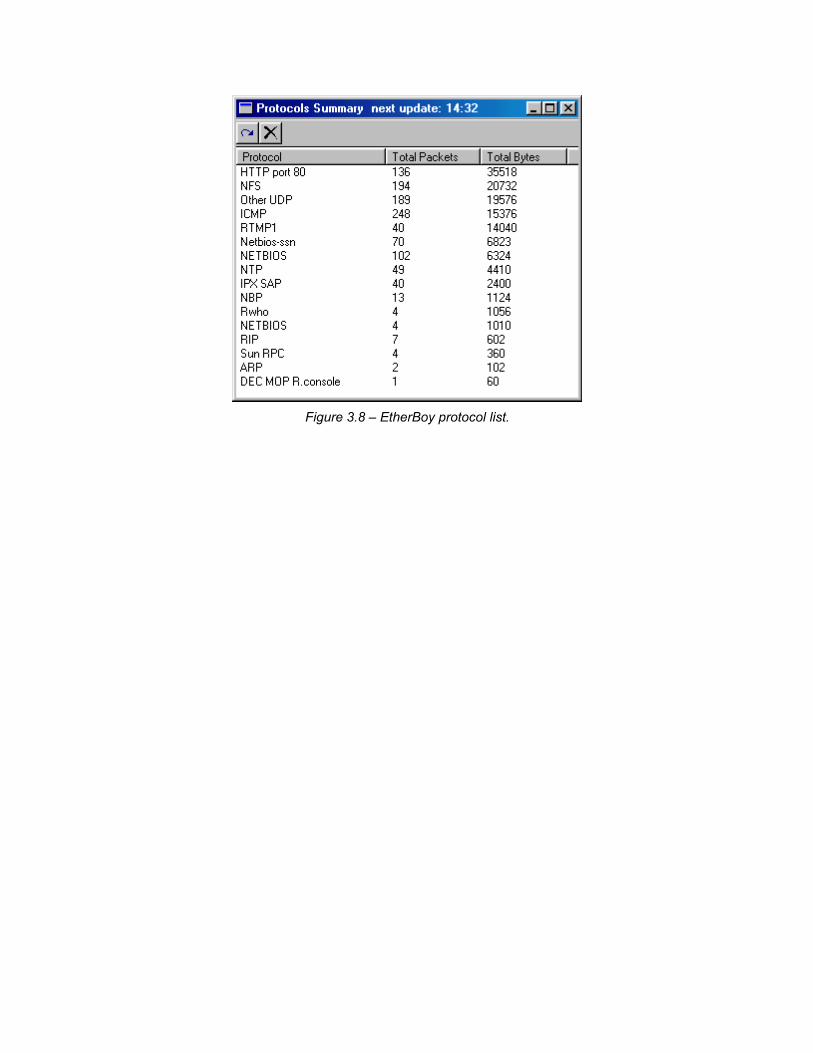
Figure 3.8 – EtherBoy protocol list.
Traffic Reports Menu
Many different reports (described below) can be generated. On any report, the File menu can be used to print and save the report. The report can be saved as text (ASCII), HTML, or RTF (Rich Text Format). There is also an Edit menu that features various options to find, copy, etc. some or all of the report.
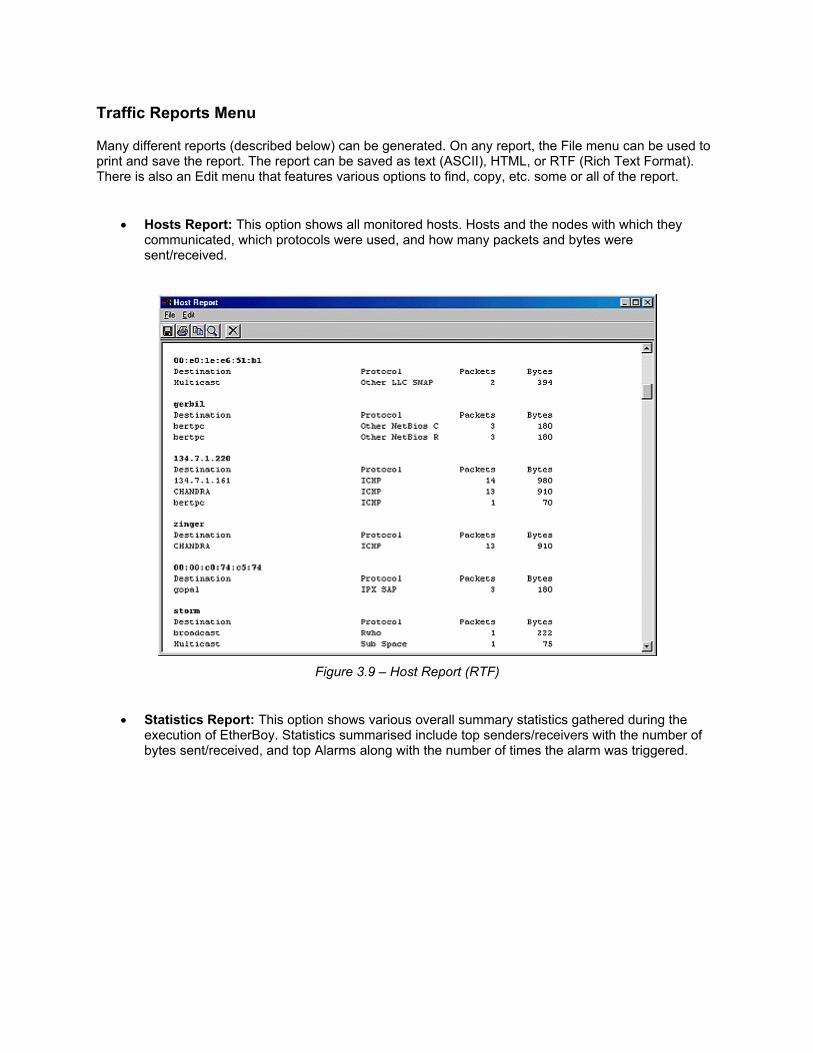
• Hosts Report: This option shows all monitored hosts. Hosts and the nodes with which they communicated, which protocols were used, and how many packets and bytes were sent/received.
Figure 3.9 – Host Report (RTF)
• Statistics Report: This option shows various overall summary statistics gathered during the execution of EtherBoy. Statistics summarised include top senders/receivers with the number of bytes sent/received, and top Alarms along with the number of times the alarm was triggered.

Figure 3.10 – Statistics Report (RTF)
• Alarms Report: This option shows all alarms triggered during the execution of EtherBoy. Alarm notify strings are displayed and the time and date when the alarm was triggered.
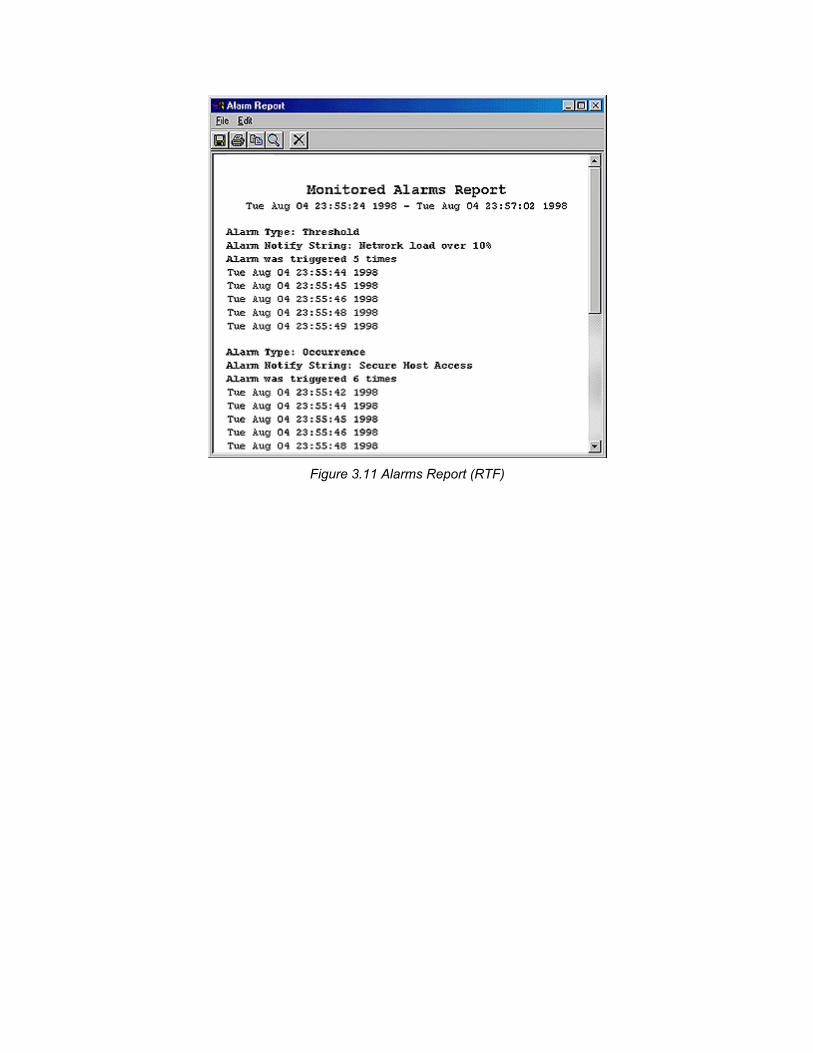
Figure 3.11 Alarms Report (RTF)

Customising EtherBoy
EtherBoy is highly configurable. By using various controls you are able to modify a variety of settings affecting the appearance and performance of EtherBoy on your system.
Defining Custom Protocols
Defining Custom Protocols
EtherBoy examines all traffic. It learns about the various protocols via a protocol definition file (called root.pdl) which is written using NDG Software's Protocol Definition Language (PDL).
The language has two statements these are: primitive and protocol. The primitive statement is used to assign a tag to a value within a protocol. The syntax is:
primitive tag_name:tag_value "string"
The protocol definition begins with a tag name that is used to identify the primitive and can be used in further definitions. The tag value specifies a symbol or value to be searched for in the packet to identify this protocol. The string is for identification of the protocols by the user and is the string that will appear in the Custom Protocol Focus Builder.
Primitives are primarily used to define tags to be used in protocol definitions. A primitive by itself does not constitute a protocol definition. Here are some example primitive definitions:
primitive TELNET:23 "Telnet"
In this primitive definition the tag is TELNET and the tag's value is 23 (the port number for telnet). This tag value is important since it is the value that will be searched for to identify TELNET packets.
primitive ARP:0x806 "ARP"primitive DECNET:0x6000, 0x6009 "DEC Protocols"primitive BANYAN:0xbad, 0xbaf "Banyan Vines"primitive EII_IPX:0x8037 "EII IPX"/* some IP primitives */primitive ICMP:1 "ICMP"primitive IGMP:2 "IGMP"primitive FTP:20,21 "FTP"primitive SMTP:25 "Mail"primitive HTTP:80,81 "HTTP"primitive HTTP_2:8000, 8080 "HTTP"/* some IPX primitives */primitive SAP:4 "SAP"primitive SPX:5 "SPX"primitive NCP:11 "NCP"
The HTTP definitions show how to define a range of values for the tag value. Ranges are used when a protocol is identified by a set of numbers within a range. Ranges must be continuous which is why two tags are needed for HTTP, one defining port numbers 80 and 81 (HTTP) and another defining port numbers 8000 through to 8080 (HTTP_2).
The protocol statement is used to define protocols and to provide classification rules for packets. The syntax of a protocol definition is as follows:
protocol tag_name:tag_value "String" header_size{
byte | word:location_value tag_name...
}

The protocol definition begins with a tag name that is used to identify the protocol and can be used in further definitions. The tag_value specifies a symbol or value to be searched for in the packet to identify this protocol. The string is for identification of the protocols by the user and is the string that will appear in the Custom Protocol Focus Builder. The header size is supplied as a check for the packet parser when parsing incoming packets.
Here are some examples of protocol definitions:
protocol IP:0x800 "IP" 20{
byte:9 ICMPbyte:9 IGMPbyte:9 TCPbyte:9 UDP
}
The first line defines a protocol with a name tag of IP and a name value 0x800. The identification string is "IP" and the IP header has a size of 20 bytes. Inside the IP header are further sub-protocols and primitives called ICMP, IGMP, TCP and UDP. These sub-protocols will have either protocol or primitive definitions themselves defining tag values that identify the sub-protocols contained within each IP packet. The byte:9 in the specification denotes the primary offset and size of the value to check from the beginning of this protocol specification. In other words we are to compare a byte value 9 bytes into the IP header looking for a byte containing the tag value of ICMP, IGMP, TCP or UDP. The tag value for each of these is contained within their specification.
Given the previous definition of IP consider the following definition of TCP.
protocol TCP:0x6 "TCP" 20{
word:0,2 FTPword:0,2 TELNETword:0,2 SMTPword:0,2 HTTPword:0,2 HTTP_2...
}
From this definition we can see that the tag value for TCP is 0x6 and that the TCP header is 20 bytes long. The word:0,2 in the specification specifies that tag value for sub-protocols can be found at 2 locations called the primary offset or secondary offset. The primary offset is 0 meaning that the tag value for FTP, TELNET etc. can be found by doing a word sized comparison (16 bits) starting at byte 0 (the primary offset) or 2 (the secondary offset) inside the TCP header. The tag value to look for at these offsets can be found along with the definitions of FTP, TELNET etc. As further examples what follows are part of the specification for UDP and IPX.
The pdl language described here is very versatile and will allow the user to incorporate their own custom protocol specifications into EtherBoy. Complete definitions can be found in the root.pdl file. Once a new protocol has been included into this file it will automatically appear in the protocol focus builder for inclusion into EtherBoy's in the visual display as well all reports.
Defining Custom Protocol Focuses
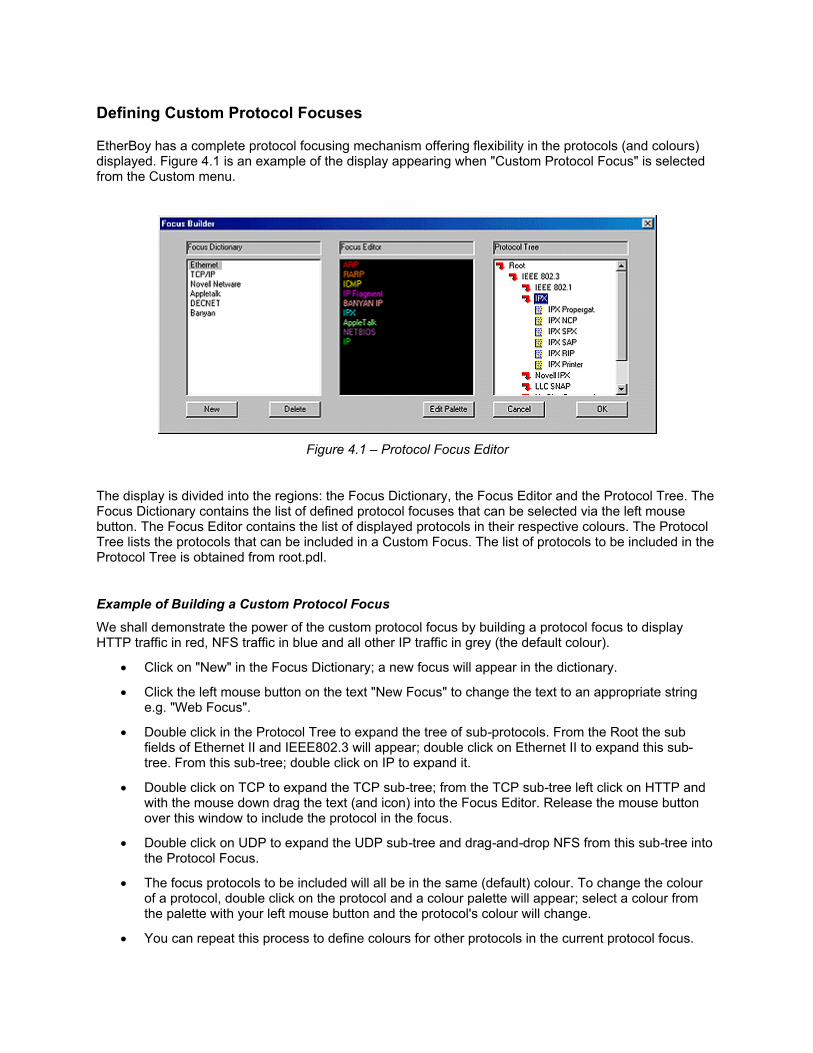
EtherBoy has a complete protocol focusing mechanism offering flexibility in the protocols (and colours) displayed. Figure 4.1 is an example of the display appearing when "Custom Protocol Focus" is selected from the Custom menu.
Figure 4.1 – Protocol Focus Editor
The display is divided into the regions: the Focus Dictionary, the Focus Editor and the Protocol Tree. The Focus Dictionary contains the list of defined protocol focuses that can be selected via the left mouse button. The Focus Editor contains the list of displayed protocols in their respective colours. The Protocol Tree lists the protocols that can be included in a Custom Focus. The list of protocols to be included in the Protocol Tree is obtained from root.pdl.
Example of Building a Custom Protocol FocusWe shall demonstrate the power of the custom protocol focus by building a protocol focus to display HTTP traffic in red, NFS traffic in blue and all other IP traffic in grey (the default colour).
• Click on "New" in the Focus Dictionary; a new focus will appear in the dictionary.
• Click the left mouse button on the text "New Focus" to change the text to an appropriate string e.g. "Web Focus".
• Double click in the Protocol Tree to expand the tree of sub-protocols. From the Root the sub fields of Ethernet II and IEEE802.3 will appear; double click on Ethernet II to expand this sub-tree. From this sub-tree; double click on IP to expand it.
• Double click on TCP to expand the TCP sub-tree; from the TCP sub-tree left click on HTTP and with the mouse down drag the text (and icon) into the Focus Editor. Release the mouse button over this window to include the protocol in the focus.
• Double click on UDP to expand the UDP sub-tree and drag-and-drop NFS from this sub-tree into the Protocol Focus.
• The focus protocols to be included will all be in the same (default) colour. To change the colour of a protocol, double click on the protocol and a colour palette will appear; select a colour from the palette with your left mouse button and the protocol's colour will change.
• You can repeat this process to define colours for other protocols in the current protocol focus.

• At this point you have defined your custom protocol focus. Click OK (bottom left of the display) to activate the current protocol focus.

Defining Custom Colours for Protocol Focuses
When using the protocol focus builder protocols can be defined to appear in any colour from the colour palette. The palette itself can be customised as follows.
• Select Edit Palette from the focus editor region; the palette editor appears.
• Select one of the squares from the colour palette to be modified. Select a black square (bottom of the palette) if you wish to add a colour to the palette. The palette editor is shown in figure 4.2
Figure 4.2 - Protocol Focus Palette Editor
• Adjust the red, green and blue controls to achieve the desired colour.
• When satisfied click the OK button to include the colour at the selected position in the palette.
Defining Custom Alarms
EtherBoy has a flexible and powerful alarm mechanism. Alarms can be generated for a number of reasons including:
• access to a host
• use of a protocol
• a network (or traffic) variable exceeding a threshold.
Proper use of EtherBoy's alarm mechanism can assist in maintaining network performance, improving network configuration and capacity planning as well as its obvious potential for improving network security.
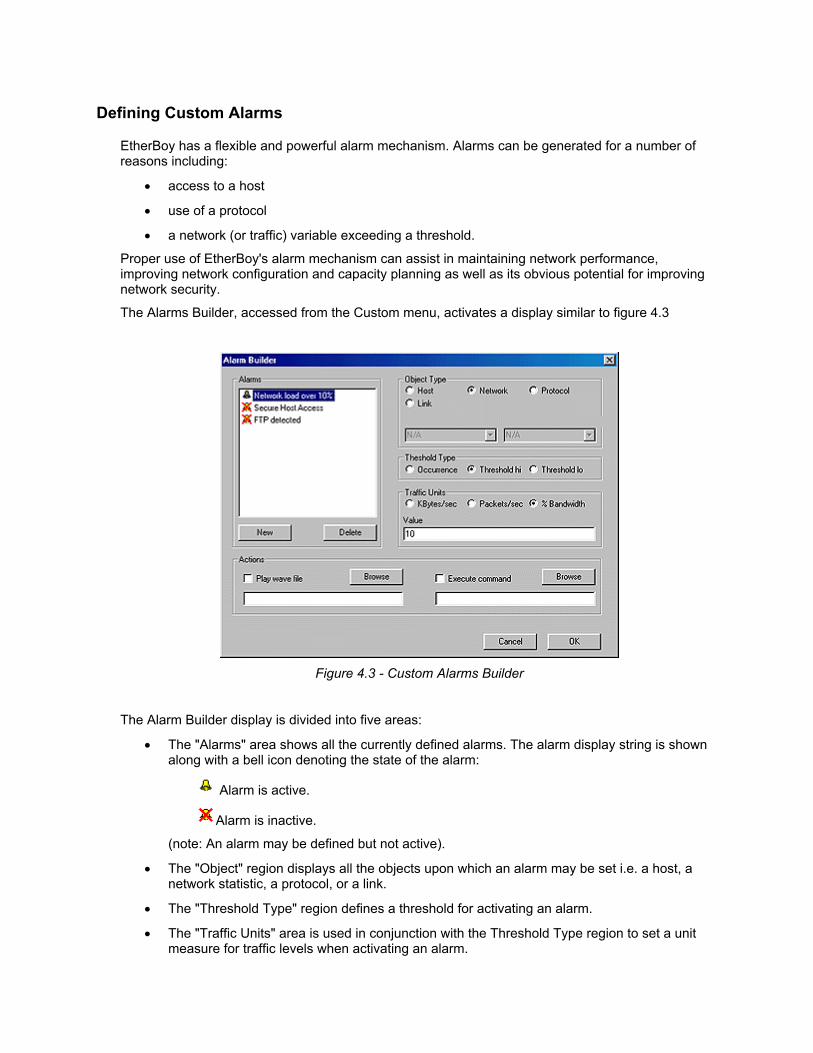
The Alarms Builder, accessed from the Custom menu, activates a display similar to figure 4.3
Figure 4.3 - Custom Alarms Builder
The Alarm Builder display is divided into five areas:
• The "Alarms" area shows all the currently defined alarms. The alarm display string is shown along with a bell icon denoting the state of the alarm:
Alarm is active.
Alarm is inactive.
(note: An alarm may be defined but not active).
• The "Object" region displays all the objects upon which an alarm may be set i.e. a host, a network statistic, a protocol, or a link.
• The "Threshold Type" region defines a threshold for activating an alarm.
• The "Traffic Units" area is used in conjunction with the Threshold Type region to set a unit measure for traffic levels when activating an alarm.

• The "Actions" region allows the user to specify an audio file (.wav file) or command to run if the alarm is activated.

Example1: Host Alarm
In the first example consider setting an alarm signal when a particular host becomes too busy.
• Click on "New" in the Alarms box. A new alarm will appear with the text "New Alarm" and the activated (bell) icon turned off.
• Slowly double click the left mouse button on "New Alarm" to change the text to an appropriate string e.g. "Disk server very busy".
• Click on the Host button in the Object Type region thus highlighting a Name/Address field ready for a value to be entered.
• Move to the Name/Address field and enter the host's name (a local name, complete domain name or an IP address may be entered).
• Move to the Traffic Units region and select the units for the value field: Kbytes/sec, packets/sec or percentage of bandwidth being generated by the individual host.
• After specifying the units, enter a value.
• After this you may optionally set an audio alarm (.wav file) or a command to run, but at this point the alarm is defined.
• Double click on the bell icon in the Alarms region to turn the alarm on and then confirm "OK" (bottom right of the alarm builder screen) to complete the definition and activate the alarm.
• When triggered the alarm message (entered in the Alarms Region) is displayed in the Alarms section of the main window along with the time the alarm was triggered (i.e. the event occurred).

Example 2: Network Alarm
In the next example we shall define an alarm to activate if the network load exceeds 40% of capacity.
• Click on "New" in the Alarms box. A new alarm will appear with the text "New Alarm" and the activated (bell) icon turned off.
• Slowly double click the left mouse button on "New Alarm" to change the text to an appropriate string e.g. "Net Load over 40%".
• After typing the text click the left mouse button on the Network button in the Object Type region. Selecting Network will cause the Traffic type region to automatically select a threshold high and the Traffic units region will automatically select KBytes/sec as the units and highlight the value field ready for a value.
• Change the traffic units if necessary (e.g.%Bandwidth) and enter a value e.g 40 into the value field.
• You may optionally set an audio alarm (.wav file) or a command to run, but at this point the alarm is defined.
• Double click on the bell icon in the Alarms region to turn the alarm on and then confirm "OK" (bottom right of the alarm builder screen) to complete the definition and activate the alarm.

Common Faults FAQ
Here are some common faults that you may encounter whilst using EtherBoy. If you have any suggestions or problems you encounter that are not in this list, please forward them to [email protected]
Why does it say Default adapter is currently invalid for my card?
Why does it sometimes "blue screen" if I change adapter or exit?
Why can't I monitor using my dialup adapter?
Can I print the results of the popup windows?
Why does EtherBoy assign the wrong IP address to my router?
Protocol X is being used on the network but is never displayed?
Can I add my own multicast addresses?
Cal I add more manufacturers?

Why does it say Default adapter is currently invalid for my card?
There are several possibilities that cause this problem to arise. The most common cause of this error is that the default adapter is not an Ethernet card, that is, your default system adapter is Token Ring, RAS, FDDI etc. We are working towards adding support for these devices, but at present only Ethernet devices are support (including Fast Ethernet).
Under NT4.0, you must install and use EtherBoy as administrator or equivalent. This is to protect administrators from “normal” users gaining access to the promiscuous Ethernet driver, and ultimately raw network traffic.
Also under NT4.0, if you have previously installed any products from NDG Software (excluding GeoBoy), you may need to manually remove a registry key in the Service Manager’s sub-tree. This is because previous versions of the install script do not automatically remove this key, and references to the old driver are left behind. To fix this problem run regedit and remove this key:
HKEY_LOCAL_MACHINE\SYSTEM\CurrentControlSet\Services\NDISHOOK\

Why does it sometimes "blue screen" if I change adapter or exit?
The driver mechanism employed by 95/98 and NT4.0 are different. This problem will only occur under 95/98 as they use a dynamically loading VxD which has a known fault. This problem may after running EtherBoy for a number of hours and then quitting the application or selecting a different adapter. At present we do not have a fix, and unfortunately you will have to reboot after this occurs. Please stay up to date on our web site (http://www.ndgsoftware.com) for further developments.

Why can't I monitor using my dialup adapter?
In previous versions of EtherBoy (V1.2) it was possible to monitor Dialup devices, but since then the driver has undergone some radical improvements (e.g. dynamic loading and major internal efficiency improvements). One of the side effects of the new driver was the loss of being able to monitor Dialup adapters. This will be fixed in a future release.

Can I print the results of the popup windows?
Unfortunately it is currently not possible to print or save as text from any of the popup windows (host list, watch node, top x, etc.). This feature will be added in a future version.

Why does EtherBoy assign the wrong IP address to my router?
EtherBoy maps IP addresses onto MAC addresses by inspecting the packets it sees. Because IP addresses in the packet represent the ultimate source/destination hosts EtherBoy will incorrectly assign the source IP address of the first IP packet introduced to the local network by the router.
To fix this problem IP resolution should be disabled for routing devices on your network. This can be achieved using the name table editor.

Protocol X is being used on the network but is never displayed?
EtherBoy chooses the colour of the links in the network display by assigning the colour of the most dominant protocol listed in the key. Unfortunately if you are trying to spot a low bandwidth protocol it may well be overridden by the catchall “Other” case (grey).
At present there is no way around this other than to set alarms on the protocols of interest. The ability to toggle the other entry on/off.

Can I add my own multicast addresses?
Yes. The multicast addresses are read from a file called “multi” in the application directory. You can add extra multicast addresses by editing this file.

Cal I add more manufacturers?
Yes. The manufacturer codes are read from a file called “manf” in the application directory. You can add extra manufacturer codes by editing this file.