Embed Size (px)
Citation preview

Prin
ted
by T
aco
Vis
ions
Pvt
. Ltd
.w
ww
.taco
visi
ons.
com

C C MM YY K
C C MM YY K C C MM YY K
1 1
Board of Directors 02
3600 - The Business of Creation 03
Chairman’s Letter 04
Performance at a Glance 06
Key Highlights 07
Directors’ Report 08
Annexure To Directors’ Report 12
All Round Solutions 14
Management Discussion and Analysis 15
Financial Highlights 25
Corporate Governance 26
Auditors’ Report 37
Balance Sheet 40
Profit and Loss Account 41
Schedule to & Forming Part of Accounts 42
Balance Sheet Abstract 62
Cash Flow Statement 63
Consolidated Financial Statements
Statement Under Section 212 of the Companies Act, 64 1956 relating to subsidiary companies
Auditors’ Report 65
Consolidated Balance Sheet 66
Consolidated Profit and Loss Account 67
Consolidated Schedule to & Forming Part of Accounts 68
Consolidated Cash Flow Statement 88
29th Annual Report and Audited Statement of Accounts for the year ended March 31, 2010
C O N T E N T S

22
E X E C U T I V E M A N A G E M E N T T E A MMr. Kamal K. Jain President & CFO
Mr. Dinesh B. Patel President & CEO (Domestic - TL Projects)
Mr. B. K. Satish President & CEO (Distribution Projects)
Mr. N. Sai Mohan President & CEO (Overseas Projects)
Mr. Gyan Prakash President & CEO (Pipeline Projects)
Mr. M. A. Baraiya Head - HR
Company Secretary Mr. Bajrang Ramdharani
Auditors M/s. Kishan M. Mehta & Co., Ahmedabad M/s. Deloitte Haskins & Sells, Ahmedabad
Legal Advisor M/s. Singhi & Co., Ahmedabad
B A N K E R S Indian BankOriental Bank of Commerce Union Bank of IndiaState Bank of IndiaEXIM Bank ICICI Bank Ltd.IDBI Bank Ltd.Standard Chartered BankBNP Paribas, Abu DhabiCommercial Bank of Kuwait
F A C T O R Y & R E G I S T E R E D O F F I C E Plot No. 101, Part III, G.I.D.C. Estate, Sector 28, Gandhinagar - 382 028, Gujarat, India. Tel No.: 91 - 79 - 23214000 Fax No.: 91 - 79 - 23211966 / 68 / 71 Email: [email protected]
C O R P O R A T E O F F I C E ‘KALPATARU SYNERGY’ , 8th Floor, Opp. Grand Hyatt Hotel Vakola, Santacruz(E) Mumbai - 400 055, India. Tel. No.: 91 - 22 - 30645000 Fax No : 91 - 22 - 30643131
W E B S I T E www.kalpatarupower.com www.jmcprojects.com www.kalpataru.com www.ssll.in
Mr. Mofatraj P. Munot , ChairmanFounder, Promoter and Chairman of Kalpataru Group with over 45 years of experience in the field of Real Estate and Property Development, Civil Contracting & various industries.
Mr. Mahendra G. Punatar, Independent Director (Structural Engineering) from University of Michigan, USA with over 50 years of experience in transmission line towers.
Mr. K. V. Mani, DirectorBachelor of Engineering and MBA. Has 45 years of experience in Transmission industry, mainly Construction, Project Management and Overseas Marketing.
Mr. Pankaj Sachdeva , Managing Director B.E (Hons) degree in Electrical Engineering and has over 26 years of Product Marketing and Project Execution experience in Power Systems Sector.
Mr. Parag Munot, Promoter DirectorMBA, Carnegie Mellon University, USA with 17 years of experience, is responsible for the group Real Estate andProperty Development business. Presently Managing Director of Kalpataru Ltd.
Mr. Manish Mohnot, Executive DirectorChartered Accountant and an ICWA having a rich experience of 15 years in consulting in the field of Oil, Gas, Power and other sectors related to Infrastructure. He is also the Director of JMC Projects (India) Ltd. and Shree Shubham Logistics Ltd.
Mr. Sajjanraj Mehta, Independent DirectorChartered Accountant with over 35 years of experience.A Consultant in the field of Foreign Exchange, Taxation and Corporate Affairs and Strategy.
Mr. Vimal Bhandari, Independent DirectorChartered Accountant with an experience of more than 25 years in Financial Services sector. He was Executive Director of IL&FS Ltd. Presently, he is Country Manager - Aegon India.
Mr. Narayan Seshadri, Independent DirectorChartered Accountant with an experience of 28 years in the field of finance, account, tax and business consulting. Presently, he is the Chairman and CEO of Halcyon Resources and Management Pvt. Ltd.
Mr. S. P. Talwar, Independent Director Certified Associate of the Indian Institute of Bankers and Member of Indian Council of Arbitration. He is a Law Graduate and Arts honors. He is a hard core Banker and retired as deputy Governor, RBI. He is a Senior Advisor of Yes Bank Ltd.
Mr. Shitin Desai, Independent Director (upto 10.05.2010)Experience in excess of 28 years in Financial Services sector.He is currently the Executive Vice Chairman of DSP Merrill Lynch Ltd.
B O A R D O F D I R E C T O R S
diaa
ed Bank Dhabi
k of Kuwait
& R E G I S T E R E D O F F I C E t III, G.I.D.C. Estate, Sector 28, 2 028, Gujarat, India. 23214000
- 23211966 / 68 / 71 patarupower.com
E O F F I C E YNERGY’ , 8th Floor, t Hotel Vakola, Santacruz(E)5, India. - 30645000- 30643131
ower.coms.com om

3 3
E X P E R T I S E A C C R O S S I N F R A S T R U C T U R E V A L U E C H A I N • EPC contracting: › Power transmission and distribution › Oil and Gas Pipeline › Factories and Buildings › Roads and Bridges › Power plant construction › Water Pipeline• Ownership of assets: › Power Transmission › Road › Logistics and Warehousing
O R D E R S• Exceeding Rs. 50 billion ($1billion) - Domestic Rs.35 billion - Overseas Rs. 15 billion - Consolidated Order Book exceeding Rs. 77 billion
I N V E S T I N G F O R F U T U R E• Cummulative last 4 year capex exceeding Rs. 3 billion• Investment in subsidiaries in past 4 years exceeding Rs. 1.25 billion
D I V E R S I F I C A T I O N• JMC projects• Shree Shubham Logistics• Oil and Gas Pipelines• Annuity/Boot projects• Real Estate Development
P R O D U C T I O N C A P A C I T Y• In excess of 108,000 MTs - Main Plant - 78,000 MTs - EOU - 30,000 MTs - Planned addition of 30,000 MTs
T E C H N O L O G Y• Global solutions for design• Automated production lines• Integrated solution (SAP)• Automated testing stations• Facility to demonstrate helicopter simulation at tower testing station
P E O P L E• Work force exceeding 5,000• Dedicated training centre
3 6 0 ° - T H E B U S I N E S S O F C R E A T I O N
It takes a tremendous amount of perseverance, dedication and hard work to find a successful foothold in every sphere of diversification within the infrastructure sector. Over the last 40 years, Kalpataru has excelled at being the leader in infrastructure, simply because of its 3600 - the Business of Creation outlook. This very diversification along with a motto to succeed has been the core reason for propelling the group to greater heights.
The exploratory gene, vision, foresight, an unbreakable team and a dynamic view of the industry round off the check list when it comes to having the attributes that make a winning combination. No stone remains unturned in the quest for maintaining and strengthening our leading position.

44
on revamping the transmission infrastructure to reduce transmission losses through technologically innovations like high voltage Ac transmission networks upto 1200 KV and long distance HVDC lines.
On the distribution side, distribution utilities are looking at outsourcing distribution network in cities to reduce distribution losses and improve customer services.Schemes like Rajiv Gandhi Grameen Vidyutikaran Yojana (RGGVY) & Restructured Accelerated Power Development & Reforms Programme (RAPDRP) to electrify rural India & strengthen urban areas, have given ample opportunities for growth. Your company will selectively continue to tap these opportunities to enlarge its presence in distribution segment.
In the international arena, both developed and developing countries present attractive business opportunities as power continues to be key drivers for this sustainable growth and future development. Countries in Africa, Middle East and CIS countries continue to invest in power transmission as it holds key to their economic growth & prosperity. We are also witnessing opportunities in America and Europe for upgradation of transmission lines and creation of additional capacity with smart solution grids.We have incorporated overseas subsidiaries to focus on the available opportunities in the respective countries.
We as a Company are moving towards leadership position in majority of T & D sector with annual Tower Manufacturing capacity of 108,000 MT pa and presence in over 28 countries with on time delivery records in last 2 decades. We are on track to expand our manufacturing capacity by 30,000 MT pa to be operational in a year’s time. Our fully equipped design & engineering centre, tower testing station, dedicated export manufacturing facility, time tested safety, quality & environment systems & integrated ERP system are keys for meeting tight delivery schedules for international clients.
O I L & G A S P I P E L I N E S - A G R O W T H P L A T F O R MIndia is the third largest oil consumer in the Asia - Pacific region after China and Japan. Demand for hydrocarbon is increasing at rapid space. India has inadequate pipeline network compared with most of developed countries, which is used for only 30% of petroleum product in country. We expect that over the next few years 10,000 Kms of pipe laying work is expected from public and private sector companies in India with an investment of over Rs. 450 billion.
Dear Stakeowners,
I’m once again delighted to address all our stake holders thorough this yearly communiqué whereby I appraise you all on our plans going forward.
The Company reported a spectacular all round performance in the year 2009-10. The revenue of the Company grew by 38% to Rs. 25.96 billion, Net Profit registered a strong growth of over 80% to Rs. 1.70 billion. The consolidated revenue of the Company surpassed Rs. 40 billion mark. We have seen significant improvement in operating margins over the previous year with consolidated EPS of Rs. 67.05.
At heart we have a non - negotiable commitment for consistent growth and value creation, with our continued commitments to world class on time delivery of infrastructure by leveraging our core competence & expertise in design, engineering and project management. Our focus will continue to explore avenues/opportunities for creating value from all our infrastructure spectrum which evolves from our strategy to provide end to end solutions to reinforce our model of 360° - the business of creation.
P O W E R – O U R C O R E F O C U S A R E A O F B U S I N E S S & G R O W T HOur country is still power deficit despite quantum jump in capacity in past few years. The government’s thrust in this sector continues & visible from the developments from new business models such as UMPPs and UMTPs to increase private sector engagement. The Country is witnessing huge investment in power generation, transmission and distribution. Power Grid Corporation of India (PGCIL) has recently announced mega investment plans to the tune of Rs 640 billion in the transmission & distribution Sector (T&D) over the next five years. State utilities are also investing in transmission infrastructure, post the SEB unbundling process. The entire focus is
C H A I R M A N ’ S L E T T E R

5 5
We have also created a leadership position in EPCcontracting business of Oil & Gas pipeline business by executing over 1800 kms of pipelines during the last 5 years. We have met all challenges be it tough terrain like rocky & hilly areas for our Panvel - Dhabol Project or highest diameter of pipe laying work in India of 48” under Vijaypur - Dadri Project. We have invested above Rs. 1.15 billion to create large base of equipments. We are exploring opportunities in international market for EPC contracting for Oil & Gas space and also expecting to spread our wings to entire value chain of Oil & Gas pipeline business, be it upstream or downstream.
C I V I L C O N T R A C T I N G - A N A T I O N B U I L D I N G E F F O R TInfrastructure is the back bone of growth of the country and thrust on development of the same by Government is going to create long term opportunities in the country. The Government has also aimed to expedite infrastructure through public-private partnership by implementing requisite changes in policy framework like introducing competitive bidding process, setting up regulatory authority, rationalization of customs and excise duties etc. Government is looking for revamping and developing all round infra-structure like Roads, Bridges, Canals, Dams, Water, Railway Terminals, Ports, Airports, SEZs as well as Rural and Urban Infrastructure.
JMC Projects, our subsidiary, in the last five years has achieved significant presence in various segments of infrastructure sectors namely factories and buildings, power plants, roads, bridges etc. Given its current order book and visible opportunities along with a commitment to deliver, we believe that JMC would continue to achieve greater heights in the future.
P U B L I C – P R I V A T E P A R T N E R S H I P O P P O R T U N I T I E S , C R E A T I N G A S S E T S F O R S U S T A I N A B L E R E V E N U E I N F U T U R E With opening-up of various opportunities under PPP route your company participated in various PPP projects last year and it’s a matter of great pride that Kalpataru Power Transmission, JMC projects and Shree Shubham Logistics Ltd. (SSLL) all have bagged one project each under this route, of which details are as follows:1. The Company in consortium secured a project from Haryana Vidyut Prasaran Nigam (HVPNL) to evacuate power from the upcoming power plant at Jhajjar through 100 Kms, 400 Kv transmission line &
sub-stations. 2. JMC in consortium bagged a project to construct 83 kms of four-lane highway between Rohtak to Bawal, Haryana from NHAI. 3. SSLL has entered into an agreement with Rajasthan State Warehousing Corporation (RSWC) to manage State owned 38 warehouses having capacity of 405,000 Mts across the state.
Some of the other key achievements of the company during the year are highlighted below:1. Engineering excellence in successful testing 1200 KV transmission tower at our testing station.2. Optimum utilization of Plant capacity for fabrication of transmission tower.3. SSLL, now manages more than 590,000 MT of dry and cold storage in the state of Rajasthan and Gujarat4. The Company’s revenue from international operations crossed the Rs. 10 billion mark. This is a phenomenal growth considering that the division is less than six years old.5. Consolidated order book exceeded Rs. 77 billion.
To support our growth plans, in the month of May, 2010,the Company has successfully raised over Rs. 4.50 billion (USD 101 Million) through QIP issue under SEBI (ICDR) Regulation, 2009. This fund shall be used for capital expenditure, expansion of manufacturing capacity (transmission line towers), long-term investment in PPP, BOT, BOOT and BOOM projects, development of EPC services, further investment in existing divisions and subsidiaries and working capital purposes.
While the trends on business growth in power & energy front are bullish in our country & global market, we are also continuously evaluating the perceived outlook on financial uncertainties in European Union which can globally effect the growth story.
As a global player we strive to meet and exceed expectations of our customers, governments, banks, vendors, employees and investors, benchmarking our performance against best in class industry standards and delivering the best against all odds that is what we call 360° - the Business of Creation.
Thanks to everyone for their unstinted support and faith.
MOFATRAJ P. MUNOTChairman
C H A I R M A N ’ S L E T T E R

66
P E R F O R M A N C E A T A G L A N C EK P T L C O N S O L I D A T E D *
* Year Since Consolidation started
7 7
K E Y H I G H L I G H T S
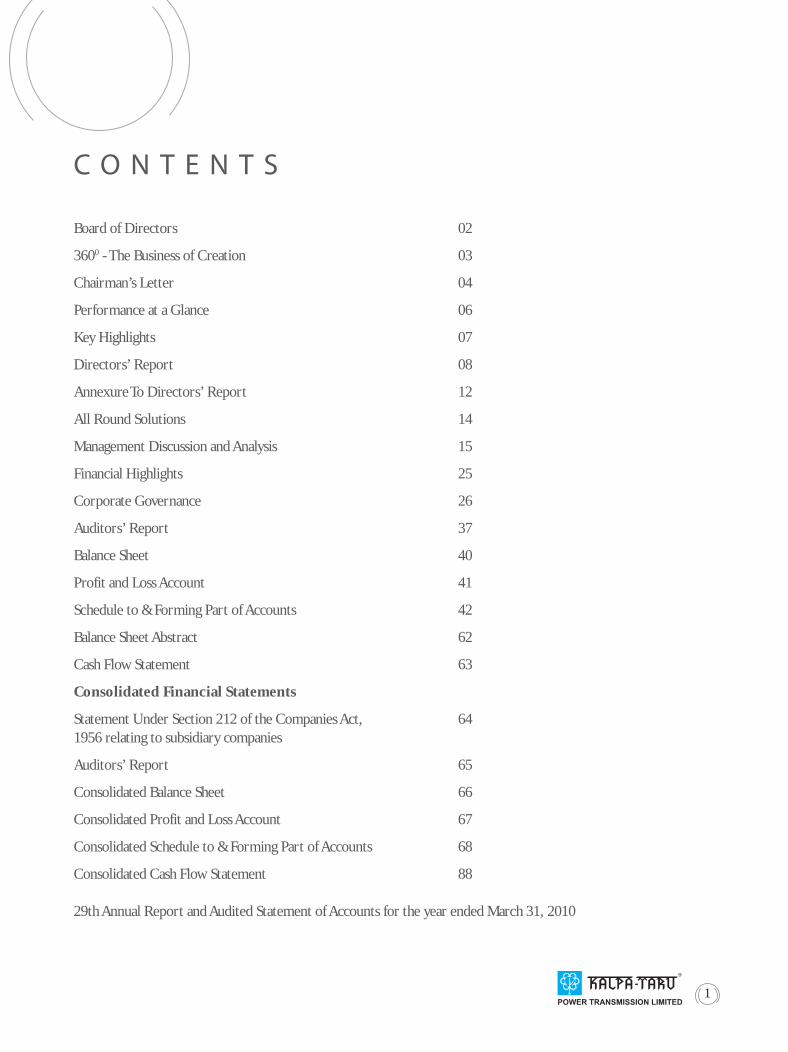
Revenues & Profits• Consolidated Revenue Rs. 40.43 Billion (USD 896 million)• Consolidated EPS of Rs. 67.05• Standalone Revenues of Rs. 26.43 Billion (USD 585 million)• Standalone EPS of Rs. 64.32
Financials• Raised Rs. 4.50 Billion (USD 101 million) through QIP to support future growth plans• Consolidated Networth at above Rs. 10. Billion (USD 225 million)• Consistent dividend of 75%• Debt/ Equity level at 0.62:1
Contracts• Order Book in excess of Rs. 50 billion• Consolidated order book in excess of Rs. 77 Billion• Large value transmission line contract from MSETCL worth Rs.12 Billion (USD 266 million)• Repeat orders from Algeria, Abu Dhabi & Philippines• First Transmission BOOT project from HVPNL• First Road DBFOT project secured by JMC from NHAI• Several orders from private sector clients in India
E V O L U T I O NGrowing together
Professionalism• More than 4000 technically qualified people
Employee Retention• Performance linked incentives• Defined career growth plan Team Size• Exceeding 2000 people in the company• Minimal Employee turnover
Training• Exclusive training centre on over 1,20,000 Sq. ft. of area• Imparted over 50,000 hours of in house training in the last three years• External training for competency building
CSR Initiatives• Fully equipped Kalp Seva Arogya Kendra to provide selfless medical services to the society at Gandhinagar
N U C L E U SOur team, our crux
Asset ownership• PPP Projects in Infra Space• Warehousing & Logistics Network• Power generation assets• Long term Leasing
Expanding breadth• Railways civil strucuture & electrification projects• Expand to new countries on continuous basis• Gas gathering stations and city gas distribution work • Focus on higher voltage( 765/ 1200 Kv) projects • Adding 30000 MTs Tower manufacturing capacity to meet increased demand• Plan to expand logistics parks in few more states
Increasing depth • ERP platform to cover entire business operations• Training of resources to built competency • Continue investment in construction equipment and engineering software to support growth• Exploring overseas opportunities in oil & gas pipeline business• Focus on additional clients in India & across the globe• Managing more than 590,000 Mts warehousing space in Rajasthan & Gujarat• Overseas subsidiaries to focus more on international markets
V I S I O NEye on the future

88
D I R E C T O R S ’ R E P O R T
TO,
THE MEMBERS,Your Directors have the pleasure to present the 29th ANNUAL REPORT on the business and operations of your company together with the Audited Statement of Accounts for the year ended March 31, 2010.
F I N A N C I A L R E S U L T S 2 0 0 9 - 2 0 1 0 2 0 0 8 - 2 0 0 9 (Rs. in billion) (Rs.in billion)
Total Revenue 26.78 19.45
Profit before Depreciation 2.66 1.48
Less: Depreciation 0.38 0.27
Profit before Taxation 2.28 1.21
Less: Provision for Taxation including Fringe Benefit Tax 0.56 0.23
Less: Provision for deferred Taxation 0.01 0.03
Net Profit after Taxation 1.71 0.95
Add: Surplus brought forward from previous year 3.76 3.19
Profit available for appropriation: 5.47 4.14
A P P R O P R I A T I O N S :
Transfer to General Reserve 0.25 0.12
Transfer to Debenture Redemption Reserve 0.09 0.03
Proposed Dividend on Equity Shares 0.23 0.20
Corporate Tax on Proposed Dividend 0.03 0.03
Balance carried to Balance Sheet 4.87 3.76
5.47 4.14

9 9
D I R E C T O R S ’ R E P O R T
Your company has an order book of over Rs. 50 billion excluding fairly placed bills.
S U B S I D I A R I E SJMC Projects (India) Ltd. And its subsidiary (JMC):JMC has reported consolidated revenue of Rs. 13.13.billion (USD 291 million) as against Rs.13.12 billion (USD 180 million) in corresponding period. Profit before tax as well as profit after tax stood at Rs. 531 million and Rs. 396 million as against Rs. 520 million and Rs. 368 million respectively. Abandonment of the major NHAI road project by the client and delay in commencement of few power projects were the bottlenecks in achieving desired growth during the year.
JMC has also received its first DBFOT basis project in consortium for Four Laning of Rohtak to Bawal of NH-71 of 83 kms from NHAI.
JMC has an order book exceeding Rs.26.71 billion (USD 663 million). Your company has strengthened JMC in terms of its capital base and business profile (through diversification) and improved financial discipline which will enable the company to achieve rapid growth. The company has invested Rs.942 million in JMC and holds 53.01% stake in JMC.
Shree Shubham Logistics Ltd (SSLL):In reporting period, SSLL has achieved a turnover of Rs884 million as against Rs.560 million in corresponding period, registering a growth of 58%.SSLL reported loss of Rs. 53 million as against profit of Rs 3.6 million in the corresponding period on account of delay in operation at all warehousing facilities and interest expenses.
SSLL has made significant progess during the reportingperiod on following count:
• All own logistic parks are operational with capacity of above 189,000 metric tons.
• Majority of logistic parks are accredited by NCDEX
• Strategic tie up with Rajasthan Ware Housing Corporation Ltd. to run their 38 warehouses having capacity of more than 405000 Metric Tons.
• Tied up with banks as collateral manager and service provider to expand the base amongst the farmers and trading community
D I V I D E N D Your Directors are also pleased to recommend payment of dividend for the year ended March 31, 2010 @ Rs. 7.50 per equity share of Rs. 10 each on increased equity share capital of 30,692,114 Equity shares on account of allotment of 4,192,114 Equity shares to Qualified Institutional Buyers on May 6, 2010 underSEBI (ICDR) Regulation, 2009.
F I N A N C I A L & O P E R A T I O N S R E V I E WYour company’s strong order book and executioncapabilities can be visualize by noticing an overall strong growth in terms of turnover and profitability. The gross revenue of the Company grew by 38% to Rs. 26.78 billion (USD 593 million) as against Rs. 19.45 billion (USD 431 million) in the previous year. Total Export Turnover (including overseas projects) was Rs. 11.58 billion (USD 256 million) or approx 43% of revenues in 2009-10 as against Rs. 5.19 billion (USD 102 million) in 2008-09.
The company reported growth of 89% in profit before tax of Rs. 2.28 billion in 2009-10 as against Rs. 1.21 billion in 2008-09 on account of better management of material, project and working capital during the year.
Your company has supplied 1,20,760 MTs of Transmission Line Towers as against 89,477 MTs in preceding year, which is higher by 35%.
Your Company has successfully raised Rs. 4.50 billion by issue of further 4,192,114 Equity shares of Rs. 10 each at price of Rs. 1074.20 per shares to Qualified Financial Institutions on May 6, 2010 under Chapter VIII of SEBI (ICDR) Regulation, 2009. The funds shall be used for capital expenditure, expansion of manufacturing capacity (transmission line towers), long-term investment in PPP, BOT, BOOT and BOOM projects, development of EPC services, further investment in existing divisions and subsidiaries and working capital purposes.
Your Company has secured its first Independent Power Transmission Company (IPTC) project inconsortium for Haryana Vidyut Prasaran Nigam Ltd. to undertake development and operation / maintenance of the 100 kms 400 kV / 220 kV transmission system project through Public Private Partnership on Design, Build, Finance, Operate and Transfer basis for the evacuation of electricity from the 2 x 660 MW thermal power plant at Jhajjar, Haryana.

1010
D I R E C T O R S ’ R E P O R T
is a Joint Venture between your company and a local company named as PDNA Industries (Pty) Ltd. who are 25.1% stakeholder in this company. Your company made an initial investment of Rs. 4.9 million towards equitycapital and other expenses.
Kalpataru Power Transmission Nigeria Ltd.:This Company was incorporated as a 100% subsidiary of your Company to explore the Power Transmission market in Nigeria.
Kalpataru Power Transmission (Mauritius) Ltd.:
This company is a 100% subsidiary in which your company has invested Rs. 1.1 million as capital and loan.
Kalpataru Power Transmission-USA, INC. This company was incorporated as a 100% subsidiary of your company during the year to increase its focus on American markets with local presence. Yourcompany has invested Rs. 9.3 million as capital and loan in this company.
During reporting period, all the above stated overseas subsidiaries are yet to commence business activities.
S T A T E M E N T O F D I R E C T O R S ’ R E S P O N S I B I L I T YPursuant to requirement under Section 217(2AA) of the Companies Act, 1956, Directors based on representationsreceived from Operating Management, confirm:
(i) That in the preparation of the annual accounts for the financial year ended March 31, 2010, the applicable accounting standards had been followed;
(ii) That Directors had selected such accounting policies and applied them consistently and made judgments and estimates that are reasonable and prudent so as to give a true and fair view of the state of affairs of the company at the end of the financial year and of the profit of the company for the year;
(iii) That the Directors had taken proper and sufficient care for the maintenance of adequate accounting records in accordance with the provisions of the Companies Act, 1956 for safeguarding the assets of the company and for preventing and detecting fraud and other irregularities;
(iv) That the Directors had prepared the annual
At the year end, investment of your company in SSLL was Rs. 776 million as equity shares, preference share capital and loan. SSLL is an 80% Subsidiary of your company.
Energylink (India) Ltd (ELL):ELL plans to foray in to construction of commercial complexes and integrated township targeting middle and upper middle class income households. ELL has also entered into MOU, for setting up a Multi Product SEZ with Government of Gujarat during “Vibrant Gujarat”, an Investors Meet for Infrastructure development and is in the process of acquiring land near Ahmadabad for the same. During the year company has acquired 100% stake in Saicharan Properties Limited which is in process of implementing commercial cum retail project in Indore.
At the year end, investment of your company in ELL was Rs.1.28 billion as capital and loan. ELL is a Wholly Owned Subsidiary of your company.
Amber Real Estate Ltd. (Amber):Amber is in process of creating approx. 392,000 sq. feet leasing space for IT/Software Technology park at Thane, Mumbai is expected to be completed by Dec., 2011. At year end, investment of your company in Amber was Rs. 192 million as capital & loan and it is a Wholly Owned Subsidiary of your company.
Saicharan Properties Ltd, 100% Subsidiary of Energylink (India) Ltd.(SAI):SAI is proposing a commercial cum retail project in the heart of city of Indore where it has approximately 12600 sq. meter of free hold land. The project is expected to be completed by March 2013. At the year end, investment of your company in Saicharan was Rs. 1.25 billion as capital and loan through ELL.
Adeshwar Infrabuild Ltd., (Adeshwar):Adeshwar was incorporated during the year as wholly owned subsidiary to venture into new areas of business which can be conveniently or advantageously run by company in the coming year which may include mining, cement, solar power, etc. At the year end, investment of your company in Adeshwar was Rs. 5 million as capital in this company. It is Wholly Owned Subsidiary of your company.
Kalpataru SA (Proprietary) Ltd.:This Company was formed in South Africa to bid for EPC Power Transmission jobs in South Africa. This

11 11
D I R E C T O R S ’ R E P O R T
re-appointment. Auditors comments on your company’s accounts for year ended March 31, 2010 are self explanatory in nature and do not require any explanation as per provisions of Section 217(3) of the Companies Act, 1956.
P A R T I C U L A R S O F E M P L O Y E E SIn terms of provisions of Section 217(2A) of the Companies Act, 1956, read with the Companies (Particulars of Employees) Rules, 1975, as amended, names and other particulars of employees are required to be set out in Annexure to the Directors’ Report. However, as per provisions of Section 219(1)(b)(iv) of the said Act, the Annual Report excluding aforesaid information is being sent to all the Members of company and others entitled thereto. Members who are desirous of obtaining such particulars are requested to write to company.
C O N S E R V A T I O N O F E N E R G Y & T E C H N O L O G Y A B S O R P T I O N A N D F O R E I G N E X C H A N G E I N F L O W & O U T F L O WInformation required under Section 217(1)(e) of the Companies Act, 1956 is annexed hereto and forms part of this Report.
D E P O S I T SYour company has not accepted deposits from the public within provisions of Section 58-A and 58-AA of the Companies Act, 1956.
A C K N O W L E D G E M E N TYour Directors wish to place on record their gratitude to the shareholders of the Company, Banks, Financial Institutions, valued Customers, Suppliers, and Business Associates for their support and confidence in the Company.
Your Directors gratefully appreciate the co-operation and assistance extended by various Central and State Governmental Agencies. Your Directors also place on record their appreciation for overwhelming co-operation and assistance extended to your company by its employees.
On behalf of the Board of DirectorsMOFATRAJ P. MUNOTCHAIRMAN
Place: Mumbai Date: May 29, 2010
accounts for the financial year ended March 31, 2010 on a “going concern” basis.
C O R P O R A T E G O V E R N A N C EAs per Clause 49 of listing agreement with the Stock Exchanges, a separate section on Corporate Governance and Management Discussion and Analysis, confirming compliance is set out in Annexure forming part of this report.
Your company has been practicing principles of good corporate governance over the years. Your Board of Directors supports broad principles of corporate governance. In addition to basic governance issues, Board lays strong emphasis on transparency, accountability and integrity.
D I R E C T O R SIn accordance with provisions of the Companies Act, 1956 and the Articles of Association of your company, Mr. Mofatraj P Munot, Mr. Sajjanraj Mehta and Mr.Parag M. Munot are liable to retire by rotation at ensuing Annual General Meeting and being eligible they have offered themselves for re-appointment.
Mr. Shitin Desai, Independent Director, has resigned from his directorship w.e.f. May 10, 2010 due to hispreoccupation. The Board of Directors records itsappreciation for his valuable services rendered to your Company during his tenure.
C O N S O L I D A T E D F I N A N C I A L S T A T E M E N T S
Your Directors have pleasure in attaching the Audited Consolidated Financial Statements pursuant to Listing Agreement entered into with the Stock Exchanges and prepared in accordance with Accounting Standards prescribed by the Institute of Chartered Accountants of India.
A U D I T O R S A N D A U D I T O R S ’ R E P O R TBoard of Directors have recommended appointment of M/s. Kishan M. Mehta & Co., Chartered Accountants and M/s. Deloitte Haskins & Sells, Chartered Accountants as auditors of your company who retire at the conclusion of forthcoming Annual General Meeting and are eligible for re-appointment.
M/s. Kishan M. Mehta & Co., Chartered Accountants and M/s. Deloitte Haskins & Sells, Chartered Accountants have given their consent to act as auditors, if re-appointed. Members are requested to consider their

1212
A N N E X U R E T O D I R E C T O R S ’ R E P O R T
Biomass Energy DivisionFollowing measures taken by your company from time to time has helped us in maintaining the auxiliary consumption at optimum level.
1. Use of Energy Efficient Motors for all auxiliaries of the plant has helped in reduction in Auxiliary consumption.
2. High capacity motors like Boiler Feed Pump Motor have been provided with Soft Starters (Electronic Starters) to conserve energy.
3. Variable Frequency Drives (VFD’s) have been provided for majority of continuous running auxiliaries which helps in conserving energy.
B . T E C H N O L O G Y A B S O R P T I O N :We have not imported or used any special technology which fall under this disclosure.
C . F O R E I G N E X C H A N G E E A R N I N G S
A N D O U T G O : ( R S . I N B I L L I O N )
Foreign exchange earnings Rs. 9.22(including overseas projects)
Foreign exchange outgo Rs. 6.41(including overseas projects)
A . C O N S E R V A T I O N O F E N E R G Y :Transmission & Distribution DivisionFollowing measures taken by your Company from time to time has helped us maintaining energy consumption at optimum level:
1. Use of Voltage Stabilizer to regulate fluctuations in voltage of the Ahmedabad Electricity Company supply, which helps to reduce energy consumption and eliminates wastage.
2. Installed enough number of Capacitors at Electrical Control Panel Boards to improve the overall power factor.
3. Implementation of recommendations made by the National Productivity Council while conducting energy audit.
4. Installed differential wound linear regulator, Automatic Voltage Controller with advanced technology for the energy saving.
5. Took PNG Connection, an environment friendly fuel, for galvanizing plant and hot bending machine to conserve the energy.
Our total energy cost is less than 1% of our totalturnover, which reflects success of your company’sefforts in this direction.
Information required under the Companies (Disclosure of Particulars in the Report of the Board of Directors) Rules, 1988.
R E P O R T
ur company from n maintaining the evel.
s for all auxiliaries duction in Auxiliary
Boiler Feed Pumpwith Soft Starters e energy.
VFD’s) have been ontinuous running ving energy.
P T I O N :y special technology
E A R N I N G S
L L I O N )
Rs. 9.22
Rs. 6.41
rd of

13 13
1414
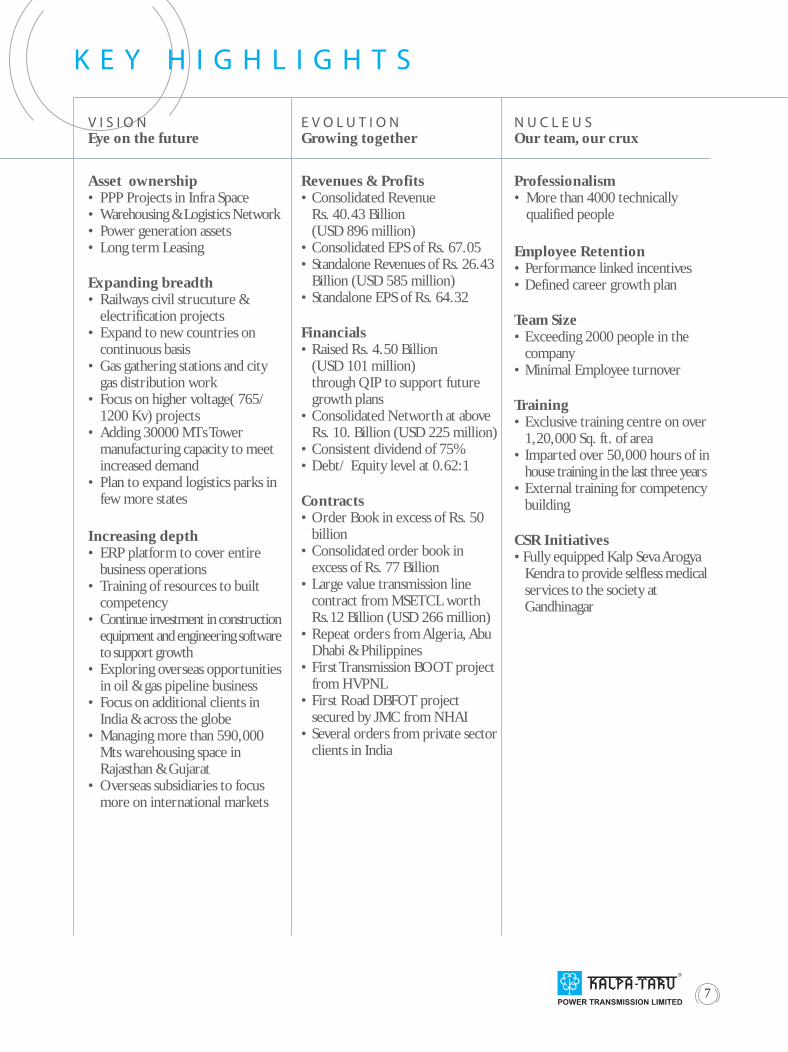
A L L R O U N D S O L U T I O N S
P O W E R T R A N S M I S S I O N• Design Engineering Expertise with latest available technology• Testing facilities upto 1200 KV with helicopter simulation• Integrated Manufacturing with State-of the art CNC Machine with 108,000 Mts capacity and further to be increased to 138,000 Mts by 2011.• Supply management capabilities for on time delivery• Capable team of project execution and site management• Adequate construction equipments to carry out multiple jobs• Strong country management network to meet out country specific project execution requirement
P O W E R D I S T R I B U T I O N• Dedicated team of planning and supply management of executing project spread over longer distances in rural and urban areas with high quality standards• Dedicated site management team managing construction resources with due care of safety and quality.• A competent design team to design optimized distribution system for reduction in distribution losses.
O I L & G A S P I P E L I N E• Dedicated team of accredited fitters / welders capable of delivering quality project.• A dynamic project management site organisation to address complex construction challenges.
Staying ahead of the game requires one to have a presence in every conceivable direction. Providing a product or service is not enough. Kalpataru ensures integrated solutions from the creation of new designs, to their quality fabrication, project execution and commissioning.
• Adequate fleet of construction equipments for timely project completion.• 1,800 Kms of pipe laying work experience in all kind of terrain.
W A R E H O U S I N G & L O G I S T I C S• State of art ultra modern 12 Logistic park are operational with capacity of over 189,000 Mts.• Majority of logistics park are accredited by NCDEX• Managing 38 state owned warehouses of RSWC having capacity of over 405,000 Mts.
C I V I L C O N T R A C T I N G• Present in all sphere of EPC business in infra sector• Huge pool of construction Equipments• Presence across almost all states of India• Ability to execute projects on DBFOT basis
nt design team to design optimizedn system for reduction in distribution
S P I P E L I N Eteam of accredited fitters / weldersdelivering quality project.project management site organisation to
mplex construction challenges.

15 15
Chhattisgarh, Madhya Pradesh, Andhra Pradesh and Tamil Nadu. These corridors will have high-voltage lines i.e. 800 kV with the capacity to withstand variations of surge and decline in power transmission. They will help increase inter-regional power transfer capacity. India currently has an inter-regional power transfer capacity of 20,800MW, and PGCIL plans to increase it to 37,000 MW by 2012. This will require the strengthening of regional grids and building more inter-regional links.
The regional grids will be gradually integrated to form a national grid, whereby power in a region of surplus can be transferred to another, resulting in the optimal utilization of capacity generation. With the proposed addition of 16,630 MW, the total inter-regional transmission capacity is expected to be 37,200 MW by the end of the XIth FYP.
Thus the demand for engineering, procurement and construction services in the power transmission lines and power distribution businesses will continue to exist.
Private Investments in TransmissionIn 1998, the Central Government enacted the Electricity Laws (Amendment) Act, which recognized transmission as an independent activity (distinct from generation and distribution), and allowed private investment in the sector.
According to Government policy, the state transmission utilities (STUs, SEBs or their successor entities) and the central transmission utilities (CTU, PGCIL) will identify transmission projects for the intrastate and inter-state/inter-regional transmission of power respectively. The STUs and CTU will invite private companies to implement these projects through an IPTC or on a joint venture basis on BOOT, BOT, BOOM, BOO style.
DistributionTo further strengthen the pace of rural electrification and improving urban distribution and with an objective to electrify all villages and rural households and modernizetion in urban areas in five years, the Central Government launched Rajiv Ghandhi Grameen Vidyutikaran Yojna (“RGGVY”), APDRP and RAPDRP. These schemes aim to create rural electricity distribution backbone through providing for sub-stations, distributiontransformers and decentralized distribution generationsystem where grid supply is not feasible. The RGGVY scheme identified that 112,400 villages and over 56% of rural households were still to be electrified which required huge investment and also to help urban areas in better distribution of power.
Forward Looking Statement:
Company presents its performance for year 2009-10 andoutlook for future based on current Business environment which may vary due to future Economic, Political and other developments in India as well as overseas
E C O N O M I C S C E N A R I OThe growth of Gross domestic product (GDP) slowed from a four year average of 9% for the F.Y 2005-2008 to 6.7% for the year 2009 and expected to be 7.2% for the year 2009-10.
After unprecedented slow down in major economies around the world in mid September, 2008, the Indian economy is showing the sign of stabilization, largely led by Government spending and backed by strong domestic demand, rise in private consumption, investment, trade and positive capital inflow.
The continuous thrust on agriculture, power, infrastructure, urban & rural development and focus on inclusive growth will unlock much of the economy growth potential in the medium term. Keeping this in view, it is expected that the positive and forward looking budget 2010-2011 should provide a perfect platform of a return to the growth trajectory from which the global crisis had momentarily diverted India and will help in attaining projected growth rate of 8.2% and 9% in 2010-2011 and 2011-2012 respectively with an ambitious but achievable target of double digit growth of GDP.
O U T L O O K A N D O P P O R T U N I T I E STransmission And DistributionIndian Scenario As the Central Government plans to increase installed power generation capacity to 224,906 MW by 2012 from the present level of 157,229 MW, this would facilitate an expansion of the regional transmission network and inter-regional capacity to transmit power. Inter-regional transmission networks are required because powergeneration sources are unevenly distributed in India and power needs to be carried over large distances to areas where load centers and demand exist.
State-owned electricity transmission company Power Grid Corp. of India Ltd (PGCIL) plans to float tenders valued at around Rs. 640 billion in the 12th Five year plan for nine high-capacity corridors that will transmit power from new projects in Orissa, Sikkim, Jharkhand,
M A N A G E M E N T D I S C U S S I O N A N D A N A L Y S I S

1616
C I R C U M N A V I G A T I N G T H E G L O B E
9 C O U N T R I E SYear 1995 - 1999
1 9 C O U N T R I E SYear 2000 - 2005
2 8 C O U N T R I E SYear 2006 - 2010
One of the most remarkable chapters in Kalpataru’s story is its far reaching presence across the world. Already in 28 countries and showing no signs of slowing down, Kalpataru has its sights set clearly in all directions. Exploring new avenues and leaving its mark on new soil is just one reason why it is an all round winner.
16

17 17
petroleum, in absolute terms, is expected to be 195 million tons for the years 2011-12. Pipelines transport only 30% of the petroleum products consumed by Indian industry, in spite of being cheaper than railway, coastal tanker and road transportation which account for 40%, 12% and 18%, respectively.
R I S K , C O N C E R N S & T H R E A T SEach enterprise has its own risk and can’t remain isolated to the fullest extent except properly managing the risk. The Company foresees following areas of risk, concerns and threats:
• The Company is exposed to variation in prices of commodities, foreign exchange and interest rate.
• The project execution always largely depends upon skilled and unskilled manpower. Hence deployment, retention and competency growth of employees is also an area of concern.
• The Company is exposed to risk of delay in execution due to external factors like right of way, shortages of skilled/semi skilled manpower, etc.
• The Company business is exposed to unpredicted risk of changes in policies of Government and countries where it operates.
• Bio-mass Power Division is exposed to risk of availability and pricing of its critical fuel i.e agriculture residue/waste and availability of water in the area.
These risks are managed with proper mix of orders across various countries, timely and adequate hedgingof commodity and exchange exposure, optimizationof working capital limits and efficient inventorymanagement. The management keeps close watch on global developments and keeps on reviewing the risk and addresses the concerns for appropriate actions from time to time.
S E G M E N T - W I S E O P E R A T I O N A LP E R F O R M A N C ECompany has four primary business segments constituting Power Transmission & Distribution, Real Estate, Bio-mass Energy and Infrastructure.
Revenue of company can further be divided geographically in two different segments-sales within India and sales outside India considering location of customers. Out of
M A N A G E M E N T D I S C U S S I O N A N D A N A L Y S I S
Company is actively exploring the opportunitiesavailable in power distribution franchises which is beinginvited by State Utilities on competitive bidding basis. These opportunities on being successful will certainlyadd long term consistent revenue stream for the company.
InternationalAs a part of your company’s growth strategy, your company is actively looking at the international market including developed markets such as U.S. and Canada and new countries in CIS where there is need for system up gradation and/or new expansion.
The Company continues to seek growth from the above markets on account of huge investment planned by the countries in power transmission sector. To tap the opportunities in these regions, Company has already made local presence through its subsidiaries in USA, South Africa and Nigeria.
Looking to huge opportunities in transmission &distribution sector in India as well as overseas T&D industry is expected to witness robust order inflow on continuous basis for some time.
Oil and Gas Pipeline SectorThe strong growth of the Indian economy and infrastructure and the resulting increased demand in the energy industry has resulted in the need to develop an efficient distribution network for oil and natural gas transportation. The use of natural gas in the energy industry is also expected to increase significantly. The current low per capita usage of pipes in India, the discovery of large oil and gas reserves in various parts of India, the Central Government’s decision to permit oil retailing by the private sector and the national pipeline grid formulated by GAIL and infrastructure development projects of other major players in the energy industry in India are expected to increase engineering construction activity in the Indian energy sector.
The demand for and the supply of natural gas in India isalso expected to increase in the next several years. Increased demand for natural gas in India is also expected to result in the need for an extensive gas transportation pipeline infrastructure.
India’s regime permitting 100% foreign direct investment in exploration, refining, petroleum and gas pipelines and marketing is favorable for our business.
India is currently the third largest oil consumer in the Asia-Pacific region after China and Japan. Demand for

1818
D R O P S O F E X C E L L E N C E
P O W E R T R A N S M I S S I O N• Successfully tested 1200 KV tower at our testing station• Secured large value contract of Rs.12 billion from MSETCL • Successfully tested over 200 towers at our testing station• Over 5,900 Foundations in year 2009-10• Over 1,500 Kms of Stringing in year 2009-10• 15,000+Mts power transmission towers supplied to USA• Secured orders above Rs. 20 billion from SEBs/ Private Parties• Repeat orders from clients in Algeria, Abu Dhabi & Philippines• Successfully strung special kind of conductors to with stand in temperature upto 210° for a client in middle east
P O W E R D I S T R I B U T I O N• More than 6,500 transformers erected• More than 500 Feeders completed• More than 9,000 circuit kms of conductor stringing
O I L & G A S P I P E L I N E• Completion of 1st 48” Pipeline Project• Entry into city gas distribution • Successfully completed over 1,800 Kms of pipe laying work in India
W A R E H O U S I N G & L O G I S T I C S• All 12 logistics park are operational• MOU with Govt. of Rajasthan to operate their 38 warehouses with 405,000 Mts of capacity• Majority of owned Logistic park are accredited by NCDEX• Spot Exchange and auction platform facilities to arrange best prices to farmers / traders• Quality testing and certification services• Collateral management services
J M C P R O J E C T S ( I N D I A ) L T D .• Significant growth in order book to Rs. 26.70 billion• Focus on power plant civil construction, presently executing civil work for more than 10,000 MW of power plants• Three stadiums for the Common Wealth Games in Delhi• Secured Bangalore metro rail project
In the vast expanse of Kalpataru Infrastructure, we have made it mandatory to always surpass expectations and keep the bar high. Aiming higher ensures sand is turned to pearls. Creating something we can be proud of and better each time.
18

19 19
Infrastructure DivisionDuring reporting period, Division has completed and commissioned pipe laying of Vijaipur Dadri Pipeline Project of Gail India Limited and Chennai Bangalore Pipeline Project of Indian Oil Corporation Limited. So far Company has successfully completed pipe laying work of over 1,800 Kms.
In the previous year, Division has booked a revenue of Rs.3.61 billion as against Rs.1.72 billion in corresponding period.
The division is presently executing a prestigious pipeline job of 48”/30”/28”, 544 Kms Mundra Bhatinda Pipeline project for HPCL-Mittal JV, apart from small jobs for other clients. Division has secured its first city gas distribution order from Gail Gas Ltd for the city of Kota to gain experience in this area as the India has great potential for gas distribution.
After the wholesome domestic experience, division is appropriately considering the overseas opportunities and have been getting pre qualification criteria cleared to bid for these jobs. The required business development team is in place to ensure that we achieve this at earliest.
F I N A N C I A L R E V I E WNet sales and service revenue of the company for 2009-10 was at Rs.25.97 billion. This represents a growth of 38% over 2008-09. Revenue of Power Transmission and Distribution segment grew by 31%, Infrastructure segment grew by110% and Bio-mass Energy segment grew by 6.25%.
Exports revenue (including overseas projects) earnings during this year were at Rs. 11.58 billion representing approx. 45% of your company’s gross revenue.
Company’s profit before tax has increased to Rs. 2.28 billion from Rs. 1.21 billion. Profit after tax stood at Rs. 1.71 billion as against Rs. 0.95 billion. Increase in profit is attributable to increase in turnover, favorable commodity & forex market condition and improved working capital management.
Net fixed assets (including capital work in progress) as at March 31, 2010 was Rs. 3.38 billion as compared toRs. 2.68 billion in previous year, indicating increase ofRs. 0.7 billion, mainly for addition in execution related equipments and tools at domestic and international T&D sites to meet increased construction volume, purchase of pipe laying equipments for Infrastructure
M A N A G E M E N T D I S C U S S I O N A N D A N A L Y S I S
total revenue (Net of Excise Duty) of Rs. 25.97 billion of the Company, revenue within India is 14.39 billion (55%) and outside India is Rs. 11.58 billion (45%).
Transmission & Distribution Division (T & D)Division’s revenue was higher by 31% at Rs. 21.85 billion.
The largest international contract of Company withMEW, Kuwait is progressing well and expected to be over during the current financial year. The Company has also received a domestic large value contract for MSTCL worth Rs. 12 billion for laying power transmission and sub-station line for them. Company has successfully received repeated orders from Algeria, Philippines and UAE.
Most of the rural distribution projects have been successfully completed and the balance are on the verge of completion during the year including GFSS-II project and inflows from these projects will help to improve our working capital.
Company has successfully tested its first 1200 KVpower transmission tower during the year and alsosecured supply order for the same from PGCIL.
The Company is able to achieve this growth on account of its ability to focus on right order mix, expanded geographical reach, improve productivity and optimizing cost in all its activities.
Real Estate DivisionThere has been no major activity in this division during the year 2008-09.
Bio-mass Energy DivisionCompany’s two power generation plants of 7.8MW each at Sri Ganganagar and Tonk District of Rajasthan, generating power from non conventional energy resources i.e. using agricultural waste as fuel, registered a revenue of Rs. 508 million as against Rs. 476 million in corresponding period showing growth of 6.25% over last year. Both plants have run at 97% PLF (excluding shut down) and generated 118 million units out of which 108 million units were exported. Generated power is being sold to RVVNL and company also has option to sell it to private parties under PPAs. Due to water scarcity in the region, Tonk plant was shut in the month of April,10 and expected to be operational again in the month of July, 2010.

2020
W H E E L S O F C H A N G E
222220222222200000002020002022222222222200202020000000022222222222202000000002222222222222202020000200000222222222220000002222222222220000022222222200020002222222222002222222220200020222222200222222200022222220000222222202200022222222200000222222000022222220000222220000022222220000002222222220022222200000
E R P S O L U T I O N S
• Integration of all processes across organization name
› Production & Planning
› Projects & Execution
› Procurement & Inventory
› Finance & Risk Management
R A T I N G S
• Rated by CRISIL & CARE in India
• Business rating by Dun & Bradstreet
O I L & G A S P I P E L I N E S
• Enrty into city gas distribution work
Q U A L I T Y C E R T I F I C A T I O N
• ISO 9001:2008 for Main Plan & Infrastructure Division
• ISO 14001:2004 for EOU Division
• ISO 9001:2008 for EOU Division & DMS Division
S A F E T Y
• Received runner-up safety award from Gujarat safety council for EOU plant
A well oiled operation can only run smoothly if its core is constantly tuned and improved upon. Dynaic and ever evolving systems and processes are a necessity to maintain a perfect engine. We are perennially working to better ourselves and keep the accolades pouring in. Quality comes first and that shows through all ourendeavours, big or small.
20

21 21
C O R P O R A T E S O C I A L R E S P O N S I B I L I T YSafetyCompany gives utmost importance to safety standards at all working locations of company. At manufacturing units, power plants and all project sites, necessary procedures are in place to ensure safety of personnel and equipments. Specially to ensure safety and health of work force and create awareness, company undertakes the following activities.
a. Internal safety audits
b. Safety week celebration to create awareness about safety
c. Mock drills are conducted to access emergency / disaster management preparedness, etc.
EnvironmentPreservation and promotion of environment is of fundamental concern in all our business activities. Company has installed flux regeneration plant, acid and white fume extractors, eco-ventilator fans, etc at its manufacturing facilities to maintain good working condition and to make it more environmental friendly. As specific requirement of customer, Company has started fumigation of its export supplies, dull finishing of products to avoid reflection when it is installed at site, etc. Company does a lot of plantation and green area development for GIDC and GUDA.
Company has been accredited with ISO 14001 for Environment Management Systems by Intertek Quality Registrar, PLC, U.K., for its EOU Division.
Community DevelopmentCompany exhibits concern for society in order to be good corporate citizen, undertakes various community welfare measures and environment friendly initiatives.Primary focus of social welfare and community development measures of your company is focused on healthcare, child development and promoting cultural activities.
Company undertakes community development programmes by way of sponsoring the programme of government and non-government organizations like Rotary Club of Gandhinagar, Gandhinagar Cultural Forum, Kalrav etc. in field of healthcare, child development programme, cultural activities, women empowerment programme etc. Company also donated
M A N A G E M E N T D I S C U S S I O N A N D A N A L Y S I S
Division and purchase of additional land and building in Gandhinagar to meet our increased storage and administrative requirement.
Net current assets as at March 31, 2010 saw an insignificant increase to Rs. 11.68 billion as against Rs. 11.09 billion over previous year. Current assets level of company were managed at same level inspiteof 38% of growth on account of better working capital management. The focused efforts on realization from rural distribution jobs have also helped us in managing current assets levels. Thus Bank working capital limits utilization was almost at the same level as the previous year.
During this year, company has issued 9.55% Non-Convertible Debentures (NCD) of Rs. 0.7 billion for ongoing capex.
The total Debt/Equity ratio is at 0.60 and Long Term Debt/Equity ratio is at 0.18. Company enjoys PR1 + and AA rating for its short term and long term borrowing from CARE Ltd.
The operating cash flow of the company stood at Rs. 4.16 billion as against the negative operating cash flow of Rs. 1.59 billion during the previous year.
Internal ControlCompany has an adequate systems of internal controls implemented by management towards achieving efficiency in operation, optimum utilization of company’s resources and effective monitoring thereof and compli-ance with applicable laws and regulations.
Company’s internal audit department and independent Internal Auditors conduct regular audits to ensure adequacy of internal control systems, adherence to management instructions and compliance with laws and regulations of the country as well as to suggest improvements.
Audit plans, internal/external auditors’ observations and recommendations, significant risk areas assessments and adequacy of internal controls are also periodically reviewed by Audit Committee.
Company has across the board implemented global ERP system-SAP, to have better internal control systems and flow of information.
Company has adhered to stringent rules and regulations of ISO guideline also.

222222
S H E L T E R I N G O U R W O R L D
• W E L F A R E T R U S T
• C O R P O R A T E T O U R N A M E N T S I N A I D O F V A R I O U S N G O ’ S
• B L O O D D O N A T I O N C A M P S
• D I S P E N S A R Y
• Y O U T H / W O M E N E M P O W E R M E N T P R O G R A M M E
• P R O M O T I N G C U L T U R A L A C T I V I T I E S
• T R E E P L A N T A T I O N C A M P
• H E A L T H C A M P S
• C A R B O N E M I S S I O N R E D U C T I O N
A business can only call itself a true powerhouse when it extends its growth into every nuance of development. And this includes sustaining and developing our society. Propagating the importance of renewable development andenvironment protection for future generations is our promise and responsibility.

23 23
M A N A G E M E N T D I S C U S S I O N A N D A N A L Y S I S
Cautionary StatementStatement in the Management Discussion and Analysis describing the Company’s objectives, expectations or predictions may be forwarded looking within the meaning of applicable securities, law and regulations.The Company assumes no responsibility to publicly amend, modify or revise forward looking statement, on the basis of subsequent event or development. Actual results may differ materially from those expressed in the statement. Important factors that cloud infl uence the Company’s operations affecting selling price of fi nishedgoods, input availability and price, changes in government regulations, tax laws, economic development within the country and outside the country and other factors such as litigation and industrial relations.
a vehicle to Akhshya Patra, a foundation to provide food to under privileged children of the Gandhinagar district.
Company is very much committed to improving quality of life in communities in which it operates and to contribute the overall development of society.
As a part of its social responsibility, your company has opened KALPA-SEVA AROGYA KENDRA, a multi specialty dispensary with ultra modern facilities and latest equipments in its Pathological Lab, which will be helpful to cater the medical needs of the people in and around Gandhinagar at a very nominal fee. The Company has organized camp for artificial limb for physically handicapped people.
Human Resource“Making People Our Most Important &Valuable Asset” – Success of a business is directly linked to performance of those who work for that business. Now, properly managing a workforce is a lot more complicated than, maintenance of a company’s material capital such as machinery, computer systems, etc. Indeed, mechanistic approach to employee relations has often failed. Fortunately, this failure has prompted close study into how to effectively see that human capital is treated right and is able to reach its full potential.
Employee loyalty continued and succeeded in retaining the talent while adding 500 + new family members. Employees Welfare Trust is operational and needy people were supported.
At Kalpa-Vriksha Learning Centre, we make sure that freshers abilities are correctly and optimally nurtured and their competencies are enhanced, through a rigorous 35-day induction program. A demo area - a virtual site - has been created to give them the practical knowledge before they go to the site. We also take care to improve their behavioural aspects such as personality development, communication skills etc. We also provide a platform to our employees to upgrade their competencies, knowledge, skills and attitudes through various courses.
We continue to conduct programmes for our employees and their families like camps for kids, sports for family and employee. Annual Day celebration, rewarding long service associates, arranging picnics, gathering and involving each employees etc. Medical check-up for employees is being done periodically.

2424
T H E C O R E
R E C R U I T M E N T• Over 800 technical persons recruited in the last 5 years
T R A I N I N G H O U R S• In house training of more than 50,000 hours imparted to employees in the last 3 years.
T R A I N I N G C E N T R E S• Kalpa-Vriksha 1,20,000 sq. feet dedicated state of the art learning centre
Our most treasured asset has to be our unfailing work force that excels as a team. Nurturing their professional and personal growth is part and parcel of the Kalpataru ethic. We look at how a day to day job can develop into a rewarding career for every single family member here. The end result is sheer excellence.
24
T R A I N I N G C E N T R E S• Kalpa-Vriksha 1,20,000 sq. feet dedicated state of
the art learning centre
S P E C I A L I S E D E D U C A T I O N• Sponspored management courses in IIM, ISB & Kellogg’s Management Institute
K A L P A T A R U P A R I V A A R• 1233 qualified Technicians• 1638 qualified Managers
W O R K F O R C E• > 5,000 people

25
F I N A N C I A L H I G H L I G H T S
2005-06 2005-06 2006-07 2007-08 2008-09 2009-10 2009-10
RS. IN BILLION USD IN MILLION
• Production in MTs 62,452 78,404 79,531 93,484 * 121,483 * 121,483
• Gross Revenue 8.71 15.67 17.68 19.14 26.43 585.49
• Sales Growth 53.7% 79.9% 12.8% 8.2% 38.1% 38.1%
• International Revenue 1.43 4.01 5.01 5.19 11.58 256.54
• Total Expenditure 7.57 13.18 15.27 17.28 23.22 514.42
• Operating Profit (PBDIT & other income) 1.14 2.49 2.42 1.86 3.21 71.07
• Other Income 0.05 0.12 0.21 0.31 0.35 7.68
• Interest 0.16 0.28 0.40 0.68 0.90 19.85
• Profit before depreciation & tax (PBDT) 1.03 2.33 2.23 1.48 2.66 58.89
• Depreciation 0.09 0.17 0.22 0.27 0.38 8.47
• Profit before Tax 0.94 2.17 2.02 1.21 2.28 50.42
• Provision for Taxation (Incl. FBT & Deferred Tax) 0.28 0.57 0.52 0.26 0.57 12.66
• Profit after Tax (PAT) 0.67 1.59 1.50 0.94 1.70 37.76
• Equity Share Capital 0.11 0.27 0.27 0.27 0.27 5.87
• Net Wor th (excluding Revaluation Reser ve & Debenture Redemption Reser ve) 1.67 6.42 7.67 8.33 9.76 216.24
• Total Borrowings 2.33 3.37 3.26 6.54 6.04 133.88
• Capital Employed (Net Wor th + Term Borrowings) 2.66 7.29 8.38 9.68 11.57 256.33
• Debt Equity Ratio 1.39:1 0.52:1 0.43:1 0.79:1 0.62:1 0.62:1
• Debt Equity Ratio (Long Term) 0.59:1 0.14:1 0.09:1 0.16:1 0.19:1 0.19:1
• Book Value Per Equity Share (Rs) (excluding revaluation Reser ve & Debenture Redemption Reser ve) 153.93 242.18 289.52 314.51 368.34 8.16
• Earning per Equity Share (Rs.) 61.26 65.31 56.59 35.63 64.32 1.42
• Operating Profit 13.1% 15.9% 13.7% 9.7% 12.1% 12.1%
• Profit before Tax 10.8% 13.7% 11.3% 6.2% 8.5% 8.5%
• Profit after Tax 7.6% 10.1% 8.4% 4.9% 6.4% 6.4%
Consolidated**:
• Gross revenue NA 16.41 27.05 32.77 40.43 895.66
• Profit after Tax(PAT) NA 1.63 1.80 1.28 1.96 43.32
• Earning per equity share(Rs) NA 66.06 62.22 41.87 67.05 1.49
* The quantity includes production, on job work basis and purchased from/got processed from third par ties.
** Year since consolidation star ted 1 USD = Rs.45.14

26
REPORT ON CORPORATE GOVERNANCE
COMPANY’S PHILOSOPHY ON CORPORATE GOVERNANCE
Company’s philosophy of corporate governance steams from its belief from transparency, integrity and accountability towards all stock holders. Corporate Governance helps to achieve excellence to enhance stakeholders’ value by focusing on long-term stakeholder value creation without compromising on integrity, social obligations and regulatory compliances.
At Kalpataru Power, our continuous endeavor is to achieve good governance, by way of a conscious and conscientious eff ort whereby ensuring the truth, transparency, accountability and responsibility in all our dealings with our employees, stakeholders, consumers and the community at large.
Th e Board of Directors represents the interest of the Company’s stakeholders, for optimizing long-term value by way of providing necessary guidance and strategic vision to the Company. Th e Board also ensures that the Company’s management and employees operate with the highest degree of ethical standards.
We, at Kalpataru Power, believe that the constant eff ort to improve operational performance, guided by our values, forms the basis for good Corporate Governance. Corporate Governance is strongly driven by our values such as quality, commitment, customer orientation and integrity.
I. BOARD OF DIRECTORS
A. Composition of the Board
Th e Board of directors consists of 11 Directors as on March 31, 2010 of which 9 are Non-Executive and 2 are Executive Directors. Th e Chairman is a Non-Executive Promoter Director, apart from him there is 1 Promoter Director and 6 Non-Executive Independent Directors. Th e Board structure is in compliance with Clause 49 of the Listing Agreement.
B. Meetings of Board of Directors
5 Board Meetings were held during the year ended on March 31, 2010 and the gap between any two meetings did not exceed four months. Th e dates on which the Board Meetings were held are May 30, 2009, July 29, 2009, October 26, 2009, January 29, 2010 and February 22, 2010.
C. Directors’ attendance and Directorship held
Th e names and category of Directors on the Board, their attendance at the Board meetings held during the year and also at the last Annual General Meeting, the number of Directorships and Committee Memberships held by them in other companies are given below:
Name of the Directors Category Attendance at No of Directorships and Committee Memberships / Chairmanship (Other than KPTL)**
Board Meetings
Last AGM
Directorship# Committee Chairmanship
Committee Membership
Mr. Mofatraj P. Munot Non – Executive (Promoter) Chairman
5 Yes 101 - -
Mr. Pankaj Sachdeva Managing Director ( w.e.f. June 1, 2009)
Dy. Managing Director( till May 31, 2009)
4 Yes 1 - -
Mr. Parag M. Munot Non – Executive (Promoter)
4 No 110 - -
Mr. Manish Mohnot Executive Director 5 Yes 7 - -
Mr. Sajjanraj Mehta Non - Executive (Independent)
4 Yes 2 - -
Mr. Vimal Bhandari Non - Executive (Independent)
5 Yes 7 1 3
Mr. Shitin Desai Non - Executive (Independent)
3 No 5 - 2
Mr. Narayan Seshadri Non - Executive (Independent)
4 No 10 1 3

27
Name of the Directors Category Attendance at No of Directorships and Committee Memberships / Chairmanship (Other than KPTL)**
Board Meetings
Last AGM
Directorship# Committee Chairmanship
Committee Membership
Mr. Mahendra G. Punatar
Non – Executive(Independent)
(w.e.f. May 30, 2009)
4 Yes 1 - 2
Mr. K. V. Mani Non – Executive(w.e.f. June 1, 2009)Managing Director (upto May 31, 2009)
3 Yes - - -
Mr. S. P. Talwar Non - Executive (Independent)
3 No 12 2 -
Mr. Sanju Ahooja Non - Executive (Independent)
(up to May 31, 2009)
Nil No - - -
**Represent Memberships / Chairmanships of Audit Committee and Shareholders’ Grievance Committee only
# Including Private Limited Companies
None of the Directors of Board is a member of more than 10 Committees and no Director is the Chairman of more than 5 committees across all the companies in which he is a Director. Th e necessary disclosures regarding Committee positions have been made by all the Directors.
D. Code of Conduct
Th e Board has laid down code of conduct for all Board Members and Senior Managerial Personnel of the Company. Th e Code of Conduct is available on the website of the Company at www.kalpatarupower.com .
All Board Members and Senior Managerial Personnel have affi rmed compliance with the Code of Conduct and a declaration to this eff ect signed by the Chief Executive Offi cer (CEO) has been obtained.
II. Audit Committee:
Th e Company has complied with the requirements of Clause 49 (II) (A) of the Listing Agreement relating to composition of Audit Committee.
Th e terms of reference of the Audit Committee are broadly as under:
Oversight of the company’s fi nancial reporting process and the disclosure of its fi nancial information to ensure that the fi nancial statement is correct, suffi cient and credible.
Recommending to the Board, the appointment, re-appointment and, if required, the replacement or removal of the statutory auditor/s and the fi xation of audit fees.
Approval of payment to statutory auditors for any other services rendered by the statutory auditors.
Reviewing, with the management, the annual fi nancial statements before submission to the board for approval, with particular reference to:
• Matters required to be included in the Director’s Responsibility Statement to be included in the Board’s report in terms of clause (2AA) of section 217 of the Companies Act, 1956.
• Changes, if any, in accounting policies and practices and reasons for the same.
• Major accounting entries involving estimates based on the exercise of judgment by management.
• Signifi cant adjustments made in the fi nancial statements arising out of audit fi ndings.
• Compliance with listing and other legal requirements relating to fi nancial statements.
• Disclosure of any related party transactions.
• Qualifi cations in the draft audit report.
28
Reviewing, with the management, the quarterly fi nancial statements before submission to the board for approval.
Reviewing, with the management, performance of statutory and internal auditors and adequacy of the internal control systems.
Reviewing the adequacy of internal audit function, if any, including the structure of the internal audit department, staffi ng and seniority of the offi cial heading the department, reporting structure coverage and frequency of internal audit.
Discussion with internal auditors regarding any signifi cant fi ndings and follow up there on.
Reviewing the fi ndings of any internal investigations by the internal auditors into matters where there is suspected fraud or irregularity or a failure of internal control systems of a material nature and reporting the matter to the board.
Discussion with statutory auditors before the audit commences, about the nature and scope of audit as well as post-audit discussion to ascertain any area of concern.
To look into the reasons for substantial defaults in the payment to the depositors, debenture holders, shareholders (in case of non payment of declared dividends) and creditors.
Reviewing with the management, the statement of uses/application of funds raised through an issue ( public issue, right issue and preferential issue etc.), the statement of funds utilized for purposes other than those stated in the off er document/prospectus/notice and the report submitted by the monitoring agency monitoring the utilization of proceeds of a public or right issue and making appropriate recommendations to the Board to take up steps in the matter.
Approval of appointment of CFO ( i.e. the whole time Finance Director or any other person heading the fi nance function or discharging that function) after assessing the qualifi cations, experience & background etc. of the candidate.
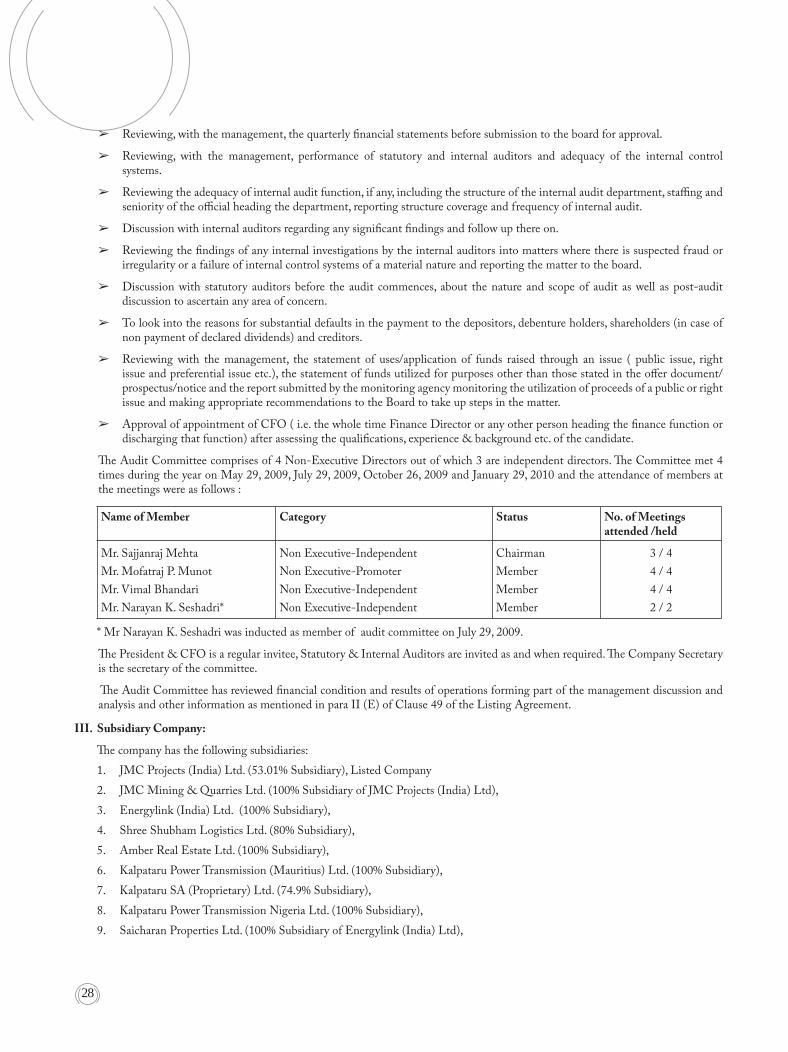
Th e Audit Committee comprises of 4 Non-Executive Directors out of which 3 are independent directors. Th e Committee met 4 times during the year on May 29, 2009, July 29, 2009, October 26, 2009 and January 29, 2010 and the attendance of members at the meetings were as follows :
Name of Member Category Status No. of Meetings attended /held
Mr. Sajjanraj Mehta
Mr. Mofatraj P. Munot
Mr. Vimal Bhandari
Mr. Narayan K. Seshadri*
Non Executive-Independent
Non Executive-Promoter
Non Executive-Independent
Non Executive-Independent
Chairman
Member
Member
Member
3 / 4
4 / 4
4 / 4
2 / 2
* Mr Narayan K. Seshadri was inducted as member of audit committee on July 29, 2009.
Th e President & CFO is a regular invitee, Statutory & Internal Auditors are invited as and when required. Th e Company Secretary is the secretary of the committee.
Th e Audit Committee has reviewed fi nancial condition and results of operations forming part of the management discussion and analysis and other information as mentioned in para II (E) of Clause 49 of the Listing Agreement.
III. Subsidiary Company:
Th e company has the following subsidiaries:
1. JMC Projects (India) Ltd. (53.01% Subsidiary), Listed Company
2. JMC Mining & Quarries Ltd. (100% Subsidiary of JMC Projects (India) Ltd),
3. Energylink (India) Ltd. (100% Subsidiary),
4. Shree Shubham Logistics Ltd. (80% Subsidiary),
5. Amber Real Estate Ltd. (100% Subsidiary),
6. Kalpataru Power Transmission (Mauritius) Ltd. (100% Subsidiary),
7. Kalpataru SA (Proprietary) Ltd. (74.9% Subsidiary),
8. Kalpataru Power Transmission Nigeria Ltd. (100% Subsidiary),
9. Saicharan Properties Ltd. (100% Subsidiary of Energylink (India) Ltd),

29
10. Kalpataru Power Transmission USA INC. (100% Subsidiary) and
11. Adeshwar Infrabuild Ltd. (100% Subsidiary),
Except JMC Projects (India) Ltd., all other subsidiaries are non-material non listed subsidiaries of the Company. Th e review of annual fi nancial statement and investments, if any, made by these unlisted subsidiary companies is done by Audit Committee. Th e minutes of Board Meetings of unlisted subsidiary companies are being placed before the Board of Directors of the Company.
IV. Nomination and Compensation Committee:
Although non mandatory in terms of the listing agreement, the Company has Nomination & Compensation Committee to review, assess and recommend the appointment of executive directors from time to time, to periodically review the remuneration package of the executive directors and recommend suitable revision to the Board.
Remuneration of employees largely consists of base remuneration, perquisites and performance incentives. Th e Components of the total remuneration vary for diff erent cadres and are governed by industry pattern, qualifi cation and experience of the employee, responsibilities handled by him, individual performance etc.
Th e objectives of the remuneration policy are to motivate employees to excel in their performance, recognize their contribution, and retain talent in the organization and reward merit.
Th e Committee comprises of 3 Non-Executive Directors.
Th e Committee met on May 29, 2009 to determine the appointment/re-appointments of Executive Directors and revision of remuneration/promotion of top executives of the Company. Th e meeting was attended by following members of committee:
Name of Member Category Status No. of Meetings attended/held
Mr. Mofatraj P. Munot Non Executive-Promoter Chairman 1/1
Mr. Sajjanraj Mehta Non Executive-Independent Member 1/1
Mr. Vimal Bhandari Non Executive-Independent Member 1/1
Remuneration paid or payable to Directors for the year 2009-2010(Rs. In Lacs)
Name of Director Sitting Fees Commission Salary Contribution to PF
Perquisites Total
Mr. Pankaj Sachdeva# - 31.00 138.12 11.88 7.35 188.35
Mr. Manish Mohnot # - 80.00 96.00 8.16 0.55 184.71
Mr. K. V. Mani# 0.60 39.75 30.00 2.40 0.27 72.42
Mr. Mofatraj P. Munot 1.20 - - - - 1.20
Mr. M. G. Punatar 0.80 3.00 - - - 3.80
Mr. Parag M. Munot 0.80 - - - - 0.80
Mr. Sajjanraj Mehta 0.95 4.25 - - - 5.20
Mr. Vimal Bhandari 1.20 3.75 - - - 4.95
Mr. Shitin Desai 0.60 3.00 - - - 3.60
Mr. Narayan Seshadri 0.90 3.50 - - - 4.40
Mr. S. P. Talwar 0.40 3.00 - - - 3.40
# Mr. K. V. Mani till May 31, 2009 as Managing Director was entitled to 2.5% of the profi ts of the Company as commission which was Rs. 36.75 lacs and Rs. 3 lacs is payable in capacity as non executive director thereafter. In terms of agreement/appointment approved by members, commission/incentive to Mr. Pankaj Sachdeva, Managing Director & Mr. Manish Mohnot, Executive Director has been decided by Board of Directors on recommendation of Remuneration Committee.

30
Information of Directors as on March 31, 2010 is as under:
Name Age Designation Date of initial appointment
Nature of employment
Shares held
Mr. Mofatraj P. Munot. 65 Chairman 27.06.1989 1,964,186
Mr. K. V. Mani 66 Director 24.01.2001 Nil
Mr. Pankaj Sachdeva 48 Managing Director 09.07.2008 Contractual Nil
Mr. Manish Mohnot 37 Executive Director 01.11.2006 Contractual Nil
Mr. Parag M. Munot 40 Director 30.09.1991 2,189,594
Mr. Sajjanraj Mehta 58 Director 25.07.1998 2,000
Mr. Vimal Bhandari 51 Director 28.06.2002 Nil
Mr. Shitin Desai 63 Director 31.03.2005 Nil
Mr. Narayan Seshadri 53 Director 29.01.2007 Nil
Mr. S. P. Talwar 71 Director 30.01.2009 Nil
Mr. M. G. Punatar 74 Director 30.05.2009 1400
Th e contractual agreements with Managing Director and Executive Director can be terminated by either party giving 6 months and 3 months prior notice respectively.
Th ere is no pecuniary relationship or transaction of the company with any Non-Executive Director.
Th e Company does not pay any severance fee and no stock option is available to the directors.
Non-Executive Directors are paid commission on the basis of their contribution during Board and Committee meetings & sitting fee is paid for attending Board and Audit Committee meeting.
V. Shareholders’ Grievance Committee:
Committee’s scope of work is to look into the shareholders’ complaints, if any, and to redress the same expeditiously like transfer of shares, non-receipt of balance sheet, non-receipt of declared dividend etc. Th e committee also review the issuance of duplicate share certifi cates, issue of certifi cates after split/consolidation/renewal and transmission of shares, done by the Share Transfer Committee.
Th e Shareholders’ Grievance Committee comprises of Mr. K. V. Mani, Mr. Pankaj Sachdeva and Mr. Manish Mohnot. Th e Committee met two times during the year on October 26, 2009 and January 29, 2010 and the attendance of members at the meetings were as follows :
Name of Member Capacity Status No. of Meetings attended / held
Mr. K. V. Mani Non-Executive Chairman 2/2
Mr. Pankaj Sachdeva Executive Member 2/2
Mr. Manish Mohnot Executive Member 2/2
Mr. Bajrang Ramdharani, Company Secretary is the Compliance Offi cer.
During the year company has received 9 complaints which were resolved on time and no complaint remains pending at the year end. Th e status of complaints is periodically reported to the Committee and Board of Directors in their meetings.
Th e Board has delegated the powers of approving transfers and transmission of shares, issue of duplicate shares, issue of certifi cates after split/consolidation/renewal and transmission of shares, to a Committee of senior executives. Th e Committee met 9 times during the year. Th ere were no transfers pending as on March 31, 2010.
VI. Disclosures:
I. Management Discussion and Analysis:
Annual Report has a detailed chapter on Management Discussions and Analysis.
II. Basis of Related Party Transaction
All related party transactions are being placed before Audit Committee. Th ere were no transactions with related parties, which are

31
not on arm’s length basis required to be placed before audit committee, together with Management’s justifi cation for the same.
For Related Party Transaction refer to Note No. 26 to the Statement of Account contained in separate Financial Statements in Annual Report of the Company.
Representation from Senior Management personnel has been received confi rming no material fi nancial and commercial transactions were entered by he/she or his/her relatives which may have personal interest, that may have a potential confl ict with the interest of the Company at large.
III. Accounting treatment
Th e company has followed accounting treatment as prescribed in Accounting Standard applicable to the company.
IV. Risk Management
Th e Risk Management Committee is there to ascertain and minimize risk and to take appropriate decisions for regular assessment and minimization of risks. Th e working of this committee is being periodically reviewed by the Board.
V. Details of non-compliance by the Company
Company has complied with all the requirement of regulatory authorities. No penalty/strictures were imposed on the Company by stock exchanges or SEBI or any statutory authority on any matter related to capital market during the last three years.
SHAREHOLDERS INFORMATION
Re-appointment/ Appointment of Directors:
Mr. Mofatraj P. Munot #
Promoter and Chairman of Kalpataru Group, has over 45 years of experience in the fi eld of Real Estate and Property Development, Civil Contracting & various Industries. He holds 1,964,186 Equity Shares in the Company.
List of other Directorship* Chairmanship/Membership of Committees of the Board of other Companies
Kalpataru Ltd.
Caprihans (India) Ltd.
Rajratan Global Wire Ltd. Member of Remuneration Committee
* Excluding Private Limited Companies
# He is father of Mr. Parag M. Munot, Director of Company.
Mr. Sajjanraj Mehta
He is a Chartered Accountant with over 35 years of experience. His area of expertise is in the fi eld of Foreign Exchange, Taxation and Corporate Aff airs & Strategy. He holds 2,000 Equity Shares in the Company.
List of other Directorship* Chairmanship/Membership of Committees of the Board of other Companies
Nil Nil
* Excluding Private Limited Companies
Mr. Parag Munot #
Mr. Parag Munot is a MBA, Carnegie Mellon University, USA with 17 years of experience in Real Estate and Property Development business of the group. Presently he is Managing Director of Kalpataru Ltd. He holds 2,189,594 Equity Shares in the Company.
List of other Directorship* Chairmanship/Membership of Committees of the Board of other Companies
Kalpataru Ltd.
Energylink (India) Ltd.
Saicharan Properties Ltd.
None
* Excluding Private Limited Companies
# He is son of Mr. Mofatraj P. Munot, Chairman of the Company
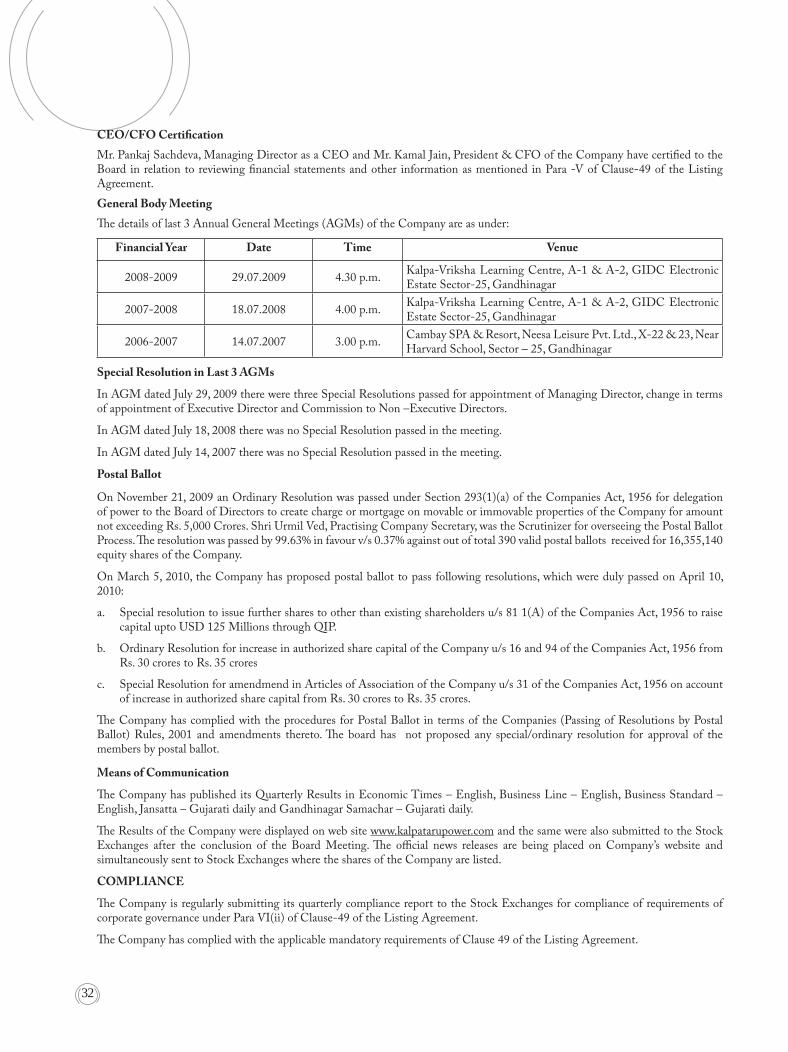
32
CEO/CFO Certifi cation
Mr. Pankaj Sachdeva, Managing Director as a CEO and Mr. Kamal Jain, President & CFO of the Company have certifi ed to the Board in relation to reviewing fi nancial statements and other information as mentioned in Para -V of Clause-49 of the Listing Agreement.
General Body Meeting
Th e details of last 3 Annual General Meetings (AGMs) of the Company are as under:
Financial Year Date Time Venue
2008-2009 29.07.2009 4.30 p.m.Kalpa-Vriksha Learning Centre, A-1 & A-2, GIDC Electronic Estate Sector-25, Gandhinagar
2007-2008 18.07.2008 4.00 p.m.Kalpa-Vriksha Learning Centre, A-1 & A-2, GIDC Electronic Estate Sector-25, Gandhinagar
2006-2007 14.07.2007 3.00 p.m.Cambay SPA & Resort, Neesa Leisure Pvt. Ltd., X-22 & 23, Near Harvard School, Sector – 25, Gandhinagar
Special Resolution in Last 3 AGMs
In AGM dated July 29, 2009 there were three Special Resolutions passed for appointment of Managing Director, change in terms of appointment of Executive Director and Commission to Non –Executive Directors.
In AGM dated July 18, 2008 there was no Special Resolution passed in the meeting.
In AGM dated July 14, 2007 there was no Special Resolution passed in the meeting.
Postal Ballot
On November 21, 2009 an Ordinary Resolution was passed under Section 293(1)(a) of the Companies Act, 1956 for delegation of power to the Board of Directors to create charge or mortgage on movable or immovable properties of the Company for amount not exceeding Rs. 5,000 Crores. Shri Urmil Ved, Practising Company Secretary, was the Scrutinizer for overseeing the Postal Ballot Process. Th e resolution was passed by 99.63% in favour v/s 0.37% against out of total 390 valid postal ballots received for 16,355,140 equity shares of the Company.
On March 5, 2010, the Company has proposed postal ballot to pass following resolutions, which were duly passed on April 10, 2010:
a. Special resolution to issue further shares to other than existing shareholders u/s 81 1(A) of the Companies Act, 1956 to raise capital upto USD 125 Millions through QIP.
b. Ordinary Resolution for increase in authorized share capital of the Company u/s 16 and 94 of the Companies Act, 1956 from Rs. 30 crores to Rs. 35 crores
c. Special Resolution for amendmend in Articles of Association of the Company u/s 31 of the Companies Act, 1956 on account of increase in authorized share capital from Rs. 30 crores to Rs. 35 crores.
Th e Company has complied with the procedures for Postal Ballot in terms of the Companies (Passing of Resolutions by Postal Ballot) Rules, 2001 and amendments thereto. Th e board has not proposed any special/ordinary resolution for approval of the members by postal ballot.
Means of Communication
Th e Company has published its Quarterly Results in Economic Times – English, Business Line – English, Business Standard – English, Jansatta – Gujarati daily and Gandhinagar Samachar – Gujarati daily.
Th e Results of the Company were displayed on web site www.kalpatarupower.com and the same were also submitted to the Stock Exchanges after the conclusion of the Board Meeting. Th e offi cial news releases are being placed on Company’s website and simultaneously sent to Stock Exchanges where the shares of the Company are listed.
COMPLIANCE
Th e Company is regularly submitting its quarterly compliance report to the Stock Exchanges for compliance of requirements of corporate governance under Para VI(ii) of Clause-49 of the Listing Agreement.
Th e Company has complied with the applicable mandatory requirements of Clause 49 of the Listing Agreement.

33
ADDITIONAL SHAREHOLDERS INFORMATION
Annual General Meeting, Book Closure & Dividend Payment
Th e information of forthcoming Annual General Meeting, Book Closure and Dividend payment details have been provided in the Notice of Annual General Meeting enclosed alongwith this Annual Report and being mailed to all the shareholders separately.
Financial Calendar
Financial Year: 1st
April to 31st
March
Financial Results :
First Quarter Results : July End
Half Year Results : October End
Th ird Quarter Results : January End
Annual Results : May End
Listing
At present, the equity shares of the Company are listed on the Bombay Stock Exchange Ltd. (BSE) and the National Stock Exchange of India Ltd. (NSE).
Name of Stock Exchange Stock Code
Bombay Stock Exchange Ltd. 522287
National Stock Exchange of India Ltd. KALPATPOWR
ISIN No. (Dematerialized Shares) INE220B01014
Th e Company has already paid the listing fees for the year 2009-10 to all the Stock Exchanges.
Stock Market Data
Monthly High and Low price of the Company’s shares for 2009-2010 on BSE and NSE
Month Bombay Stock Exchange Ltd. National Stock Exchange of India Ltd.
High Share Price Rs.
Low Share Price Rs.
Index during the Month High Share
Price Rs.
Low Share Price Rs.
Nifty during the Month
High Low High Low
Apr-2009 430.75 322.50 11,492.10 9,546.29 428.95 326.00 3,517.25 2,965.70
May-2009 755.00 365.00 14,930.54 11,621.30 768.20 386.30 4,509.40 3,478.70
Jun-2009 855.00 657.00 15,600.30 14,016.95 851.00 651.85 4,693.20 4,143.25
Jul-2009 834.40 639.00 15,732.81 13,219.99 872.80 636.35 4,669.75 3,918.75
Aug-2009 873.85 660.00 16,002.46 14,684.45 883.30 672.25 4,743.75 4,353.45
Sep-2009 897.00 777.00 17,142.52 15,356.72 895.95 760.25 5,087.60 4,576.60
Oct-2009 1,044.00 815.00 17,493.17 15,805.20 1,044.00 820.00 5,181.95 4,687.50
Nov-2009 954.70 870.00 17,290.48 15,330.56 974.00 870.00 5,138.00 4,538.50
Dec-2009 1,145.15 899.95 17,530.94 16,577.78 1,146.85 895.00 5,221.85 4,943.95
Jan-2010 1,250.00 992.00 17,790.33 15,982.08 1,238.80 991.00 5,310.85 4,766.00
Feb-2010 1,188.00 990.00 16,669.25 15,651.99 1,190.00 995.00 4,992.00 4,675.40
Mar-2010 1,120.00 989.05 17,793.01 16,438.45 1,119.00 991.10 5,329.55 4,935.35
*Face value of Shares : Rs. 10 each

34
Comparison of KPTL Price with Broad Based Indices
Registrar & Transfer AgentFor Physical Mode & Depository Mode:Link Intime India Pvt. Ltd.211, Sudarshan Complex,Nr. Mithakhali Under Bridge,Navrangpura, AHMEDABAD – 380 009Tel. & Fax: 91 79 26465179
Share Transfer SystemShareholders/Investors are requested to send share transfer related documents directly to our RTA whose address is given at the beginning of this section. A Committee of executives of the Company is authorised to approve transfer of shares. If the transfer documents are in order, the transfer of share(s) is registered within 15 days of receipt of transfer documents by our RTA.
Th e Company has obtained the half yearly certifi cates from a Company Secretary in Practice for due compliance of share transfer formalities as per the requirement of Clause 47 ( c ) of the Listing Agreement of the Stock Exchanges. Th ese certifi cates have been submitted to the Stock Exchanges. Th e Company has also carried out Quarterly Secretarial Audit for the reconciliation of Share Capital as required under SEBI circular No. 16 dated December 31, 2002.
Distribution of Shareholding: (As on March 31, 2010)
No. of Shares of Shareholders No. of Shares held
Rs. 10 each Number % of Total Number % of Total
Upto – 500 15,658 96.54 873,926 3.30
501 – 1000 223 1.38 173,196 0.65
1001 – 2000 111 0.68 166,608 0.63
2001 – 3000 48 0.30 121,043 0.46
3001 – 4000 26 0.16 90,835 0.34
4001 – 5000 19 0.12 86,534 0.33
5001 – 10000 31 0.19 217,929 0.82
10001 – And Above 103 0.64 24,769,929 93.47
Total 16,219 100.00 26,500,000 100.00

35
Shareholding Pattern as on March 31, 2010
SN Category No. of Shares held % of Shares held
A Promoter & Promoter Group Share Holding :
Indian 16,876,266* 63.68*
Foreign - -
B Public Share Holding :
1. Institutional :
Mutual Funds & UTI 3,177,986 11.99
Banks, Financial Inst. 86,873 0.33
Venture Capital Fund 1,439,000 5.43
Insurance Companies 1,204,390 4.54
FIIs 1,347,688 5.08
2. Non-Institutional :
Private Corporate Bodies 457,690 1.73
NRIs / OCBs 192,686 0.73
Indian Public 1,701,050 6.42
Clearing Members 16,371 0.06
Total 26,500,000 100.00
*Out of above, Promoters & promoter group have pledged 1,590,000 Equity Shares constituting 9.42 % of their holding in the Company and 6.00% of total equity of the Company.
Dematerialization of Shares and Liquidity
98.85% Shares are in demate form as on March 31, 2010.
Outstanding GDRs/ADRs/Warrants/Options
Th e Company has No GDRs/ADRs/Warrants/Options outstanding as on March 31, 2010.
Plant Location
Main Plant & Registered Offi ce (Address for Correspondence)
Plot No.101, Part III, G.I.D.C. Estate, Sector – 28GANDHINAGAR – 382 028 Tel : 079 – 23214000, Fax : 079- 23211966 & 68
R & D Centre
At Punadara VillageNear Talod DamTaluka – PrantijDist. Sabarkatha (Gujarat)Tel : 02770- 255414
EOU PlantPlot No. A-4/1, A-4/2, A-5, G.I.D.C. Electronic Estate,Sector – 25, Gandhinagar – 382 025Tel.: 079-23214400Fax : 079-23287215
Biomass Energy Division (Power Plant)1) 27BB, Tehsil Padampur, Dist. Sri GanganagarGANAGAR (Rajasthan) Tel. : 0154 - 2473725 Fax : 0154 -2473724
Corporate Offi ce “Kalpataru Synergy” 8th Floor, Opp. Grand Hyatt Hotel,Vakola, Santa Cruz (East),Mumbai – 400 055Tel.: 022 – 30645000Fax: 022 – 30643131
2) Near Village Khatoli, Tehsil Uniara, Dist. Tonk Rajasthan - 304 024 Tel.: 01436 – 260665 Fax.: 01436 – 260666

36
CERTIFICATE BY CHIEF EXECUTIVE OFFICER
All Board members and senior management personnel have, for the year ended March 31, 2010 affi rmed compliance with the Code of Conduct laid down by the Board of Directors in terms of the Listing Agreement entered with the Stock Exchanges.
For Kalpataru Power Transmission Limited
Pankaj SachdevaChief Executive Offi cer
Managing Director
AUDITORS’ REPORT ON CORPORATE GOVERNANCE
ToTh e Members of Kalpataru Power Transmission Ltd.
We have examined the compliance of the conditions of Corporate Governance by Kalpataru Power Transmission Limited (‘the Company’) for the year ended March 31, 2010 as stipulated in Clause 49 of the Listing Agreement of the Company with Stock Exchanges in India.
Th e compliance of conditions of Corporate Governance is the responsibility of the management. Our examination was limited to a review of the procedures and implementation thereof, adopted by the Company for ensuring the compliance of the conditions of Corporate Governance. It is neither an audit nor an expression of the opinion on the fi nancial statements of the Company.
In our opinion and to the best of our information and explanations given to us, we certify that the Company has complied with the conditions of Corporate Governance as stipulated in the above mentioned Listing Agreement.
We further state that such compliance is neither an assurance as to the future viability of the Company nor of the effi ciency or eff ectiveness with which the management has conducted the aff airs of the Company.
For Kishan M. Mehta & Co., For Deloitte Haskins & Sells,
Chartered Accountants (Registration No. 105229W)
Chartered Accountants (Registration No. 117365W)
(Kishan M. Mehta)Partner Membership No. 13707
(Gaurav J. Shah)PartnerMembership No. 35701
Place: AhmedabadDate: May 29, 2010
Place: AhmedabadDate: May 29, 2010
Date: May 28, 2010Place: Mumbai

37
ToTh e Members ofKalpataru Power Transmission Limited.
We have audited the attached Balance Sheet of 1. KALPATARU POWER TRANSMISSION LIMITED (“the Company”) as at March 31, 2010, the Profi t and Loss Account and the Cash Flow Statement of the Company for the year ended on that date, both annexed thereto. Th ese fi nancial statements are the responsibility of the Company’s management. Our responsibility is to express an opinion on these fi nancial statements based on our audit.
We conducted our audit in accordance with auditing standards generally accepted in India. Th ose Standards require that we plan 2. and perform the audit to obtain reasonable assurance about whether the fi nancial statements are free of material misstatement. An audit includes examining, on a test basis, evidence supporting the amounts and disclosures in the fi nancial statements. An audit also includes assessing the accounting principles used and signifi cant estimates made by management, as well as evaluating the overall fi nancial statement presentation. We believe that our audit provides a reasonable basis for our opinion.
As required by the Companies (Auditor’s Report) Order, 2003, (CARO), issued by the Central Government of India in terms 3. of Section 227 (4A) of the Companies Act, 1956 (‘the Act’) and on the basis of such checks as we considered appropriate, and according to the information and explanations given to us, we enclose in the Annexure a statement on the matters specifi ed in paragraphs 4 and 5 of the said Order.
Further to our comments in the Annexure referred to in paragraph 3 above, we report as follows:4.
We have obtained all the information and explanations, which to the best of our knowledge and belief were necessary for the (a) purposes of our audit;
In our opinion, proper books of account as required by law have been kept by the Company so far as appears from our (b) examination of such books;
Th e Balance Sheet, the Profi t and Loss Account and the Cash Flow Statement dealt with by this report are in agreement with (c) the books of account;
In our opinion, the Balance Sheet, the Profi t and Loss Account and the Cash Flow Statement dealt with by this report are in (d) compliance with the Accounting Standards referred to in Section 211(3C) of the Companies Act, 1956;
In our opinion and to the best of our information and according to the explanations given to us, the said accounts read with (e) the notes thereon, and subject to third party confi rmations, give the information required by the Companies Act, 1956 in the manner so required and give a true and fair view in conformity with accounting principles generally accepted in India:
In the case of the Balance Sheet, of the state of aff airs of the Company as at March 31, 2010; i.
In the case of the Profi t & Loss Account, of the profi t of the Company for the year ended on that date; and ii.
In the case of the Cash Flow Statement, of the cash fl ows of the Company for the year ended on that date.iii.
On the basis of written representations received from the Directors as on March 31, 2010 and taken on record by the Board of 5. Directors, none of the Directors is disqualifi ed as on March 31, 2010 from being appointed as a director in terms of Section 274(1)(g) of the Companies Act, 1956;
For Kishan M. Mehta & Co., For Deloitte Haskins & Sells,
Chartered Accountants(Registration No.105229W)
Chartered Accountants(Registration No 117365W)
Kishan M. Mehta Gaurav J. Shah
Partner Partner
(Membership No. 13707) (Membership No. 35701)
Place: Ahmedabad Place: Ahmedabad
Date: May 29, 2010 Date: May 29, 2010
AUDITORS’ REPORT

38
(Referred to in paragraph 3 of our report of even date on the accounts of Kalpataru Power Transmission Limited)
1. (a) Th e Company has maintained proper records showing full particulars including quantitative details and situation of fi xed assets;
(b) As explained to us, the assets have been physically verifi ed by the management in accordance with a phased program of verifi cation of its fi xed assets adopted by the Company which, in our opinion, is reasonable, considering the size and the nature of its business. Th e frequency of verifi cation is reasonable and no material discrepancies have been noticed on such physical verifi cation.
(c) During the year, the Company has not disposed off substantial part of fi xed assets.
2. (a) Th e inventory has been physically verifi ed by the management during the year at reasonable intervals. In our opinion, the frequency of verifi cation is reasonable.
(b) In our opinion and according to the information and explanations given to us, procedures of physical verifi cation of inventory followed by the management are reasonable and adequate in relation to the size of the Company and the nature of its business.
(c) Th e Company is maintaining proper records of inventory. In our opinion, discrepancies noticed on physical verifi cation of stocks have been properly dealt with in the books of accounts.
3. (a) Th e Company has granted unsecured loans to two companies covered in the register maintained under section 301 of the Companies’ Act, 1956. Th e maximum amount involved during the year and the year end balance is 12696.18 lacs.
(b) In our opinion, the rate of interest and other terms and conditions of the loans given by the Company are not prima facie prejudicial to the interest of the Company.
(c) Th e said parties have been regular in the payment of principal and interest as per stipulation, if any.
(d) Th ere is no overdue amount in respect of loans granted to companies, fi rms or other parties listed in the register maintained under section 301 of the Companies Act, 1956.
(e) Th e Company has not taken any loans, secured or unsecured, from companies, fi rms or other parties listed in the register maintained under Section 301 of the Companies Act, 1956. Th erefore, the provisions of sub-clause (e), (f ) and (g) of clause 4 (iii) of the Order are not applicable to the Company.
4. In our opinion and according to the information and explanations given to us, there are adequate internal control procedures commensurate with the size of the Company and the nature of its business for the purchases of inventory and fi xed assets and for the sale of goods and services. During the course of audit, no major weakness has been noticed in the internal controls in respect of theses areas.
5. (a) Based on the audit procedures applied by us and according to the information and explanations provided by the management, we are of the opinion that the particulars of contracts or arrangement that need to be entered into the Register maintained under Section 301 of the Companies Act, 1956 have been so entered.
(b) According to the information and explanations given to us, the transactions made in pursuance of contracts or arrangements entered in the register maintained under Section 301 of the Companies Act, 1956 have been made at the prices which are reasonable having regard to the prevailing market prices at the relevant time.
6. According to the information and explanations given to us the Company has not accepted any deposits during the year from public within the meaning of the provisions of Section 58A and 58AA or any relevant provisions of the Companies’ Act, 1956 and rules made thereof.
7. In our opinion, the Company has an internal audit system commensurate with the size and nature of its business.
8. We have broadly reviewed the books of account relating to materials, labour and other items of cost maintained by the Company in respect of generation of electricity from agriculture residue pursuant to the rules made by the Central Government for the maintenance of cost records under section 209 (1) (d) of the Companies Act, 1956 and we are of the opinion that prima facie the prescribed accounts and records have been made and maintained.
9. (a) According to the information and explanations given to us and the records examined by us, the Company is generally regular in depositing with appropriate authorities undisputed statutory dues including provident fund, investor education and protection fund, employees’ state insurance, income-tax, sales tax, wealth tax, service tax, custom duty, excise duty, cess and other material statutory dues applicable to it and no undisputed amounts payable in respect of such dues were outstanding as at March 31, 2010 for a period of more than six months from the date they became payable.
ANNEXURE TO AUDITORS’ REPORT

39
(b) According to the information and explanations given to us, there are no dues of income tax, sales tax, wealth tax, service tax, customs duty, excise duty and cess which have not been deposited on account of any dispute except the followings:
Sr. No
Name of the statute Nature of dues Year Amount(Rs. In Lacs)
Forum where dispute is pending
1. Finance Act,1994 Penalty for delayed payment of Service Tax
2005-06 120.29 Customs, Excise and Service Tax Appellate Tribunal
2. Rajasthan Tax on Entry of Goods in Local Area Act, 1999
Entry Tax 2005-06 10.49 High Court of Rajasthan
3. Rajasthan VAT Act, 2003
VAT 2005-06 84.34 Deputy Commissioner, Commercial Taxes (Appeals)
4. Mumbai Stamp Act, 1958
Additional Stamp duty on land
2005-06 7.56 Deputy Collector of Stamps Duty
5. Madhya Pradesh VAT Act, 2002
VAT 2006-07 13.63 Deputy Commissioner, Commercial Taxes
2007-08 18.21
10. Th ere are no accumulated losses of the Company as at March 31, 2010. Th e Company has not incurred cash losses during the fi nancial year covered by our audit and in the immediately preceding fi nancial year.
11. In our opinion and according to the information and explanations given to us, the Company has not defaulted in repayment of dues to a fi nancial institution or bank or debentures holders.
12. Th e Company has not granted any loans or advances on the basis of security, by way of pledge of shares, debentures and other securities.
13. As per the information and explanations given to us, the Company is not a chit fund or nidhi mutual benefi t fund/Society, therefore, the provisions of para 4 (xiii) of the Companies (Auditor’s Report) Order, 2003 are not applicable to the Company.
14. As per the information and explanations given to us, the Company is not dealing or trading in shares, securities, debentures and other investments. Accordingly, the provisions of para 4(xiv) of the Companies (Auditor’s Report) Order, 2003 are not applicable to the Company.
15. Th e Company has given guarantees and letters of comfort in respect of loans taken by the Company’s subsidiary companies from banks and fi nancial institution. According to the information and explanations given to us, the terms and conditions on which the Company has given guarantees and letters of comfort are not prejudicial to the interest of the Company.
16. According to the information and explanations given to us, in our opinion the term loans raised during the year have been applied for the purposes for which they were raised.
17. According to the information and explanations given to us and on an overall examination the balance sheet and cash fl ow statement of the Company, we report that no funds raised on short-term basis have been used for long term investment.
18. Th e Company has not made any preferential allotment of shares during the year. 19. According to the information and explanations given to us, during the year, the Company had issued 700 debentures of
Rs. 1,000,000 each aggregating to Rs. 7,000 lacs and the Company is in the process of creating security in respect of the debentures issued.
20. Th e Company has not raised any money by way of public issue during the year. 21. We have been informed by the Company that a supervisor, in collusion with persons of the contractors prepared forged
weighment slips and goods received notes of input material at the Collection Center of the bio mass division resulting into a loss of Rs. 10.66 lacs during the year under audit. Th e said loss has been accounted for in the books of account and a police complaint has been lodged for which investigations are in progress. Other than this, based on the audit procedures performed for the purpose of reporting the true and fair view of the fi nancial statement and as per the information and explanation given by the management, we report that no fraud on or by the Company has been noticed or reported during the course of our audit.
For Kishan M. Mehta & Co. For Deloitte Haskins & Sells
Chartered Accountants(Registration No.105229W)
Chartered Accountants(Registration No 117365W)
Kishan M. Mehta Gaurav J. Shah
Partner Partner
(Membership No. 13707) (Membership No. 35701)
Place: Ahmedabad Place: Ahmedabad
Date: May 29, 2010 Date: May 29, 2010

40
BALANCE SHEET AS AT MARCH 31, 2010
SCHEDULE AS AT
31/03/2010
Rs. in Lacs
AS AT
31/03/2009
Rs. in Lacs
SOURCES OF FUNDS :
Shareholder’s Funds:
Share Capital ‘A’ 2,650.00 2,650.00
Reserves & Surplus ‘B’ 96,156.32 81,045.04
98,806.32 83,695.04
Loan Funds :
Secured Loans ‘C’ 51,260.24 48,543.96
Unsecured Loans ‘D’ 9,171.67 16,926.66
60,431.91 65,470.62
Deferred Tax Liabilities 1,407.84 1,279.84
TOTAL 160,646.07 150,445.50
APPLICATION OF FUNDS :
Fixed Assets : ‘E’
Gross Block 47,125.66 35,909.22
Less: Depreciation 13,632.72 10,069.32
Net Block 33,492.94 25,839.90
Capital Work in Progress 354.92 999.50
33,847.86 26,839.40
Investments ‘F’ 12,651.40 12,682.52
Current Assets, Loans & Advances :
Inventories ‘G’ 26,892.12 23,688.61
Sundry Debtors ‘H’ 132,212.68 97,715.66
Accrued value of work done 32,920.80 35,532.01
Cash & Bank Balances ‘I’ 3,687.15 4,451.89
Loans & Advances ‘J’ 42,781.98 31,177.67
238,494.73 192,565.84
Less:Current Liabilities & Provisions: ‘K’
Current Liabilities 111,588.89 72,142.92
Provisions 12,759.03 9,499.34
124,347.92 81,642.26
Net Current Assets 114,146.81 110,923.58
TOTAL 160,646.07 150,445.50
Signifi cant Accounting Policies and notes forming Part of Accounts ‘S’
The Schedules referred to above and the Notes attached form an integral part of Statement of Accounts.
In terms of our report attached For and on behalf of the Board
For Kishan M. Mehta & Co., For Deloitte Haskins & Sells, Pankaj Sachdeva Manish Mohnot
Chartered Accountants Chartered Accountants Managing Director Executive Director
(Kishan M. Mehta) (Gaurav J. Shah) Kamal Jain Bajrang Ramdharani
Partner Partner President & CFO Company Secretary
(M. No. 13707) (M. No. 35701)
AHMEDABAD: May 29, 2010 MUMBAI: May 28, 2010
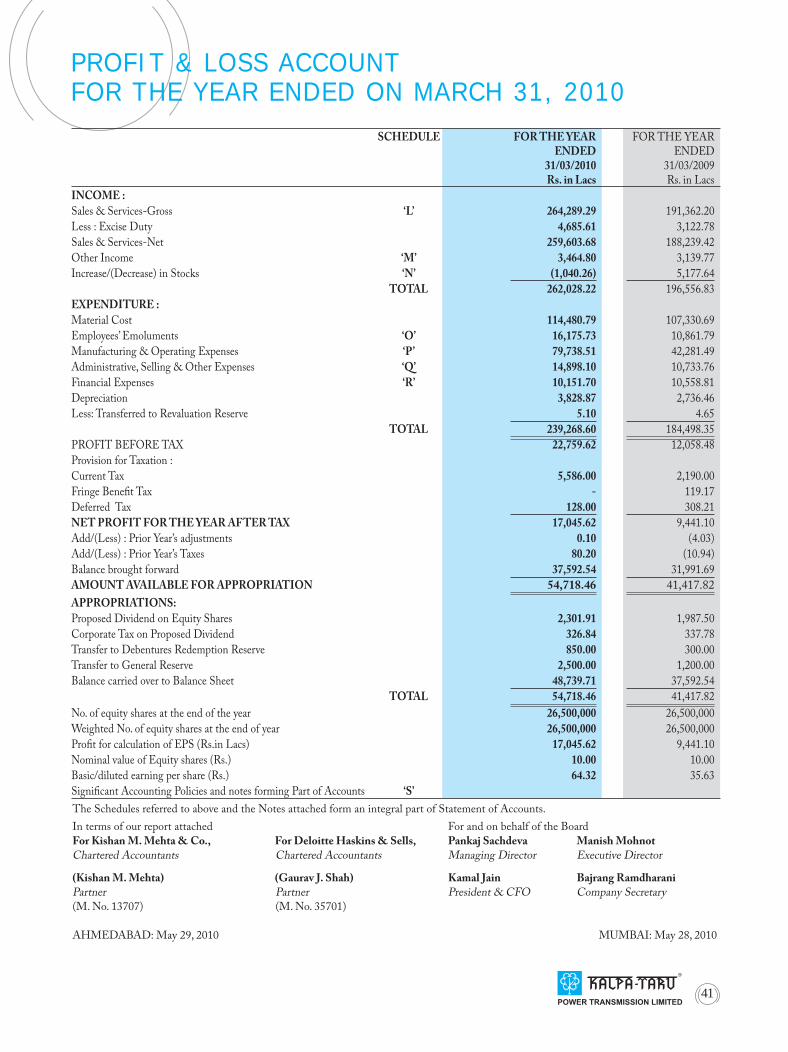
41
PROFIT & LOSS ACCOUNTFOR THE YEAR ENDED ON MARCH 31, 2010
SCHEDULE FOR THE YEAR ENDED
31/03/2010Rs. in Lacs
FOR THE YEAR ENDED
31/03/2009Rs. in Lacs
INCOME :
Sales & Services-Gross ‘L’ 264,289.29 191,362.20
Less : Excise Duty 4,685.61 3,122.78
Sales & Services-Net 259,603.68 188,239.42
Other Income ‘M’ 3,464.80 3,139.77
Increase/(Decrease) in Stocks ‘N’ (1,040.26) 5,177.64
TOTAL 262,028.22 196,556.83
EXPENDITURE :
Material Cost 114,480.79 107,330.69
Employees’ Emoluments ‘O’ 16,175.73 10,861.79
Manufacturing & Operating Expenses ‘P’ 79,738.51 42,281.49
Administrative, Selling & Other Expenses ‘Q’ 14,898.10 10,733.76
Financial Expenses ‘R’ 10,151.70 10,558.81
Depreciation 3,828.87 2,736.46
Less: Transferred to Revaluation Reserve 5.10 4.65
TOTAL 239,268.60 184,498.35
PROFIT BEFORE TAX 22,759.62 12,058.48
Provision for Taxation :
Current Tax 5,586.00 2,190.00
Fringe Benefi t Tax - 119.17
Deferred Tax 128.00 308.21
NET PROFIT FOR THE YEAR AFTER TAX 17,045.62 9,441.10
Add/(Less) : Prior Year’s adjustments 0.10 (4.03)
Add/(Less) : Prior Year’s Taxes 80.20 (10.94)
Balance brought forward 37,592.54 31,991.69
AMOUNT AVAILABLE FOR APPROPRIATION 54,718.46 41,417.82
APPROPRIATIONS:
Proposed Dividend on Equity Shares 2,301.91 1,987.50
Corporate Tax on Proposed Dividend 326.84 337.78
Transfer to Debentures Redemption Reserve 850.00 300.00
Transfer to General Reserve 2,500.00 1,200.00
Balance carried over to Balance Sheet 48,739.71 37,592.54
TOTAL 54,718.46 41,417.82
No. of equity shares at the end of the year 26,500,000 26,500,000
Weighted No. of equity shares at the end of year 26,500,000 26,500,000
Profi t for calculation of EPS (Rs.in Lacs) 17,045.62 9,441.10
Nominal value of Equity shares (Rs.) 10.00 10.00
Basic/diluted earning per share (Rs.) 64.32 35.63
Signifi cant Accounting Policies and notes forming Part of Accounts ‘S’
The Schedules referred to above and the Notes attached form an integral part of Statement of Accounts.
In terms of our report attached For and on behalf of the Board
For Kishan M. Mehta & Co., For Deloitte Haskins & Sells, Pankaj Sachdeva Manish Mohnot
Chartered Accountants Chartered Accountants Managing Director Executive Director
(Kishan M. Mehta) (Gaurav J. Shah) Kamal Jain Bajrang Ramdharani
Partner Partner President & CFO Company Secretary
(M. No. 13707) (M. No. 35701)
AHMEDABAD: May 29, 2010 MUMBAI: May 28, 2010

42
31/03/2010Rs. in Lacs
31/03/2009Rs. in Lacs
SCHEDULE ‘A’ SHARE CAPITAL :
AUTHORISED :
30,000,000 (30,000,000) Equity Shares
of Rs.10 each 3,000.00 3,000.00
TOTAL 3,000.00 3,000.00
ISSUED, SUBSCRIBED & PAID-UP:
26,500,000 (26,500,000) Equity Shares
of Rs.10 each fully paid up 2,650.00 2,650.00
Out of above :
a) 14,186,500 (14,186,500) shares allotted as fully paid up bonus shares by capitalisation out of general reserve, capital redemption reserve and share premium account, and
b) 3,060,000 (3,060,000) shares allotted for consideration other than cash.
TOTAL 2,650.00 2,650.00
SCHEDULE ‘B’ RESERVES AND SURPLUS:
REVALUATION RESERVE:
As per last Balance Sheet 50.52 55.18
Less: Transferred to Profi t & Loss Account 5.10 4.65
45.42 50.53
SHARE PREMIUM:
As per last Balance Sheet 34,447.13 34,447.13
FOREIGN CURRENCY TRANSLATION RESERVE:
As per last Balance Sheet
Add/Less :- During the year 619.23 (178.19)
619.23 (178.19)
Transferred from/to General Reserve (178.19) 178.19
441.04 -
DEBENTURES REDEMPTION RESERVE:
As per last Balance Sheet 300.00 -
Add : Transferred from Profi t & Loss Account 850.00 300.00
1,150.00 300.00
GENERAL RESERVE:
As per last Balance Sheet 8,654.83 7,633.03
Transferred to/from Foreign Currency Translation Reserve 178.19 178.19
Add : Transferred from Profi t & Loss Account 2,500.00 1,200.00
11,333.02 8,654.84
PROFIT & LOSS:
As per Profi t & Loss Account 48,739.71 37,592.54
TOTAL 96,156.32 81,045.04
SCHEDULES TO AND FORMING PART OF ACCOUNTS

43
31/03/2010Rs. in Lacs
31/03/2009Rs. in Lacs
SCHEDULE ‘C’: SECURED LOANS:
A. DEBENTURES:
Secured Non-convertible Redeemable debentures 15,000.00 8,000.00
(refer note no. 14 )
B. TERM LOANS:
From Banks
(I) Secured by charge over freehold land and immovable properties, specifi c movable plant & machineries of Bio-mass Power Plant situated at Padampur, Dist. Sri Ganganagar, Rajasthan 292.19 585.26
(II) Secured by charge over immovable and movable plant & machineries of Bio-mass Power Plant situated at Uniara, Dist.Tonk, Rajasthan and second charge on current assets of the same.
1,496.07 2,251.50
(III) Secured by way of hypothecation of all movable fi xed assets of transmission line tower plant at sector-28, Gandhinagar on paripasu basis alongwith consortium of bankers for working capital facilities stated hereunder. 832.66 1,666.33
(IV) Secured by hypothecation of Specifi c movable fi xed assets relating to Infrastructure Division 352.94 776.47
(V) Secured Against Vehicles 121.09 134.39
18,094.95 13,413.95
C. WORKING CAPITAL FACILITIES FROM BANKS:
(I) Secured in favour of consortium of bankers by hypothecation of stocks, stores and spares, book debts and bills receivables and all other movable assets and further secured by all movable fi xed assets except charged to others as stated herein above of the factory premises and godown situated at Gandhinagar or wherever else pertaining to transmission & distribution and infrastructure division and by simple mortgage over land and building situated at Sector-28, Gandhinagar 31,985.54 32,723.23
(II) Bill discounting facility secured by fi rst pari-passu charge on current assets and all movable assets at Project sites premises and godowns of the sites for execution of work under GFSS-II of Maharashtra State Electricity Distribution Co. Limited. 1,179.75 2,406.78
TOTAL 51,260.24 48,543.96
SCHEDULE ‘D’ UNSECURED LOANS:
a) Short Term Loan from Bank - 10,000.00
b) Short Term Loan from Others - 5,000.00
c) Overdraft & Bill discounting facilities from Banks.(refer note no. 15 ) 9,171.67 1,926.66
TOTAL 9,171.67 16,926.66
SCHEDULES TO AND FORMING PART OF ACCOUNTS

44
SCHEDULE ‘E’ : FIXED ASSETS: (Rs.in Lacs)
PARTICULARS GROSS BLOCK DEPRECIATION NET BLOCK
AS AT 01/04/2009
#ADDITIONS DEDUCTIONS
AS AT 31/03/2010
AS AT 01/04/2009
#DURING THE YEAR RECOUPED
AS AT 31/03/2010
AS AT 31/03/2010
AS AT 31/03/2009
Leasehold Land 1,023.05 1,511.33 - 2,534.38 - - - - 2,534.38 1,023.05
Freehold Land 283.31 - - 283.31 - - - - 283.31 283.31
Buildings 4,162.66 1,487.87 - 5,650.53 518.20 134.64 - 652.84 4,997.69 3,644.46
Plant & Machineries 26,173.64 6,580.67 27.47 32,726.84 8,174.54 2,846.55 23.81 10,997.28 21,729.56 17,999.10
Electric Installation 369.47 39.19 0.83 407.83 103.63 22.88 0.37 126.14 281.69 265.85
Furniture, Fixtures & 2,441.11 468.56 14.96 2,894.71 685.17 254.76 8.44 931.49 1,963.22 1,755.94
Offi ce Equipments - 671.12 - 671.12 - 121.21 - 121.21 549.91 -
Vehicles 1,455.98 549.23 48.27 1,956.94 587.78 237.65 21.68 803.76 1,153.18 868.19
As at 31st March’2010 35,909.22 11,307.97 91.53 47,125.66 10,069.32 3,617.69 54.30 13,632.72 33,492.94 25,839.90
As at 31st March’2009 29,597.34 6,510.64 198.75 35,909.22 7,328.83 2,829.68 89.19 10,069.32 25,839.90 22,268.50
# Foreign exchange diff erences arising due to translation of non-integral foreign operation’s fi xed assets at closing exchange rates have been given eff ect to the additions and depreciation for the year by Rs. 605.76 Lacs and Rs. 211.18 Lacs respectively.
31/03/2010Rs. in Lacs
31/03/2009Rs. in Lacs
SCHEDULE ‘F’ INVESTMENTS:
(As verifi ed, valued and certifi ed by the management)
(A) IN SHARES:
Quoted-Non Trade - Long Term (each share of
Rs.10 fully paid unless otherwise stated)
Nil (97) Equity Shares of KEC International Limited - 0.27
Nil (6) Equity Shares of Octav Investement Limited - 0.00
( Formerly MP Power Line Limited)
Nil (75) Equity Shares of Summit Securities Limited - 0.01
Nil (750) Equity Shares of Jyoti Structures Limited - 0.11
(each share of Rs.2 fully paid)
Nil (50) Equity Shares of SPIC Limited - 0.06
Nil (100) Equity Shares of Larsen & Toubro Limited - 0.07
(each share of Rs.2 fully paid)
Nil (20) Equity Shares of Ultratech Cement Limited - 0.07
100 (100) Equity Shares of Transpower Engineering Limited 0.04 0.04
Nil (19,900) Equity Shares of Bank of India - 8.96
Nil (5,200) Equity Shares of Union Bank of India - 0.83
Nil (13,960 ) Equity Shares of Indian Bank - 12.70
48,366 (48366) Equity Shares of Power Grid Corporation of India Limited 25.15 25.15
Total (A) 25.19 48.27
(B) INVESTMENTS IN SUBSIDIARIES:
Trade - Long Term (each share of Rs.10 fully paid unless otherwise stated)
11,540,247 (9,617,965) Equity Shares of JMC Projects (India) Limited 9,424.21 7,309.70
(Quoted )
Nil (1,100,000) 6% non cummulative redeemable Preference Shares - 2,222.00
of Rs.202/- each of JMC Projects (India) Limited (Unquoted)
16,000,000 (16,000,000) Equity Shares of Shree Shubham Logistics Limited (Unquoted)
1,600.00 1,600.00
12,500,000 (12,500,000) 4% cummulative redeemable Preference Shares 1,250.00 1,250.00
of Shree Shubham Logistics Limited (unquoted)
1,000,000 (1,000,000) Equity Shares of Energylink Limited 100.00 100.00
(Unquoted)
SCHEDULES TO AND FORMING PART OF ACCOUNTS
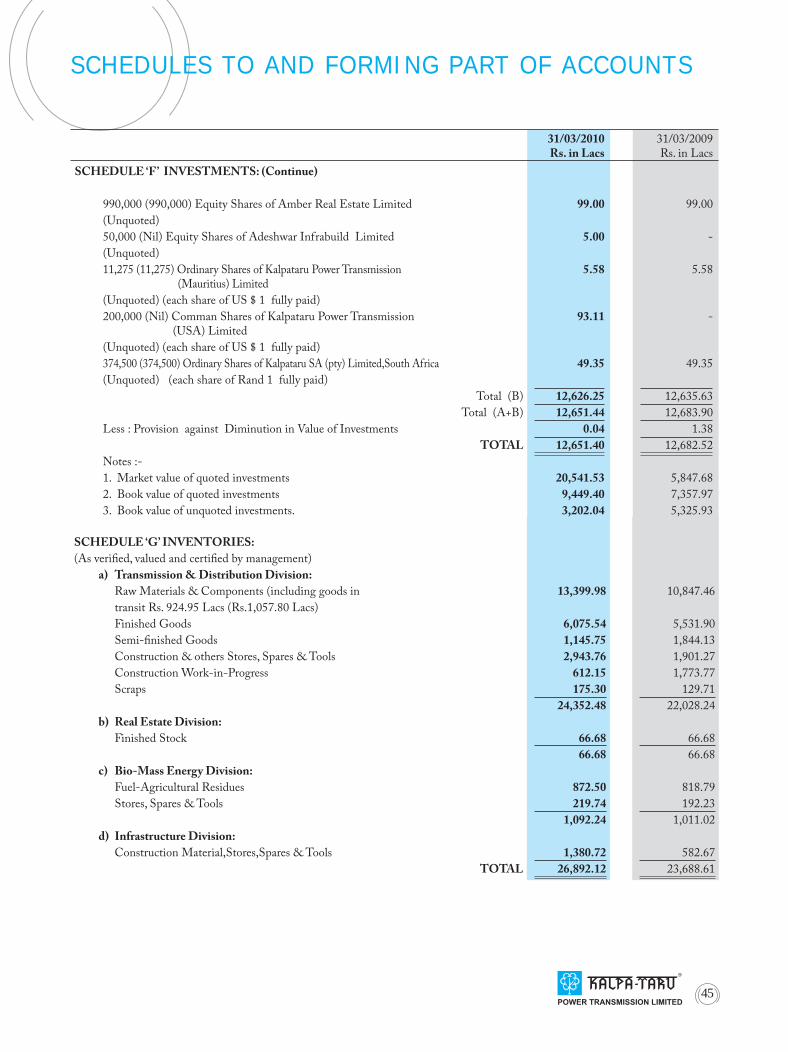
45
SCHEDULE ‘G’ INVENTORIES:
(As verifi ed, valued and certifi ed by management)
a) Transmission & Distribution Division:
Raw Materials & Components (including goods in 13,399.98 10,847.46
transit Rs. 924.95 Lacs (Rs.1,057.80 Lacs)
Finished Goods 6,075.54 5,531.90
Semi-fi nished Goods 1,145.75 1,844.13
Construction & others Stores, Spares & Tools 2,943.76 1,901.27
Construction Work-in-Progress 612.15 1,773.77
Scraps 175.30 129.71
24,352.48 22,028.24
b) Real Estate Division:
Finished Stock 66.68 66.68
66.68 66.68
c) Bio-Mass Energy Division:
Fuel-Agricultural Residues 872.50 818.79
Stores, Spares & Tools 219.74 192.23
1,092.24 1,011.02
d) Infrastructure Division:
Construction Material,Stores,Spares & Tools 1,380.72 582.67
TOTAL 26,892.12 23,688.61
SCHEDULES TO AND FORMING PART OF ACCOUNTS
31/03/2010Rs. in Lacs
31/03/2009Rs. in Lacs
SCHEDULE ‘F’ INVESTMENTS: (Continue)
990,000 (990,000) Equity Shares of Amber Real Estate Limited 99.00 99.00
(Unquoted)
50,000 (Nil) Equity Shares of Adeshwar Infrabuild Limited 5.00 -
(Unquoted)
11,275 (11,275) Ordinary Shares of Kalpataru Power Transmission (Mauritius) Limited
5.58 5.58
(Unquoted) (each share of US $ 1 fully paid)
200,000 (Nil) Comman Shares of Kalpataru Power Transmission (USA) Limited
93.11 -
(Unquoted) (each share of US $ 1 fully paid)
374,500 (374,500) Ordinary Shares of Kalpataru SA (pty) Limited,South Africa 49.35 49.35
(Unquoted) (each share of Rand 1 fully paid)
Total (B) 12,626.25 12,635.63
Total (A+B) 12,651.44 12,683.90
Less : Provision against Diminution in Value of Investments 0.04 1.38
TOTAL 12,651.40 12,682.52
Notes :-
1. Market value of quoted investments 20,541.53 5,847.68
2. Book value of quoted investments 9,449.40 7,357.97
3. Book value of unquoted investments. 3,202.04 5,325.93

46
SCHEDULES TO AND FORMING PART OF ACCOUNTS
31/03/2010Rs. in Lacs
31/03/2009Rs. in Lacs
SCHEDULE ‘H’ SUNDRY DEBTORS :
(Unsecured & considered good unless otherwise stated)
Outstanding over six months (excluding retention money) 31,179.01 34,309.73
Other debts (Including retention money Rs.52,382.34 Lacs 101,033.67 63,405.93
Previous Year Rs.26,382.19 Lacs)
TOTAL 132,212.68 97,715.66
SCHEDULE ‘I’ : CASH AND BANK BALANCES:
Cash in hand 193.37 134.76
Balances with Scheduled Banks
In Current Accounts 1,165.38 450.35
In Margin money accounts (Margin Money having lien by bankers) - 20.38
In Deposit Accounts - 4.19
Balances with non-Scheduled Banks (includes balance under lien 2,328.40 3,842.21
with bank Rs.347.86 Lacs previous year Rs.389.25 Lacs)
TOTAL 3,687.15 4,451.89
SCHEDULE ‘J’ : LOANS AND ADVANCES:
(Unsecured and considered good unless otherwise stated)
Advances recoverable in cash or in kind or for value
to be received 15,102.66 11,522.38
Advances income tax (net of provisions) 2,565.17 2,600.87
Loans to Subsidiaries 19,430.87 7,728.60
Accrued Income 5.56 178.76
Prepaid Expenses 1,852.12 1,077.69
Security Deposits 3,825.60 4,069.37
Advances against property - 4,000.00
TOTAL 42,781.98 31,177.67

47
31/03/2010Rs. in Lacs
31/03/2009Rs. in Lacs
SCHEDULE ‘K’ : CURRENT LIABILITIES & PROVISIONS:
CURRENT LIABILITIES:
Sundry Creditors 48,015.88 31,624.48
Advances from customers 28,603.30 21,869.21
Other Liabilities 15,725.44 11,419.81
Payables under letter of Credit 13,414.10 7,175.65
Bills Payable 5,577.97 -
Interest accrued but not due 232.15 36.67
Unclaimed Dividend 20.05 17.10
(No amount is due for payment to Investor Education
& Protection Fund)
111,588.89 72,142.92
PROVISIONS FOR:
Proposed Dividend 2,301.91 1,987.50
Corporate Tax on Proposed Dividend 326.84 337.78
Leave Encashment 367.56 349.91
Gratuity 73.10 184.65
Performance Warranties 9,689.62 6,639.50
12,759.03 9,499.34
TOTAL 124,347.92 81,642.26
SCHEDULE ‘L’: SALES & SERVICES:
Sales, Erection & Works Contract Receipts:
Transmission & Distribution Division 222,293.06 169,218.05
Infrastructure Division 36,068.86 17,197.69
Bio-Mass Energy Division 5,082.94 4,763.27
Real Estate Division 37.60 6.00
263,482.46 191,185.01
Excise Duty Refund 806.82 177.19
TOTAL 264,289.28 191,362.20
SCHEDULE ‘M’: OTHER INCOME:
Interest Income (Gross) 2,153.64 1,831.86
(TDS.Rs. 208.12 Lacs ; Prev.Yr. Rs. 214.56 Lacs)
Certifi ed Emission Reduction Receipts 528.69 578.28
Dividend from Subsidiaries 326.41 329.15
Dividend from Long Term Investment 2.28 3.04
Dividend from Current Investment - 73.09
Rent Income 232.10 79.70
Profi t on Sale of Investment (net) 96.29 -
Profi t on Sale of fi xed assets 3.75 2.65
Miscellaneous Income 32.74 76.22
Insurance Claims 30.76 93.62
Liabilities Written Back 58.14 72.16
TOTAL 3,464.80 3,139.77
SCHEDULES TO AND FORMING PART OF ACCOUNTS

48
31/03/2010Rs. in Lacs
31/03/2009Rs. in Lacs
SCHEDULE ‘N’: INCREASE (DECREASE) IN STOCKS:
a) Transmission & Distribution Division:
STOCK AT CLOSE :
Finished Goods 6,075.54 5,531.90
Semi-fi nished Goods 1,145.75 1,844.13
Scrap 175.30 77.23
Work in Progress 553.33 1,536.92
7,949.92 8,990.18
STOCK AT COMMENCEMENT :
Finished Goods 5,531.90 2,810.53
Semi-fi nished Goods 1,844.13 941.73
Scrap 77.23 60.28
Work in Progress 1,536.92 -
8,990.18 3,812.54
(1,040.26) 5,177.64
b) Real Estate Division:
STOCK AT CLOSE :
Finished Goods 66.68 66.68
66.68 66.68
STOCK AT COMMENCEMENT :
Finished Goods 66.68 66.68
66.68 66.68
- -
TOTAL (1,040.26) 5,177.64
SCHEDULE ‘O’: EMPLOYEES EMOLUMENTS:
Salaries, Wages, Bonus 14,915.82 9,669.84
Contributions to Provident & Other Funds (includes social security and other benefi ts for overseas employees) 754.72 671.51
Employees’ Welfare Expenses 505.19 520.44
TOTAL 16,175.73 10,861.79
SCHEDULE ‘P’: MANUFACTURING & OPERATING EXPENSES:
Erection & Sub-contracting Exp. 73,279.71 36,650.66
Job charges 1,108.28 1,048.46
Power & Fuel 612.80 650.56
Repairs & Maintenance:
Plant & Machinery 199.83 211.78
Building 136.84 83.52
Other 38.70 28.48
Freight & Forwarding Expenses 2,958.82 2,359.52
Stores, Spares and Tools Consumed 1,027.96 833.62
Vehicle/ Equipment Running & Hire Charges 267.07 237.32
Testing Expenses 47.12 131.00
Pollution Control Expense 61.38 46.57
TOTAL 79,738.51 42,281.49
SCHEDULES TO AND FORMING PART OF ACCOUNTS

49
31/03/2010Rs. in Lacs
31/03/2009Rs. in Lacs
SCHEDULE ‘Q’: ADMINISTRATIVE, SELLING & OTHER EXPENSES:
Insurance Charges 1,196.15 999.68
Rent 1,571.24 910.78
Rates & Taxes 124.03 26.31
Stationery, Printing & Drawing Expenses 319.75 161.79
Telecommunication Expenses 357.46 262.43
Travelling Expenses 1,453.14 918.82
Legal & Professional Expenses 588.58 396.06
Service Charges 1,688.91 391.72
Audit Fees 38.00 30.00
General Expenses 409.18 379.05
Miscellaneous Expenses 1,120.34 764.26
Taxes & Duties 1,789.42 1,266.70
Loss on sale of assets 3.29 7.74
Bad Debts Written Off 8.86 11.98
Balances Written Off 21.94 -
Performance Warranties Expenses 3,698.74 1,856.15
Loss by Th eft/Damage/Fire 244.33 66.94
Service Tax 918.63 1,491.86
(Gain)/Loss on Exchange Rate Variation (735.77) 775.90
Sitting fees & Commission to Non-executive Directors 31.15 8.40
Carbon Credit Expenses 50.73 5.89
Provision for Diminution in value of Investments - 1.30
TOTAL 14,898.10 10,733.76
SCHEDULE ‘R’: FINANCIAL EXPENSES:
Interest
On fi xed period loans 1,872.06 796.99
Others 7,088.80 6,047.10
Bank Commission & Charges 2,571.87 1,502.36
Other Financial Expenses 354.70 187.02
11,887.43 8,533.47
Add / (Less) : Exchange rate variation (1,735.73) 2,025.34
TOTAL 10,151.70 10,558.81
SCHEDULES TO AND FORMING PART OF ACCOUNTS

50
SCHEDULE ‘S’ SIGNIFICANT ACCOUNTING POLICIES AND NOTES FORMING PART OF ACCOUNTS
Signifi cant Accounting Policies1. :Basis of Accounting:A.
Th e fi nancial statements have been prepared in accordance with relevant accounting standards under the historical cost (i) convention, except as stated in note 1 B.Th e accounts have been prepared on accrual basis of accountancy in accordance with the accounting principles generally (ii) accepted in India.
Fixed Assets:B. Fixed assets are stated at cost of acquisition/construction/revalued amount less accumulated depreciation.
Depreciation:C. Depreciation is provided on the basis of straight-line method on all depreciable fi xed assets at the rates prescribed in Schedule
–XIV of the Companies Act, 1956, on prorata basis except:Depreciation pertaining to assets of Research and Development Centre and of the Export Oriented Unit is provided on a) the basis of written down value method.Depreciation on plant and machinery of bio-mass energy plants is provided at a higher rate at 7.5% instead of the prescribed b) rate for continuous process plant considering the useful life of plant supported by technical evaluation and report.In case of revalued assets, the diff erence between the depreciation based on revalued cost and the depreciation charged on c) historical cost is recouped out of revaluation reserve.Depreciation on assets of overseas projects is provided at the rates as per the requirement of laws of respective foreign d) countries. Such rates of depreciation in each overseas project are higher than the depreciation at prescribed rates under Schedule-XIV of the Companies Act, 1956. Depreciation on all the vehicles in the Company is provided at a higher rate at 15% instead of the prescribed rate, considering e) the useful life of vehicles based on technical evaluation of the management.Intangible assets are amortized over a period of fi ve years from the day they are acquired on prorata basis.f )
Revenue Recognition:D. Transmission & Distribution Division:(i)
Sales are recognized on delivery of materials. Sales includes excise duty and export benefi ts being Duty Entitlement Pass book credits but excludes Sales Tax.
Erection and works contract revenue for work completed is recognized on percentage of completion method based on completion of physical proportion of the contract work. When it is probable that total contract cost will exceed the total contract revenue, the expected loss is recognized immediately. Infrastructure Division: (ii)
Revenue is recognized by adding the aggregate cost and proportionate margin using the percentage completion method. Percentage of completion is determined as a proportion of cost incurred to date to the total estimated contract cost. When it is probable that total contract cost will exceed the total contract revenue, the expected loss is recognized immediately.Bio-mass Energy Division:(iii)
Revenue is recognized on supply of electricity generated to the customer.Real Estate Division:(iv)
Revenue is recognized at the time of transfer of signifi cant risks and rewards of ownership to the buyer on executing agreement for sale. Estimated cost of completion against sales recognized, wherever applicable, is provided for in profi t and loss account. Advances received against booking of units are appearing as current liabilities. Others:(v)
Dividends are recorded when the right to receive payment is established. Interest income is recognized on time proportion basis.
Inventories:E. Transmission & Distribution Division:(i)
Raw materials, semi-fi nished goods, fi nished goods, scraps and construction work-in-progress and other stores-spares and tools and trading goods are stated at lower of cost and net realizable value. Th e cost of inventories is computed on weighted average basis.
Infrastructure Division:(ii) Construction material and stores, spares and tools are valued at lower of cost or net realizable value. Th e cost is computed
on weighted average basis.Biomass Energy Division:(iii)
Fuel and stores, spares and tools are stated at lower of cost and net realizable value. Th e cost of fuel, stores, spares and tools are computed on weighted average basis.
Real Estate Division:(iv) Finished and semi-fi nished inventory are stated at lower of cost and net realizable value. Cost is computed on average cost
basis which includes payments made against agreement to purchase land, development cost direct and attributable towards the specifi c real estate project and cost of borrowings as stated in note 1 J.

51
Investments:F. Long term investments are stated at cost after deducting the provision for diminution in value, if any, other than of a
temporary nature. Current investments are stated at lower of cost or fair value.Retirement Benefi ts:G. (i) Gratuity liability is provided under a defi ned benefi t plan, under Group Gratuity Cash Accumulation Scheme of the Life
Insurance Corporation of India under an irrevocable trust. Th e Company’s liability towards gratuity is determined on the basis of actuarial valuation done by an independent actuary.
(ii) Contribution to Provident Fund, a defi ned contribution plan is charged to the Profi t and Loss Account.(iii) Provision for leave encashment liability is made on actuarial valuation as at the Balance Sheet date.(iv) All other short-term employee benefi ts are recognized as an expense at the undiscounted amount in the profi t and loss
account of the year in which the related service is rendered.Excise/Custom Duty:H.
Th e liability for excise and custom duty in respect of materials lying in factory/bonded premises is accounted for as and when they are cleared / debonded.Foreign Currency Transactions:I.
Transactions in foreign currency are accounted for at the exchange rate prevailing on the date of transactions. Assets and liabilities, remaining unsettled at the end of the year are translated at the exchange rate prevailing at the end of the year and diff erence is adjusted to respective accounts in profi t & loss account. Th e exchange gain or loss between forward exchange contract rate and exchange rate at the date of transaction are recognized in profi t and loss account over the life of the contract.
Translation of overseas jobs / projects of non-integral foreign operations: -Assets and liabilities at rates prevailing at the end of the year,a) Income and expenses at the average rate for the year, and b) Resulting exchange diff erences are accumulated in foreign currency translation reserve account.c)
In respect of foreign currency option contracts which are entered into hedge, the cost of these contracts, if any, is expensed over the period of the contract. Any profi t or loss arising on settlement or cancellation of currency options is recognized as income or expenses for the period in which settlement or cancellation takes place. Borrowing Costs:J.
Borrowing costs that are directly attributable to the acquisition, construction or production of qualifying assets are capitalized as part of the cost of such assets. All other borrowing costs are recognized as expense in the period in which they are incurred.
Impairment of assets:K.
Th e carrying amount of assets, is reviewed at each balance sheet date to determine whether there is any indication of impairment. If any such indication exist, the recoverable amount of the assets is estimated. An impairment loss is recognized whenever the carrying amount of an asset or its cash generating units exceeds its recoverable amount. An impairment loss is reversed if there has been a change in the estimates used to determine the recoverable amount and recognized in compliance with AS-28.
Taxes on Income:L. Tax on income for the current period is determined on the basis of estimated taxable income and tax credit computed in a) accordance with the provisions of the Income Tax Act, 1961.Deferred tax is recognized on timing diff erence between the accounting income and the estimated taxable income for the b) period and quantifi ed using the tax rates and laws enacted or substantively enacted as on the balance sheet date.Deferred tax assets which arise mainly on account of unabsorbed losses or unabsorbed depreciation are recognized and c) carried forward only to the extent that there is virtual certainty supported by convincing evidence that suffi cient future taxable income will be available against which such deferred tax assets can be realized.
Use of Estimates:M. Th e presentation of fi nancial statements requires certain estimates and assumptions. Th ese estimates and assumptions aff ect
the reported amounts of assets and liabilities on the date of the fi nancial statements and the reported amounts of revenues and expenses during the reporting period. Diff erences between the actual results and estimates are recognized in the period in which the results are known / materialized.
N. Deferred Revenue Expenses: Preliminary expenses incurred are charged to revenue.O. Provisions, Contingent Liabilities and Contingent Assets:
Provisions involving substantial degree of estimation in measurement are recognized when there is a present obligation as i) a result of past events and that probably requires an outfl ow of resources.A disclosure for a contingent liability is made when there is a possible obligation or a present obligation that may, but ii) probably will not, require an outfl ow of resources. Where there is a possible obligation or a present obligation in respect of which the likelihood of outfl ow of resources is remote, no disclosure is made.

52
2009-2010 2008-2009
(Rs.in lacs) (Rs.in lacs)
2. Contingent liabilities in respect of:
i) Bank guarantees 1,054.35 587.75
ii) Claims against Company not acknowledged as debt 1,622.02 1,649.28
iii) Bonds/Undertaking given by the Company for concessional duty/exemption to customs
2,594.40 2,225.63
iv) Show Cause Notice issued by the Service tax/Entry Tax/ Stamps authority, disputed by the company
50.60 19.63
v) Benefi t of countervailing duty under Custom Law disputed by the department. - 57.11
vi) Penalty for delayed payment of Service tax disputed before Appellate authority already stayed unconditionally
120.29 120.29
vii) Guarantees & Letter of Comfort on behalf of a Subsidiary Company. 2,155.28 1,110.00
viii) Corporate Guarantee for Equipment Hiring 1,047.25 1,936.10
ix) Service-tax /VAT/WCT disputed in Appeals 122.55 -
3. Th e estimated amount of contracts remaining to be executed on capital account not provided for
140.03 5,874.79
4. Payment to Auditors:
Audit fee 38.93 33.26
Company Law matters 0.55 0.51
Taxation matters 13.13 6.63
Other services & reports 5.24 4.59
Reimbursement of expenses 0.45 0.11
TOTAL 58.30 45.12
5. Payment to Directors’
i) Managerial Remuneration
Salary 234.12 274.55
Company’s Contribution to Provident Fund & Benefi ts 27.93 27.11
Commission 180.42 473.24
442.47 774.90
ii) Commission to Non-Executive Directors 23.50 -
TOTAL (i) + (ii) 465.97 774.90
6. Managerial Remuneration:
Computation of Net Profi t in accordance with Section 198(1) and 349 of the Companies Act, 1956.
Profi t Before Tax as per profi t & Loss Account 22,759.62 12,058.48
Add: Managerial Remuneration 465.97 774.90
Loss on Sale of Fixed assets 3.29 5.09
Depreciation 3,823.77 2,731.81
Provision for diminution in value of Investment (1.34) 1.30
Profi t on Sale of investment (94.95) -
26,956.36 15,571.58
Less: Depreciation as per Section 350 of the Companies Act, 1956 3,823.77 2,731.81
Less: Managerial Remuneration 442.47 774.90
Less: Commission to Non-Executive Directors 23.50 -
Profi t u/s 198Remuneration to Directors (including Managerial Personnel) restricted to 11% i.e. Rs.2493.33 lacs
22,666.62 12,064.87
Commission to Managerial Personnel 180.42 473.24
Commission to Non-Executive Directors 23.50 -

53
2009-2010 2008-2009
Unit Qty. (Rs.in lacs) Qty. (Rs.in lacs)
7. Quantitative Particulars :
(a) Capacities:
Licenced capacity
No Licence is required.
Installed capacity (As certifi ed by the Management)
i) Transmission line towers and Steel structures MT 108,000 - 108,000 -
(b) Actual production:
Transmission line towers and steel Structures MT *121,483 - 93,484 -
(c) Generation of Electricity MU 108.07 - 106.34 -
(Net of Captive Consumption)
8. Particulars of:
(a) Finished Goods :
i) Transmission Line Towers & Steel
Structures
Opening Stock MT 10,332 5,531.90 6,325 2,810.53
Closing Stock MT 11,055 5,913.37 10,332 5,531.90
Turnover MT 120,760*** 222,293.07** 89,477*** 169,218.05**
ii) Real Estate (Flats)
Opening Stock Nos. 1 66.68 1 66.68
Closing Stock Nos. 1 66.68 1 66.68
iii) Bio-mass Energy
Sales of Electricity MU 108.07 5,082.94 106.34 4,763.27
(b) Raw materials & Components etc consumed:
i) Transmission & Distribution Division :
Steel MT 124,253 45,207.40 95,383 43,697.70
Zinc MT 6,379 6,151.41 4,797 4,254.46
Components & Accessories etc. ** - 60,326.05 - 57,093.58
ii) Bio-mass Energy Division MT 167,172 2,795.93 164,969 2,284.95
Agricultural residues
Notes : * Th e quantity includes production, on job work basis 86 M.T. (106 M.T. in previous year) material of others and 19756 M.T. (13193
M.T. in previous year) purchased from/got processed from third parties. ** Th e value of turnover includes value of components, accessories, equipments and miscellaneous items connected with installation
of transmission lines and sub-stations and those for rural electrifi cation work and items purchased with the object of resale against specifi c projects/orders in transmission and distribution and amount of erection and works contracts receipts, tower testing and other services, scrap and duty entitlement passbook credits in transmission and distribution division.
*** Th e quantities pertaining to components, accessories, equipments, and miscellaneous items are not included/or provided, as such items being dissimilar in nature and being in diff erent unit of measurement like Nos., MT, KM, Pieces etc. and hence is not practicable to provide the same.

54
2009-2010(Rs.in Lacs)
2008-2009(Rs.in Lacs)
9. C.I.F. value of Imports:
Raw Material 12,140.43 6,472.82
Stores, Spares & Tools 514.42 71.60
Capital Goods 3,805.54 2,762.94
10. Composition of raw materials & components consumed
Indigenous 74,921.83 93,452.59
65.44% 87.07%
Imported 39,558.96 13,878.10
34.56% 12.93%
114,480.79 107,330.69
100% 100%
11. Expenditure in foreign currency on account of:
Legal, Professional & Consultancy Fees 129.17 83.11
Dividend 4.50 4.50
Travelling Expenses 655.92 268.94
Service Charges 1,302.15 258.96
Interest 703.78 646.32
Third country purchases 36,833.18 2,894.89
Others 8,020.31 3,319.64
12. Earnings in Foreign Exchange :
Export of goods on FOB basis 89,576.65 33,839.40
Services 2,024.95 1,684.74
Overseas Projects Earnings 104.73 3,478.98
Certified Emission Reduction (CER’s) 528.69 578.28
13. Th e disclosure in respect of the amounts payable to enterprises which have provided goods and services to the Company and which qualify under the defi nition of micro and small enterprises, as defi ned under Micro, Small and Medium Enterprises Development Act, 2006 as at March 31, 2010 has been made in the fi nancials statements based on information received and available with the Company. On the basis of such information credit balance of such enterprise as on 31.03.2010 is Rs.1358.29 lacs and there are no overdues of such enterprises. Auditors have relied upon the same.
14. Secured non-convertible redeemable debentures :
Sr.No.
Face Value Per Debentures (Rs.)
Date of Allotment AmountRs. Lacs
Interest Redeemable at face value
1 100,000 December 26, 2008 8000 12.50% p.a.payable annually
At the end of 5th 6th & 7th year equally from date of allotment
2 1,000,000 July 15, 2009 7000 9.55% p.a.payable semi annually
25% each at the end of 3rd and 4th year and 50% at the end of 5th year from the date of allotment
Security : Secured by fi rst pari passu charge with consortium bankers and other debentures holders on fi xed assets of Transmission and Distribution Division and Infrastructure Division (including land and building) exclusive of assets charged to Financial Institutions and Banks, for which NOC is given. Security against debentures issued of Rs. 7000 lacs is yet to be created.
15. Overdraft and bill discounting facilities are availed from banks outside India against assignment of project specifi c receivables proceeds.
16. Advance taxes paid, including tax deducted at sources are shown as assets net of provision of tax including foreign tax which is made after considering depreciation, deductions and allowances allowable under income tax regulations.
17. In the opinion of the management the balances shown under sundry debtors, accrued value of work done and loans and advances have approximately the same realizable value as shown in the accounts. However, these balances are subject to confi rmations.

55
18. Th e disclosure as to provision for performance warranties in schedule “K” is :-
As at March 31, 2010
(Rs.in Lacs)
As at March 31, 2009
(Rs.in Lacs)
Carrying amount at the beginning 6,639.50 5,457.40
Add : Provision/Expenses during the Year 3,767.07
Less : Reversal of Provision on finality of Warrantee & Guarantee (68.32) 3,698.74 1,856.15
Less : Utilisation during the year (648.62) (589.02)
Less: Excess expenses during the year - (85.03)
Carrying amount at the close 9,689.62 6,639.50
19. In accordance with the AS-22, ‘Accounting for Taxes on Income’, issued by the Institute of Chartered Accountants of India, net deferred tax liability from timing diff erences amounting to Rs. 1407.84 lacs (Previous Year Rs. 1279.84 lacs) is accounted for using applicable current rate of tax.
As at March 31, 2010
(Rs.in Lacs)
As at March 31, 2009
(Rs.in Lacs)
Depreciation 1,599.92 1,446.09
Less: Deferred tax assets (192.08) (166.25)
Net deferred tax liability 1,407.84 1,279.84
20. Balances with non scheduled Banks on current accounts are:
Name of Bank
Maximum Balance(Rs.in lacs)
Balance as at(Rs.in lacs)
2009-10 2008-09 31.03.2010 31.03.2009
1. Rizzal Commercial Bank US$ A/c 16.73 744.99 5.93 16.73
2. Rizzal Commercial Bank Peso A/c 423.82 433.35 136.34 102.77
3. Everst Bank Ltd., Nepal 61.08 30.23 10.36 3.31
4. Indo-Zambia Bank, Chingola 7.29 12.22 7.29 7.29
5. Indo-Zambia Bank, Lusaka 131.71 131.71 25.38 131.71
6. Stanbic, Solwezi Bank Kwc A/c - 1.13 - -
7. HSBC – Qatar (QR) 0.55 301.50 0.49 0.55
8. HSBC – Qatar ($) - 1.39 - -
9. Alwar Bharatpur Anchalik Gramin Bank-Bharatpur 0.17 0.17 0.17 0.17
10. BNP Paribas, Algeria ($) 4.16 207.38 1.29 4.08
11. BNP Paribas,Algeria (CEDAC) 13.17 354.53 10.15 13.17
12. BNP Paribas, Algeria (INR) 404.76 939.36 344.37 404.75
13. BNA (ALG. Dnr. Account) 4,754.51 2,776.88 1,409.65 2,714.37
14. Commercial Bank of Ethiopia Birr A/c 264.07 355.11 1.31 47.88
15. BCIMR – DJF (Djibouti Frank) 370.70 204.52 18.53 43.94
16. BCIMR – US$ (Djibouti US$) 218.00 281.45 79.03 15.18
17. Giro Commercial Bank Ltd. US$ A/c 41.15 42.62 1.11 41.10
18. Giro Commercial Bank Ltd. Shilling A/c 48.59 230.31 3.27 30.50
19. BNP Paribas , Abudhabi 661.43 573.25 136.15 225.02
20. Commercial Bank of Kuwait KWD 11,423.59 51.21 33.70 14.41
21. Commercial Bank of Kuwait US $ A/c 11.45 - 6.30 -
22. British Arab Commercial Bank US$ A/c 5.00 5.00 4.47 5.00
23. Baroda Rajasthan Gramin Bank 26.16 35.20 4.14 20.20
24. First National Bank, South Africa 378.25 - 88.96 -
25. KOC Bank A.S. (Turkey) 0.01 - 0.01 -
Total 19,266.35 7,713.51 2,328.41 3,842.13

56
21. Information in accordance with the requirement of the AS-7 issued by the Institute of Chartered Accountants of India as follows:-
March 31, 2010(Rs.in lacs)
March 31, 2009(Rs.in lacs)
1. Amount of Contract Revenue Recognized as Revenue in the period
91,556.07 64,671.60
2. Disclosure in respect of contracts in progressat the Reporting Date - -
(i) Contract cost incurred & Recognized Profi ts less recognized losses upto the reporting date
153,772.75 80,830.20
(ii) Advances Received 10,274.37 10,703.40
(iii) Retentions 11,201.70 8,864.30
3. Due from Customers 23,764.87 30,734.70
22. Th e Management is of the opinion that as on the Balance Sheet date, there are no indications of a material impairment in the value of fi xed assets. Hence, the need to provide for an impairment loss does not arise.
23. Zinc and aluminum are internationally traded commodities and prices refer from the quotations on the London Metal Exchange / London Metal Bullion Association. Th e Company faces commodities price risks arising from the time leg and quantity diff erence between the purchases of zinc and aluminum and sale of product. In order to hedge its exposure to commodity price risk, the Company enters into forward contracts in future market. Th e Company does not enter into such hedging contracts or transactions for speculative purposes. Th e hedging transactions are used only for the purposes to manage exposure to commodity price risks. Th e income and gain/loss arising on this account are recorded at the time of settlement whether during this year or succeeding year and are adjusted as part of cost of the respective material.
24. On May 6, 2010, the Company has allotted 4,192,114 equity shares of Rs. 10 each at a price of Rs. 1,074.20 per equity share aggregating to Rs. 45,031.69 lacs through Qualifi ed Institutional Placement. Th ese shares are, in all respects, in pari passu with existing issued shares and are eligible or dividend for the year and therefore due provision thereof has been made in the fi nancial statement as part of proposed dividend.
25. Retirement benefi t plans
a) Defi ned contribution Plans
Th e Company made contribution towards provident fund, a defi ned contribution retirement benefi t plan for qualifying employees. Th e provident fund plan is operated by the Regional Provident Fund Commissioner. Th e Company recognized Rs. 530.37 lacs (Previous Year Rs. 456.40 lacs) for provident fund contributions in the profi t & loss account. Th e contributions payable to these plans by the company are at rates specifi ed in the rules of the scheme.
b) Defi ned benefi t plans
Th e Company made annual contributions to the Employee’s Group Gratuity cash accumulation scheme of the Life Insurance Corporation of India, a funded defi ned benefi t plan for qualifying employees. Th e scheme provides for payment to vested employees at retirement, death while in employment or on termination of employment of an amount equivalent to 15 days salary payable for each completed year of service or part thereof in excess of six months. Vesting occurs upon completion of fi ve years of service.
Th e present value of the defi ned benefi t obligation and the related current service cost were measured using the Projected Unit Credit method as per actuarial valuation carried out at the balance sheet date.
Th e following tables sets out the status of the gratuity plan as required under AS-15 and the amounts recognized in the Company’s fi nancial statements as at March 31, 2010.
(Rs. in lacs) (Rs.in lacs)
2009-10 2008-09
Change in present value of obligations :
Obligations at beginning of the year 574.40 411.34
Service cost 106.15 117.29
Interest cost 47.39 32.70
Actuarial (gain) / loss 7.39 28.72
Benefi ts paid (23.58) (15.65)
Obligations at the end of the year 711.75 574.40
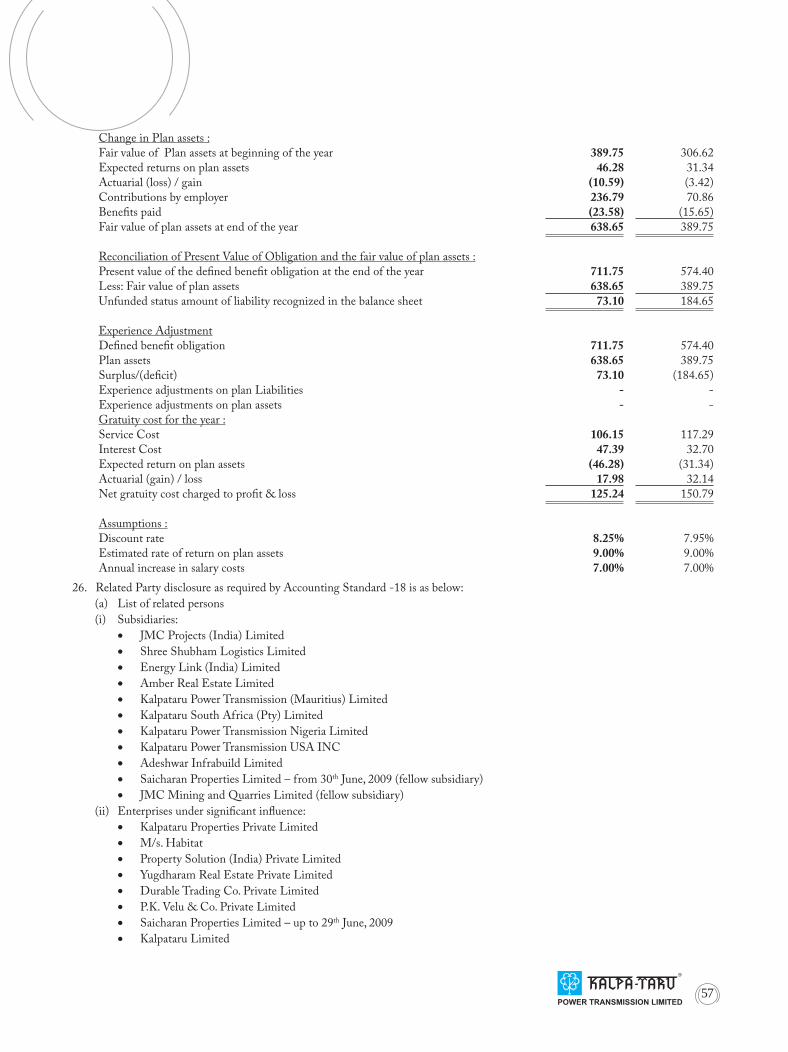
57
Change in Plan assets :
Fair value of Plan assets at beginning of the year 389.75 306.62
Expected returns on plan assets 46.28 31.34
Actuarial (loss) / gain (10.59) (3.42)
Contributions by employer 236.79 70.86
Benefi ts paid (23.58) (15.65)
Fair value of plan assets at end of the year 638.65 389.75
Reconciliation of Present Value of Obligation and the fair value of plan assets :
Present value of the defi ned benefi t obligation at the end of the year 711.75 574.40
Less: Fair value of plan assets 638.65 389.75
Unfunded status amount of liability recognized in the balance sheet 73.10 184.65
Experience Adjustment
Defi ned benefi t obligation 711.75 574.40
Plan assets 638.65 389.75
Surplus/(defi cit) 73.10 (184.65)
Experience adjustments on plan Liabilities - -
Experience adjustments on plan assets - -
Gratuity cost for the year :
Service Cost 106.15 117.29
Interest Cost 47.39 32.70
Expected return on plan assets (46.28) (31.34)
Actuarial (gain) / loss 17.98 32.14
Net gratuity cost charged to profi t & loss 125.24 150.79
Assumptions :
Discount rate 8.25% 7.95%
Estimated rate of return on plan assets 9.00% 9.00%
Annual increase in salary costs 7.00% 7.00%
26. Related Party disclosure as required by Accounting Standard -18 is as below:
List of related persons(a)
Subsidiaries: (i)
JMC Projects (India) Limited• Shree Shubham Logistics Limited • Energy Link (India) Limited• Amber Real Estate Limited • Kalpataru Power Transmission (Mauritius) Limited • Kalpataru South Africa (Pty) Limited • Kalpataru Power Transmission Nigeria Limited • Kalpataru Power Transmission USA INC• Adeshwar Infrabuild Limited• Saicharan Properties Limited – from 30• th June, 2009 (fellow subsidiary)
JMC Mining and Quarries Limited (fellow subsidiary)• Enterprises under signifi cant infl uence: (ii)
Kalpataru Properties Private Limited • M/s. Habitat • Property Solution (India) Private Limited • Yugdharam Real Estate Private Limited • Durable Trading Co. Private Limited • P.K. Velu & Co. Private Limited • Saicharan Properties Limited – up to 29• th June, 2009
Kalpataru Limited•

58
Key Management Personnel:(iii)
K.V. Mani - Managing Director (Upto 31.05.2009)• Pankaj Sachdeva - Managing Director • Manish Mohnot - Executive Director•
Th e following transactions were carried out with related parties in the ordinary course of business: (Rs.in lacs)(b)
Sr.No.
Particulars SubsidiaryCompanies
Entities under signifi cant infl uence
Key ManagerialPersonnel
1 Reimbursement of expenses - 20.93 -(-) (35.52) (-)
2 Space usage charges received - - -(-) (1.05) (-)
3 Rent Paid - 269.69 -(-) (272.16) (-)
4 Investment in Equity Shares 2,212.62 - -(1,438.98) (-) (-)
5 Interest received 1,969.87 - -(840.45) (-) (-)
6 Loan given 18,989.22 - -(15,688.52) (-) (-)
7 Loan repaid back 9,063.84 - -(12,471.56) (-) (-)
8 Security Deposit given against Rental Property - - -(-) (3216.44 ) (-)
9 Reimbursement of Exp. Received 0.41 - -(17.06) (-) (-)
10 Rent Received 79.62 - -(73.93) (-) (-)
11 Sale of Goods - - -(60.43) (-) (-)
12 Hire Charges Paid 27.67 - -(42.92) (-) (-)
13 Dividend Received 326.41 - -(329.15) (-) (-)
14 Salary & Commission - - 442.47(-) (-) (774.90)
15 Advance against property given - - -(-) ( 4,000.00) (-)
16 Job Charges paid 133.75 - -(-) (-) (-)
17 Security Deposit at the year end - 3,326.07 -(-) (3,326.07) (-)
18 Loan to Subsidiary Companies at the year end 19,430.87 - -(7,728.60) (-) (-)
19 Liabilities at the year end 146.68 2.46 147.75(-) (2.33) (277.71)
20 Redemption of Preference Shares 2,222.00 - -(-) (-) (-)
21 Advance against property received back 4,000.00 - -(-) (-) (-)
* Figures in bracket represent previous year numbers. 27. Information as required under Clause 32 of Listing Agreement with Stock Exchanges with regard to loans to subsidiaries having no
repayment schedule
Name of the SubsidiariesBalance as on
March 31, 2010 (Rs. In lacs)
Maximum Balance during the year
(Rs. In lacs)
Shree Shubham Logistics Limited 4,909.47 Dr. 5,502.71 Dr.
Energy Link (India) Limited 12,690.72 Dr. 12,690.72 Dr.
Amber Real Estate Limited 1,824.98 Dr. 4,759.47 Dr.
Kalpataru Power Transmission USA Inc 0.23 Dr. 0.23 Dr.
Kalpataru Power Transmission (Mauritius) Limited 5.46 Dr. 5.46 Dr.

59
28. Segmental Reporting:
(Rs. in lacs)S.N. Particulars Segment
T&D RED BM INFRA Unallocable Consolidated(I) Business Segment 1 Revenue : Sales & Services 217,607.46 37.60 5,082.94 36,068.86 - 258,796.86
(166,098.08) (6.00) (4,763.27) (17,194.89) (-) (188,062.24) Other Operating Income 917.02 18.44 4.48 - - 939.94
(309.77) (-) (66.70) (42.72) (-) (419.19)
Net Sales/Income from Operation
218,524.48 56.04 5,087.42 36.068.86 - 259,736.80
(166,407.85) (6.00) (4,829.97) (17,237.61) (-) (188,481.43) Add : Other Income 7.31 - 528.76 67.50 2,728.11 3,331.68
(85.72) (4.33) (578.28) (-) (2,229.30) (2,897.63) Total 218,531.77 56.04 5,616.18 36,136.36 2,728.11 263,068.46
(166,493.57) (10.33) (5,408.25) (17,237.61) (2,229.30) (191,379.06)
2Segment Result Before Interest
23,531.49 47.85 1,227.40 2,520.72 2,657.29 29,984.75
(net off un-allocable expenditure)
(15,580.53) (4.44) (1,571.90) (1,541.73) (2,229.30) (20,927.90)
Interest 7,225.13(8,869.43)
Profi t after Interest 22,759.62(12,058.47)
Extra Ordinary Item -(-)
3 Current Tax 5,586.00(2,309.17)
4 Deferred Tax 128.00
(308.21)
5 Net Profi t after Tax 17,045.62
(9,441.09)
6 Segment Asset 213,725.99 70.98 7,258.61 29,264.06 34,674.34 284,993.98
(172,194.79) (81.50) (7,306.59) (23,337.57) (29,172.38) (232,092.83)
7 Segment Liability 110,617.39 24.93 112.37 10,964.46 4,036.59 125,755.74
(66,454.56) (36.00) (146.13) (10,547.90) (5,799.21) (82,983.80)
Capital Employed 103,108.60 46.05 7,146.24 18,299.60 30,637.75 159,238.24
(105,740.23) (45.50) (7,160.46) (12,789.67) (23,373.17) (149,109.03)
8 Capital Expenditure 8,476.43 - 115.90 1,979.53 - 1,0571.86
(Including CWIP) (4,410.62) (-) (94.92) (2,612.54) (-) (7,117.98)
9 Depreciation 2,081.28 1.20 468.89 1,272.40 - 3,823.77
(1,355.85) (1.30) (460.13) (914.53) (-) (2,731.81)
(II) Geographical Segment
Revenue
India 102,746.86 56.04 5,087.42 36,068.86 - 143,959.18
(114,511.81) (6.00) (4,829.97) (17,237.61) (-) (136,585.39)
Outside India 115,777.62 - - - - 115,777.62
(51,896.04) (-) (-) (-) (-) (51,896.04)
Total 218,524.48 56.04 5,087.42 36,068.86 - 259,736.80
(166,407.85) (6.00) (4,829.97) (17,237.61) (-) (188,481.43)
# T & D – Transmission and Distribution; RED - Real Estate; BM – Bio-mass Energy; INFRA – Infrastructure
* Figures in bracket represent previous year numbers.
NotesGeographical segment considered for disclosure are as follows:Revenue within India includes sales and services to customers located within India.Revenue outside India includes sales and services to customers located outside India.

60
29. Th e Company uses foreign currency forward contracts and options to hedge its risks associated with foreign currency fl uctuations. Company does not use forward contracts and options for speculative purposes.
Th e year end foreign currency exposures, which are not hedged, are as under: (In Lacs)
KWD QAR AED EURO USD GBP JPY
Receivables 156.47 39.71 267.67 - - - -
(-) (39.71) (175.41) (-) (-) (-) (-)
Payables (includes fi nancial Liabilities)
- - - 75.57 386.21 1.01 19,375.63
(-) (-) (-) (13.67) (170.65) (0.21) (-)
Figures in bracket represent previous year numbers.
30. Th e Company has entered into consortium with JSC Zangas, Russia separately for four gas pipeline projects (i) Vijaipur to Kota, (ii) Panvel to Dabhol (iii) Vijaipur to Dadari and (iv) Dadari-Panipat in Infrastructure Division, sharing contract receipts. Th e contract receipts, common expenses, assets and liabilities have accordingly been accounted for in these accounts as per terms of separate consortium agreement based on unaudited accounts of all the consortium.
31. Th e Company’s signifi cant leasing/ licensing arrangements are mainly in respect of residential / offi ce premises and equipments, which are operating leases. Th e aggregate lease rental payable on these leasing arrangements are charged as rent and equipment hire charges in these accounts amounting to Rs. 6,546.59 lacs (previous year Rs. 1,817.87 lacs).
Th ese leasing arrangements are for a period not exceeding 5 years and are in most cases renewable by mutual consent, on mutually agreeable terms. Future lease rental payable in respect of assets on lease for not later than 1 year is Rs. 896.15 lacs (previous year Rs. 502.45 lacs) and for later than 1 year but not later than 5 years is Rs. 677.89 lacs (previous year Rs. 858.58 lacs).
32. Interest income comprises of:
2009-10(Rs.in lacs)
2008-09(Rs.in lacs)
Fixed Deposits with banks 0.76 201.01
Inter-corporate deposits 109.90 767.01
Subsidiary Companies 1,969.87 840.45
Others 73.11 23.39
Total 2,153.64 1,831.86
33. Erection and subcontracting expenses comprises of:
2009-10(Rs.in lacs)
2008-09(Rs.in lacs)
Subcontracting expenses 39,071.87 19,771.09
Construction material and stores and spares consumed 15,707.72 10,253.37
Power and fuel 1,491.20 1,440.05
Freight and Forwarding ExpensesVehicle and Equipment Hire Charges
2,051.158,480.26
1,513.832,873.85
Custom Duty, Clearing & Handling Charges 3,453.24 48.71
Others 3,024.28 749.76
Total 73,279.71 36,650.66
34. Th e accounts of foreign operations in company’s overseas branches in Philippines, Algeria, Ethiopia, Kenya, Abu Dhabi, Kuwait and Djibouti have been incorporated on the basis of balance sheet and profi t and loss account audited locally at the respective branches. In respect of overseas branch in Nepal, South Africa, Qatar and Zambia accounts for the year have been prepared and audited in India.

61
35. Material Cost Comprises of:
2009-10(Rs.in lacs)
2008-09(Rs.in lacs)
Raw Materialsa)
Opening Stock 9,734.93 7,844.01
Add: Purchases 114,424.96 106,936..66
Less: Closing stock 12,475.03 9,734.93
Consumption 111,684.86 105,045.74
Agricultural Residuesb)
Opening Stock 818.78 410.81
Add: Purchases 2,849.65 2,692.92
Less: Closing stock 872.50 818.78
Consumption 2,795.93 2,284.95
Total 114,480.79 107,330.69
36. An estimated sum of Rs. 643 lacs which is receivable from eligible Gold Standard Carbon Credit for Carbon Emission Reduction because of generation of electricity from agricultural residues like mustard husk and cotton sticks at our Tonk Power Plant under the Clean Development Mechanism (CDM) of Kyoto Protocol for preventing environmental degradation has been accounted for at estimated price (for period from October 2008 to March 2010) as there is reasonable certainty about its ultimate realization. Th e same is subject to monitoring and verifi cation by an independent third party but there is a reasonable assurance that the Company complies with the conditions in relation thereto.
37. Previous year’s fi gures have been regrouped and/or rearranged wherever considered necessary.
Signatures to Schedules `A’ to `S’
In terms of our report attached For and on behalf of the Board
For Kishan M. Mehta & Co., For Deloitte Haskins & Sells, Pankaj Sachdeva Manish Mohnot
Chartered Accountants Chartered Accountants Managing Director Executive Director
(Kishan M. Mehta) (Gaurav J. Shah) Kamal Jain Bajrang Ramdharani
Partner Partner President & CFO Company Secretary
(M. No. 13707) (M. No. 35701)
AHMEDABAD: May 29, 2010 MUMBAI: May 28, 2010
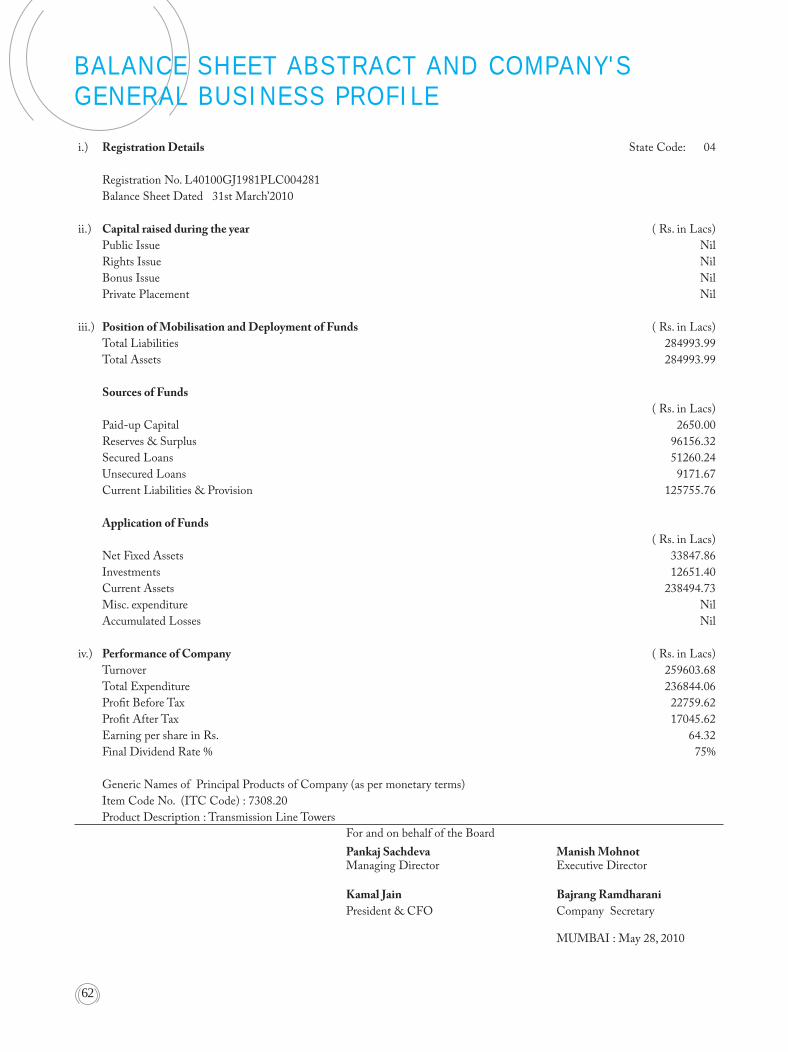
62
i.) Registration Details State Code: 04
Registration No. L40100GJ1981PLC004281
Balance Sheet Dated 31st March’2010
ii.) Capital raised during the year ( Rs. in Lacs)
Public Issue Nil
Rights Issue Nil
Bonus Issue Nil
Private Placement Nil
iii.) Position of Mobilisation and Deployment of Funds ( Rs. in Lacs)
Total Liabilities 284993.99
Total Assets 284993.99
Sources of Funds
( Rs. in Lacs)
Paid-up Capital 2650.00
Reserves & Surplus 96156.32
Secured Loans 51260.24
Unsecured Loans 9171.67
Current Liabilities & Provision 125755.76
Application of Funds
( Rs. in Lacs)
Net Fixed Assets 33847.86
Investments 12651.40
Current Assets 238494.73
Misc. expenditure Nil
Accumulated Losses Nil
iv.) Performance of Company ( Rs. in Lacs)
Turnover 259603.68
Total Expenditure 236844.06
Profi t Before Tax 22759.62
Profi t After Tax 17045.62
Earning per share in Rs. 64.32
Final Dividend Rate % 75%
Generic Names of Principal Products of Company (as per monetary terms)
Item Code No. (ITC Code) : 7308.20
Product Description : Transmission Line Towers
BALANCE SHEET ABSTRACT AND COMPANY'SGENERAL BUSINESS PROFILE
For and on behalf of the Board
Pankaj Sachdeva Manish MohnotManaging Director Executive Director
Kamal Jain Bajrang Ramdharani
President & CFO Company Secretary
MUMBAI : May 28, 2010

63
INFLOW/(OUTFLOW)
2009-2010
Rs. in Lacs
2008-2009A. CASH FLOW FROM OPERATING ACTIVITIES:
Net profi t before taxation, and extraordinary items 22,759.62 12,058.48 Adjustments for :
Depreciation 3,823.77 2,731.81 Interest Paid 8,960.86 6,844.09 Dividend Received (328.69) (405.28)Interest Received (2,153.64) (1,831.86)
Provision for Diminution in Investment (1.34) 1.30 (Profi t) / Loss on sale of assets (0.45) 5.09 Foreign Currency Translation Diff erence 619.23 (178.19)Profi t on Sale of Investments (96.29) -Unrealised Foreign Exchange (gain) / Loss (net) (601.49) 574.07
OPERATING PROFIT BEFORE WORKING CAPITAL CHANGES 32,981.58 19,799.51 Adjustments for:
Trade and other Receivables (33,479.77) (47,977.20)Inventories (3,203.53) (8,318.38)Margin Money with Banks 20.38 (20.38)Trade Payables 45,323.44 20,617.92
CASH GENERATED FROM/(USED IN) OPERATIONS 41,642.10 (15,898.53)Income Tax Paid (6,658.29) (3,722.30)Prior Year’s Adjustment 80.30 (14.97)CASH FLOW BEFORE EXTRAORDINARY ITEMS 35,064.11 (19,635.80)NET CASH FLOW FROM/ (USED IN ) OPERATING ACTIVITIES (A) 35,064.11 (19,635.80)
B. CASH FLOW FROM INVESTING ACTIVITIES:Purchase of fi xed assets 10,874.56 (7,223.53)Sale of fi xed assets 37.69 104.47 Sale/(Purchase) of Investments in Shares 119.36 -Investment in Mutual Funds - 3,506.65 Sale/(Purchase) of Investment in Subsidiaries 9.38 (1,438.98)Loans to Subsidiary and Others (9,731.62) (5,082.10)Interest Received on Loans 182.99 1,831.86 Dividend Received 328.69 405.28 Deposits with Banks 4.19 5,525.25 Lien with Banks 41.39 (389.26)CASH FROM / (USED IN) INVESTING ACTIVITIES (B) (19,882.49) (2,760.36)
C. CASH FLOW FROM FINANCING ACTIVITIES:Proceeds from Term Borrowings 94.13 Proceeds from Issuance of Non Convertible Debentures 7,000.00 8,000.00 Repayment of Term Loan (2,164.17) (2,109.88)Working Capital Finance & Unsecured Loans (9,719.70) 26,339.93 Interest Paid (8,765.38) (6,858.26)Dividend Paid (1,987.50) (1,987.50)Corporate Dividend Tax (337.78) (337.78)CASH FROM / (USED IN) FINANCING ACTIVITIES (C) (15,880.40) 23,046.51
D NET INCREASE IN CASH AND CASH EQUIVALENT (A) + (B) + (C) (698.78) 650.35 E. Opening Cash and Cash Equivalent 4,038.06 3,387.71 F. Closing Cash and Cash Equivalent 3,339.28 4,038.06
NOTE: AS AT AS AT31/03/2010 31/03/2009Rs. in Lacs Rs. in Lacs
Cash & Cash Equivalents Cash & Bank Balance (Schedule I) 3,687.15 4,451.89 (Includes margin money, deposit and lien) Margin Money with Banks - (20.38)Deposits with Banks - (4.19)Lien with Banks (347.87) (389.26)
Cash & Cash Equivalents As per Cash fl ow statement 3,339.28 4,038.06
CASH FLOW STATEMENT FOR THE YEAR ENDED MARCH 31, 2010
In terms of our report attached For and on behalf of the BoardFor Kishan M. Mehta & Co., For Deloitte Haskins & Sells, Pankaj Sachdeva Manish MohnotChartered Accountants Chartered Accountants Managing Director Executive Director
(Kishan M. Mehta) (Gaurav J. Shah) Kamal Jain Bajrang RamdharaniPartner Partner President & CFO Company Secretary(M. No. 13707) (M. No. 35701)
AHMEDABAD: May 29, 2010 MUMBAI: May 28, 2010

64
Nam
e of
the
Subs
idia
ry C
ompa
nyJM
C
Pro
ject
s(I
ndia
) Ltd
.
JMC
M
inin
g &
Q
uarr
ies L
td.
(sub
sidi
ary
of
JMC
Pro
ject
s (I
ndia
) Ltd
.)
Shre
e Sh
ubha
m
Log
isti
cs L
td.
Ene
rgyl
ink
(Ind
ia) L
td.
Am
ber R
eal
Est
ate
Ltd
.K
alpa
taru
Po
wer
T
rans
mis
ion
Nig
eria
Ltd
.
Kal
pata
ru S
A
(Pro
prie
tary
) L
td.
Kal
pata
ru
Pow
er
Tra
nsm
isio
n (M
auri
tius
) L
td.
Kal
pata
ru P
ower
T
rans
mis
ion
USA
., IN
C
Ade
shw
ar
Infr
abui
ld
Lim
ited
Saic
hara
n P
rope
rtie
s L
imit
ed
(Sub
sidi
ary
of E
nerg
ylin
k (I
ndia
) Pvt
. Ltd
.)F
inan
cial
yea
r of t
he su
bsid
iary
com
pany
end
ed o
n31
/03/
2010
31/0
3/20
1031
/03/
2010
31/0
3/20
1031
/03/
2010
31/0
3/20
1031
/03/
2010
31/0
3/20
1031
/03/
2010
31/0
3/20
1031
/03/
2010
Num
ber o
f Equ
ity S
hare
s in
the
subs
idia
ry c
ompa
ny h
eld
by K
alpa
taru
1
1,54
0,24
7 -
1
6,00
0,00
0 1
,000
,000
9
90,0
00
2,5
00,0
00*
374
,500
1
1,27
5 2
00,0
00
500
,000
-
Po
wer
Tra
nsm
issi
on L
td. a
t the
abo
ve d
ate
and
%:
53.0
1%53
.01%
80.0
0%10
0%10
0.00
%10
0.00
%74
.90%
100.
00%
100.
00%
100.
00%
100.
00%
Th e
net a
ggre
gate
pro
fi t le
ss lo
sses
of t
he su
bsid
iary
com
pany
so fa
r as i
t co
ncer
ns th
e m
embe
rs o
f Hol
ding
Com
pany
.(i)
Dea
lt w
ith o
r pro
vide
d fo
r in
the
acco
unts
of H
oldi
ng C
ompa
ny
amou
nted
to :
(a) f
or th
e su
bsid
iary
’s fi n
anci
al y
ear e
nded
Mar
ch 3
1, 2
009
Nil
Nil
Nil
Nil
Nil
Nil
Nil
Nil
Nil
Nil
Nil
(b) f
or p
revi
ous fi
nan
cial
yea
rs o
f the
subs
idia
ry si
nce
it b
ecam
e su
bsid
iary
:N
ilN
ilN
ilN
ilN
ilN
ilN
ilN
ilN
ot A
pplic
able
, Si
nce
it be
cam
e su
bsid
iary
dur
ing
the
year
Not
App
licab
le,
Sinc
e it
beca
me
subs
idia
ry d
urin
g th
e ye
ar
Not
App
licab
le,
Sinc
e it
beca
me
subs
idia
ry d
urin
g th
e ye
ar(ii
) Not
dea
lt or
pro
vide
d fo
r in
the
acco
unts
of H
oldi
ng C
ompa
ny
amou
nted
to :
(a) f
or th
e su
bsid
iary
’s fi n
anci
al y
ear e
nded
Mar
ch 3
1, 2
010
210,
086,
774
NIL
(2
9,23
1,35
2) 2
,958
,950
(2
25,3
55)
Nil
(1,7
60)
(1,1
71,0
22)
(714
,031
) (4
2,20
4) N
IL
(b) f
or p
revi
ous fi
nan
cial
yea
rs o
f the
subs
idia
ry si
nce
it be
cam
e
subs
idia
ry :
371,
955,
308
NIL
5,14
2,50
91,
854,
757
(213
,359
)N
ilN
ilN
ilN
ot A
pplic
able
, Si
nce
it be
cam
e su
bsid
iary
dur
ing
the
year
Not
App
licab
le,
Sinc
e it
beca
me
subs
idia
ry d
urin
g th
e ye
ar
Not
App
licab
le,
Sinc
e it
beca
me
subs
idia
ry d
urin
g th
e ye
ar
Sta
tem
ent
pu
rsu
ant
to S
ecti
on
21
2 o
f th
e C
om
pan
ies
Act
, 19
56
rel
atin
g t
o S
ub
sid
iary
Co
mp
anie
s:
Sr.
No.
Nam
e of
Sub
sidi
ary
Com
pani
esJM
C
Pro
ject
s (I
ndia
) L
td.
JMC
Min
ing
&
Qua
rrie
s L
td.
(sub
sidi
ary
of
JMC
Pro
ject
s (I
ndia
) Ltd
.)
Shr
ee
Shu
bham
L
ogis
tics
L
td.
Ene
rgyl
ink
(Ind
ia) L
td.
Am
ber R
eal
Est
ate
Ltd
.K
alpa
taru
P
ower
T
rans
mis
ion
Nig
eria
Ltd
.
Kal
pata
ru S
A
(Pro
prie
tary
) L
td.
Kal
pata
ru
Pow
er
Tra
nsm
isio
n (M
auri
tius
) L
td.
Kal
pata
ru
Pow
er
Tra
nsm
isio
n U
SA.,
INC
Ade
shw
ar
Infr
abui
ld
Lim
ited
Saic
hara
n P
rope
rtie
s L
imit
ed (S
ubsi
diar
y of
Ene
rgyl
ink
(Ind
ia)
Pvt
. Ltd
.)
Fin
anci
al y
ear o
f the
sub
sidi
ary
com
pani
es e
nded
on
31/0
3/20
1031
/03/
2010
31/0
3/20
1031
/03/
2010
31/0
3/20
1031
/03/
2010
31/0
3/20
1031
/03/
2010
31/0
3/20
1031
/03/
2010
31/0
3/20
10
1C
apit
al 2
,176
.83
50.
00
3,4
00.0
0 1
00.0
0 9
9.00
-
3
1.00
5
.09
90.
28
5.0
0 5
.00
2R
eser
ves
23,
405.
53
27.
58
(31
4.41
) 4
8.38
(
5.21
) -
3
0.99
(
11.7
1) (
7.14
) (
0.42
) (
2.21
)
3T
otal
Lia
bilti
ies
62,
847.
05
230
.52
15,
141.
97
12,
869.
28
5,0
12.1
3 -
-
7
.44
4.0
1 0
.06
12,
615.
57
4T
otal
Ass
ets
88,
429.
41
308
.10
18,
227.
56
13,
017.
66
5,1
05.9
2 -
6
1.99
0
.82
87.
15
4.6
3 1
2,61
8.36
5In
vest
men
ts (
Oth
er th
an in
sub
sidi
arie
s) 5
85.1
8 2
.47
-
-
-
-
-
-
-
-
-
6T
urno
ver
130
,149
.72
505
.97
8,8
43.4
7 2
4.00
-
-
-
-
-
-
-
7P
rofi t
bef
ore
taxa
tion
5,3
21.0
1 (
10.5
2) (
530.
64)
42.
78
(2.
25)
-
(0.
02)
(11
.71)
(7.
14)
(0.
42)
(0.
57)
8P
rovi
sion
for
taxa
tion
1,3
50.8
4 3
.21
165
.25
13.
00
-
-
-
-
-
-
9P
rofi t
aft
er ta
xati
on 3
,970
.17
(7.
31)
(36
5.39
) 2
9.78
(
2.25
) -
(
0.02
) (
11.7
1) (
7.14
) (
0.42
) (
0.57
)
10P
ropo
sed
divi
dend
(Pe
rcen
tage
)20
% -
-
-
-
-
-
-
-
-
Exe
mpt
ion
unde
r Sec
tion
212
(8) o
f the
Com
pani
es A
ct, 1
956
:
In v
iew
of
the
exem
ptio
n gr
ante
d un
der
sect
ion
212(
8) o
f th
e C
ompa
nies
Act
, 195
6 by
Min
istr
y of
Cor
pora
te A
ff ai
rs v
ide
lett
er N
o. 4
7/36
6/20
10-C
L-I
II d
ated
20/
05/2
010,
the
Aud
ited
Sta
tem
ent
of A
ccou
nts,
the
Rep
orts
of
the
Boa
rd o
f D
irec
tors
and
A
udit
ors
of th
e su
bsid
iary
com
pani
es a
re n
ot a
nnex
ed. S
hare
hold
ers
who
wis
h to
hav
e a
copy
of t
he A
nnua
l Acc
ount
and
the
rela
ted
deta
iled
info
rmat
ion
of th
e su
bsid
iari
es c
an w
rite
to th
e C
ompa
ny a
t its
Reg
iste
red
Offi
ce a
nd th
e sa
me
will
be
avai
labl
e fo
r in
spec
tion
by
any
shar
ehol
der
at th
e R
egis
tere
d O
ffi ce
of t
he C
ompa
ny a
nd th
at o
f the
Sub
sidi
ary
Com
pani
es c
once
rned
on
any
wor
king
day
dur
ing
busi
ness
hou
rs.
*Unp
aid
shar
es
Sta
tem
ent
pu
rsu
ant
to e
xem
pti
on
rec
eive
d u
nd
er S
ecti
on
21
2(8
) o
f th
e C
om
pan
ies
Act
, 19
56
rel
atin
g t
o S
ub
sid
iary
Co
mp
anie
s

65
ToTh e Board of Directors ofKalpataru Power Transmission Limited
We have audited the attached Consolidated Balance Sheet of 1. Kalpataru Power Transmission Limited (‘the Company’), and its subsidiaries (collectively referred to as ‘the Group’) as at March 31, 2010, the Consolidated Profi t and Loss account and the Consolidated Cash Flow statement of the Group for the year ended on that date both annexed thereto. Th ese fi nancial statements are the responsibility of the Company’s management and have been prepared by the management on the basis of separate fi nancial statements and other fi nancial information regarding components. Our responsibility is to express an opinion on these fi nancial statements based on our audit.
We conducted our audit in accordance with the auditing standards generally accepted in India. Th ose Standards require that we plan 2. and perform the audit to obtain reasonable assurance about whether the fi nancial statements are free of material misstatements. An audit includes examining, on a test basis, evidence supporting the amounts and disclosures in the fi nancial statements. An audit also includes assessing the accounting principles used and signifi cant estimates made by the management as well as evaluating the overall fi nancial statement presentation. We believe that our audit provides a reasonable basis for our opinion.
Financial statements / consolidated fi nancial statements of four subsidiaries, which refl ect total assets of Rs. 119,654.86 lacs as at 3. March 31, 2010, total revenues of Rs. 141,171.93 lacs and net cash infl ows amounting to Rs. 502.54 lacs for the year ended on that date have been audited by one or one of us with other.
We did not audit the fi nancial statements of four subsidiaries, whose fi nancial statements refl ect total assets of Rs. 5,401.86 lacs as at 4. March 31, 2010, total revenues of Rs. 508.20 lacs and net cash infl ows amounting to Rs. 12.09 lacs for the year ended on that date. Th ese fi nancial statements and other fi nancial information have been audited by other auditors whose reports have been furnished to us, and our opinion is based solely on the report of other auditors.
We have relied on the unaudited fi nancial statements of two subsidiaries whose fi nancial statements refl ect total assets of Rs. 149.13 5. lacs as at March 31, 2010, total revenues of Rs. 0.14 lacs and net cash infl ows amounting to Rs. 145.27 lacs for the year ended on that date. Th ese unaudited fi nancial statements have been furnished to us by management and our report in so far as it relates to the amounts included in respect of these subsidiaries, is based solely on such unaudited fi nancial statements.
We report that the Consolidated Financial Statements have been prepared by the Company in accordance with the requirements 6. of Accounting Standard 21 (Consolidated Financial Statements), as notifi ed under the Companies (Accounting Standards) Rules, 2006.
Based on our audit as aforesaid and on consideration of separate audit reports of other auditors on separate fi nancial statements and 7. on the other fi nancial information of the subsidiaries and accounts furnished by the management as explained in paragraph 5 above and to the best of our information and according to the explanations given to us, in our opinion the attached consolidated fi nancial statements give a true and fair view in conformity with the accounting principles generally accepted in India:
(i) in the case of the Consolidated Balance Sheet, of the state of aff airs of the Group as at March 31, 2010;
in the case of the Consolidated Profi t and Loss Account, of the profi t of the Group for the year ended on that date; and(ii)
in the case of the Consolidated Cash Flow Statement, of the cash fl ows of the Group for the year ended on that date.(iii)
AUDITORS’ REPORT ON CONSOLIDATED FINANCIAL STATEMENTS
For Kishan M. Mehta & Co., For Deloitte Haskins & Sells,
Chartered Accountants(Registration No.105229W)
Chartered Accountants(Registration No 117365W)
Kishan M. Mehta Gaurav J. Shah
Partner Partner
(Membership No. 13707) (Membership No. 35701)
Place: Ahmedabad Place: Ahmedabad
Date: May 29, 2010 Date: May 29, 2010

66
SCHEDULE AS AT AS AT
31/03/2010 31/03/2009
Rs. In Lacs Rs. In Lacs
SOURCES OF FUNDS :
Shareholder’s Funds:
Share Capital ‘A’ 2,650.00 2,650.00
Reserves & Surplus ‘B’ 100,057.44 84,330.21
102,707.44 86,980.21
Minority Interest 12,544.41 9,471.07
Loan Funds :
Secured Loans ‘C’ 79,261.74 75,297.99
Unsecured Loans ‘D’ 10,883.06 19,215.51
90,144.80 94,513.50
Deferred Tax 1,956.98 2,059.19
TOTAL 207,353.63 193,023.97
APPLICATION OF FUNDS :
Goodwill on Consolidation 834.36 832.34
Fixed Assets : ‘E’
Gross Block 92,700.44 70,617.77
Less: Depreciation 24,265.66 17,308.59
Net Block 68,434.78 53,309.18
Capital Work in Progress 18,953.54 11,319.70
87,388.32 64,628.88
Investments ‘F’ 663.95 341.54
Current Assets, Loans & Advances :
Inventories ‘G’ 34,846.83 32,696.57
Sundry Debtors ‘H’ 182,627.58 141,601.08
Accrued value of work done 32,920.80 35,532.01
Cash & Bank Balances ‘I’ 5,567.52 5,825.23
Loans & Advances ‘J’ 32,655.28 33,948.67
288,618.01 249,603.56
Less:Current Liabilities & Provisions: ‘K’
Current Liabilities 154,308.10 110,521.63
Provisions 15,931.92 12,033.85
170,240.02 122,555.48
Net Current Assets 118,377.99 127,048.08
Miscellaneous Expenditure ‘L’ 89.01 173.13
TOTAL 207,353.63 193,023.97
Signifi cant Accounting Policies and notes forming Part of Accounts ‘T’
CONSOLIDATED BALANCE SHEETAS AT MARCH 31, 2010
The Schedules referred to above and the Notes attached form an integral part of Statement of Accounts.
In terms of our report attached For and on behalf of the Board
For Kishan M. Mehta & Co., For Deloitte Haskins & Sells, Pankaj Sachdeva Manish Mohnot
Chartered Accountants Chartered Accountants Managing Director Executive Director
(Kishan M. Mehta) (Gaurav J. Shah) Kamal Jain Bajrang Ramdharani
Partner Partner President & CFO Company Secretary
(M. No. 13707) (M. No. 35701)
AHMEDABAD: May 29, 2010 MUMBAI: May 28, 2010

67
SCHEDULE FOR THE YEAR ENDED ON
31/03/2010Rs. In Lacs
FOR THE YEAR ENDED ON
31/03/2009Rs. In Lacs
INCOME : Sales & Services-Gross ‘M’ 404,316.81 327,719.14
Less : Excise Duty 4,685.61 3,122.78 Sales & Services-Net 399,631.20 324,596.36 Other Income ‘N’ 2,476.89 3,524.90 Increase (Decrease) in Stocks: ‘O’ a) Transmission & Distribution Division (1,040.25) 5,177.64 b) Construction Division (595.48) (2,094.28)c) Other 418.12 (495.05)
TOTAL 400,890.48 330,709.57 EXPENDITURE : Material Cost 170,973.43 167,504.01 Employees’ Emoluments ‘P’ 26,319.91 19,879.87 Manufacturing & Operating Expenses ‘Q’ 133,229.01 88,107.98 Administrative, Selling & Other Expenses ‘R’ 23,849.91 18,774.27 Financial Expenses ‘S’ 12,598.93 13,688.41 Depreciation 7,458.34 5,763.75 Less: Transferred to Revaluation Reserve 5.10 4.65
TOTAL 374,424.43 313,713.64
PROFIT BEFORE TAX 26,466.05 16,995.93 Provision for Taxation :- Current Tax 7,011.57 4,012.67 Fringe Benefi t Tax - 199.21 Deferred Tax (102.20) (43.40)NET PROFIT FOR THE YEAR AFTER TAX 19,556.68 12,827.45 Minority Interest 1,788.91 1,733.13 NET PROFIT FOR THE YEAR AFTER TAX ANDAFTER MINORITY INTEREST
17,767.77 11,094.32
Balance brought forward 40,656.55 33,565.59 Add/(Less) : Prior Year’s adjustments 17.71 13.49 Add/(Less) : Prior Year’s Taxes 32.17 (41.65)AMOUNT AVAILABLE FOR APPROPRIATION 58,474.20 44,631.75 APPROPRIATIONS : Transfer of reserves for increased holding in subsidiary companies - (158.85)Transfer to Debentures Redemption Reserve 850.00 300.00 Corporate Tax on Interim Preference Share Dividend 6.90 6.83 Corporate Tax on Preference Share Dividend - 6.83 Proposed Dividend on Equity Shares 2,301.91 1,987.50 Corporate Tax on Proposed Dividend on Equity Shares 365.18 370.47
Transfer to General Reserve 2,900.00 1,462.42 Balance carried over to Balance Sheet 52,052.21 40,656.55
TOTAL 58,474.20 44,631.75
No. Of equity shares at the end of the year 26,500,000 26,500,000
Weighted No. Of equity shares at the end of period 26,500,000 26,500,000
Profi t for calculation of E.P.S. ( Rs.) 17,767.77 11,094.32
Nominal value of Equity shares (Rs.) 10.00 10.00
Basic/Diluted earning per share (Rs.) 67.05 41.87
CONSOLIDATED PROFIT & LOSS ACCOUNT FOR THE YEAR ENDED ON MARCH 31, 2010
The Schedules referred to above and the Notes attached form an integral part of Statement of Accounts.
In terms of our report attached For and on behalf of the Board
For Kishan M. Mehta & Co., For Deloitte Haskins & Sells, Pankaj Sachdeva Manish Mohnot
Chartered Accountants Chartered Accountants Managing Director Executive Director
(Kishan M. Mehta) (Gaurav J. Shah) Kamal Jain Bajrang Ramdharani
Partner Partner President & CFO Company Secretary
(M. No. 13707) (M. No. 35701)
AHMEDABAD: May 29, 2010 MUMBAI: May 28, 2010

68
31/03/2010Rs. In Lacs
31/03/2009Rs. In Lacs
SCHEDULE ‘A’ SHARE CAPITAL :
AUTHORISED :
30,000,000 (30,000,000) Equity Shares of Rs. 10 each 3,000.00 3,000.00
TOTAL 3,000.00 3,000.00
ISSUED, SUBSCRIBED & PAID-UP:
26,500,000 (26,500,000) Equity Shares of Rs.10 each fully paid up 2,650.00 2,650.00
Out of above
a) 14,186,500 (14,186,500) shares allotted as fully paid up
bonus shares by capitalisation out of general reserve, capital
redemption reserve and share premium account and
b) 3,060,000 (3,060,000) shares allotted for consideration other
than cash.
TOTAL 2,650.00 2,650.00
SCHEDULE ‘B’ RESERVES AND SURPLUS:
REVALUATION RESERVE:
As per last Balance Sheet 50.53 55.18
Less:Transferred from Depreciation Account 5.10 4.65
45.43 50.53
SHARE PREMIUM:
As per last Balance Sheet 34,447.13 34,447.13
Less :- Share issue expenses 32.97 -
34,414.16 34,447.13
FOREIGN CURRENCY TRANSLATION RESERVE:
As per last Balance Sheet - -
Add / Less : During the year 621.63 (186.82)
621.63 (186.82)
Transferred from/to General Reserve (186.82) 186.82
434.81 -
DEBENTURES REDEMPTION RESERVE:
Opening Balance 300.00 -
Transferred from Profi t & Loss Account 850.00 300.00
Closing Balance 1,150.00 300.00
GENERAL RESERVE:
As per last Balance Sheet 8,876.01 7,596.29
Transfer to/from Foreign Currency Translation Reserve 186.82 (186.82)
Less : Gratuity Liability - 1.21
Add : Transfer of Exchange rate Variation - 5.33
Add : Transferred from Profi t & Loss Account 2,900.00 1,462.42
11,962.83 8,876.01
PROFIT & LOSS:
As per profi t & loss account 52,050.21 40,656.55
TOTAL 100,057.44 84,330.22
CONSOLIDATED SCHEDULES TO ANDFORMING PART OF ACCOUNTS

69
CONSOLIDATED SCHEDULES TO ANDFORMING PART OF ACCOUNTS
31/03/2010 31/03/2009
Rs. In Lacs Rs. In Lacs
SCHEDULE ‘C’: SECURED LOANS:
A. DEBENTURES :
Secured Non-convertible Redeemable debentures 15,000.00 8,000.00
(Refer note number 18)
B. TERM LOANS :
FROM BANKS
(I) Secured by charge over freehold land and immovable properties, specifi c movable plant & machineries of Bio-mass Power Plant situated at Padampur, Dist. Sri Ganganagar, Rajasthan
292.19 585.26
(II) Term Loan from banks secured by fi rst charge on specifi c Plant & Machinery fi nanced by them.
6,702.98 6,731.54
(III) Secured by charge over immovable and movable plant & machineries of Bio-mass Power Plant situated at Uniara, Dist. Tonk, Rajasthan and second charge on current assets of the same.
1,496.07 2,251.50
(IV) Secured by way of hypothecation of all movable fi xed assets of transmission line tower plant at sector-28, Gandhinagar on paripasu basis alongwith consortium of bankers for working capital facilities stated hereunder.
832.66 1,666.33
(V) Secured by hypothecation of Specifi c movable fi xed assets relating to Infrastructure Division
352.94 776.47
(VI) Secured Against Vehicles 311.71 381.92
(VII) Secured against Lands and Warehousing Complexes thereon and hypothecation on the equipments and other fi xed assets
8,288.25 6,850.37
(VIII) Secured against hypothecation of the Equipments 45.28 79.41
(IX) Secured by equitable mortgage by deposit of title deeds of Leasehold Land and Structure (along with underlying receivable being / to be developed in Th ane)
3,099.99 1,125.23
36,422.07 28,448.03
C. WORKING CAPITAL FACILITIES FROM BANKS:
(I) Secured in favour of consortium of bankers by hypothecation of stocks, stores and spares, book debts and bills receivables and all other movable assets and further secured by all movable fi xed assets except charged to others as stated herein above of the factory premises and godown situated at Gandhinagar or wherever else pertaining to transmission & distribution and infrastructure division and by simple mortgage over land and building situated at Sector-28, Gandhinagar
31,985.54 32,723.23
(II) Bill discounting facility secured by fi rst pari-passu charge on current assets and all movable assets at Project sites premises and godowns of the sites for execution of work under GFSS-II of Maharashtra State Electricity Distribution Co. Limited.
1,179.75 2,406.78
(III) Working capital facilities are secured in favour of consortium bankers, by way of fi rst charge against hypothecation of stocks of construction material, consumable store and spares, Bills Receivables, Book Debts and other movables except 2nd charge on Current assets & receivables in favour of a bank for Bank Guarantee of Rs. 50 Crores provided on behalf of Joint Venture in which company is one of the member, and except fi rst charge over machinaries and equipments fi nanced by others for term loans and further secured by second pari-passu charge on machinaries and equipments fi nanced by others for term loans and fi rst charge on the offi ce premises of the company.
8,528.38 10,555.07
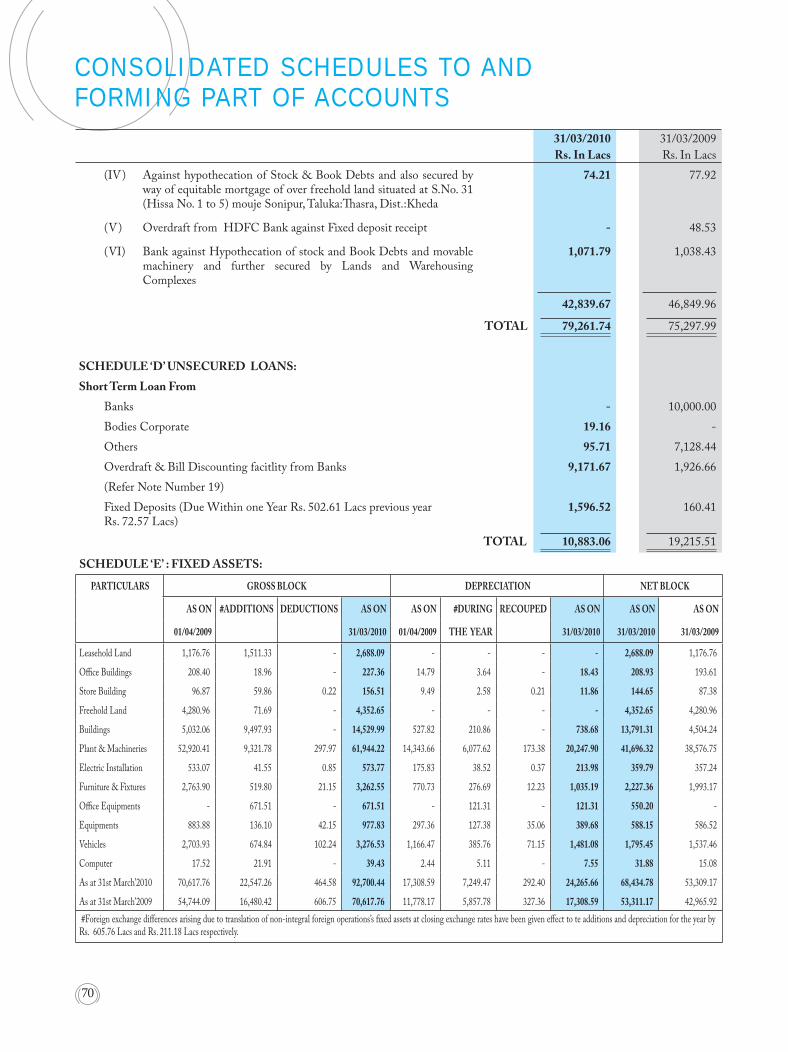
70
31/03/2010 31/03/2009
Rs. In Lacs Rs. In Lacs
(IV) Against hypothecation of Stock & Book Debts and also secured by way of equitable mortgage of over freehold land situated at S.No. 31 (Hissa No. 1 to 5) mouje Sonipur, Taluka:Th asra, Dist.:Kheda
74.21 77.92
(V) Overdraft from HDFC Bank against Fixed deposit receipt - 48.53
(VI) Bank against Hypothecation of stock and Book Debts and movable machinery and further secured by Lands and Warehousing Complexes
1,071.79 1,038.43
42,839.67 46,849.96
TOTAL 79,261.74 75,297.99
SCHEDULE ‘D’ UNSECURED LOANS:
Short Term Loan From
Banks - 10,000.00
Bodies Corporate 19.16 -
Others 95.71 7,128.44
Overdraft & Bill Discounting facitlity from Banks 9,171.67 1,926.66
(Refer Note Number 19)
Fixed Deposits (Due Within one Year Rs. 502.61 Lacs previous year Rs. 72.57 Lacs)
1,596.52 160.41
TOTAL 10,883.06 19,215.51
SCHEDULE ‘E’ : FIXED ASSETS:
PARTICULARS GROSS BLOCK DEPRECIATION NET BLOCK
AS ON #ADDITIONS DEDUCTIONS AS ON AS ON #DURING RECOUPED AS ON AS ON AS ON
01/04/2009 31/03/2010 01/04/2009 THE YEAR 31/03/2010 31/03/2010 31/03/2009
Leasehold Land 1,176.76 1,511.33 - 2,688.09 - - - - 2,688.09 1,176.76
Offi ce Buildings 208.40 18.96 - 227.36 14.79 3.64 - 18.43 208.93 193.61
Store Building 96.87 59.86 0.22 156.51 9.49 2.58 0.21 11.86 144.65 87.38
Freehold Land 4,280.96 71.69 - 4,352.65 - - - - 4,352.65 4,280.96
Buildings 5,032.06 9,497.93 - 14,529.99 527.82 210.86 - 738.68 13,791.31 4,504.24
Plant & Machineries 52,920.41 9,321.78 297.97 61,944.22 14,343.66 6,077.62 173.38 20,247.90 41,696.32 38,576.75
Electric Installation 533.07 41.55 0.85 573.77 175.83 38.52 0.37 213.98 359.79 357.24
Furniture & Fixtures 2,763.90 519.80 21.15 3,262.55 770.73 276.69 12.23 1,035.19 2,227.36 1,993.17
Offi ce Equipments - 671.51 - 671.51 - 121.31 - 121.31 550.20 -
Equipments 883.88 136.10 42.15 977.83 297.36 127.38 35.06 389.68 588.15 586.52
Vehicles 2,703.93 674.84 102.24 3,276.53 1,166.47 385.76 71.15 1,481.08 1,795.45 1,537.46
Computer 17.52 21.91 - 39.43 2.44 5.11 - 7.55 31.88 15.08
As at 31st March’2010 70,617.76 22,547.26 464.58 92,700.44 17,308.59 7,249.47 292.40 24,265.66 68,434.78 53,309.17
As at 31st March’2009 54,744.09 16,480.42 606.75 70,617.76 11,778.17 5,857.78 327.36 17,308.59 53,311.17 42,965.92
#Foreign exchange diff erences arising due to translation of non-integral foreign operations’s fi xed assets at closing exchange rates have been given eff ect to te additions and depreciation for the year by Rs. 605.76 Lacs and Rs. 211.18 Lacs respectively.
CONSOLIDATED SCHEDULES TO ANDFORMING PART OF ACCOUNTS

71
31/03/2010 31/03/2009
Rs. In Lacs Rs. In Lacs
SCHEDULE ‘F’ INVESTMENTS:
(As verifi ed, valued and certifi ed by management)
(A) INVESTMENT IN SHARES :
Quoted-Non Trade - Long Term (each share of
Rs.10 fully paid unless otherwise stated)
Nil (97) Equity Shares of KEC International Ltd. - 0.27
Nil (6) Equity Shares of Octav Investment Ltd. - 0.00
Nil (75) Equity Shares of KEC Infrastructure Ltd. - 0.01
Nil (750) Equity Shares of Jyoti Structures Ltd. - 0.11
Nil (50) Equity Shares of SPIC Ltd. - 0.06
Nil (100) Equity Shares of Larsen & Toubro Ltd. - 0.07
Nil (20) Equity Shares of Ultratech Cement Ltd. - 0.07
100 (100) Equity Shares of Transpower Engineering Ltd. 0.04 0.04
Nil (19900) Equity Shares of Bank of India - 8.96
Nil (5200) Equity Shares of Union Bank of India - 0.83
Nil (13960) Equity Shares of Indian Bank - 12.70
48366 (48366) Equity Shares of Power Grid Corporation of India Ltd. 25.15 25.15
Unquoted - Long Term
14476 (14476) Equity Shares of Rs. 25/- each of Nutan Nagrik Sahakari Bank Ltd. 3.62 3.62
Total (A) 28.81 51.89
(B) CURRENT INVESTMENT IN JOINT VENTURE:
Aggrawal JMC Joint Venture 635.18 291.03
Total (B) 635.18 291.03
Total Cost (A+B) 663.99 342.92
Less : Provision against Diminution in Value of Investments 0.04 1.38
TOTAL 663.95 341.54
Notes:
1. Market value of Quoted Investments 51.82 110.56
2. Book value of Quoted Investments 25.19 48.27
3. Book value of Unquoted Investments 3.62 3.62
CONSOLIDATED SCHEDULES TO ANDFORMING PART OF ACCOUNTS

72
31/03/2010 31/03/2009
Rs. In Lacs Rs. In Lacs
SCHEDULE ‘G’ INVENTORIES :
(As verifi ed, valued and certifi ed by management)
a) Transmission & Distribution Division:
Raw Materials & Components (Including goods in transit
Rs. 924.95 Lacs previous year Rs.1,057.80 Lacs ) 13,399.98 10,847.46
Finished Goods 6,075.54 5,531.90
Semi-fi nished Goods 1,145.75 1,844.13
Construction & others Stores, Spares & Tools 2,943.76 1,901.27
Construction Work-in-Progress 612.15 1,773.77
Scraps 175.30 129.71
24,352.48 22,028.24
b) Real Estate Division:
Work in Progress 217.00 306.58
Finished Stock 66.68 66.68
283.68 373.26
c) Bio-Mass Energy Division:
Fuel-Agricultural Residues 872.50 818.79
Stores, Spares & Tools 219.74 192.23
1,092.24 1,011.02
d) Construction:
Construction Materials, Stores & Spares 5,496.22 6,314.94
Spares & Tools 389.29 356.98
Work in Progress 854.80 1,453.68
6,740.31 8,125.60
e) Infrastructure Division:
Construction Material,Stores,Spares & Tools 1,380.72 582.67
1,380.72 582.67
f ) Others:
Agro Commodities 989.77 571.64
Stores & Consumables 7.63 4.14
997.40 575.78
TOTAL 34,846.83 32,696.57
SCHEDULE ‘H’ SUNDRY DEBTORS :
(Unsecured & considered good unless otherwise stated)
Outstanding over six months (excluding retention money) 40,238.12 40,660.67
Other debts
(Including retention money Rs. 61,384.06 Lacs previous year 33,943.05 Lacs) 142,389.46 100,940.41
TOTAL 182,627.58 141,601.08
CONSOLIDATED SCHEDULES TO ANDFORMING PART OF ACCOUNTS

73
31/03/2010 31/03/2009
Rs. In Lacs Rs. In Lacs
SCHEDULE ‘I’ : CASH AND BANK BALANCES:
Cash in hand 291.15 203.13
Balance with Scheduled Banks
In Current Accounts 2,543.26 976.94
In Margin money accounts (Margin Money having lien by bankers) 18.15 20.38
In Deposit Accounts 286.56 673.88
FDR With Bank pledged for Overdraft facility 100.00 108.69
Balances with non-Scheduled Banks (Includes balance under 2,328.40 3,842.21
lien with bank Rs. 347.86 Lacs previous year Rs. 389.25 Lacs)
TOTAL 5,567.52 5,825.23
SCHEDULE ‘J’ : LOANS AND ADVANCES:
(Unsecured and considered good unless otherwise stated)
Advances recoverable in cash or in kind or for value
to be received 18,551.65 16,448.97
Advance Income Tax (Net-off Provision) 3,792.30 1,094.10
VAT / Sales Tax /Entry Tax (Net-off Provision) 1,140.10 783.63
Accrued Income 93.20 271.13
Prepaid Expenses 4,102.36 3,277.00
Security / Margin Deposits 4,744.74 4,697.56
Commodity Trading Margin Money 134.55 -
Advance for Land & Property 96.38 7,376.28
TOTAL 32,655.28 33,948.67
SCHEDULE ‘K’ : CURRENT LIABILITIES & PROVISIONS:
CURRENT LIABILITIES :
Sundry Creditors 68,996.51 51,766.65
Unclaimed Matured Fixed Deposits 6.62 2.85
Unclaimed FD Interest 1.03 0.52
Unclaimed Share Application Money 0.51 0.43
Advances from customers 41,567.57 32,795.87
Other Liabilities 20,670.32 15,536.81
Payables under Letter of Credit 14,905.18 9,010.77
Bills Payable 6,380.08 512.58
Interest accrued but not due 282.47 55.99
VAT / Sales Tax Payable/TDS/Service tax liablity 1,473.49 818.58
Unclaimed Dividend 24.32 20.58
(No amount is due for payment to Investor Education & Protection Fund)
154,308.10 110,521.63
PROVISIONS FOR :
Proposed Dividend on Equity Shares 2,301.91 1,987.50
Corporate Tax on Proposed Dividend 399.15 406.26
Current Taxation (Net of Advance Tax) 9.91 16.32
Fringe Benefi t Tax (Net of Advance Tax) - 2.60
Leave Encashment 553.81 579.09
Gratuity 165.28 365.00
Performance Warranties / Defect Liability Expenses 12,501.86 8,677.08
15,931.92 12,033.85
TOTAL 170,240.02 122,555.48
CONSOLIDATED SCHEDULES TO ANDFORMING PART OF ACCOUNTS

74
31/03/2010 31/03/2009
Rs. In Lacs Rs. In Lacs
SCHEDULE ‘L’: MISCELLANEOUS EXPENDITURE:
(to the extent not written off or adjusted)
Pre-Operative & Preliminary Expenses
Carrying amount at the begining 7.37 13.35
Additions during the year 0.14 -
Less :-Amortised during the year 0.07 0.06
7.44 13.29
Employee Compensation (ESOP) 159.85 275.51
Less : Amortised during the year (48.61) (33.09)
Less : Reversed during the year (29.67) (82.58)
TOTAL 89.01 173.13
SCHEDULE ‘M’: SALES & SERVICES:
Sales, Erection & Works Contract Receipts:
Transmission & Distribution Division 222,293.06 168,778.45
Infrastructure Division 36,068.87 17,197.69
Bio-Mass Energy Division 5,082.94 4,763.27
Real Estate Division 37.60 6.00
Mining Product 505.98 296.68
Construction Division 130,029.77 130,599.30
Trading of Commodity 8,993.47 5,698.78
403,011.69 327,340.17
Warehousing Income 349.37 111.32
Excise Duty / Jcci Refund & Rebate 806.82 177.19
Other Services 148.93 90.46
TOTAL 404,316.81 327,719.14
SCHEDULE ‘N’: OTHER INCOME:
Interest Income (Gross) 255.09 1,622.14
Certifi ed Emission Reduction Receipts 528.69 578.28
Dividend from Current Investment - 73.09
Dividend from Long Term Investment 2.82 3.58
Rent Income 198.71 79.53
Profi t on Sale of fi xed assets 10.71 16.08
Profi t on Sale of Investment (Net) 96.29 -
Miscellaneous Income 512.62 435.14
Share of Profi t in JV 414.04 296.43
Insurance Claims 98.60 221.67
Vatav - Kasar 29.03 5.44
Liabilities Written Back 173.52 193.52
Profi t on sale of right in property (Consideration Received) 271.20 -
Less:- Cost transferred from WIP (114.43) -
TOTAL 2,476.89 3,524.90
CONSOLIDATED SCHEDULES TO ANDFORMING PART OF ACCOUNTS

75
31/03/2010 31/03/2009
Rs. In Lacs Rs. In Lacs
SCHEDULE ‘O’: INCREASE (DECREASE) IN STOCKS:
a) Transmission & Distribution Division:
STOCK AT CLOSE :
Finished Goods 6,075.55 5,531.90
Semi-fi nished Goods 1,145.76 1,844.13
Work in Progress 553.33 1,536.92
Scrap 175.29 77.23
7,949.93 8,990.18
STOCK AT COMMENCEMENT:
Finished Goods 5,531.90 2,810.53
Semi-fi nished Goods 1,844.13 941.73
Work in Progress 1,536.92 -
Scrap 77.23 60.28
8,990.18 3,812.54
(1,040.25) 5,177.64
b) Construction Division:
STOCK AT CLOSE :
Finished Goods - -
Semi-fi nished Goods 891.49 1,459.48
891.49 1,459.48
STOCK AT COMMENCEMENT:
Finished Goods - -
Semi-fi nished Goods 1,486.97 3,553.76
1,486.97 3,553.76
(595.48) (2,094.28)
c) Other:
STOCK AT CLOSE :
Finished Goods 1,056.44 638.32
Semi-fi nished Goods - -
1,056.44 638.32
STOCK AT COMMENCEMENT :
Finished Goods 638.32 1,133.37
Semi-fi nished Goods - -
638.32 1,133.37
418.12 (495.05)
TOTAL (1,217.61) 2,588.31
SCHEDULE ‘P’: EMPLOYEES EMOLUMENTS:
Salaries, Wages, Bonus 23,692.37 17,330.86
Contribution to Providend & Other Funds (includes social security 1,409.36 1,270.75
and other benefi ts for overseas employees)
Employees Compensation (Net of Write Back) 48.54 58.86
Employees’ Welfare Expenses 1,169.64 1,219.40
TOTAL 26,319.91 19,879.87
CONSOLIDATED SCHEDULES TO ANDFORMING PART OF ACCOUNTS

76
CONSOLIDATED SCHEDULES TO ANDFORMING PART OF ACCOUNTS
31/03/2010 31/03/2009
Rs. In Lacs Rs. In Lacs
SCHEDULE ‘Q’: MANUFACTURING & OPERATING EXPENSES:
Erection & Sub-contracting Exp. 73,279.71 36,650.66
Job charges 988.32 1,048.46
Power & Fuel 1,269.11 1,265.31
Repairs & Maintenance:
Plant & Machinery 4,417.67 4,851.84
Building and Others 177.18 151.85
Other 40.64 28.85
Work Charges 21,084.85 22,775.68
Composite Work Charges 21,555.88 11,662.64
Godown Rent 22.26 26.87
Security Expenses 515.24 471.54
Freight & Forwarding Expenses 2,970.64 2,360.68
Stores, Spares and Tools Consumed 1,042.35 836.40
Vehicle/ Equipment Running & Hire Charges 3,204.44 3,156.40
Testing Expenses 47.12 131.00
Pollution Control Expenses 61.39 46.57
Other Operating Expenses 2,553.55 2,643.23
Pre-operative direct Expenses - 173.78
Purchase of Land 22.88 -
Less : Transfer to Work In Progress (24.22) (173.78)
TOTAL 133,229.01 88,107.98
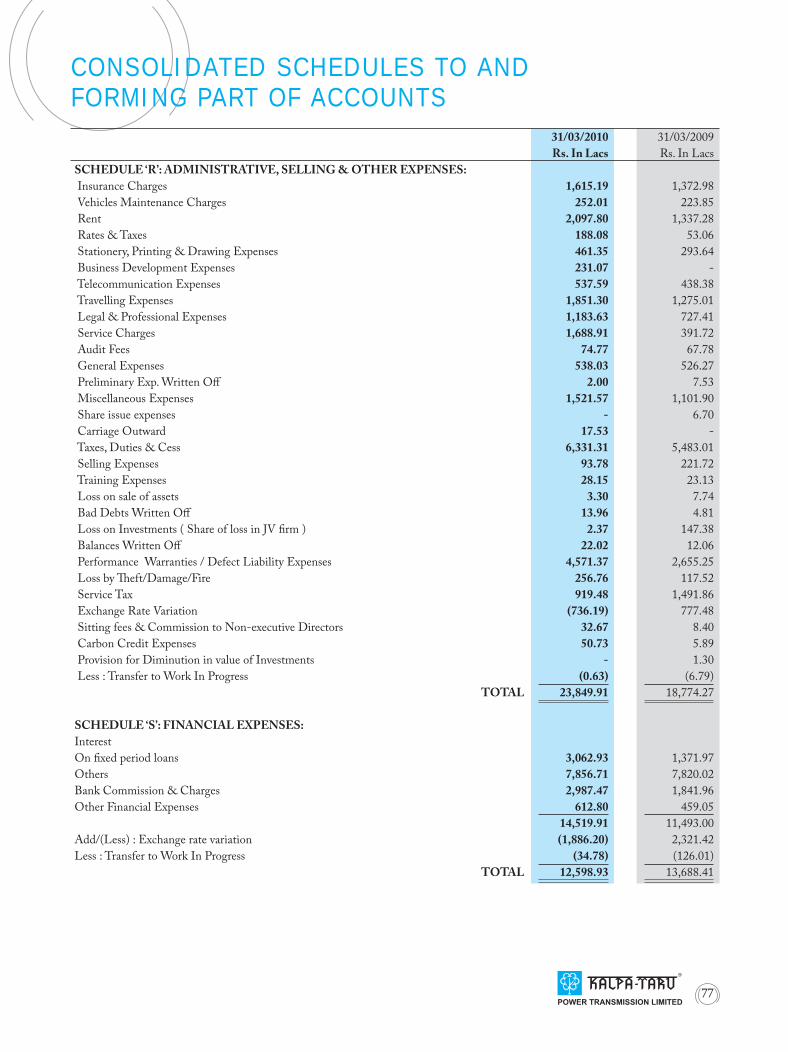
77
31/03/2010 31/03/2009
Rs. In Lacs Rs. In Lacs
SCHEDULE ‘R’: ADMINISTRATIVE, SELLING & OTHER EXPENSES:
Insurance Charges 1,615.19 1,372.98
Vehicles Maintenance Charges 252.01 223.85
Rent 2,097.80 1,337.28
Rates & Taxes 188.08 53.06
Stationery, Printing & Drawing Expenses 461.35 293.64
Business Development Expenses 231.07 -
Telecommunication Expenses 537.59 438.38
Travelling Expenses 1,851.30 1,275.01
Legal & Professional Expenses 1,183.63 727.41
Service Charges 1,688.91 391.72
Audit Fees 74.77 67.78
General Expenses 538.03 526.27
Preliminary Exp. Written Off 2.00 7.53
Miscellaneous Expenses 1,521.57 1,101.90
Share issue expenses - 6.70
Carriage Outward 17.53 -
Taxes, Duties & Cess 6,331.31 5,483.01
Selling Expenses 93.78 221.72
Training Expenses 28.15 23.13
Loss on sale of assets 3.30 7.74
Bad Debts Written Off 13.96 4.81
Loss on Investments ( Share of loss in JV fi rm ) 2.37 147.38
Balances Written Off 22.02 12.06
Performance Warranties / Defect Liability Expenses 4,571.37 2,655.25
Loss by Th eft/Damage/Fire 256.76 117.52
Service Tax 919.48 1,491.86
Exchange Rate Variation (736.19) 777.48
Sitting fees & Commission to Non-executive Directors 32.67 8.40
Carbon Credit Expenses 50.73 5.89
Provision for Diminution in value of Investments - 1.30
Less : Transfer to Work In Progress (0.63) (6.79)
TOTAL 23,849.91 18,774.27
SCHEDULE ‘S’: FINANCIAL EXPENSES:
Interest
On fi xed period loans 3,062.93 1,371.97
Others 7,856.71 7,820.02
Bank Commission & Charges 2,987.47 1,841.96
Other Financial Expenses 612.80 459.05
14,519.91 11,493.00
Add/(Less) : Exchange rate variation (1,886.20) 2,321.42
Less : Transfer to Work In Progress (34.78) (126.01)
TOTAL 12,598.93 13,688.41
CONSOLIDATED SCHEDULES TO ANDFORMING PART OF ACCOUNTS

78
SCHEDULE ‘T’ SIGNIFICANT ACCOUNTING POLICIES AND NOTES FORMING PART OF CONSOLIDATED ACCOUNTS
Signifi cant Accounting Policies1. :Basis of Preparation:A.
Th e Consolidated fi nancial statements of Kalpataru Power Transmission Limited, (the Parent) and; its subsidiaries collectively referred as (‘the Group’) are prepared in accordance with relevant accounting standards under the historical cost convention, except as stated in note C (i). Th e accounts have been prepared on accrual basis of accountancy in accordance with the accounting principles generally accepted in India.Principles of Consolidation:B.
Th e fi nancial statement of the subsidiary companies used in the consolidation are drawn upto the same reporting date as of the parent.
Th e consolidated fi nancial statements have been prepared on the following basis:Th e fi nancial statements of the parent and its subsidiaries have been combined on line-by-line basis by adding together, (i) like items of assets, liabilities, income and expenses. Inter-company balances and transactions and unrealized profi ts or losses have been fully eliminated.Interest in two jointly controlled entities have been reported by not using proportionate consolidation and the share of the (ii) profi t/loss only from joint venture entities has been accounted for, for the reason, as explained in Note No. 6 (ii) of these accounts. Th e excess of cost to the parent of its investments in subsidiary companies over its share of the equity of the subsidiary (iii) companies at the dates, on which the investments in the subsidiary companies are made, is recognized as “Goodwill” being an asset in the consolidated fi nancial statements. Minority interest in the net assets of consolidated subsidiaries consists of the amount of equity attributable to the minority (iv) shareholders at the date on which investments are made by the parent in the subsidiary companies.
Fixed Assets:C. (i) Fixed assets are stated at cost of acquisition / construction / revalued amount less accumulated depreciation less impairment
losses if any.(ii) Cost is inclusive of all identifi able expenditure incurred to bring the fi xed assets to their working condition for their
intended use. When the fi xed asset is demolished, disposed off or destroyed, the costs and related depreciation is removed from the books of account and the resultant profi t or loss is refl ected in the profi t & loss account. Direct cost as well as related incidental expenses incurred on assets that are not yet ready for their intended use or not put to use as on the balance sheet date are stated as Capital Work In Progress.
Depreciation: D. Depreciation is provided on the basis of straight-line method on all depreciable fi xed assets at the rates prescribed in
Schedule – XIV of the Companies Act, 1956, on prorata basis except:Depreciation pertaining to assets of Research & Development Centre, the Export Oriented Unit, mining and quarries, real i) estate and operating leases are provided on the basis of written down value method.
ii) Depreciation on plant and machinery of bio-mass energy plants is provided at a higher rate at 7.5% instead of the prescribed rate for continuous process plant considering the useful life of plant supported by technical evaluation and report.
iii) In case of revalued assets the diff erence between the depreciation based on revalued cost and the depreciation charged on historical cost is recouped out of revaluation reserve.
iv) Depreciation on overseas projects’ assets are provided at the rates as per the requirement of law of respective foreign countries and as per such rates, depreciation provided in each overseas project is higher than the depreciation at prescribed rates under Schedule-XIV of the Companies Act, 1956.
v) Deprecation on all the vehicles in the group is provided at a higher rate at 15% instead of the prescribed rate, considering the useful life of vehicle based on technical evaluation of the management.
vi) Considering the useful life based on technical evaluation by the management, higher rate than the prescribed rates are applied on a few shuttering items of machinery at 30%, on offi ce equipments at 12.5%, on all vehicles at 15% and on remaining plant and machineries which are acquired on or after 1st October, 2005 at 12.5% . Intangible assets are amortized over a period of fi ve years from the day they are acquired on prorata basis.vii)
Revenue Recognition:E. Transmission & Distribution:(i)
Sales are recognized on delivery of materials. Sales include excise duty and export benefi ts being Duty Entitlement Pass book credits but exclude Sales Tax.
Erection and Works Contract revenue for work completed are recognized on percentage of completion method based on completion of physical proportion of the contract work. When it is probable that total contract cost will exceed the total contract revenue, the expected loss is recognized immediately.Real Estate:(ii)
Revenue is recognized at the time of transfer of signifi cant risks and rewards of ownership to the buyer on executing

79
agreement for sale and estimated cost of completion against Sales recognized, wherever applicable, is provided for in profi t and loss account. Advances received against booking of units are appearing as current liabilities.Bio-mass Energy:(iii)
Revenue is recognized on supply of electricity generated to the customer.Infrastructure:(iv)
Revenue is recognized by adding the aggregate cost and proportionate margin using the percentage completion method. Percentage of completion is determined as a proportion of cost incurred to date to the total estimated contract cost. When it is probable that total contract cost will exceed the total contract revenue, the expected loss is recognized immediately.Construction:(v)
Running Account Bills for work completed are recognized on percentage of completion method based on completion of physical proportion of the contract work. Income on account of claims and extra item work is recognized to the extent group expects reasonable certainty about receipts or acceptance from the client. When it is probable that total contract cost will exceed the total contract revenue, the expected loss is recognized immediately. Warehousing:(vi)
Revenue from warehousing facility under arrangement with National Collateral Management Services Limited (i) (NCMSL) is recognized as per warehouse utilization by customers at prescribed rates by National Commodity & Derivatives Exchange Ltd. (NCDEX), on the basis of 60% / 65% (w.e.f. 13.07.2009) of revenue earned through NCMSL in terms of the agreement of Group with them, on the basis of details of warehouse charges earned by them from the Warehouses of the Group as franchisee. Revenue from cold storage and other warehousing facility other than (vi) (i) above is recognized mainly as per (ii) prevailing rules and regulations of local mandi / market, for storage of commodities. However at the end of the year revenue, if any, remain to be booked is accounted for as accrued income under the accrual system of accounting. Sales are recognized on delivery and exclude VAT(iii) .
Other income:(vii) Dividends are recorded when the right to receive payment is established. Interest income is recognized on time proportion basis.Inventories:F.
Transmission & Distribution:(i) Raw materials, semi-fi nished goods, fi nished goods, scraps and construction work-in-progress and other stores-spares and
tools and trading goods are stated at lower of cost and net realizable value. Th e cost of inventories is computed on weighted average basis.
(ii) Real Estate: Finished and semi fi nished inventory are stated at lower of cost and net realizable value. Cost is computed on average
cost basis which includes payments made against agreement to purchase land, development cost direct and attributable towards the specifi c real estate project and cost of borrowings as stated in note 1 L.
(iii) Biomass Energy: Fuel and stores, spares & tools are stated at lower of cost and net realizable value. Th e cost of fuel, stores, spares and tools
are computed on weighted average basis.(iv) Infrastructure: Construction material and stores, spares & tools are valued at lower of cost or net realizable value. Th e cost is computed
on weighted average basis. Construction:(v)
Construction material, stores and spares are valued at lower of cost or net realizable value. Cost includes cost of purchase and other expenses incurred in bringing inventory to their respective present location and condition. Cost is determined using FIFO method of inventory valuation.
Work in process is valued at lower of cost and net realizable value. In case where work is completed but Running Account bill can not be raised on client due to contractual conditions, the work in progress is valued at contract rates.
(vi) Warehousing: Trading goods are stated at lower of cost and net realizable value. Th e cost of inventories is computed on FIFO basis.Investments:G.
Long term investments are stated at cost after deducting the provision for diminution in value, if any, other than of a temporary nature. Current investments are stated at lower of cost or fair value.Retirement Benefi ts:H. (i) Gratuity liability is provided under a defi ned benefi t plan, under Group Gratuity Cash Accumulation Scheme under
an irrevocable trust. Th e group’s liability towards gratuity is determined on the basis of actuarial valuation done by an independent actuary.
Contribution to Provident Fund and Superannuation Fund, being defi ned contribution plans are charged to Profi t & Loss (ii) Account.

80
Provision for leave encashment liability is made on actuarial valuation as at the balance sheet date. (iii) All other short-term employee benefi ts are recognized as an expense at the undiscounted amount in the profi t and loss (iv) account of the year in which the related service is rendered.
Excise/Custom Duty:I. Th e liability for excise and custom duty in respect of materials lying in factory/bonded premises is accounted for as and when
they are cleared/ debonded.
Deferred Revenue Expenses:J. Preliminary expenses incurred are charged to revenue.
Foreign Currency Transactions:K. Transactions in foreign currency are accounted for at the exchange rate prevailing on the date of transactions. Assets and
liabilities, remaining unsettled at the end of the year are translated at the exchange rate prevailing at the end of the year and diff erence is adjusted to respective accounts in profi t & loss account. Th e exchange gain or loss between forward exchange contract rate and exchange rate at the date of transaction are recognized in profi t and loss account over the life of the contract.Translation of overseas jobs / projects of a non-integral foreign operation is translated as under: -
Assets and liabilities at rates prevailing at the end of the year,i) Income and expenses at the average rate for the year, and ii) Resulting exchange diff erences is accumulated in foreign currency translation reserve account. iii)
In respect of foreign currency option contracts which are entered into to hedge, the cost of these contracts, if any, is expensed over the period of the contract. Any profi t or loss arising on settlement or cancellation of currency options is recognized as income or expenses for the period in which settlement or cancellation takes place.
Borrowing Cost:L. Borrowing costs that are directly attributable to the acquisition, construction or production of qualifying assets are capitalized as
part of the cost of such assets. All other borrowing costs are recognized as expense in the period in which they are incurred.
Impairment of assets:M. Th e carrying amount of assets is reviewed at each balance sheet date to determine whether there is any indication of impairment.
If any such indication exists, the recoverable amount of the assets is estimated. An impairment loss is recognized whenever the carrying amount of an asset or its cash generating units exceeds its recoverable amount. An impairment loss is reversed if there has been a change in the estimates used to determine the recoverable amount and recognized in compliance with AS-28.
Taxes on Income:N. i) Tax on income for the current period is determined on the basis of estimated taxable income and tax credit computed in
accordance with the provisions of the Income Tax Act, 1961.ii) Deferred tax is recognized on timing diff erence between the accounting income and the estimated taxable income for the
period and quantifi ed using the tax rates and laws enacted or substantively enacted as on the balance sheet date.iii) Deferred tax assets which arise mainly on account of unabsorbed losses or unabsorbed depreciation are recognized and
carried forward only to the extent that there is virtual certainty supported by convincing evidence that suffi cient future taxable income will be available against which such deferred tax assets can be realized.
Commodity Hedging:O. In order to hedge risk on purchases of material exposed to commodity price risk, the group enters into forward contracts in
future market. Th e group does not enter into such hedging contracts or transactions for speculative purposes. Th e hedging transactions are used only for the purpose to manage exposure to commodity price risks. Th e income and gain/loss arising on this account are recorded at the time of settlement / cancellation whether during the year or succeeding year and are adjusted as part of cost of the respective material.
Accounting for Project Mobilization expenses:P. Expenditure incurred on mobilization and creation of facilities for site is written off in proportion to work done at respective
sites so as to absorb such expenditure during the tenure of the contract.
Use of Estimates:Q. Th e presentation of fi nancial statements requires certain estimates and assumptions. Th ese estimates and assumptions aff ect
the reported amount of assets and liabilities on the date of the fi nancial statements and the reported amount of revenues and expenses during the reporting period. Diff erence between the actual result and estimates are recognized in the period in which the results are known /materialized.
Provisions, Contingent Liabilities and Contingent Assets: R. Provisions involving substantial degree of estimation in measurement are recognized when there is a present obligation as i)
a result of past events and that probably requires an outfl ow of resources.A disclosure for a contingent liability is made when there is a possible obligation or a present obligation that may, but ii) probably will not, require an outfl ow of resources. Where there is a possible obligation or a present obligation in respect of which the likelihood of outfl ow of resources is remote, no disclosure is made.
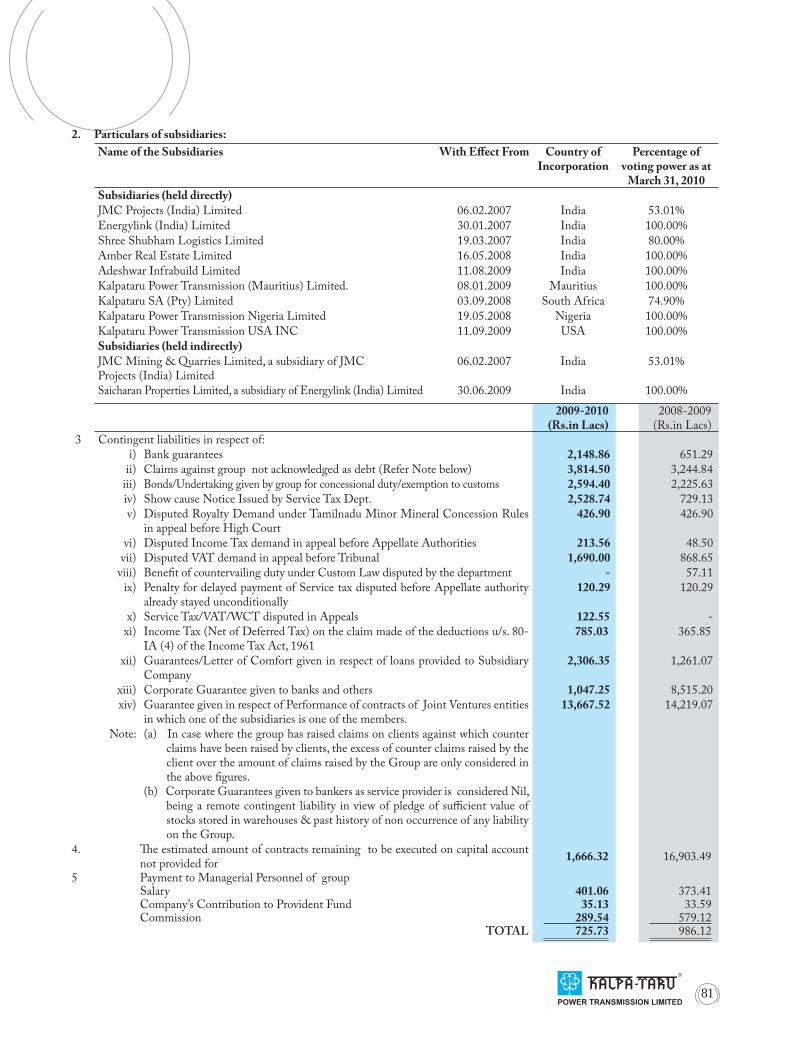
81
Particulars of subsidiaries:2.
Name of the Subsidiaries With Eff ect From Country ofIncorporation
Percentage ofvoting power as at
March 31, 2010
Subsidiaries (held directly)
JMC Projects (India) Limited 06.02.2007 India 53.01%
Energylink (India) Limited 30.01.2007 India 100.00%
Shree Shubham Logistics Limited 19.03.2007 India 80.00%
Amber Real Estate Limited 16.05.2008 India 100.00%
Adeshwar Infrabuild Limited 11.08.2009 India 100.00%
Kalpataru Power Transmission (Mauritius) Limited. 08.01.2009 Mauritius 100.00%
Kalpataru SA (Pty) Limited 03.09.2008 South Africa 74.90%
Kalpataru Power Transmission Nigeria Limited 19.05.2008 Nigeria 100.00%
Kalpataru Power Transmission USA INC 11.09.2009 USA 100.00%
Subsidiaries (held indirectly)
JMC Mining & Quarries Limited, a subsidiary of JMCProjects (India) Limited
06.02.2007 India 53.01%
Saicharan Properties Limited, a subsidiary of Energylink (India) Limited 30.06.2009 India 100.00%
2009-2010(Rs.in Lacs)
2008-2009(Rs.in Lacs)
3 Contingent liabilities in respect of:
i) Bank guarantees 2,148.86 651.29
ii) Claims against group not acknowledged as debt (Refer Note below) 3,814.50 3,244.84
iii) Bonds/Undertaking given by group for concessional duty/exemption to customs 2,594.40 2,225.63
iv) Show cause Notice Issued by Service Tax Dept. 2,528.74 729.13
v) Disputed Royalty Demand under Tamilnadu Minor Mineral Concession Rules in appeal before High Court
426.90 426.90
vi) Disputed Income Tax demand in appeal before Appellate Authorities 213.56 48.50
vii) Disputed VAT demand in appeal before Tribunal 1,690.00 868.65
viii) Benefi t of countervailing duty under Custom Law disputed by the department - 57.11
ix) Penalty for delayed payment of Service tax disputed before Appellate authority already stayed unconditionally
120.29 120.29
x) Service Tax/VAT/WCT disputed in Appeals 122.55 -
xi) Income Tax (Net of Deferred Tax) on the claim made of the deductions u/s. 80-IA (4) of the Income Tax Act, 1961
785.03 365.85
xii) Guarantees/Letter of Comfort given in respect of loans provided to Subsidiary Company
2,306.35 1,261.07
xiii) Corporate Guarantee given to banks and others 1,047.25 8,515.20
xiv) Guarantee given in respect of Performance of contracts of Joint Ventures entities in which one of the subsidiaries is one of the members.
13,667.52 14,219.07
Note: (a) In case where the group has raised claims on clients against which counter claims have been raised by clients, the excess of counter claims raised by the client over the amount of claims raised by the Group are only considered in the above fi gures.
(b) Corporate Guarantees given to bankers as service provider is considered Nil, being a remote contingent liability in view of pledge of suffi cient value of stocks stored in warehouses & past history of non occurrence of any liability on the Group.
4. Th e estimated amount of contracts remaining to be executed on capital account not provided for
1,666.32 16,903.49
5 Payment to Managerial Personnel of groupSalary 401.06 373.41Company’s Contribution to Provident Fund 35.13 33.59Commission 289.54 579.12
TOTAL 725.73 986.12

82
6. Joint Ventures
i) Th e Group has entered into consortium Joint Venture named JMC-Associated JV, JMC-Tantia JV, JMC-Taher Ali JV, JMC- PPPL JV, JMC-MSKE JV, and GIL-JMC JV under work sharing arrangement. Th e revenue for work done is accounted in accordance with the accounting policy followed by the Group as that of independent contractor to the extent work is executed.
ii) In respect of contracts executed in Joint Ventures entities, the services rendered to the Joint Venture entities are accounted as income for the work done. Th e share of profi t / loss in Joint Venture entities has been accounted for and the same is refl ected as investments or current liabilities in books of the Group.
Th e list of Joint Venture entities :
Name of the Joint Venture Name of Venture Partner Method of Accounting Share of Interest
Aggrawal – JMC JV Dinesh Chandra Aggrawal Infracon Private Limited Percentage of Completion 50%
JMC – Sadbhav JV Sadbhav Engineering Limited Percentage of Completion 50.50%
Details of proportionate share in the Assets, Liabilities, Income and Expenditure of the Group in its Joint Venture entities is given below: (Rs. In Lacs)
Particulars Aggrawal JMC JV JMC Sadbhav JV
As at 31st March, 2010
As at 31st March, 2009
As at 31st March, 2010
As at 31st March, 2009
% of Holding 50.00% 50.00% 50.50% 50.50%
Assets 1,267.23 2,161.90 1,395.39 967.10
Liabilities 949.64 2,016.40 1,477.43 1,047.76
Income 17,505.03 8,961.32 474.09 425.55
Expenditure 17,160.89 8,845.04 475.43 499.97
Th e aforesaid two Joint Venture Entities have not been consolidated using proportionate consolidation and only the share of profi t / loss therein has been accounted for, as in view of the management, both the JV entities are formed for specifi c project and with a view to subsequent disposal on completion of specifi c projects in near future and accordingly they fall in the exception for proportionate consolidation as per para 29 of AS-27.
7. Th e disclosure as to provision for performance warranties/defect liability expenses is:-
As at March 31, 2010 (Rs. in Lacs)
As at March 31, 2009 (Rs. in Lacs)
Carrying amount at the beginning of the year 8,677.08 6,724.45
Add : Provision/Expenses during the Year 4,741.67 3,658.36
Less: Reversal of provision on fi nalization of warranty and guarantee
(170.30) 4,571.37 (1,003.21) 2,655.15
Less: Utilization during the year (746.58) (617.49)
Less: Excess expenses during the year - (85.02)
Carrying amount at the end of the year 12,501.87 8,677.09
8. In accordance with the AS-22, accounting for taxes on income, issued by the Institute of Chartered Accountants of India, net deferred tax liability from timing diff erences amounting to Rs. 1,956.98 Lacs is accounted for using applicable current rate of tax.
As at March 31, 2010(Rs. in Lacs)
As at March 31, 2009(Rs. in Lacs)
Depreciation 2,871.17 2,803.95
Less: Deferred tax assets
i. U/s 43B of IT Act, 1961 534.83 731.78
ii. Others *379.36 12.98
1,956.98 2,059.19
* In view of the virtual certainty for set off of carried forward looses and allowances in near future to full fl edged working of warehouse activity in near future, the deferred tax asset is recognized.

83
9. Information in accordance with the requirement of the AS-7 issued by the Institute of Chartered Accountants of India as follows:-
March 31, 2010Rs. in Lacs
March 31, 2009Rs. in Lacs
1. Amount of Contract Revenue Recognized as Revenue in the period 221,705.79 195,270.90
2. Disclosure in respect of contract in progress at the Reporting Date
(a) Contract cost incurred & Recognized Profi t less Recognized losses upto the reporting date
460,979.31 355,455.88
(b) Advance Received 23,110.83 22,918.54
(c) Retention 18,917.10 15,828.90
3. Due to Customer - -
4. Due from Customers 24,609.36 32,074.45
10. Related Party disclosure as required by Accounting Standard -18 is as below:-
(a) List of related persons
(i) Joint Venture:JMC-Associated• Aggrawal-JMC• JMC-Sadbhav• JMC-Taher Ali• JMC-PPPL,• JMC-Tantia• JMC-MSKE-JV•
(ii) Key Management Personnel and their relativesPankaj Sachdeva - Managing Director (W.e.f. June 01, 2009)
Deputy Managing Director (upto May 31, 2009)K.V. Mani - Managing Director (upto May 31, 2009) Ajay Munot - Executive Director (upto March 31, 2009) Manish Mohnot - Executive Director Hemant Modi - Vice Chairman & Managing Director Suhas Joshi - Managing Director Aditya Bafna - Whole time Director Shubhendra Bafna - Whole time Director Late Mr. I.K. Modi - Relative of Key Managerial Personnel• Mrs. Suverna I. Modi - Relative of Key Managerial Personnel• Mrs. Sonal H. Modi - Relative of Key Managerial Personnel• Ms. Ami H. Modi - Relative of Key Managerial Personnel•
(iii) Enterprises under signifi cant infl uence:Shubham Industries• Kalpataru Properties Private Limited• M/s Habitat• Property Solution (India) Private Limited • Yugdharam Real Estate Private Limited• Durable Trading Co. Private Limited• P.K.Velu & Co. Private Limited • Saicharan Properties Limited (upto June 29, 2009)• Kalpataru Limited • Shubham International• Shubham Corporation• Shubham Agro• Kalpataru Th eatres Private Limited• JMC Infrastructure Limited • SAI Consultant Engineers Private Limited • JMC Consultant & Developers Private Limited• JMC Construction •
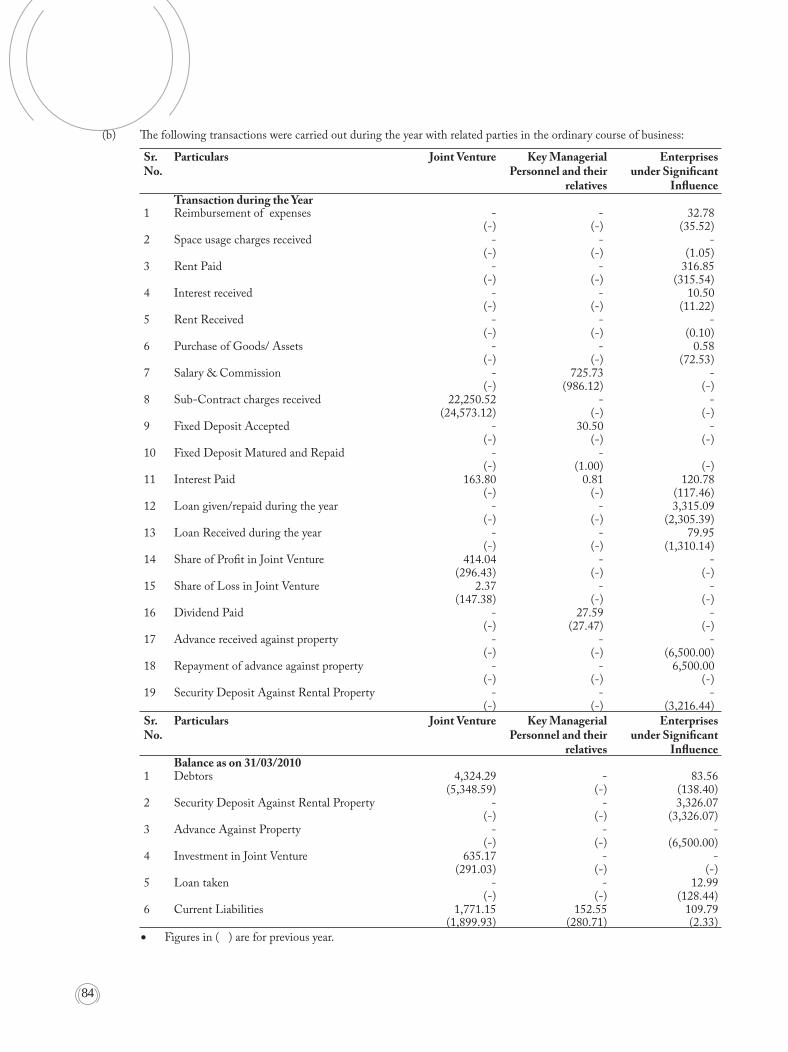
84
(b) Th e following transactions were carried out during the year with related parties in the ordinary course of business:
Sr.No.
Particulars Joint Venture Key Managerial Personnel and their
relatives
Enterprises under Signifi cant
Infl uenceTransaction during the Year
1 Reimbursement of expenses - - 32.78 (-) (-) (35.52)
2 Space usage charges received - - - (-) (-) (1.05)
3 Rent Paid - - 316.85 (-) (-) (315.54)
4 Interest received - - 10.50 (-) (-) (11.22)
5 Rent Received - - - (-) (-) (0.10)
6 Purchase of Goods/ Assets - - 0.58 (-) (-) (72.53)
7 Salary & Commission - 725.73 - (-) (986.12) (-)
8 Sub-Contract charges received 22,250.52 - - (24,573.12) (-) (-)
9 Fixed Deposit Accepted - 30.50 - (-) (-) (-)
10 Fixed Deposit Matured and Repaid - - (-) (1.00) (-)
11 Interest Paid 163.80 0.81 120.78 (-) (-) (117.46)
12 Loan given/repaid during the year - - 3,315.09 (-) (-) (2,305.39)
13 Loan Received during the year - - 79.95 (-) (-) (1,310.14)
14 Share of Profi t in Joint Venture 414.04 - - (296.43) (-) (-)
15 Share of Loss in Joint Venture 2.37 - - (147.38) (-) (-)
16 Dividend Paid - 27.59 - (-) (27.47) (-)
17 Advance received against property - - - (-) (-) (6,500.00)
18 Repayment of advance against property - - 6,500.00 (-) (-) (-)
19 Security Deposit Against Rental Property - - -(-) (-) (3,216.44)
Sr.No.
Particulars Joint Venture Key Managerial Personnel and their
relatives
Enterprises under Signifi cant
Infl uenceBalance as on 31/03/2010
1 Debtors 4,324.29 - 83.56 (5,348.59) (-) (138.40)
2 Security Deposit Against Rental Property - - 3,326.07 (-) (-) (3,326.07)
3 Advance Against Property - - - (-) (-) (6,500.00)
4 Investment in Joint Venture 635.17 - - (291.03) (-) (-)
5 Loan taken - - 12.99 (-) (-) (128.44)
6 Current Liabilities 1,771.15 152.55 109.79 (1,899.93) (280.71) (2.33)
Figures in ( ) are for previous year.•
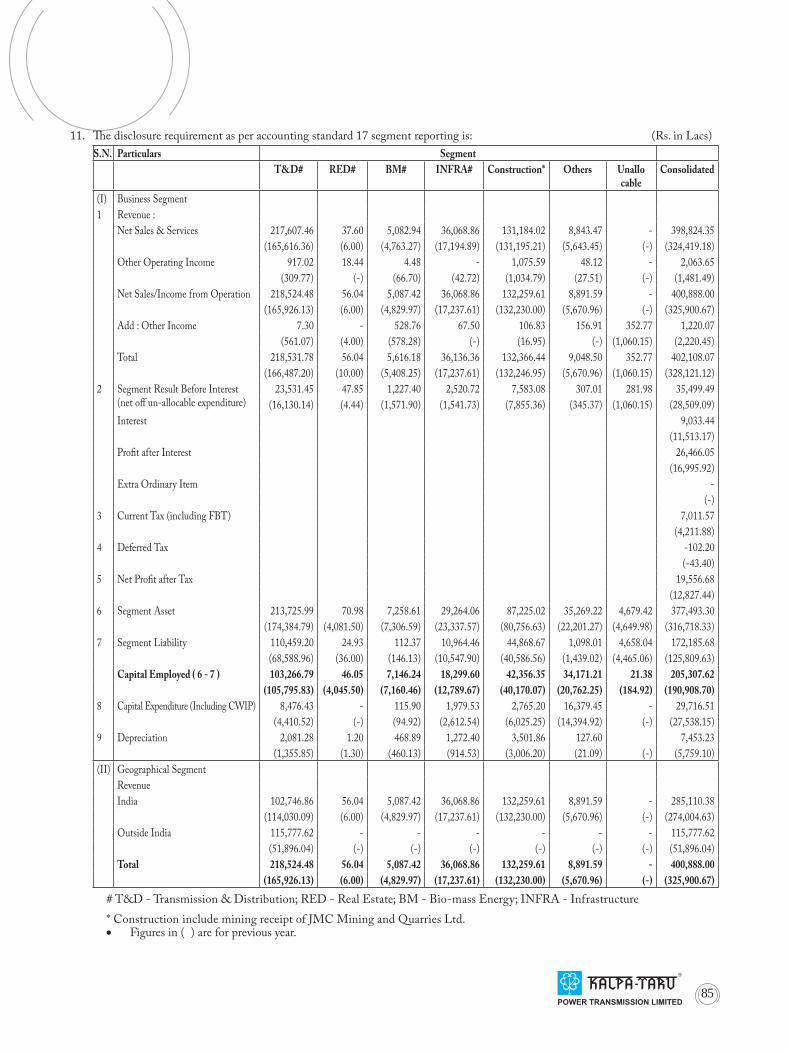
85
11. Th e disclosure requirement as per accounting standard 17 segment reporting is: (Rs. in Lacs)
S.N. Particulars Segment
T&D# RED# BM# INFRA# Construction* Others Unallocable
Consolidated
(I) Business Segment
1 Revenue :
Net Sales & Services 217,607.46 37.60 5,082.94 36,068.86 131,184.02 8,843.47 - 398,824.35
(165,616.36) (6.00) (4,763.27) (17,194.89) (131,195.21) (5,643.45) (-) (324,419.18)
Other Operating Income 917.02 18.44 4.48 - 1,075.59 48.12 - 2,063.65
(309.77) (-) (66.70) (42.72) (1,034.79) (27.51) (-) (1,481.49)
Net Sales/Income from Operation 218,524.48 56.04 5,087.42 36,068.86 132,259.61 8,891.59 - 400,888.00
(165,926.13) (6.00) (4,829.97) (17,237.61) (132,230.00) (5,670.96) (-) (325,900.67)
Add : Other Income 7.30 - 528.76 67.50 106.83 156.91 352.77 1,220.07
(561.07) (4.00) (578.28) (-) (16.95) (-) (1,060.15) (2,220.45)
Total 218,531.78 56.04 5,616.18 36,136.36 132,366.44 9,048.50 352.77 402,108.07
(166,487.20) (10.00) (5,408.25) (17,237.61) (132,246.95) (5,670.96) (1,060.15) (328,121.12)
2 Segment Result Before Interest(net off un-allocable expenditure)
23,531.45 47.85 1,227.40 2,520.72 7,583.08 307.01 281.98 35,499.49
(16,130.14) (4.44) (1,571.90) (1,541.73) (7,855.36) (345.37) (1,060.15) (28,509.09)
Interest 9,033.44
(11,513.17)
Profi t after Interest 26,466.05
(16,995.92)
Extra Ordinary Item -
(-)
3 Current Tax (including FBT) 7,011.57
(4,211.88)
4 Deferred Tax -102.20
(-43.40)
5 Net Profi t after Tax 19,556.68
(12,827.44)
6 Segment Asset 213,725.99 70.98 7,258.61 29,264.06 87,225.02 35,269.22 4,679.42 377,493.30
(174,384.79) (4,081.50) (7,306.59) (23,337.57) (80,756.63) (22,201.27) (4,649.98) (316,718.33)
7 Segment Liability 110,459.20 24.93 112.37 10,964.46 44,868.67 1,098.01 4,658.04 172,185.68
(68,588.96) (36.00) (146.13) (10,547.90) (40,586.56) (1,439.02) (4,465.06) (125,809.63)
Capital Employed ( 6 - 7 ) 103,266.79 46.05 7,146.24 18,299.60 42,356.35 34,171.21 21.38 205,307.62
(105,795.83) (4,045.50) (7,160.46) (12,789.67) (40,170.07) (20,762.25) (184.92) (190,908.70)
8 Capital Expenditure (Including CWIP) 8,476.43 - 115.90 1,979.53 2,765.20 16,379.45 - 29,716.51
(4,410.52) (-) (94.92) (2,612.54) (6,025.25) (14,394.92) (-) (27,538.15)
9 Depreciation 2,081.28 1.20 468.89 1,272.40 3,501.86 127.60 7,453.23
(1,355.85) (1.30) (460.13) (914.53) (3,006.20) (21.09) (-) (5,759.10)
(II) Geographical Segment
Revenue
India 102,746.86 56.04 5,087.42 36,068.86 132,259.61 8,891.59 - 285,110.38
(114,030.09) (6.00) (4,829.97) (17,237.61) (132,230.00) (5,670.96) (-) (274,004.63)
Outside India 115,777.62 - - - - - - 115,777.62
(51,896.04) (-) (-) (-) (-) (-) (-) (51,896.04)
Total 218,524.48 56.04 5,087.42 36,068.86 132,259.61 8,891.59 - 400,888.00
(165,926.13) (6.00) (4,829.97) (17,237.61) (132,230.00) (5,670.96) (-) (325,900.67)
# T&D - Transmission & Distribution; RED - Real Estate; BM - Bio-mass Energy; INFRA - Infrastructure
* Construction include mining receipt of JMC Mining and Quarries Ltd.Figures in ( ) are for previous year.•

86
12. Th e foreign currency exposures of Group, which are not hedged, are as under: (in Lacs)
KWD QAR AED EURO USD GBP JPY
Receivables 156.47 39.71 267.67 - - - -
(-) (39.71) (175.41) (-) (-) (-) (-)
Payables (includes fi nancial Liabilities)
- - - 75.57 386.21 1.01 19,375.63
(-) (-) (-) (13.67) (170.65) (0.21) (-)
Figures in bracket represent previous year numbers.
13. Th e Parent has entered into consortium with JSC Zangas, Russia separately for four gas pipeline projects (i) Vijaipur to Kota, (ii) Panvel to Dabhol (iii) Vijaipur to Dadari & (iv) Dadari-Panipat in Infrastructure Division, sharing contract receipts. Th e contract receipts, common expenses, assets and liabilities have accordingly been accounted for in these accounts as per terms of separate consortium agreement based on unaudited accounts of the entire consortium.
14. Th e Group signifi cant leasing/ licensing arrangements are mainly in respect of residential / offi ce premises and equipments which are in operating lease. Th e aggregate lease rental payable on these leasing arrangements are charged as rent and equipment hire charges in these accounts amounting to Rs. 7,652.95 Lacs (previous year Rs. 2,752.44 Lacs).
Th ese leasing arrangements are for a period not exceeding 5 years and are in most cases renewal by mutual consent, on mutually agreeable terms. Future lease rental payable in respect of assets on lease for not later than 1 year is Rs. 898.88 Lacs (previous year Rs. 512.33 Lacs) and for later than 1 year but not later than 5 years is Rs. 677.89 Lacs (previous year Rs. 858.58 Lacs).
15. Interest income of the group comprises of :
2009-2010(Rs. in Lacs)
2008-2009(Rs. in Lacs)
a) Fixed Deposit with Banks 0.76 217.95b) Margin Money with Banks 48.61 70.26c) Inter-Corporate Deposits 109.90 767.01d) Subsidiary Companies - 477.65e) Others 85.32 72.84f ) Clients accounts - 5.21g) Loan to Related Party 10.50 11.22
Total 255.09 1,622.14
16. Erection and Sub-Contracting expenses of Group comprises of:
2009-2010(Rs. in Lacs)
2008-2009(Rs. in Lacs)
Subcontracting expenses 39,071.87 19,771.09
Construction material and stores and spares consumed 15,707.72 10,253.37
Power and fuel 1,491.20 1,440.05
Freight and Forwarding Expenses 2,051.15 1,513.83
Vehicle and Equipment Hire Charges 8,480.26 2,873.85
Custom Duty, Clearing & Handling Charges 3,453.24 48.71
Others 3,024.28 749.76
Total 73,279.71 36,650.66
17. Th e Capital Work In Progress of Rs. 20,088.23 Lacs consists of the following activities :
2009-2010(Rs. In lacs)
2008-2009(Rs. In lacs)
Transmission Line Tower 344.29 345.06
Software Development - 562.63
Biomass 10.63 10.67
Infrastructure - 81.14
Construction 778.33 203.07
Warehousing Development 1,274.87 6,166.81
Properties for operation leases 17,680.11 3,957.50
Total 20,088.23 11,326.88

87 87
18. Secured non-convertible redeemable debentures of parent :
Sr. No.
Face Value Per Debentures (Rs.)
Date of Allotment AmountRs. Lacs
Interest Redeemable at face value
1 1,00,000 December 26, 2008 8000 12.50% p.a.payable annually
At the end of 5th 6th & 7th year equally from date of allotment
2 10,00,000 July 15, 2009 7000 9.55% p.a.payable semi annually
25% each at the end of 3rd and 4th year and 50% at the end of 5th year from the date of allotment
Security : Secured by fi rst pari passu charge with consortium bankers and other debenture holders on fi xed assets of Transmission & Distribution and Infrastructure Division (including land and building) exclusive of assets charged to FI and Bank, for which NOC is given. Security against debentures issued of Rs. 7,000 lacs is yet to be created.
19. Overdraft and bill discounting facilities availed by parent from banks outside India against assignment of project specifi c receivables proceeds.
20. Th e Management is of the opinion that as on the Balance Sheet date, there are no indications of a material impairment in the value of fi xed assets. Hence, the need to provide for an impairment loss does not arise.
21. On May 6, 2010, the parent has allotted 4,192,114 equity shares of Rs. 10 each at a price of Rs. 1,074.20 per equity share aggregating to Rs. 45,031.69 lacs through Qualifi ed Institutional Placement. Th ese shares are, in all respects, in pari passu with existing issued shares and are eligible or dividend for the year and therefore due provision thereof has been made in the fi nancial statement as part of proposed dividend.
22. Th e Finance Act (2), 2009 has amended section 80-IA (4) of the Income Tax Act, 1961 by substituting an explanation to section 80-IA with retrospective eff ect from 01-04-2000. On the basis of the legal opinion of the experts, the Company has continued to claim deduction under section 80-IA (4) of the Act on eligible projects and consequently the company considers it appropriate not to create a liability by making provision for Income Tax (Net of Deferred Tax)
However, an amount of Income tax (Net of Deferred Tax) of Rs. 419.18 Lacs for the current year and of Rs. 365.85 Lacs for the earlier years since FY 2006-07 ( both including the amount of tax applicable on the share of profi t of Joint Venture Business claiming such deduction) has been disclosed as a contingent liability in Note No. 3 to these Accounts.
23. Figures pertaining to the group companies have been re-classifi ed wherever necessary to bring them in line with the parent’s fi nancial statements.
24. Previous year fi gures have been regrouped / rearranged wherever considered necessary. Figures for the previous year which are not material for subsidiary named Adeshwar Infrabuild Limited, Saicharan Properties Limited, Kalpataru Power Transmission USA Inc., are not included as the same became the subsidiaries in the current year. Signatures to Schedules ‘A’ to ‘T’
In term of report attached For and on behalf of the Board
For Kishan M. Mehta & Co., For Deloitte Haskins & Sells, Pankaj Sachdeva Manish Mohnot
Chartered Accountants Chartered Accountants Managing Director Executive Director
(Kishan M. Mehta) (Gaurav J. Shah) Kamal Jain Bajrang Ramdharani
Partner Partner President & CFO Company Secretary
(M. No. 13707) (M. No. 35701)
AHMEDABAD: May 29, 2010 MUMBAI: May 28, 2010

8888
INFLOW/(OUTFLOW
2009-2010Rs. In Lacs2008-2009
A. CASH FLOW FROM OPERATING ACTIVITIES:Net profi t before taxation, and extraordinary items 26,466.03 16,995.92 Adjustments for :
Depreciation 7,453.24 5,759.10 Interest Paid 10,919.65 9,191.99 Dividend Received (2.82) (76.67) Interest Received (255.09) (1,622.14)
Amortisation of Preliminary and Share Issue Expenses 2.00 7.53 Provision for Diminution in Investment (1.34) 1.30
(Profi t)/Loss on sale of assets (7.41) (8.34) Foreign Currency Translation Diff erence 621.63 (186.82) Unrealised Foreign Exchange (gain) / Loss (net) (633.05) 619.27 Gratuity Liability - (1.75) Transfer of Exchange Rate Diff erence - 5.33 Goodwill on Consolidation (2.02) - OPERATING PROFIT BEFORE WORKING CAPITAL CHANGES 44,560.81 30,684.71 Adjustment for: Trade and other Receivables (38,006.05) (66,642.95) Inventories (2,150.28) (5,921.82) Margin Deposits with Banks 2.23 332.11 Trade Payables 50,299.07 26,823.89 CASH GENERATED FROM / (USED IN) OPERATIONS 54,705.79 (14,724.06)Income Tax Paid (8,891.63) (5,893.94)Prior Year’s Adjustment 49.87 (28.16)CASH FLOW BEFORE EXTRAORDINARY ITEMS 45,864.03 (20,646.16)Extraordinary Items - - NET CASH FLOW FROM / (USED IN) OPERATING ACTIVITIES (A) 45,864.03 (20,646.16)
B. CASH FLOW FROM INVESTING ACTIVITIES:Purchase of fi xed assets (30,389.92) (26,913.87)Sale of fi xed assets 179.56 287.73 Investments in Shares 23.08 - Share of Profi t in Joint Venture (Net) (344.15) 3,506.65 Interest Received on Loans & Deposits 255.09 1,622.14 Dividend Received 2.82 76.67 Deposits with Banks 396.01 5,464.82 Preliminary & Pre-Operative Expenses 82.12 115.21 Adjustment of appropriation - 158.85 Lien with Banks 41.39 (389.26)Share issue expenses (32.97) - CASH FROM / (USED IN) INVESTING ACTIVITIES (B) (29,786.96) (16,071.07)
C. CASH FLOW FROM FINANCING ACTIVITIES:Change in Minority Interest 1,284.42 (482.78)Proceeds from Issuance of Non Convertible Debentures 7,000.00 8,000.00 Proceeds from Term Borrowings 6,207.27 12,325.64 Repayment of Term Loan (4,984.26) (2,298.82)Working Capital Finance (4,010.28) 15,117.40 Unsecured Loans (8,332.45) 16,048.32 Interest Paid (10,693.16) (9,226.81)Dividend Paid (1,987.50) (1,987.50)Corporate Dividend Tax (379.18) (391.27)CASH FROM / (USED IN) FINANCING ACTIVITIES (C) (15,895.14) 37,104.17
D NET INCREASE (DECREASE) IN CASH AND CASH EQUIVALENT (A+B+C) 181.93 386.94 E. Opening Cash and Cash Equivalent 4,633.02 4,246.09 F. Closing Cash and Cash Equivalent 4,814.95 4,633.02
Notes: AS AT 31/03/2010Rs. In Lacs
AS AT 31/03/2009Rs. In Lacs
Cash & Cash EquivalentsCash & Bank Balance (Schedule I) 5,567.52 5,825.22 (Includes margin money, deposit and lien)Margin Money with Banks (18.15) (20.38)Deposits with Banks (386.56) (782.56)Lien with Banks (347.87) (389.26)
4,814.95 4,633.02
CONSOLIDATED CASH FLOW STATEMENT FORTHE YEAR ENDED 31ST MARCH, 2010
In terms of our report attached For and on behalf of the BoardFor Kishan M. Mehta & Co., For Deloitte Haskins & Sells, Pankaj Sachdeva Manish MohnotChartered Accountants Chartered Accountants Managing Director Executive Director
(Kishan M. Mehta) (Gaurav J. Shah) Kamal Jain Bajrang RamdharaniPartner Partner President & CFO Company Secretary(M. No. 13707) (M. No. 35701)
AHMEDABAD: May 29, 2010 MUMBAI: May 28, 2010

89 89
NOTES

9090

C C MM YY K
C C MM YY K C C MM YY K
Prin
ted
by T
aco
Vis
ions
Pvt
. Ltd
.w
ww
.taco
visi
ons.
com