Embed Size (px)
Citation preview

ONLINE APPENDIX
References for studies included in this analysis (see end of document for list)
Phase 2: DFI11565 (1), CL-1003 (2). DFI12361 (3). DFI11566 (4).
Phase 3: LONG TERM (5), HIGH FH (6), FH I and FH II (7), COMBO I (8), COMBO
II (9), OPTIONS I (10), OPTIONS II (11), MONO (12), ALTERNATIVE (13).
Safety monitoring of LDL-C <25 mg/dL
A dedicated data monitoring committee member and independent physician were
provided access to unblinded low-density lipoprotein cholesterol (LDL-C) data to
monitor patients who achieved 2 consecutive calculated LDL-C values <25 mg/dL. At
their discretion, an alert was sent to the site, with sham alerts also used to preserve
the blind. The investigator would call the patient about occurrences of adverse
events and decide whether the patient should be requested to rapidly have an
unscheduled site visit, or if assessment could be done at the next scheduled visit. At
the site visit, the investigator assessed whether the patient needed additional work-
up, should see a specialist and whether the study treatment should be temporarily or
permanently discontinued.
Hemolytic anemia
Hemolytic anemia was assessed with specific algorithms in most studies. This
algorithm included review of laboratory parameters such as reticulocyte count,
lactate dehydrogenase, direct and indirect bilirubin, and haptoglobin. If needed and
based on special circumstances, further assessments with a peripheral blood smear
and Coombs test by a hematologist was requested.
Page 1

Propensity analysis
Baseline characteristics of patients who achieved at least 2 consecutive LDL-C <25
mg/dL and those who did not are different between these 2 post-randomization
subgroups. As an example, patients with 2 consecutive LDL-C <25 mg/dL are more
likely to be men, >65 years of age, with prior history of coronary heart disease (CHD)
or CHD risk equivalents, diabetic, with lower baseline LDL-C, lipoprotein (a) [Lp(a)],
high-density lipoprotein cholesterol (HDL-C), and with higher triglycerides. Those
differences in baseline characteristics could have an impact on the interpretation of
the comparison of the safety profile between the LDL-C subgroups (i.e. subgroup
with at least 2 consecutive LDL-C <25 mg/dL and the subgroup who did not achieve
2 consecutive LDL-C <25 mg/dL).
In this context, in order to limit the bias associated with comparison of post-
randomization subgroups, additional analyses based on propensity score adjustment
are provided (14). Of note, this methodology has also been used in the recently
published analysis on the safety profile of subjects from the JUPITER study who
achieved LDL-C levels <30 mg/dL with rosuvastatin 20 mg daily (15).
The first step of this method consists of the identification of prognostic factors for
achieving two consecutive LDL-C <25 mg/dL. The following factors were assessed:
• Age (years, continuous)
• Gender (reference: male)
• Race (White / Black or African American/Asian/Other; reference: White)
• Ethnicity (reference: not Hispanic)
• Body mass index (kg/m2, continuous)
• Weight (kg, continuous)
Page 2

• Baseline LDL-C (mg/dL, continuous)
• Baseline fasting triglycerides (mg/dL, continuous)
• Baseline Lp(a) (mg/dL, continuous)
• Baseline HDL-C (mg/dL, continuous)
• Baseline glomerular filtration rate (mL/min/1.73m2, continuous)
• Baseline systolic blood pressure (mmHg, continuous)
• Baseline diastolic blood pressure (mmHg, continuous)
• Background statin dose (no statin/low dose/high dose; reference: no background statin)
• Lipid-lowering therapy other than statin (reference: no)
• Prior history of myocardial infarction/stroke reported in the medical history (reference: no)
• Diabetes mellitus, type 1 or type 2 reported in the medical history (reference: no)
• Moderate chronic kidney disease (reference: no)
• Hypertension (reference: no)
• Baseline glycated hemoglobin (%, continuous)
• Starting dose of alirocumab (75 mg or 150 mg depending on the study;
reference: 75 mg)
The analysis was conducted on the global pool of Phase 3 studies as some factors,
such as pre-listed items for medical history, were not available in Phase 2 studies.
For each risk factor listed above, a univariate logistic regression was run. All factors
significant at the 0.15 level in the univariate analysis were included in a multivariate
logistic regression. The significant prognostic factors (p < 0.15) for achieving 2
consecutive LDL-C <25 mg/dL are described in Supplementary Table 2. As
expected, baseline LDL-C and the alirocumab starting dose are significant factors for
achieving 2 consecutive LDL-C <25 mg/dL values.
Page 3

The propensity scores (i.e. predicted probabilities to achieve 2 consecutive LDL-
C <25 mg/dL) were derived for each patient from this final multivariate model and
were divided into 5 quintiles. The second step of the propensity score analysis
consist of the comparison of the 2 post-randomization subgroups (<25 mg/dL, ≥25
mg/dL), after adjustment on the propensity score (e.g. stratification) in order to limit
the bias associated with this comparison and to adjust on potential confounding
factors.
For each grouping of interest (neurological, neurocognitive, ophthalmological,
diabetes), the time to the first TEAE is compared for patients with ≥2 consecutive
LDL-C <25 mg/dL versus ≥25 mg/dL, within the alirocumab group in the global pool
of Phase 3 studies, using a Cox model, including the covariate for 2 consecutive
LDL-C <25 mg/dL (Y/N) and stratified based on propensity score (quintile). Adjusted
hazard ratio (and 95% confidence interval) from this model are provided.
Page 4

Supplemental Table 1. Alirocumab Dose at Time of First LDL-C Value <25 or
<15 mg/dL (Safety Population; Phase 2 and 3 Studies)
Values are % (n) Alirocumab (n = 3,340)
Patients with 2 consecutive LDL-C <25 mg/dL 25.1 (839)
Alirocumab dose at time of first LDL-C value <25 mg/dL
75 mg Q2W (studies with dose increase) 23.7 (199/839)
75 mg Q2W (studies without dose increase)* 0.4 (3/839)
150 mg Q2W (studies with dose increase) 3.9 (33/839)
150 mg Q2W (studies without dose increase) 72.0 (604/839)
Patients with 2 consecutive LDL-C <15 mg/dL 9.4 (314)
Alirocumab dose at time of first LDL-C value <15 mg/dL
75 mg Q2W (studies with dose increase) 18.2 (57/314)
75 mg Q2W (studies without dose increase)* 0
150 mg Q2W (studies with dose increase) 4.1 (13/314)
150 mg Q2W (studies without dose increase) 77.7 (244/314)
*One study (Phase 2 study in Japanese patients, DFI12361) included an alirocumab 75 mg Q2W
treatment arm without the possibility of dose increase.
Page 5

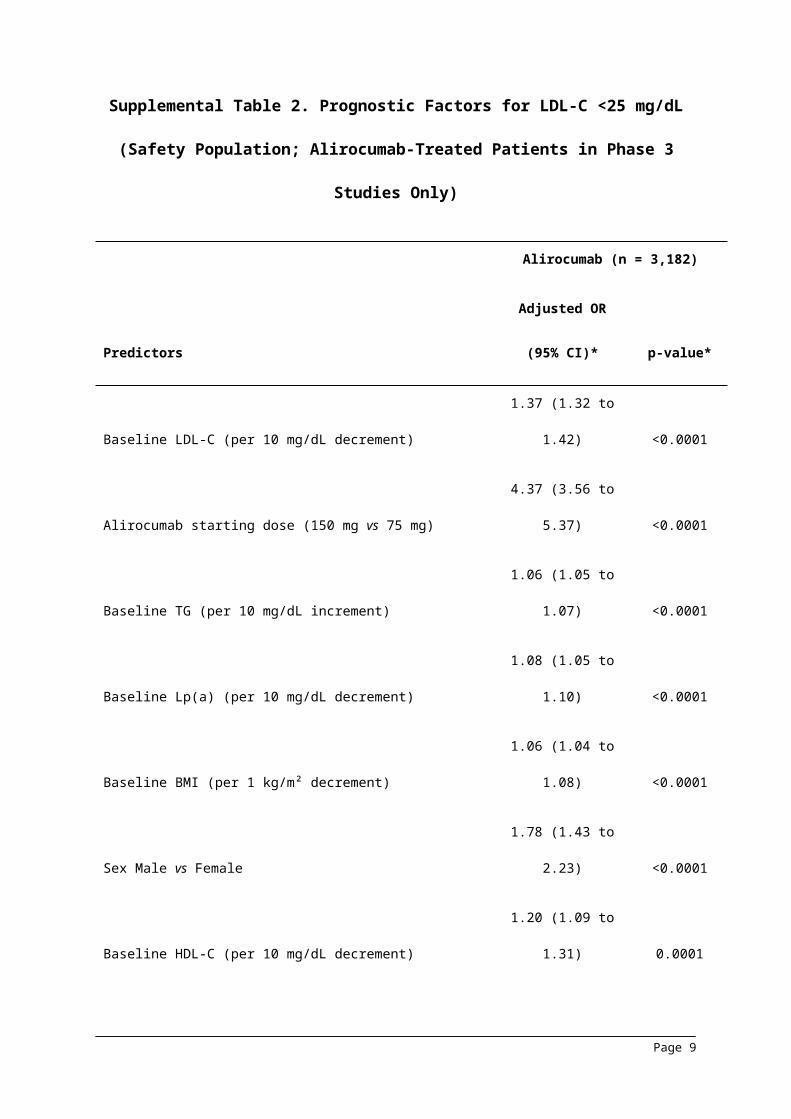
Supplemental Table 2. Prognostic Factors for LDL-C <25 mg/dL (Safety
Population; Alirocumab-Treated Patients in Phase 3 Studies Only)
Alirocumab (n = 3,182)
Predictors
Adjusted OR
(95% CI)* p-value*
Baseline LDL-C (per 10 mg/dL decrement) 1.37 (1.32 to 1.42) <0.0001
Alirocumab starting dose (150 mg vs 75 mg) 4.37 (3.56 to 5.37) <0.0001
Baseline TG (per 10 mg/dL increment) 1.06 (1.05 to 1.07) <0.0001
Baseline Lp(a) (per 10 mg/dL decrement) 1.08 (1.05 to 1.10) <0.0001
Baseline BMI (per 1 kg/m² decrement) 1.06 (1.04 to 1.08) <0.0001
Sex Male vs Female 1.78 (1.43 to 2.23) <0.0001
Baseline HDL-C (per 10 mg/dL decrement) 1.20 (1.09 to 1.31) 0.0001
Baseline age (per 5 years increment) 1.08 (1.03 to 1.13) 0.0018
Stroke or MI (Yes vs No) 1.36 (1.12 to 1.65) 0.0022
Placebo-controlled studies: phase 3 (LONG TERM, FH I, FH II, HIGH FH, COMBO I). Ezetimibe-
controlled studies: phase 3 (COMBO II, MONO, OPTIONS I, OPTIONS II, ALTERNATIVE)
Table sorted by increasing p-value.
*OR, 95% CI and p-values are adjusted for all listed prognostic factors. Variables were first selected if
they showed p < 0.15 in univariate analyses and then a multivariate logistic regression was performed
using a stepwise selection at the 0.15 level for entry and stay. The individual propensity scores for
achieving 2 consecutive LDL-C <25 mg/dL are the probabilities predicted by the final multivariate
logistic regression.
CI = confidence interval; MI = myocardial infarction; OR = odds ratio.
Page 6

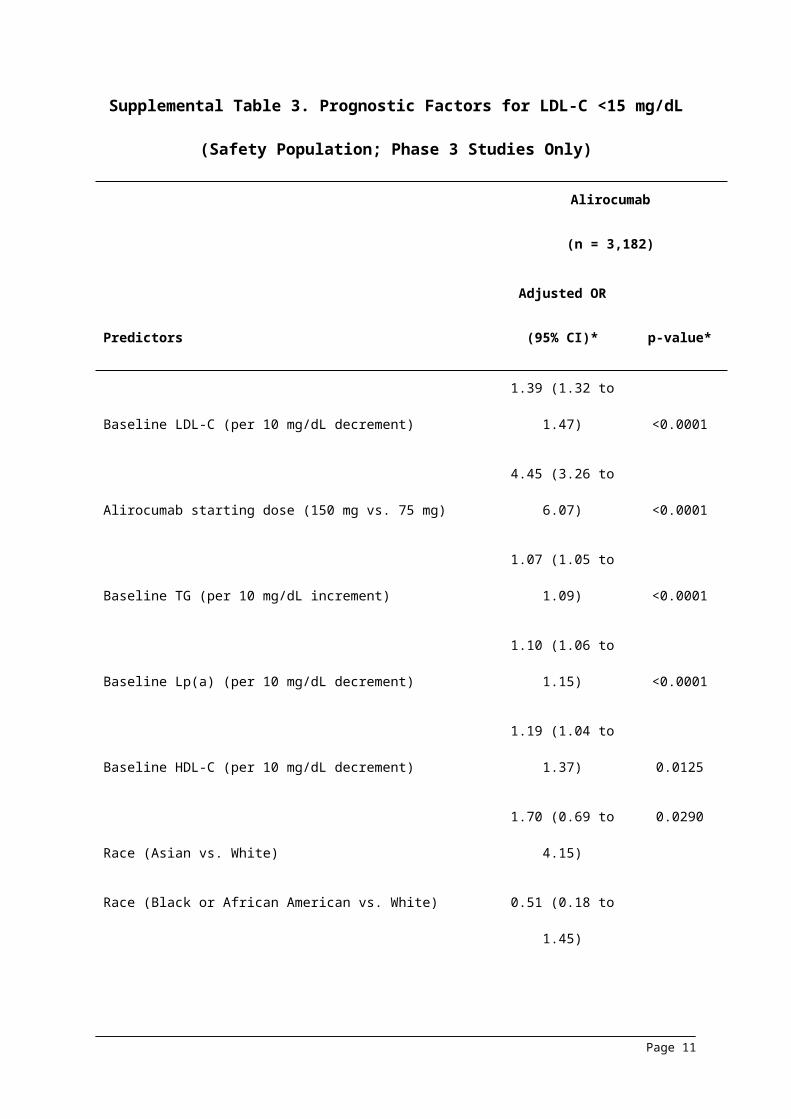
Supplemental Table 3. Prognostic Factors for LDL-C <15 mg/dL (Safety
Population; Phase 3 Studies Only)
Alirocumab
(n = 3,182)
Predictors
Adjusted OR
(95% CI)* p-value*
Baseline LDL-C (per 10 mg/dL decrement) 1.39 (1.32 to 1.47) <0.0001
Alirocumab starting dose (150 mg vs. 75 mg) 4.45 (3.26 to 6.07) <0.0001
Baseline TG (per 10 mg/dL increment) 1.07 (1.05 to 1.09) <0.0001
Baseline Lp(a) (per 10 mg/dL decrement) 1.10 (1.06 to 1.15) <0.0001
Baseline HDL-C (per 10 mg/dL decrement) 1.19 (1.04 to 1.37) 0.0125
Race (Asian vs. White) 1.70 (0.69 to 4.15)
0.0290Race (Black or African American vs. White) 0.51 (0.18 to 1.45)
Race (Other vs. White) 2.30 (1.18 to 4.50)
Baseline age (per 5 years increment) 1.07 (1.00 to 1.15) 0.0419
Sex Male vs Female 1.38 (1.00 to 1.91) 0.0471
Stroke or MI (Yes vs. No) 1.29 (0.98 to 1.69) 0.0699
LLT (Yes vs. No) 1.26 (0.93 to 1.70) 0.1420
Placebo-controlled studies: Phase 3 (LONG TERM, FH I, FH II, HIGH FH, COMBO I)
Ezetimibe-controlled studies: Phase 3 (COMBO II, MONO, OPTIONS I, OPTIONS II, ALTERNATIVE)
Table sorted by increasing p-value.
Page 7

*OR, 95% CI and p-values are adjusted for all listed prognostic factors. Variables were first selected if
they showed p<0.15 in univariate analyses and then a multivariate logistic regression was performed
using a stepwise selection at the 0.15 level for entry and stay. The individual propensity scores for
achieving two consecutive LDL-C <15 mg/dL are the probabilities predicted by the final multivariate
logistic regression.
CI = confidence interval; LDL-C = low-density lipoprotein cholesterol; LLT = lipid-lowering therapy; MI
= myocardial infarction; OR = odds ratio.
Page 8
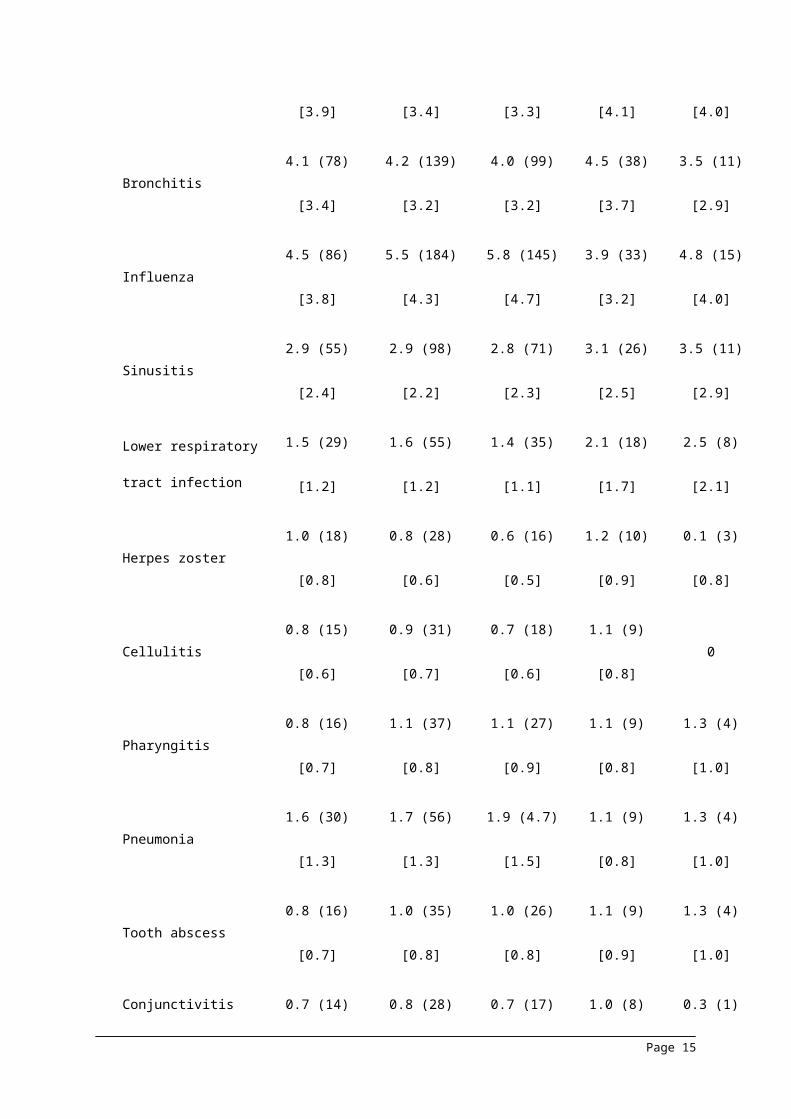
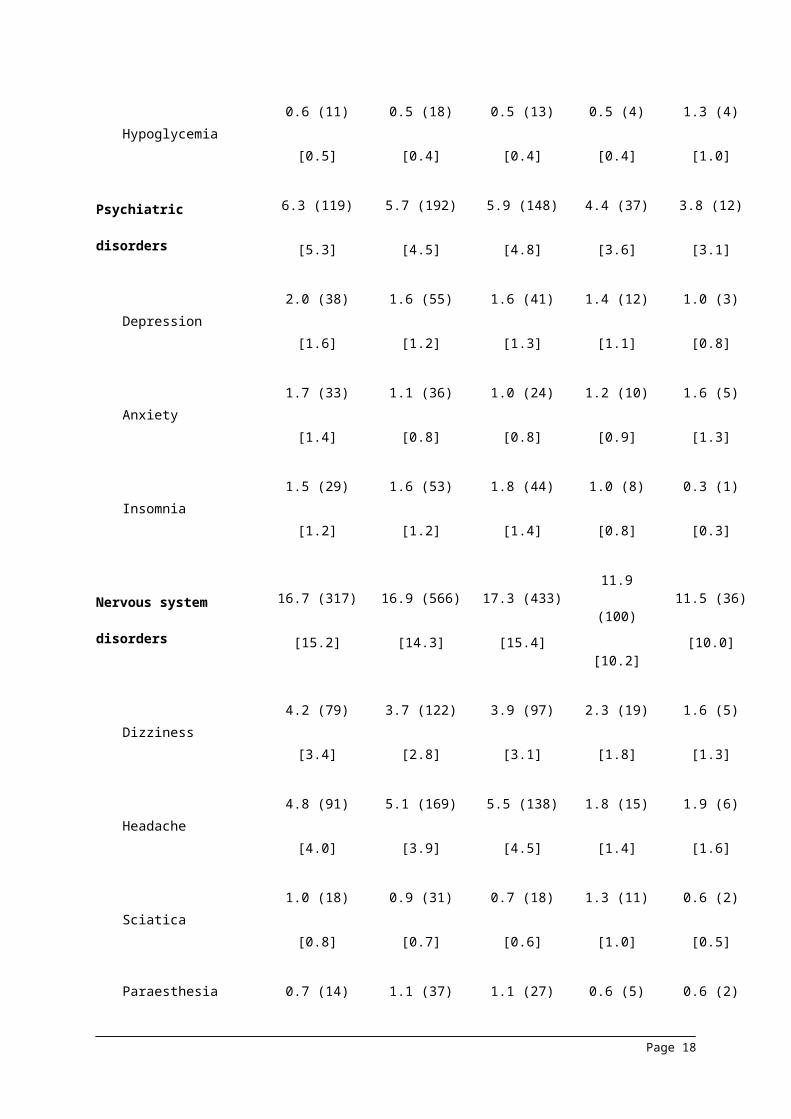
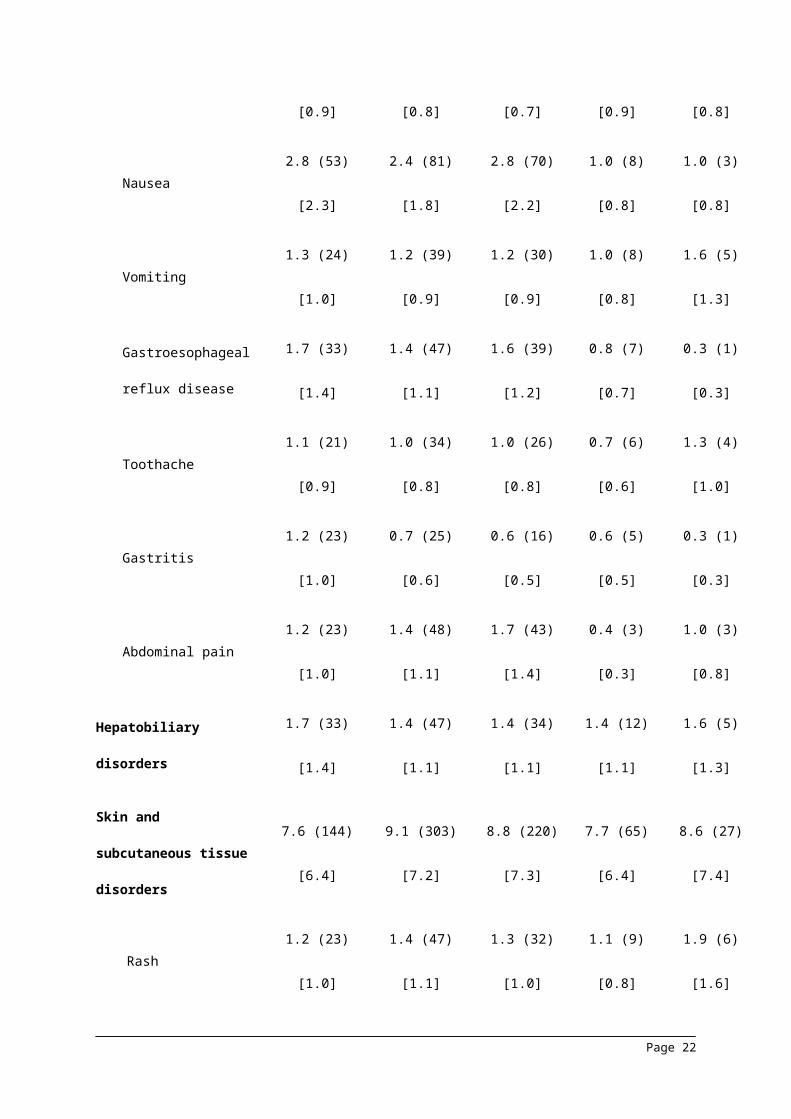
Supplemental Table 4. Percentage Incidence of TEAEs Occurring in ≥1%
Patients (Safety Population; Phase 2 and 3 Studies)
Alirocumab
Values are % (n)
[rate per 100 patient-
years‡]
Pooled
control
(n = 1,894)
Overall
alirocumab
(n = 3,340)
LDL-C
≥25 mg/dL*
(n = 2,501)
LDL-C
<25 mg/dL†
(n = 839)
LDL-C
<15 mg/dL†
(n = 314)
TEAEs with ≥1%
incidence in any group
System organ class
Preferred term
Infections and
infestations
40.0 (758)
[45.6]
41.5 (1387)
[44.5]
40.4 (1010)
[45.2]
37.1 (311)
[39.1]
37.6 (118)
[41.4]
Nasopharyngitis9.9 (188)
[8.6]
10.6 (353)
[8.5]
9.9 (248)
[8.4]
9.3 (78)
[7.8]
10.5 (33)
[9.1]
Upper respiratory tract
infection
7.2 (137)
[6.1]
6.8 (227)
[5.3]
6.7 (168)
[5.5]
5.1 (43)
[4.2]
6.1 (19)
[5.1]
Urinary tract infection4.8 (90)
[3.9]
4.5 (150)
[3.4]
4.0 (101)
[3.3]
5.0 (42)
[4.1]
4.8 (15)
[4.0]
Bronchitis4.1 (78)
[3.4]
4.2 (139)
[3.2]
4.0 (99)
[3.2]
4.5 (38)
[3.7]
3.5 (11)
[2.9]
Influenza4.5 (86)
[3.8]
5.5 (184)
[4.3]
5.8 (145)
[4.7]
3.9 (33)
[3.2]
4.8 (15)
[4.0]
Page 9

Sinusitis2.9 (55)
[2.4]
2.9 (98)
[2.2]
2.8 (71)
[2.3]
3.1 (26)
[2.5]
3.5 (11)
[2.9]
Lower respiratory tract
infection
1.5 (29)
[1.2]
1.6 (55)
[1.2]
1.4 (35)
[1.1]
2.1 (18)
[1.7]
2.5 (8)
[2.1]
Herpes zoster1.0 (18)
[0.8]
0.8 (28)
[0.6]
0.6 (16)
[0.5]
1.2 (10)
[0.9]
0.1 (3)
[0.8]
Cellulitis0.8 (15)
[0.6]
0.9 (31)
[0.7]
0.7 (18)
[0.6]
1.1 (9)
[0.8]0
Pharyngitis0.8 (16)
[0.7]
1.1 (37)
[0.8]
1.1 (27)
[0.9]
1.1 (9)
[0.8]
1.3 (4)
[1.0]
Pneumonia1.6 (30)
[1.3]
1.7 (56)
[1.3]
1.9 (4.7)
[1.5]
1.1 (9)
[0.8]
1.3 (4)
[1.0]
Tooth abscess0.8 (16)
[0.7]
1.0 (35)
[0.8]
1.0 (26)
[0.8]
1.1 (9)
[0.9]
1.3 (4)
[1.0]
Conjunctivitis0.7 (14)
[0.6]
0.8 (28)
[0.6]
0.7 (17)
[0.5]
1.0 (8)
[0.8]
0.3 (1)
[0.3]
Gastroenteritis2.6 (50)
[2.2]
2.0 (66)
[1.5]
2.2 (56)
[1.8]
0.8 (7)
[0.7]
1.3 (4)
[1.0]
Rhinitis1.2 (22)
[0.9]
0.9 (31)
[0.7]
0.7 (17)
[0.5]
0.8 (7)
[0.7]
0.6 (2)
[0.5]
Cystitis 1.1 (21) 0.8 (27) 0.8 (20) 0.7 (6) 0.6 (2)
Page 10
[0.9] [0.6] [0.6] [0.6] [0.5]
Gastroenteritis viral0.8 (15)
[0.6]
1.0 (35)
[0.8]
1.0 (26)
[0.8]
0.5 (4)
[0.4]
1.0 (3)
[0.8]
Neoplasms benign,
malignant, and
unspecified (including
cysts and polyps)
3.3 (63)
[2.7]
3.2 (108)
[2.5]
3.0 (75)
[2.4]
3.5 (29)
[2.8]
3.5 (11)
[2.9]
Basal cell carcinoma0.5 (9)
[0.4]
0.4 (15)
[0.3]
0.3 (7)
[0.2]
0.8 (7)
[0.7]
1.0 (3)
[0.8]
Blood and lymphatic
system disorders
3.1 (59)
[2.5]
2.6 (88)
[2.0]
2.6 (64)
[2.0]
2.1 (18)
[1.7]
1.6 (5)
[1.3]
Anemia0.9 (17)
[0.7]
1.0 (33)
[0.7]
1.0 (25)
[0.8]
0.6 (5)
[0.5]
0.6 (2)
[0.5]
Immune system
disorders
0.9 (17)
[0.7]
1.4 (46)
[1.0]
1.4 (36)
[1.1]
0.8 (7)
[0.7]
1.0 (3)
[0.8]
Endocrine disorders0.7 (13)
[0.6]
0.8 (28)
[0.6]
0.7 (18)
[0.6]
1.2 (10)
[0.9]
1.9 (6)
[1.6]
Hypothyroidism0.4 (8)
[0.3]
0.3 (10)
[0.2]
0.2 (6)
[0.2]
0.5 (4)
[0.4]
1.0 (3)
[0.8]
Metabolism and nutrition
disorders
7.6 (143)
[6.3]
8.2 (274)
[6.5]
7.6 (189)
[6.2]
8.3 (70)
[6.9]
8.9 (28)
[7.6]
Type 2 diabetes
mellitus
1.3 (25) 1.4 (46) 1.1 (28) 1.9 (16) 1.3 (4)
Page 11

[1.1] [1.0] [0.9] [1.5] [1.0]
Diabetes mellitus1.1 (21)
[0.9]
1.3 (45)
[1.0]
1.2 (30)
[0.9]
1.8 (15)
[1.4]
2.5 (8)
[2.1]
Gout1.0 (19)
[0.8]
1.1 (38)
[0.9]
1.0 (25)
[0.8]
1.2 (10)
[0.9]
0.6 (2)
[0.5]
Diabetes mellitus
inadequate control
0.6 (11)
[0.5]
0.4 (15)
[0.3]
0.3 (7)
[0.2]
1.0 (8)
[0.8]
0.6 (2)
[0.5]
Hyperuricemia0.2 (4)
[0.2]
0.3 (11)
[0.2]
0.2 (5)
[0.2]
0.6 (5)
[0.5]
1.0 (3)
[0.8]
Hypoglycemia0.6 (11)
[0.5]
0.5 (18)
[0.4]
0.5 (13)
[0.4]
0.5 (4)
[0.4]
1.3 (4)
[1.0]
Psychiatric disorders6.3 (119)
[5.3]
5.7 (192)
[4.5]
5.9 (148)
[4.8]
4.4 (37)
[3.6]
3.8 (12)
[3.1]
Depression2.0 (38)
[1.6]
1.6 (55)
[1.2]
1.6 (41)
[1.3]
1.4 (12)
[1.1]
1.0 (3)
[0.8]
Anxiety1.7 (33)
[1.4]
1.1 (36)
[0.8]
1.0 (24)
[0.8]
1.2 (10)
[0.9]
1.6 (5)
[1.3]
Insomnia1.5 (29)
[1.2]
1.6 (53)
[1.2]
1.8 (44)
[1.4]
1.0 (8)
[0.8]
0.3 (1)
[0.3]
Nervous system
disorders
16.7 (317)
[15.2]
16.9 (566)
[14.3]
17.3 (433)
[15.4]
11.9 (100)
[10.2]
11.5 (36)
[10.0]
Dizziness 4.2 (79) 3.7 (122) 3.9 (97) 2.3 (19) 1.6 (5)
Page 12

[3.4] [2.8] [3.1][1.8]
[1.3]
Headache4.8 (91)
[4.0]
5.1 (169)
[3.9]
5.5 (138)
[4.5]
1.8 (15)
[1.4]
1.9 (6)
[1.6]
Sciatica1.0 (18)
[0.8]
0.9 (31)
[0.7]
0.7 (18)
[0.6]
1.3 (11)
[1.0]
0.6 (2)
[0.5]
Paraesthesia0.7 (14)
[0.6]
1.1 (37)
[0.8]
1.1 (27)
[0.9]
0.6 (5)
[0.5]
0.6 (2)
[0.5]
Syncope1.2 (22)
[0.9]
0.8 (26)
[0.6]
0.8 (21)
[0.7]
0.6 (5)
[0.5]
0.6 (2)
[0.5]
Hypoaesthesia0.8 (15)
[0.6]
0.8 (26)
[0.6]
1.0 (24)
[0.8]
0.2 (2)
[0.2]0
Eye disorders4.4 (83)
[3.6]
5.3 (176)
[4.1]
4.8 (119)
[3.9]
5.6 (47)
[4.6]
7.0 (22)
[5.9]
Cataract1.0 (19)
[0.8]
1.0 (35)
[0.8]
0.7 (17)
[0.5]
1.9 (16)
[1.5]
2.5 (8)
[2.1]
Vision blurred0.4 (7)
[0.3]
0.5 (16)
[0.4]
0.4 (10)
[0.3]
0.7 (6)
[0.6]
1.0 (3)
[0.8]
Ear and labyrinth
disorders
3.5 (66)
[2.9]
2.1 (69)
[1.6]
2.1 (52)
[1.6]
1.9 (16)
[1.5]
1.6 (5)
[1.3]
Vertigo 1.7 (32) 1.0 (32) 1.0 (24) 1.0 (8) 1.0 (3)
Page 13

[1.4] [0.7] [0.8] [0.8] [0.8]
Cardiac disorders9.8 (185)
[8.3]
9.9 (330)
[7.8]
9.5 (238)
[7.9]
9.3 (78)
[7.7]
7.0 (22)
[5.8]
Angina pectoris2.0 (38)
[1.6]
1.9 (62)
[1.4]
1.7 (43)
[1.4]
1.7 (14)
[1.3]
1.6 (5)
[1.3]
Atrial fibrillation1.7 (32)
[1.4]
1.4 (46)
[1.0]
1.3 (32)
[1.0]
1.5 (13)
[1.2]
1.3 (4)
[1.0]
Angina unstable1.0 (19)
[0.8]
1.5 (50)
[1.1]
1.4 (34)
[1.1]
1.3 (11)
[1.0]
1.6 (5)
[1.3]
Vascular disorders8.3 (158)
[7.1]
7.6 (253)
[5.9]
7.7 (193)
[6.4]
5.1 (43)
[4.1]
4.8 (15)
[3.9]
Hypertension4.0 (76)
[3.3]
3.9 (130)
[3.0]
4.1 (102)
[3.3]
2.4 (20)
[1.9]
2.9 (9)
[2.3]
Hypotension0.7 (13)
[0.6]
0.9 (29)
[0.7]
0.8 (20)
[0.6]
1.0 (8)
[0.8]
0.6 (2)
[0.5]
Respiratory, thoracic, and
mediastinal disorders
10.6 (201)
[9.1]
10.5 (352)
[8.5]
10.3 (258)
[8.7]
8.6 (72)
[7.1]
10.5 (33)
[9.0]
Cough2.3 (44)
[1.9]
2.6 (88)
[2.0]
2.5 (62)
[2.0]
2.0 (17)
[1.6]
2.5 (8)
[2.1]
Chronic obstructive
pulmonary disease
1.1 (21)
[0.9]
1.0 (35)
[0.8]
1.0 (25)
[0.8]
1.2 (10)
[0.9]
1.3 (4)
[1.0]
Asthma 0.6 (12) 0.7 (24) 0.7 (17) 0.7 (6) 1.0 (3)
Page 14
[0.5] [0.5] [0.5][0.6]
[0.8]
Epistaxis1.1 (21)
[0.9]
0.8 (28)
[0.6]
0.8 (21)
[0.7]
0.6 (5)
[0.5]
0.6 (2)
[0.5]
Dyspnea1.8 (35)
[1.5]
1.0 (33)
[0.7]
1.1 (27)
[0.9]
0.5 (4)
[0.4]
0.3 (1)
[0.3]
Nasal congestion0.3 (5)
[0.2]
0.4 (14)
[0.3]
0.3 (8)
[0.3]
0.5 (4)
[0.4]
1.0 (3)
[0.8]
Oropharyngeal pain0.6 (12)
[0.5]
1.1 (36)
[0.8]
1.2 (29)
[0.9]
0.5 (4)
[0.4]
0.3 (1)
[0.3]
Gastrointestinal
disorders
18.9 (358)
[17.3]
19.5 (650)
[16.7]
19.0 (476)
[17.2]
15.6 (131)
[13.7]
13.4 (42)
[11.9]
Diarrhea4.3 (82)
[3.6]
4.7 (158)
[3.6]
4.5 (112)
[3.6]
3.8 (32)
[3.1]
2.5 (8)
[2.1]
Constipation1.7 (32)
[1.4]
2.0 (66)
[1.5]
1.9 (48)
[1.5]
1.4 (12)
[1.1]
1.6 (5)
[1.3]
Dyspepsia1.3 (24)
[1.0]
1.0 (35)
[0.8]
0.8 (21)
[0.7]
1.4 (12)
[1.1]
1.3 (4)
[1.0]
Abdominal pain upper1.2 (22)
[0.9]
1.0 (35)
[0.8]
0.9 (23)
[0.7]
1.2 (10)
[0.9]
1.0 (3)
[0.8]
Nausea2.8 (53)
[2.3]
2.4 (81)
[1.8]
2.8 (70)
[2.2]
1.0 (8)
[0.8]
1.0 (3)
[0.8]
Page 15

Vomiting1.3 (24)
[1.0]
1.2 (39)
[0.9]
1.2 (30)
[0.9]
1.0 (8)
[0.8]
1.6 (5)
[1.3]
Gastroesophageal
reflux disease
1.7 (33)
[1.4]
1.4 (47)
[1.1]
1.6 (39)
[1.2]
0.8 (7)
[0.7]
0.3 (1)
[0.3]
Toothache1.1 (21)
[0.9]
1.0 (34)
[0.8]
1.0 (26)
[0.8]
0.7 (6)
[0.6]
1.3 (4)
[1.0]
Gastritis1.2 (23)
[1.0]
0.7 (25)
[0.6]
0.6 (16)
[0.5]
0.6 (5)
[0.5]
0.3 (1)
[0.3]
Abdominal pain1.2 (23)
[1.0]
1.4 (48)
[1.1]
1.7 (43)
[1.4]
0.4 (3)
[0.3]
1.0 (3)
[0.8]
Hepatobiliary disorders1.7 (33)
[1.4]
1.4 (47)
[1.1]
1.4 (34)
[1.1]
1.4 (12)
[1.1]
1.6 (5)
[1.3]
Skin and subcutaneous
tissue disorders
7.6 (144)
[6.4]
9.1 (303)
[7.2]
8.8 (220)
[7.3]
7.7 (65)
[6.4]
8.6 (27)
[7.4]
Rash1.2 (23)
[1.0]
1.4 (47)
[1.1]
1.3 (32)
[1.0]
1.1 (9)
[0.8]
1.9 (6)
[1.6]
Pruritus0.4 (8)
[0.3]
1.2 (39)
[0.9]
1.4 (34)
[1.1]
0.5 (4)
[0.4]
0.6 (2)
[0.5]
Musculoskeletal and
connective tissue
disorders
27.8 (527)
[27.3]
27.6 (923)
[25.5]
27.3 (683)
[26.5]
24.1 (202)
[22.8]
22.9 (72)
[21.8]
Back pain 5.1 (97) 4.8 (159) 4.3 (108) 5.2 (44) 5.1 (16)
Page 16

[4.2] [3.7] [3.5] [4.3] [4.2]
Arthralgia5.5 (105)
[4.6]
4.8 (161)
[3.7]
5.0 (126)
[4.1]
3.5 (29)
[2.8]
2.5 (8)
[2.1]
Myalgia5.0 (95)
[4.1]
5.2 (174)
[4.0]
5.4 (136)
[4.4]
3.1 (26)
[2.5]
3.8 (12)
[3.2]
Muscle spasms2.9 (54)
[2.3]
3.2 (107)
[2.4]
3.2 (79)
[2.5]
2.9 (24)
[2.3]
3.5 (11)
[2.9]
Pain in extremity3.6 (69)
[3.0]
2.8 (95)
[2.2]
2.8 (69)
[2.2]
2.4 (20)
[1.9]
1.9 (6)
[1.6]
Osteoarthritis2.6 (50)
[2.1]
2.5 (83)
[1.9]
2.4 (61)
[1.9]
2.1 (18)
[1.7]
1.3 (4)
[1.0]
Musculoskeletal pain1.5 (28)
[1.2]
2.2 (72)
[1.6]
2.2 (54)
[1.7]
1.4 (12)
[1.1]
1.3 (4)
[1.0]
Intervertebral disc
protrusion
0.3 (5)
[0.2]
0.8 (27)
[0.6]
0.6 (15)
[0.5]
1.1 (9)
[0.8]
1.0 (3)
[0.8]
Plantar fasciitis0.1 (2)
[0.1]
0.5 (17)
[0.4]
0.4 (9)
[0.3]
0.8 (7)
[0.7]
1.0 (3)
[0.8]
Rotator cuff syndrome0.6 (12)
[0.5]
0.5 (18)
[0.4]
0.4 (9)
[0.3]
0.8 (7)
[0.7]
1.3 (4)
[1.0]
Spinal osteoarthritis0.4 (8)
[0.3]
0.6 (19)
[0.4]
0.5 (12)
[0.4]
0.7 (6)
[0.6]
1.0 (3)
[0.8]
Neck pain 1.4 (26) 0.7 (22) 0.6 (15) 0.6 (5) 0.6 (2)
Page 17
[1.1] [0.5] [0.5][0.5]
[0.5]
Musculoskeletal chest
pain
1.0 (19)
[0.8]
0.7 (24)
[0.5]
0.9 (22)
[0.7]
0.2 (2)
[0.2]
0.3 (1)
[0.3]
Renal and urinary
disorders
5.0 (95)
[4.1]
4.9 (165)
[3.8]
4.9 (122)
[3.9]
4.4 (37)
[3.6]
4.5 (14)
[3.7]
Hematuria0.6 (12)
[0.5]
0.9 (29)
[0.7]
0.8 (20)
[0.6]
0.8 (7)
[0.7]
1.0 (3)
[0.8]
Urinary retention0.2 (4)
[0.2]
0.2 (7)
[0.2]
0.2 (4)
[0.1]
0.4 (3)
[0.3]
1.0 (3)
[0.8]
Reproductive system and
breast disorders
2.6 (50)
[2.1]
3.1 (103)
[2.3]
3.0 (76)
[2.4]
2.7 (23)
[2.2]
3.5 (11)
[2.9]
Benign prostatic
hyperplasia
0.7 (14)
[0.6]
0.6 (21)
[0.5]
0.6 (15)
[0.5]
0.6 (5)
[0.5]
1.0 (3)
[0.8]
General disorders and
administration site
conditions
15.8 (300)
[14.2]
16.2 (541)
[13.7]
16.6 (416)
[14.9]
10.8 (91)
[9.3]
8.0 (25)
[6.8]
Injection site reaction4.0 (76)
[3.3]
5.9 (196)
[4.6]
6.1 (153)
[5.0]
3.1 (26)
[2.5]
3.2 (10)
[2.6]
Fatigue2.7 (51)
[2.2]
3.0 (99)
[2.3]
2.9 (72)
[2.3]
2.6 (22)
[2.1]
2.2 (7)
[1.8]
Non-cardiac chest pain 2.2 (42) 2.3 (77) 2.1 (52) 2.6 (22) 1.3 (4)
Page 18

[1.8] [1.7] [1.7] [2.1] [1.0]
Edema peripheral1.3 (25)
[1.1]
1.6 (53)
[1.2]
1.6 (41)
[1.3]
1.1 (9)
[0.9]
0.6 (2)
[0.5]
Influenza like illness1.5 (28)
[1.2]
1.3 (43)
[1.0]
1.4 (36)
[1.1]
0.6 (5)
[0.5]
1.3 (4)
[1.0]
Asthenia1.1 (21)
[0.9]
0.7 (22)
[0.5]
0.6 (16)
[0.5]
0.4 (3)
[0.3]0
Investigations7.4 (141)
[6.2]
8.2 (275)
[6.4]
8.7 (218)
[7.2]
5.8 (49)
[4.7]
4.8 (15)
[3.9]
Alanine
aminotransferase
increased
0.9 (17)
[0.7]
1.0 (35)
[0.8]
1.1 (27)
[0.9]
0.7 (6)
[0.6]
1.0 (3)
[0.8]
Blood creatine
phosphokinase
increased
1.2 (23)
[1.0]
1.0 (34)
[0.8]
1.1 (27)
[0.9]
0.5 (4)
[0.4]
0.3 (1)
[0.3]
Injury, poisoning, and
procedural complications
14.6 (277)
[13.0]
15.3 (510)
[12.7]
15.4 (384)
[13.5]
12.3 (103)
[10.4]
14.0 (44)
[12.3]
Fall3.0 (57)
[2.5]
2.6 (88)
[2.0]
2.6 (66)
[2.1]
2.1 (18)
[1.7]
2.5 (8)
[2.1]
Accidental overdose2.2 (41)
[1.8]
2.7 (89)
[2.0]
2.8 (71)
[2.3]
1.5 (13)
[1.2]
1.0 (3)
[0.8]
Laceration 0.8 (15) 1.0 (34) 0.7 (18) 1.4 (12) 1.0 (3)
Page 19

[0.6] [0.8] [0.6] [1.1] [0.8]
Contusion1.2 (23)
[1.0]
2.1 (69)
[1.6]
2.2 (55)
[1.7]
1.3 (11)
[1.0]
1.3 (4)
[1.0]
Arthropod bite0.8 (15)
[0.6]
0.6 (21)
[0.5]
0.6 (15)
[0.5]
0.6 (5)
[0.5]
1.0 (3)
[0.8]
Ligament sprain1.2 (22)
[0.9]
0.9 (31)
[0.7]
1.0 (24)
[0.8]
0.6 (5)
[0.5]
1.3 (4)
[1.0]
Muscle strain1.0 (18)
[0.8]
0.8 (26)
[0.6]
0.9 (22)
[0.7]
0.5 (4)
[0.4]
0.6 (2)
[0.5]
*Patients who did not have two or more consecutive LDL-C values <25 mg/dL during treatment.
†Patients with 2 or more consecutive LDL-C values <25 or <15 mg/dL during treatment. Values are
considered consecutive if spaced out by at least 21 days. Only TEAEs that occurred, worsened or
became serious on the day or after the first of two consecutive LDL-C values <25 or <15 mg/dL are
considered.
‡Number of patients with an event per patient year, calculated as number of patients with an event
divided by total patient-years. For patients with an event, number of patient-years is calculated up to
date of the first event; for patients without an event, it corresponds to the length of the TEAE period.
LDL-C = low-density lipoprotein cholesterol; TEAE = treatment-emergent adverse event.
Page 20

Supplemental Table 5. Impact on Hormone Levels, as Measured in ODYSSEY
LONG TERM (Safety Population)
Laboratory parameter, % (n/N) Placebo (n = 788) Alirocumab (n = 1,550)
Cortisol
<LLN 22.9 (176/767) 21.6 (325/1506)
<LLN and ACTH >ULN 0.6 (1/176) 0.6 (2/325)
<LLN and ACTH >ULN and normal
ACTH stimulation test100 (1/1) 50.0 (1/2)
<LLN and ACTH >ULN and
abnormal ACTH stimulation test*0/1 50.0 (1/2)†
Gonadal hormones (men only) Placebo (n = 474) Alirocumab (n = 982)
Total testosterone <LLN regardless
of baseline status16.9 (74/439) 20.7 (188/909)
Luteinizing hormone >ULN
regardless of baseline status14.1 (62/439) 13.2 (120/910)
Follicle-stimulating hormone >ULN
regardless of baseline status8.2 (36/439) 7.3 (66/910)
*Abnormal ACTH stimulation test is defined as cortisol value <18 µg/dL (<497 nmol/L) at both 30 and
60 minutes after ACTH administration.
†Patient with Addison’s disease at baseline.
ACTH = adrenocorticotropic hormone; LLN = lower limit of normal; ULN = upper limit of normal.
Page 21
Supplemental Table 6. Patients With Abnormalities in Estimated Glomerular
Filtration Rate (Safety Population; Phase 3 Studies Only)
Alirocumab
eGFR, regardless of the baseline status
Values are % (n/N)
LDL-C
≥25 mg/dL* (n =
2,371)
LDL-C
<25 mg/dL†
(n = 811)
≥60–<90 mL/min/1.73m2 (mild decrease in eGFR) 64.6 (1477/2286) 63.5 (514/809)
≥30–<60 mL/min/1.73m2 (moderate decrease in eGFR) 24.2 (553/2286) 28.3 (229/809)
≥15–<30 mL/min/1.73m2 (severe decrease in eGFR) 1.0 (23/2286) 0.5 (4/809)
<15 mL/min/1.73m2 (end stage renal disease) <0.1 (1/2286) 0/809
*Patients who did not have 2 or more consecutive LDL-C values <25 mg/dL during treatment.
†Patients with 2 or more consecutive LDL-C values <25 mg/dL during treatment. Values are
considered consecutive if spaced out by at least 21 days. Only values measured on the day or after
the first of 2 consecutive LDL-C values <25 mg/dL are considered.
eGFR = estimated glomerular filtration rate; LDL-C = low-density lipoprotein cholesterol.
Page 22

Supplemental Figure 1. Mean HbA1c Over Time According to Achievement of
LDL-C <25 mg/dL and Diabetes Status (Safety Population; Phase 3 Studies
Only)
Baseline W12 W24 W52 W78 Last
Hem
oglob
in A
1Cm
ean
(+/-S
E) (%
)
5.0
5.5
6.0
6.5
7.0
7.5
8.0
Time point
Hem
oglob
in A
1Cm
ean
(+/-S
E) (%
)
5.0
5.5
6.0
6.5
7.0
7.5
8.0
Time point
With diabetes-Alirocumab-LDL-C>=25 mg/dL (N=451)With diabetes-Alirocumab-LDL-C<25 mg/dL (N=247)Without diabetes-Alirocumab-LDL-C>=25 mg/dL (N=1217)Without diabetes-Alirocumab-LDL-C<25 mg/dL (N=403)
With diabetes-Alirocumab-LDL-C>=25 mg/dL (N=451)With diabetes-Alirocumab-LDL-C<25 mg/dL (N=247)Without diabetes-Alirocumab-LDL-C>=25 mg/dL (N=1217)Without diabetes-Alirocumab-LDL-C<25 mg/dL (N=403)
LDL-C = low-density lipoprotein cholesterol; W = week
Page 23

References for supplement
1. McKenney JM, Koren MJ, Kereiakes DJ, Hanotin C, Ferrand AC, Stein EA. Safety
and efficacy of a monoclonal antibody to proprotein convertase subtilisin/kexin type 9 serine
protease, SAR236553/REGN727, in patients with primary hypercholesterolemia receiving
ongoing stable atorvastatin therapy. J Am Coll Cardiol 2012;59:2344-2353.
2. Stein EA, Gipe D, Bergeron J, et al. Effect of a monoclonal antibody to PCSK9,
REGN727/SAR236553, to reduce low-density lipoprotein cholesterol in patients with
heterozygous familial hypercholesterolaemia on stable statin dose with or without ezetimibe
therapy: a phase 2 randomised controlled trial. Lancet 2012;380:29-36.
3. Teramoto T, Kobayashi M, Uno K, et al. Efficacy and Safety of Alirocumab in
Japanese Subjects (Phase 1 and 2 Studies). Am J Cardiol 2016;118:56-63.
4. Roth EM, McKenney JM, Hanotin C, Asset G, Stein EA. Atorvastatin with or without
an antibody to PCSK9 in primary hypercholesterolemia. N Engl J Med 2012;367:1891-1900.
5. Robinson JG, Farnier M, Krempf M, et al. Efficacy and Safety of Alirocumab in
Reducing Lipids and Cardiovascular Events. N Engl J Med 2015;372:1489-1499.
6. Ginsberg HN, Rader DJ, Raal FJ, et al. Efficacy and Safety of Alirocumab in Patients
with Heterozygous Familial Hypercholesterolemia and LDL-C of 160 mg/dl or Higher.
Cardiovasc Drugs Ther 2016;30:473-483.
7. Kastelein JJ, Ginsberg HN, Langslet G, et al. ODYSSEY FH I and FH II: 78 week
results with alirocumab treatment in 735 patients with heterozygous familial
hypercholesterolaemia. Eur Heart J 2015;36:2996-3003.
Page 24

8. Kereiakes DJ, Robinson JG, Cannon CP, et al. Efficacy and safety of the PCSK9
inhibitor alirocumab among high cardiovascular risk patients on maximally tolerated statin
therapy: the ODYSSEY COMBO I study. Am Heart J 2015;169:906-915.e13.
9. Cannon CP, Cariou B, Blom D, et al. Efficacy and safety of alirocumab in high
cardiovascular risk patients with inadequately controlled hypercholesterolaemia on
maximally tolerated doses of statins: the ODYSSEY COMBO II randomized controlled trial.
Eur Heart J 2015;36:1186-94.
10. Bays H, Gaudet D, Weiss R, et al. Alirocumab as add-on to atorvastatin versus other
lipid treatment strategies: ODYSSEY OPTIONS I randomized trial. J Clin Endocrinol Metab
2015;100:3140-3148.
11. Farnier M, Jones P, Severance R, et al. Efficacy and safety of adding alirocumab to
rosuvastatin versus adding ezetimibe or doubling the rosuvastatin dose in high
cardiovascular-risk patients: the ODYSSEY OPTIONS II randomized trial. Atherosclerosis
2016;244:138-146.
12. Roth EM, Taskinen MR, Ginsberg HN, et al. Monotherapy with the PCSK9 inhibitor
alirocumab versus ezetimibe in patients with hypercholesterolemia: results of a 24 week,
double-blind, randomized Phase 3 trial. Int J Cardiol 2014;176:55-61.
13. Moriarty PM, Thompson PD, Cannon CP, et al. Efficacy and safety of alirocumab vs
ezetimibe in statin-intolerant patients, with a statin rechallenge arm: The ODYSSEY
ALTERNATIVE randomized trial. J Clin Lipidol 2015;9:758-769.
14. D’Agostino RB, Jr. Propensity score methods for bias reduction in the comparison of
a treatment to a non-randomized control group. Stat Med 1998;17:2265-81.
Page 25

15. Everett BM, Mora S, Glynn RJ, MacFadyen J, Ridker PM. Safety profile of subjects
treated to very low low-density lipoprotein cholesterol levels (<30 mg/dl) with rosuvastatin 20
mg daily (from JUPITER). Am J Cardiol 2014;114:1682-1689.
Page 26