Embed Size (px)
Citation preview

1
Principles of Hypothesis Testing for Public Health
Laura Lee Johnson, Ph.D.Statistician
National Center for Complementary and Alternative Medicine
[email protected] 2009
Answers to Questions I Usually Get Around Now
• ITT is like generalizing to real life• I am not a fan of stratification
Except by clinic/siteNot everyone agrees with me
• OK to adjust for (some) variablesBaseline covariates
Cannot stratify a continuous variableAt least rarely can you do it well
Some variables are not ok, or you just upgraded to a fancy model!
Objectives
• Formulate questions for statisticians and epidemiologists using
P-valuePowerType I and Type II errors
• Identity a few commonly used statistical tests for comparing two groups

2
OutlineEstimation and Hypotheses
• How to Test Hypotheses• Confidence Intervals • Regression• Error• Diagnostic Testing• Misconceptions• Appendix
Estimation and Hypotheses
InferenceHow we use Hypothesis Testing
• Estimation• Distributions• Hypothesis testing• Sides and Tails
Statistical Inference
• Inferences about a population are made on the basis of results obtained from a sample drawn from that population
• Want to talk about the larger population from which the subjects are drawn, not the particular subjects!

3
You Use Hypothesis Testing• Designing your study• Reviewing the design of other studies
Grant or application review (e.g. NIH study section, IRB)
• Interpreting your study results• Interpreting other’s study results
Reviewing a manuscript or journalInterpreting the news
I Use Hypothesis Testing
• Do all you do• Analyze the data to find the results
Program formulas not presented here in detail
• You can analyze the data, too, but be careful
Analysis Follows Design
Questions → Hypotheses →Experimental Design → Samples →Data → Analyses →Conclusions

4
What Do We Test• Effect or Difference we are interested in
Difference in Means or ProportionsOdds Ratio (OR)Relative Risk (RR)Correlation Coefficient
• Clinically important differenceSmallest difference considered biologically or clinically relevant
• Medicine: usually 2 group comparison of population means
Estimation and Hypotheses
InferenceHow we use Hypothesis TestingEstimation
• Distributions• Hypothesis testing• Sides and Tails
Estimation: From the Sample
• Point estimationMeanMedianChange in mean/median
• Interval estimationVariation (e.g. range, σ2, σ, σ/√n)95% Confidence interval

5
Pictures, Not Numbers
• Scatter plots• Bar plots (use a table)• Histograms• Box plots
• Not EstimationSee the data and check assumptions
Graphs and Tables
• A picture is worth a thousand t-tests• Vertical (Y) axis can be misleading
Like the Washington Post Weather, Though

6
Estimation and Hypotheses
InferenceHow we use Hypothesis TestingEstimationDistributions
• Hypothesis testing• Sides and Tails
Distributions
• Parametric tests are based on distributions
Normal Distribution (standard normal, bell curve, Z distribution)
• Non-parametric tests still have assumptions, but not based on distributions
2 of the Continuous Distributions
• Normal distribution: N( μ, σ2)μ = mean, σ2 = varianceZ or standard normal = N(0,1)
• t distribution: tω
ω = degrees of freedom (df)Usually a function of sample size
Mean = (sample mean)Variance = s2 (sample variance)
X

7
Binary Distribution
• Binomial distribution: B (n, p)Sample size = nProportion ‘yes’ = pMean = npVariance = np(1-p)
• Can do exact or use Normal
Many More Distributions
• Not going to cover• Poisson• Log normal• Gamma• Beta• Weibull• Many more
Estimation and Hypotheses
InferenceHow we use Hypothesis TestingEstimationDistributionsHypothesis TestingSides and Tails

8
Hypothesis Testing
• Null hypothesis (H0)• Alternative hypothesis (H1 or Ha)
Null Hypothesis• For superiority studies we think for example
Average systolic blood pressure (SBP) on Drug A is different than average SBP on Drug B
• Null of that? Usually that there is no effectMean = 0OR = 1RR = 1Correlation Coefficient = 0
• Sometimes compare to a fixed value so NullMean = 120
• If an equivalence trial, look at NEJM paper or other specific resources
Alternative Hypothesis
• Contradicts the null• There is an effect• What you want to prove• If equivalence trial, special way to
do this

9
Example Hypotheses
• H0: μ1 = μ2
• HA: μ1 ≠ μ2
Two-sided test• HA: μ1 > μ2
One-sided test
1 vs. 2 Sided Tests
• Two-sided testNo a priori reason 1 group should have stronger effectUsed for most tests
• One-sided testSpecific interest in only one directionNot scientifically relevant/interesting if reverse situation true
Use a 2-Sided Test
• Almost always• If you use a one-sided test
Explain yourselfPenalize yourself on the alpha
0.05 2-sided test becomes a 0.025 1-sided test

10
Never “Accept” Anything• Reject the null hypothesis• Fail to reject the null hypothesis
• Failing to reject the null hypothesis does NOT mean the null (H0) is true
• Failing to reject the null means Not enough evidence in your sample to reject the null hypothesisIn one sample saw what you saw
Outline
Estimation and HypothesesHow to Test Hypotheses
• Confidence Intervals • Regression• Error• Diagnostic Testing• Misconceptions
Experiment
Develop hypothesesCollect sample/Conduct experiment
• Calculate test statistic• Compare test statistic with what is
expected when H0 is true

11
Information at Hand
• 1 or 2 sample test?• Outcome variable
Binary, Categorical, Ordered, Continuous, Survival
• Population• Numbers (e.g. mean, standard
deviation)
Example: Hypertension/Cholesterol
• Mean cholesterol hypertensive men• Mean cholesterol in male general
(normotensive) population (20-74 years old)
• In the 20-74 year old male population the mean serum cholesterol is 211 mg/ml with a standard deviation of 46 mg/ml
One Sample:Cholesterol Sample Data
• Have data on 25 hypertensive men• Mean serum cholesterol level is
220mg/ml ( = 220 mg/ml)Point estimate of the mean
• Sample standard deviation: s = 38.6 mg/ml
Point estimate of the variance = s2
X

12
Compare Sample to Population
• Is 25 enough?Next lecture we will discuss
• What difference in cholesterol is clinically or biologically meaningful?
• Have an available sample and want to know if hypertensives are different than general population
Situation
• May be you are reading another person’s work
• May be already collected data
• If you were designing up front you would calculate the sample size
But for now, we have 25 people
Cholesterol Hypotheses
• H0: μ1 = μ2• H0: μ = 211 mg/ml
μ = POPULATION mean serum cholesterol for male hypertensivesMean cholesterol for hypertensive men = mean for general male population
• HA: μ1 ≠ μ2• HA: μ ≠ 211 mg/ml

13
Cholesterol Sample Data
• Population information (general)μ = 211 mg/mlσ = 46 mg/ml (σ2 = 2116)
• Sample information (hypertensives)= 220 mg/ml
s = 38.6 mg/ml (s2 = 1489.96) N = 25
X
ExperimentDevelop hypothesesCollect sample/Conduct experimentCalculate test statistic
• Compare test statistic with what is expected when H0 is true
Test Statistic• Basic test statistic for a mean
• σ = standard deviation (sometimes use σ/√n)• For 2-sided test: Reject H0 when the test
statistic is in the upper or lower 100*α/2% of the reference distribution
• What is α?
point estimate of
point estimate of - target value of test statistic =μ
μ μσ

14
Vocabulary
• Types of errorsType I (α) (false positives)Type II (β) (false negatives)
• Related wordsSignificance Level: α levelPower: 1- β
Unknown Truth and the Data
α = significance level1- β = power
1- βTrue Positive
αFalse Positive
Decide HA
“reject H0”
βFalse Negative
1- αTrue Negative
Decide H0
“fail to reject H0”
HA CorrectH0 CorrectTruthData
Type I Error
• α = P( reject H0 | H0 true)• Probability reject the null hypothesis
given the null is true• False positive• Probability reject that hypertensives’
µ=211mg/ml when in truth the mean cholesterol for hypertensives is 211

15
Type II Error (or, 1- Power)
• β = P( do not reject H0 | H1 true )• False Negative• Probability we NOT reject that male
hypertensives’ cholesterol is that of the general population when in truth the mean cholesterol for hypertensives is different than the general male population
Power
• Power = 1-β = P( reject H0 | H1 true )• Everyone wants high power, and
therefore low Type II error
Cholesterol Sample Data
• N = 25• = 220 mg/ml• μ = 211 mg/ml• s = 38.6 mg/ml (s2 = 1489.96)• σ = 46 mg/ml (σ2 = 2116)• α = 0.05• Power? Next lecture!
X

16
Z Test Statistic and N(0,1)• Want to test continuous outcome• Known variance• Under H0
• Therefore,0
0
0 0 0
Reject H if 1.96 (gives a 2-sided =0.05 test)/
Reject H if X > 1.96 or X < 1.96
Xn
n n
μ ασ
σ σμ μ
−>
+ −
0 ~ (0,1)/
X Nn
μσ
−
ExperimentDevelop hypothesesCollect sample/Conduct experimentCalculate test statisticCompare test statistic with what is expected when H0 is true
Reference distributionAssumptions about distribution of outcome variable
Z or Standard Normal Distribution

17
Z or Standard Normal Distribution
Z or Standard Normal Distribution
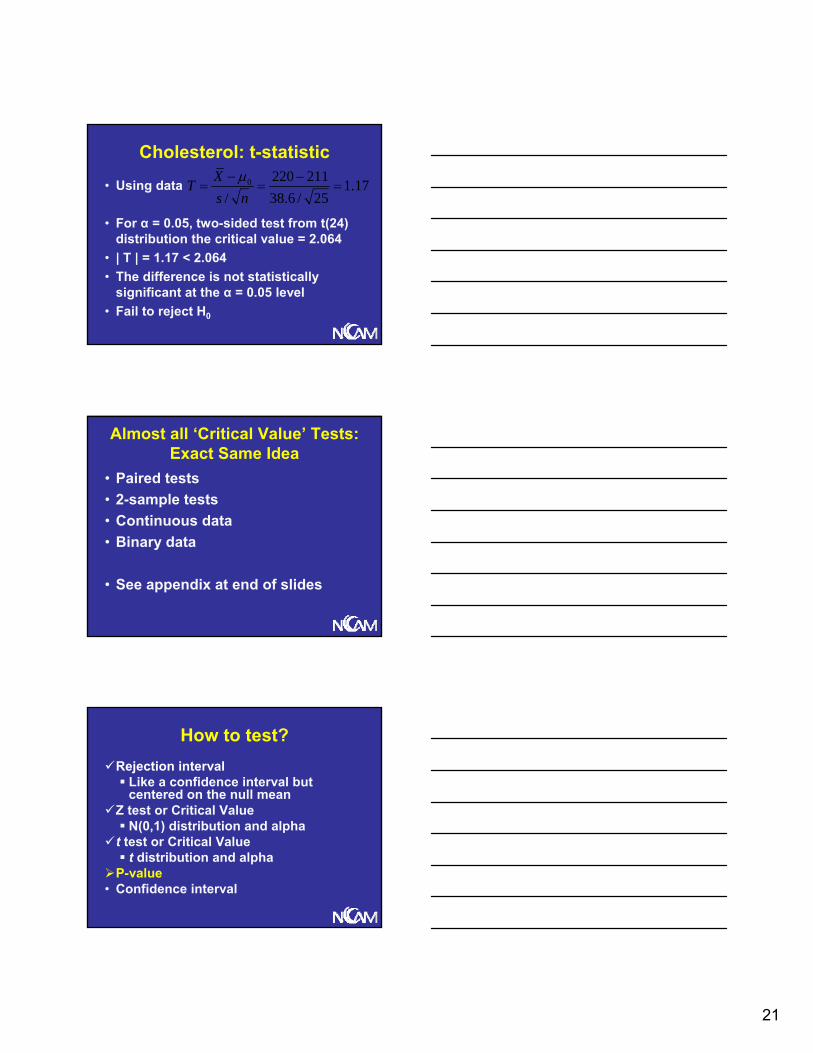
How to test?Rejection interval
Like a confidence interval but centered on the null mean
• Z test or Critical ValueN(0,1) distribution and alpha
• t test or Critical Valuet distribution and alpha
• P-value• Confidence interval

18
General Formula (1-α)%Rejection Region for Mean Point
Estimate
• Note that +Z(α/2) = - Z(1-α/2)• 90% CI : Z = 1.645• 95% CI : Z = 1.96• 99% CI : Z = 2.58
1 / 2 1 / 2,Z Zn n
α ασ σμ μ− −⎛ ⎞− +⎜ ⎟⎝ ⎠
Cholesterol Rejection IntervalUsing H0 Population Information
211193 229
N(211, 462)
Reject Ho if 220 is outside of (193,229)
Normal Distribution
Cholesterol Rejection IntervalUsing H0 Sample Information
211195 227
t Distribution (df = 24)
t (df=24, 211, 38.62)Reject Ho if 220 is outside of (195,227)

19
Side Note on t vs. Z
• If s = σ then the t value will be larger than the Z value
• BUT, here our sample standard deviation (38.6) was quite a bit smaller than the population sd (46)
HERE intervals using t look smaller than Z intervals BUTBecause of sd, not distribution
How to test?Rejection interval
Like a confidence interval but centered on the null mean
Z test or Critical ValueN(0,1) distribution and alpha
t test or Critical Valuet distribution and alpha
• P-value• Confidence interval
Z-test: Do Not Reject H0
0 220 211 0.98 1.96/ 46 / 25
XZn
μσ
− −= = = <

20
Z or Standard Normal Distribution
Determining Statistical Significance: Critical Value Method
• Compute the test statistic Z (0.98)• Compare to the critical value
Standard Normal value at α-level (1.96)• If |test statistic| > critical value
Reject H0Results are statistically significant
• If |test statistic| < critical valueDo not reject H0Results are not statistically significant
T-Test Statistic
• Want to test continuous outcome• Unknown variance (s, not σ)• Under H0
• Critical values: statistics books or computer
• t-distribution approximately normal for degrees of freedom (df) >30
0( 1)~
/ nX ts n
μ−
−
21
Cholesterol: t-statistic
• Using data
• For α = 0.05, two-sided test from t(24) distribution the critical value = 2.064
• | T | = 1.17 < 2.064• The difference is not statistically
significant at the α = 0.05 level• Fail to reject H0
0 220 211 1.17/ 38.6 / 25
XTs n
μ− −= = =
Almost all ‘Critical Value’ Tests: Exact Same Idea
• Paired tests• 2-sample tests• Continuous data• Binary data
• See appendix at end of slides
How to test?Rejection interval
Like a confidence interval but centered on the null mean
Z test or Critical ValueN(0,1) distribution and alpha
t test or Critical Valuet distribution and alpha
P-value• Confidence interval

22
P-value
• Smallest α the observed sample would reject H0
• Given H0 is true, probability of obtaining a result as extreme or more extreme than the actual sample
• MUST be based on a modelNormal, t, binomial, etc.
Cholesterol Example
• P-value for two sided test• = 220 mg/ml, σ = 46 mg/ml• n = 25• H0: μ = 211 mg/ml• HA: μ ≠ 211 mg/ml
2* [ 220] 0.33P X > =
X
Determining Statistical Significance: P-Value Method
• Compute the exact p-value (0.33)• Compare to the predetermined α-level
(0.05)• If p-value < predetermined α-level
Reject H0Results are statistically significant
• If p-value > predetermined α-levelDo not reject H0Results are not statistically significant

23
P-value Interpretation Reminders
• Measure of the strength of evidence in the data that the null is not true
• A random variable whose value lies between 0 and 1
• NOT the probability that the null hypothesis is true.
How to test?Rejection interval
Like a confidence interval but centered on the null mean
Z test or Critical ValueN(0,1) distribution and alpha
t test or Critical Valuet distribution and alpha
P-value• Confidence interval
Outline
Estimation and HypothesesHow to Test HypothesesConfidence Intervals
• Regression• Error• Diagnostic Testing• Misconceptions

24
General Formula (1-α)% CI for μ
• Construct an interval around the point estimate
• Look to see if the population/null mean is inside
1 / 2 1 / 2,Z ZX Xn n
α ασ σ− −⎛ ⎞− +⎜ ⎟⎝ ⎠
Cholesterol Confidence IntervalUsing Population Variance ( Z )
220211202196 229 238 244
N(220, 462)
CI for the Mean, Unknown Variance
• Pretty common• Uses the t distribution• Degrees of freedom
1,1 / 2 1,1 / 2,
2.064*38.6 2.064*38.6220 ,22025 25
(204.06,235.93)
n nt s t sX X
n nα α− − − −⎛ ⎞
− +⎜ ⎟⎝ ⎠
⎛ ⎞= − +⎜ ⎟
⎝ ⎠=

25
Cholesterol Confidence IntervalUsing Sample Data ( t )
220212204198 228 236 242
t (df=24, 220, 38.62)
But I Have All Zeros! Calculate 95% upper bound
• Known # of trials without an event (2.11 van Belle 2002, Louis 1981)
• Given no observed events in n trials, 95% upper bound on rate of occurrence is 3 / (n + 1)
No fatal outcomes in 20 operations95% upper bound on rate of occurrence = 3 / (20 + 1) = 0.143, so the rate of occurrence of fatalities could be as high as 14.3%
Hypothesis Testing and Confidence Intervals
• Hypothesis testing focuses on where the sample mean is located
• Confidence intervals focus on plausible values for the population mean

26
CI Interpretation• Cannot determine if a particular interval
does/does not contain true mean• Can say in the long run
Take many samples Same sample sizeFrom the same population95% of similarly constructed confidence intervals will contain true mean
• Think about meta analyses
Interpret a 95% Confidence Interval (CI) for the population
mean, μ• “If we were to find many such
intervals, each from a different random sample but in exactly the same fashion, then, in the long run, about 95% of our intervals would include the population mean, μ, and 5% would not.”
Do NOT interpret a 95% CI…• “There is a 95% probability that the true
mean lies between the two confidence values we obtained from a particular sample”
• “We can say that we are 95% confident that the true mean does lie between these two values.”
• Overlapping CIs do NOT imply non-significance

27
Take Home: Hypothesis Testing
• Many ways to testRejection intervalZ test, t test, or Critical ValueP-valueConfidence interval
• For this, all ways will agreeIf not: math wrong, rounding errors
• Make sure interpret correctly
Take Home Hypothesis Testing
• How to turn questions into hypotheses• Failing to reject the null hypothesis
DOES NOT mean that the null is true• Every test has assumptions
A statistician can check all the assumptionsIf the data does not meet the assumptions there are non-parametric versions of tests (see text)
Take Home: CI
• Meaning/interpretation of the CI• How to compute a CI for the true
mean when variance is known (normal model)
• How to compute a CI for the true mean when the variance is NOT known (t distribution)

28
Take Home: Vocabulary• Null Hypothesis: H0• Alternative Hypothesis: H1 or Ha or HA• Significance Level: α level• Acceptance/Rejection Region• Statistically Significant• Test Statistic• Critical Value• P-value, Confidence Interval
Outline
Estimation and HypothesesHow to Test HypothesesConfidence Intervals Regression
• Error• Diagnostic Testing• Misconceptions
Regression
• Continuous outcomeLinear
• Binary outcomeLogistic
• Many other types

29
Linear regression• Model for simple linear regression
Yi = β0 + β1x1i + εiβ0 = interceptβ1 = slope
• AssumptionsObservations are independentNormally distributed with constant variance
• Hypothesis testingH0: β1 = 0 vs. HA: β1 ≠ 0
In Order of Importance
1. Independence2. Equal variance3. Normality
(for ANOVA and linear regression)
More Than One Covariate
• Yi = β0 + β1x1i + β2x2i + β3x3i + εi
• SBP = β0 + β1 Drug + β2 Male + β3 Age
• β 1
Association between Drug and SBPAverage difference in SBP between the Drug and Control groups, given sex and age

30
Testing?
• Each β has a p-value associated with it• Each model will have an F-test• Other methods to determine fit
Residuals
• See a statistician and/or take a biostatistics class. Or 3.
Repeated Measures (3 or more time points)
• Do NOT use repeated measures AN(C)OVA
Assumptions quite stringent• Talk to a statistician
Mixed modelGeneralized estimating equationsOther
An Aside: Correlation
• Range: -1 to 1• Test is correlation is ≠ 0• With N=1000, easy to have highly
significant (p<0.001) correlation = 0.05Statistically significant that isNo where CLOSE to meaningfully different from 0
• Partial Correlation Coefficient

31
Do Not Use Correlation.Use Regression
• Some fields: Correlation still popularPartial regression coefficients
• High correlation is > 0.8 (in absolute value). Maybe 0.7
• Never believe a p-value from a correlation test
• Regression coefficients are more meaningful
Analysis Follows Design
Questions → Hypotheses →Experimental Design → Samples →Data → Analyses →Conclusions
Outline
Estimation and HypothesesHow to Test HypothesesConfidence Intervals RegressionError
• Diagnostic Testing• Misconceptions

32
Is α or β more important ?
• Depends on the question• Most will say protect against Type I
error• Need to think about individual and
population health implications and costs
Omics
• False negative (Type II error)Miss what could be importantAre these samples going to be looked at again?
• False positive (Type I error)Waste resources following dead ends
HIV Screening
• False positiveNeedless worryStigma
• False negativeThinks everything is okContinues to spread disease
• For cholesterol example?

33
What do you need to think about?
• Is it worse to treat those who truly are not ill or to not treat those who are ill?
• That answer will help guide you as to what amount of error you are willing to tolerate in your trial design
Outline
Estimation and HypothesesHow to Test HypothesesConfidence Intervals RegressionErrorDiagnostic Testing
• Misconceptions
Little Diagnostic Testing Lingo
• False Positive/False Negative (α, β) • Positive Predictive Value (PPV)
Probability diseased given POSITIVE test result
• Negative Predictive Value (NPV)Probability NOT diseased given NEGATIVE test result
• Predictive values depend on disease prevalence

34
Sensitivity, Specificity
• Sensitivity: how good is a test at correctly IDing people who have disease
Can be 100% if you say everyone is ill (all have positive result)Useless test with bad Specificity
• Specificity: how good is the test at correctly IDing people who are well
Example: Western vs. ELISA• 1 million people• ELISA Sensitivity = 99.9%• ELISA Specificity = 99.9%• 1% prevalence of infection
10,000 positive by Western (gold standard) 9990 true positives (TP) by ELISA10 false negatives (FN) by ELISA
1% Prevalence
• 990,000 not infected989,010 True Negatives (TN)990 False Positives (FP)
• Without confirmatory testTell 990 or ~0.1% of the population they are infected when in reality they are notPPV = 91%, NPV = 99.999%

35
1% Prevalence• 10980 total test positive by ELISA
9990 true positive990 false positive
• 9990/10980 = probability diseased GIVEN positive by ELISA = PPV = 0.91 = 91%
• 989,020 total test negatives by ELISA989,010 true negatives10 false negatives
• 989010/989020 = NPV = 99.999%
0.1% Prevalence
• 1,000 infected – ELISA picks up 9991 FN
• 999,000 not infected989,001 True Negatives (TN)999 False Positives (FP)
• Positive predictive value = 50%• Negative predictive value = 99.999%
10% Prevalence
• 99% PPV• 99.99% NPV

36
Prevalence Matters(Population You Sample to Estimate
Prevalence, too)• Numbers look “good” with high
prevalenceTesting at STD clinic in high risk populations
• Low prevalence means even very high sensitivity and specificity will result in middling PPV
• Calculate PPV and NPV for 0.01% prevalence found in female blood donors
Prevalence Matters
• PPV and NPV tend to come from good cohort data
• Can estimate PPV/NPV from case control studies but the formulas are hard and you need to be REALLY sure about the prevalence
Triple sure
High OR Does Not a Good Test Make
• Diagnostic tests need separation• ROC curves
Not logistic regression with high OR
• Strong association between 2 variables does not mean good prediction of separation

37
What do you need to think about?
• How good does the test need to be?96% sensitivity and 10% specificity?66% AUC? (What is that?)
• Guide you as to what amount of differentiation, levels of sensitivity, specificity, PPV and NPV you are willing to tolerate in your trial design
Outline
Estimation and HypothesesHow to Test HypothesesConfidence Intervals RegressionErrorDiagnostic TestingMisconceptions
Avoid Common Mistakes: Hypothesis Testing
• If you have paired data, use a paired test
If you don’t then you can lose power• If you do NOT have paired data, do
NOT use a paired testYou can have the wrong inference

38
Avoid Common Mistakes: Hypothesis Testing
• These tests have assumptions of independence
Taking multiple samples per subject ? Statistician MUST knowDifferent statistical analyses MUST be used and they can be difficult!
• Distribution of the observationsHistogram of the observationsHighly skewed data - t test - incorrect results
Avoid Common Mistakes: Hypothesis Testing
• Assume equal variances and the variances are not equal
Did not show variance testNot that good of a testALWAYS graph your data first to assess symmetry and variance
• Not talking to a statistician
Estimates and P-Values
• Study 1: 25±9Stat sig at the 1% level
• Study 2: 10±9Not statistically significant (ns)
• 25 vs. 10 wow a big difference between these studies!
Um, no. 15±12.7

39
Comparing A to B
• AppropriateStatistical properties of A-BStatistical properties of A/B
• NOT AppropriateStatistical properties of AStatistical properties of BLook they are different!
Not a big difference? 15?!?
• Distribution of the difference15±12.7Not statistically significantStandard deviations! Important.
• Study 3 has much larger sample size!
2.5±0.9
3 Studies. 3 Answers, Maybe
• Study # 3 is statistically significant• Difference between study 3 and the
other studiesStatisticalDifferent magnitudes
• Does study 3 replicate study 1?• Is it all sample size?

40
Misconceptions
• P-value = inferential tool ? YesHelps demonstrate that population means in two groups are not equal
• Smaller p-value → larger effect ? No
Effect size is determined by the difference in the sample mean or proportion between 2 groups
Misconceptions• A small p-value means the difference is
statistically significant, not that the difference is clinically significant. YES
A large sample size can help get a small p-value. YES, so do not be tricked.
• Failing to reject H0 means what?There is not enough evidence to reject H0 YESH0 is true! NO NO NO NO NO!
Analysis Follows Design
Questions → Hypotheses →Experimental Design → Samples →Data → Analyses →Conclusions

41
Questions?
Appendix
• Formulas for Critical Values• Layouts for how to choose a test
Do Not Reject H0
0 220 211 0.98 1.96/ 46 / 25
XZn
μσ
− −= = = <
0
0
46220=X > 1.96 =211+1.96* 228.03 NO!25
46220=X < 1.96 211-1.96* 192.97 NO!25
n
n
σμ
σμ
+ =
− = =

42
Paired Tests: Difference Two Continuous Outcomes
• Exact same idea• Known variance: Z test statistic• Unknown variance: t test statistic• H0: μd = 0 vs. HA: μd ≠ 0• Paired Z-test or Paired t-test
/ /d dZ or T
n s nσ= =
2 Samples: Same Variance + Sample Size Calculation Basis
• Unpaired - Same idea as paired• Known variance: Z test statistic• Unknown variance: t test statistic• H0: μ1 = μ2 vs. HA: μ1 ≠ μ2
H0: μ1 - μ2 = 0 vs. HA: μ1 - μ2 ≠ 0• Assume common variance
1/ 1/ 1/ 1/x y x yZ or T
n m s n mσ− −
= =+ +
2 Sample Unpaired Tests: 2 Different Variances
• Same idea• Known variance: Z test statistic• Unknown variance: t test statistic• H0: μ1 = μ2 vs. HA: μ1 ≠ μ2
• H0: μ1 - μ2 = 0 vs. HA: μ1 - μ2 ≠ 0
2 2 2 21 2 1 2/ / / /
x y x yZ or Tn m s n s mσ σ− −
= =+ +

43
One Sample Binary Outcomes
• Exact same idea• For large samples
Use Z test statisticSet up in terms of proportions, not means
0
0 0
ˆ(1 ) /p pZ
p p n−
=−
Two Population Proportions
• Exact same idea• For large samples use Z test
statistic
1 2
1 1 2 2
ˆ ˆˆ ˆ ˆ ˆ(1 ) (1 )
p pZp p p p
n m
−=
− −+
Normal/Large Sample Data?
Binomial?
Independent? Nonparametric test
Expected ≥5
2 sample Z test for proportions or contingency table
McNemar’s test
Fisher’s Exact test
No
No
No
No
Yes
Yes
Yes

44
Normal/Large Sample Data?
Inference on means?
Independent? Inference on variance?
Variance known?
Paired t
Z test
Variances equal?
T test w/ pooled
variance
T test w/ unequal variance
F test for variances
Yes
Yes
Yes Yes
Yes
Yes
No
No
No
No