Embed Size (px)
Citation preview

Principles of Fundamental Analysis – Day 1
Professor Jacob Cohen
March 2016

2
Introduction – Jake Cohen
• Senior Associate Dean for Undergraduate and Master’s Programs and Senior Lecturer in the Accounting and Law groups
• Former faculty member and Dean of the MBA Program at INSEAD, Senior Teaching Fellow at Harvard Business School, Judge Fellow at University of Cambridge and Research Fellow in Oxford University’s Smith School of Enterprise and the Environment.
• Consulting work with Blackstone, BCG, SAP, Schlumberger, and others

3
Alignment in Action

4
Day 1 Content
• The Corporate Finance Model of the Firm
• The Financial Accounting Model of the Firm
• What is Risk?
• The Fundamental Finance Principle

5
INVESTORS
PROVIDE CAPITAL
MANAGERS
EMPLOY CAPITAL
FINANCIAL MARKETS
VALUE CAPITAL
The Value Loop
THE MARKET VALUE OF THE CAPITAL EMPLOYED
ACCRUES TO THE INVESTORS
MANAGERS MUST MAKE DECISIONS WHICH RAISE THE MARKET VALUE OF CAPITAL ABOVE THE
AMOUNT OF CAPITAL EMPLOYED. THE DIFFERENCE IS CALLED MARKET VALUE ADDED OR MVA:
MVA = Market Value of Capital (Owner’ equity + Debt) – Capital Employed

6
Value Creators & Destroyers in the U.S.
MARKET VALUE
OF CAPITAL
CAPITAL
EMPLOYED
MARKET VALUE
ADDED
US$ Billions
1. GENERAL ELECTRIC
343 97 +246
2. WAL-MART STORES 296 82 +214
3. MICROSOFT GROUP 225 24 +201
4. CITIGROUP INC. 267 133 +134
5. INTEL CORP. 163 31 +132
996. LUCENT TECHOLOGIES INC. 31 62 - 31
997. SBC COMMUNICATIONS INC. 114 151 - 37
998. TIME WARNER INC. 118 161 - 43
999. AT&T CORP. 36 88 - 52
1000. JDS UNIPHASE CORP. 5 70 - 65
12/31/03

7
Source: http://www.ge.com/sites/default/files/ge_pivot_simpler_more_valuable.pdf

8
Jeff Immelt: A simpler, more valuable GE Today, we announced an exciting and promising new chapter for GE, a plan to create a simpler, more valuable industrial company by reducing the size of our financial business. As a first step, we also announced agreements to sell the bulk of GE Capital Real Estate assets for a total value of approximately $26.5 billion.
As the senior management team and Board carefully considered this move, we asked ourselves some key questions: What is going on in the world? Is this the right time? Is this good for customers and investors? What will GE look like going forward?
Coming out of the financial crisis, financial markets have changed for a generation. GE Capital has solid businesses and a great team. However, the business model for large, wholesale-funded financial companies has changed, making it increasingly difficult to generate acceptable returns going forward.
This is a good time to move. Synchrony Financial’s successful IPO and other recent Capital business exits bolstered our confidence that our businesses will be more valuable outside of GE. The market is strong for the businesses we will sell, and I am confident they will thrive elsewhere.
We are also confident that creating a simpler GE will position us to deliver superior outcomes around our core capabilities. Every GE business – including the Capital aviation, healthcare and energy “vertical” financing businesses – will be part of the “GE Store” of technology, process tools and cultural strength. As we build the next industrial era, customer focus is more important than ever.
For investors, we anticipate our high-value industrials to generate more than 90% of our earnings by 2018. And, we expect to return more than $90 billion in cash to investors through dividends, share buybacks and the Synchrony exchange through the end of 2018.
GE today is a premier industrial company with businesses in high-growth industries. We are leaders in technology, well positioned in growth markets and delivering higher margins and lower costs. This transformation positions GE for long-term success as we pair our best-in-class industrials with financial businesses focused on growth.
I know I speak for all of GE and the Board when I say that we are proud of the Capital team, the outstanding businesses that Capital employees have built and how they have delivered for customers and shareholders over many years. The Capital team has displayed great resiliency, facing tough cycles and driving strong results.
This was a hard decision and a big change for GE. However, it is right for the company.
Jeff Immelt Chairman and CEO, GE

9
Market Value of Debt
The market value of debt is usually more difficult to obtain directly, since very few firms have all their debt in the form of bonds outstanding trading in the market.
Many firms have non-traded debt, such as bank debt, which is specified in book value terms but not market value terms.
Thus, for our purposes, we’ll assume that market value of debt is equal to the book value of debt.

10
THE INVESTORS
And what they get in return
THE SHAREHOLDERS
They get:
• Dividends
• Capital gains
THE DEBTHOLDERS
BONDHOLDERS
They get:
• Coupons
• Capital gains
LENDING INSTITUTIONS
They get:
• Interest payments
• Principal Repayment
Whose Money are the Companies Spending?

11
Credit Ratings
• Credit ratings are opinions about credit risk. Standard & Poor’s ratings express the agency’s opinion about the ability and willingness of an issuer, such as a corporation, to meet its financial obligations in full and on time.
• To form its ratings opinions, the credit analysis of a corporate issuer typically considers many financial and non-financial factors, including key performance indicators, economic, regulatory, and geopolitical influences, management and corporate governance attributes, and competitive position.
• For high-grade credit ratings, Standard & Poor’s considers the anticipated ups and downs of the business cycle, including industry-specific and broad economic factors. The length and effects of business cycles can vary greatly, however, making their impact on credit quality difficult to predict with precision.
Source: S&P

12
Credit Ratings Scale
Investm
en
t
Gra
de
Moody’s S&P
Aaa AAA Strongest
Weakest
No
n-
Inves
tmen
t
Gra
de
Aa1 AA+
Aa2 AA
Aa3 AA-
A1 A+
A2 A
A3 A-
Baa1 BBB+
Baa2 BBB
Baa3 BBB-
Ba1 BB+
Ba2 BB
Ba3 BB-
B1 B+
B2 B
B3 B-
Caa1 CCC+
Fitch
AAA
AA+
AA
AA-
A+
A
A-
BBB+
BBB
BBB-
BB+
BB
BB-
B+
B
B-
CCC+

13
THE PRIMARY MARKET THE SECONDARY MARKET
New
Securities
Cash
THE FIRM INVESTORS Outstanding
Securities
Cash
INVESTORS INVESTORS
The Financial Markets

14
Stocks vs. Bonds Performance
$1
$21
$41
$61
$81
$101
$121
$141
$161
$181
19
60
19
62
19
64
19
66
19
68
19
70
19
72
19
74
19
76
19
78
19
80
19
82
19
84
19
86
19
88
19
90
19
92
19
94
19
96
19
98
20
00
20
02
20
04
20
06
20
08
20
10
20
12
20
14
Stocks (S&P 500)
T.Bills
T.Bonds
$180.24
$13.22
$32.50
Value of $1 invested in 1960
Source: http://www.stern.nyu.edu/~adamodar/New_Home_Page/data.html

15
Content
• The Corporate Finance Model of the Firm ‒ Is concerned with the investor perspective
‒ Focuses on the value impact of business decisions
‒ Is forward looking
• The Financial Accounting Model of the Firm
• What is Risk?
• The Fundamental Finance Principle

16

17
Financial Transactions
FINANCIAL ACCOUNTING PROCESS
BALANCE SHEET
THE FIRM THE REST OF
THE WORLD
INCOME STATEMENT
The Financial Accounting Database

The Red Bearded Baron Case

19
ASSETS
CURRENT ASSETS • Cash
• Accounts receivables
• Inventories
• Prepaid expenses
NONCURRENT ASSETS • Financial assets & intangibles
• Property, plant & equipment
• Gross value
• Accumulated depreciation
OWNERS’ EQUITY = ASSETS – LIABILITIES
ASSETS = LIABILITIES + OWNERS’ EQUITY
LIABILITIES & OWNERS’ EQUITY
CURRENT LIABILITIES • Short-term debt
• Owed to banks
• Current portion of long-term debt
• Accounts payable
• Accrued expenses
NONCURRENT LIABILITIES • Long-term debt
OWNERS’ EQUITY
The Balance Sheet
20
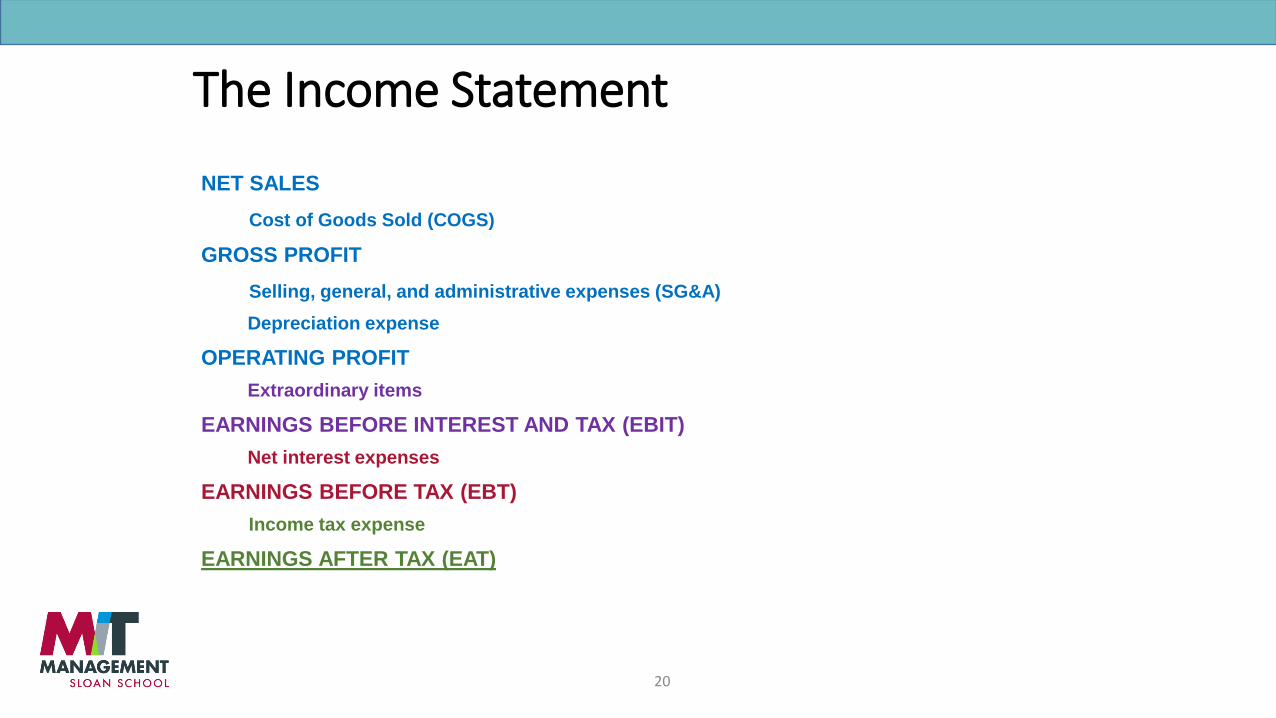
The Income Statement
NET SALES
Cost of Goods Sold (COGS)
GROSS PROFIT
Selling, general, and administrative expenses (SG&A)
Depreciation expense
OPERATING PROFIT
Extraordinary items
EARNINGS BEFORE INTEREST AND TAX (EBIT)
Net interest expenses
EARNINGS BEFORE TAX (EBT)
Income tax expense
EARNINGS AFTER TAX (EAT)

21
CHANGE IN OWNERS’ EQUITY
= EARNINGS AFTER TAX
– DIVIDENDS
+ $ RAISED BY NEW SHARE ISSUANCE
– $ PAID FOR SHARE REPURCHASE
Retained
earnings
The Statement of Retained Earnings

22
These accounts are not
financial accounts
ASSETS
CURRENT ASSETS • Cash
• Accounts receivables
• Inventories
• Prepaid expenses
NONCURRENT ASSETS • Financial assets & intangibles
• Property, plant & equipment
• Gross value
• Accumulated depreciation
LIABILITIES & OWNERS’ EQUITY
CURRENT LIABILITIES
NONCURRENT LIABILITIES • Long-term debt
OWNERS’ EQUITY
• Short-term debt
• Owed to banks
• Current portion of long-term debt
• Accounts payable
• Accrued expenses
The Balance Sheet: The BU’s View

23
THE FIRM’S INVESTMENTS THE ACCOUNTING ESTIMATES
INVESTMENT IN
FIXED ASSETS
NET
FIXED ASSETS
The Firm’s Investments

24
THE FIRM’S INVESTMENTS THE ACCOUNTING ESTIMATES
INVESTMENT IN
FIXED ASSETS
NET
FIXED ASSETS
The Firm’s Investments
INVESTMENT IN
CASH CASH

25
WORKING CAPITAL REQUIREMENT (WCR)
=
[RECEIVABLE’S + INVENTORIES + PREPAID EXPENSES]
– [PAYABLE’S + ACCRUED EXPENSES]
CASH
PROCUREMENT
SALES
PRODUCTION
The Working Capital Requirement (WCR)

26

27
THE FIRM’S INVESTMENTS THE ACCOUNTING ESTIMATES
INVESTMENT IN
FIXED ASSETS
NET
FIXED ASSETS
The Firm’s Investments
INVESTMENT IN
CASH CASH
INVESTMENT IN
THE OPERATING CYCLE
WORKING CAPITAL REQUIREMENT
WCR

28
CASH
WORKING CAPITAL
REQUIREMENT
NET FIXED ASSETS
SHORT-TERM
DEBT
LONG-TERM
DEBT
OWNER’S
EQUITY
INVESTED CAPITAL CAPITAL EMPLOYED
The Managerial Balance Sheet

29
Cash
Working Capital
Requirement
Net fixed assets
Short-Term
Debt
Long-Term
Debt
Owner’s
Equity
Invested Capital Capital Employed
Cash
Operating Assets
Net Fixed Assets
Short-Term
Debt
Long-Term
Debt
Owner’s
Equity
Assets Liabilities & Equity
Operating Liabilities
Accounting vs. Managerial Balance Sheet

30
Invested Capital
Debt
Owner’s Equity
Revenues
Expenses
Net Profit
Invested Capital
Debt
Owner’s Equity
DIVIDENDS
RETAINED EARNINGS
The Accounting Model of the Firm

31
Content
• The Corporate Finance Model of the Firm ‒ Is concerned with the investor perspective ‒ Focuses on the value impact of business decisions ‒ Is forward looking
• The Financial Accounting Model of the Firm ‒ Is concerned with transactions between the firm and the world ‒ A formidable database to analyze the firm’s strengths and weaknesses ‒ The managerial balance sheet: invested capital & capital employed ‒ Is backward looking
• What is Risk?
• The Fundamental Finance Principle

32
EXPECTED SALES DOWN 10%
SALES UP 10%
SALES $1,000 $900 -10% $1,100 +10%
less variable operating expenses (380) (342) -10% (418) +10%
less fixed operating expenses (380) (380) same (380) same
EBIT (Earnings before interest & tax) $240 178 -26% $302 +26%
less fixed interest expenses (40) (40) same (40) Same
EBT (Earnings before tax) $200 $138 -31% $262 +31%
less variable tax expenses (50%) (100) (69) -31% (131) +31%
EAT (Earnings after tax) $100 $69 -31% $131 +31%
RISK IS RELATED TO THE PROBABILITY OF NOT GETTING WHAT IS EXPECTED.
Risk

33
Economic, social & political conditions
Competitive position
+ 10%
- 10%
+ 26%
- 26%
+ 31%
- 31%
ECONOMIC RISK OPERATIONAL RISK
BUSINESS RISK FINANCIAL RISK
OPERATING
PROFIT
NET PROFIT SALES
Risk

34
Content
• The Corporate Finance Model of the Firm ‒ Is concerned with the investor perspective ‒ Focuses on the value impact of business decisions ‒ Is forward looking
• The Financial Accounting Model of the Firm ‒ Is concerned with transactions between the firm and the world ‒ A formidable database to analyze the firm’s strengths and weaknesses ‒ The managerial balance sheet: invested capital & capital employed ‒ Is backward looking
• What is Risk? ‒ Relevant risks are:
• Business risk • Financial risk
• The Fundamental Finance Principle

35
Glossary of Select Financial Terms
CAGR – Compound Annual Growth Rate. CAGR is the mean annual growth rate of an investment over a specified period of time. DCF – Discounted Cash Flow. DCF analysis uses future free cash flow projections and discounts them to arrive at a present value estimate, which is used to evaluate the potential for investment. EBIT – Earnings Before Interest and Taxes. EBIT is a measure of a firm’s profit that includes all operating income and expenses except interest and income tax. It is often also referred to as operating profit. EBITDA – Earnings Before Interest, Taxes, Depreciation and Amortization. EBITDA is used to analyze and compare profitability between companies and industries because it eliminates the effects of financing and accounting decisions. EV – Enterprise Value. EV is an economic measure reflecting the market value of a whole business. It is a sum of claims of all claimants: creditors (secured and unsecured) and equity holders (preferred and common). IRR – Internal Rate of Return. IRR is the interest rate at which the NPV of all the cash flows (both positive and negative) from a project or investment equal zero. Market Capitalization – the aggregate valuation of a company based on its current share price multiplied by the total number of shares outstanding. MVA – Market Value Added. MVA is the difference between the current market value of a firm and the capital contributed by investors. If MVA is positive, the firm has added value. If it is negative, the firm has destroyed value. NPV – Net Present Value. NPV is the difference between the present value of cash inflows and the present value of cash outflows. WACC – Weighted Average Cost of Capital. WACC is the rate that a company pays on average to all its security holders to finance its assets.