Embed Size (px)
Citation preview

Principles of EffectivePrinciples of EffectiveScience Communication
Ben LongstaffBen LongstaffSouth Carolina Science Communication Course
April 7-11, 2008April 7-11, 2008
integrationintegration applicationapplication networknetwork

Develop a consistent style and format
• Within products, and also between products
– Newsletters, presentations, websites, books– Newsletters, presentations, websites, books
• Train your audience
• Use Master Slide or Master Page functions to ensure consistency
integrationintegration applicationapplication networknetwork
Newsletter Book Presentation Website

Typography is the art of words
• Spelling and grammar• There are two types of fonts – serif, and sans serif
Serif fonts Sans serif fonts
Times New Roman Arial
Garamond Century Gothic
This is a serif font. Which of these fonts is
This is a sans serif font.Which of these fonts iseasier to read?Garamond Century Gothic
Palatino Helvetica
Which of these fonts is easier to read? easier to read?
integrationintegration applicationapplication networknetwork
• Sans serif fonts are more readable from a distance

Typography is the art of words
• Text justification depends on layout, how much text you have, and medium (presentation, book, etc)
integrationintegration applicationapplication networknetwork

Use color, but use it judiciously
• Use color judiciously, especially red and green• Contrast between your background, and text/graphics is important• Improper use of color can alienate your audience• Improper use of color can alienate your audience
Dark blueBrown
Dark green Black
integrationintegration applicationapplication networknetwork

RGB vs. CMYK
• Red, Green, Blue• Transmitted light
(presentations, websites)
• Cyan, Magenta, Yellow, blacK• Printed ink (posters,
newsletters)(presentations, websites)• Mixing the colors results in
white light• Absence of color results in
newsletters)• Mixing the colors results in
black ink• Absence of color results in
integrationintegration applicationapplication networknetwork
• Absence of color results in black
• Absence of color results in white (or the background color)

Use the right resolution
• Resolution differs between different media• Resolution differs between different media• Printed products need 300 DPI• Presentations and websites need 96 DPI
• Using the right resolution for your communication will ensure your graphics are clear, and will also help with managing file size
integrationintegration applicationapplication networknetwork
your graphics are clear, and will also help with managing file size

Image types and formats• Raster/bitmap graphics (photos, scans; resolution-dependent)• Raster/bitmap graphics (photos, scans; resolution-dependent)
• TIFF CMYK or RGB; large file size due to lossless compression• JPEG CMYK or RGB; small file size due to lossy compression• GIF RGB; small file size due to less colors; use on websites;
transparency• PNG RGB; relatively new format; transparency• PNG RGB; relatively new format; transparency• EPS CMYK or RGB; usually just for spot color images
• Vector graphics (created using software; resolution-independent)• EPS CMYK or RGB; maintains resolution independence• EPS CMYK or RGB; maintains resolution independence
integrationintegration applicationapplication networknetwork
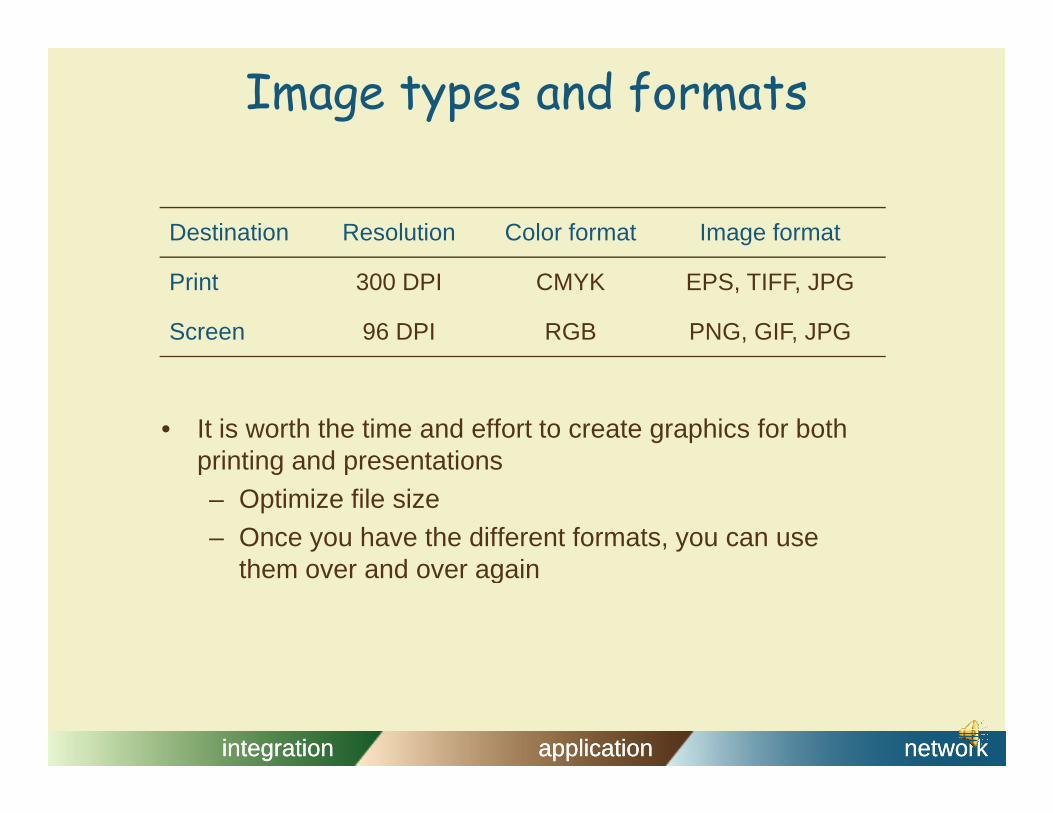
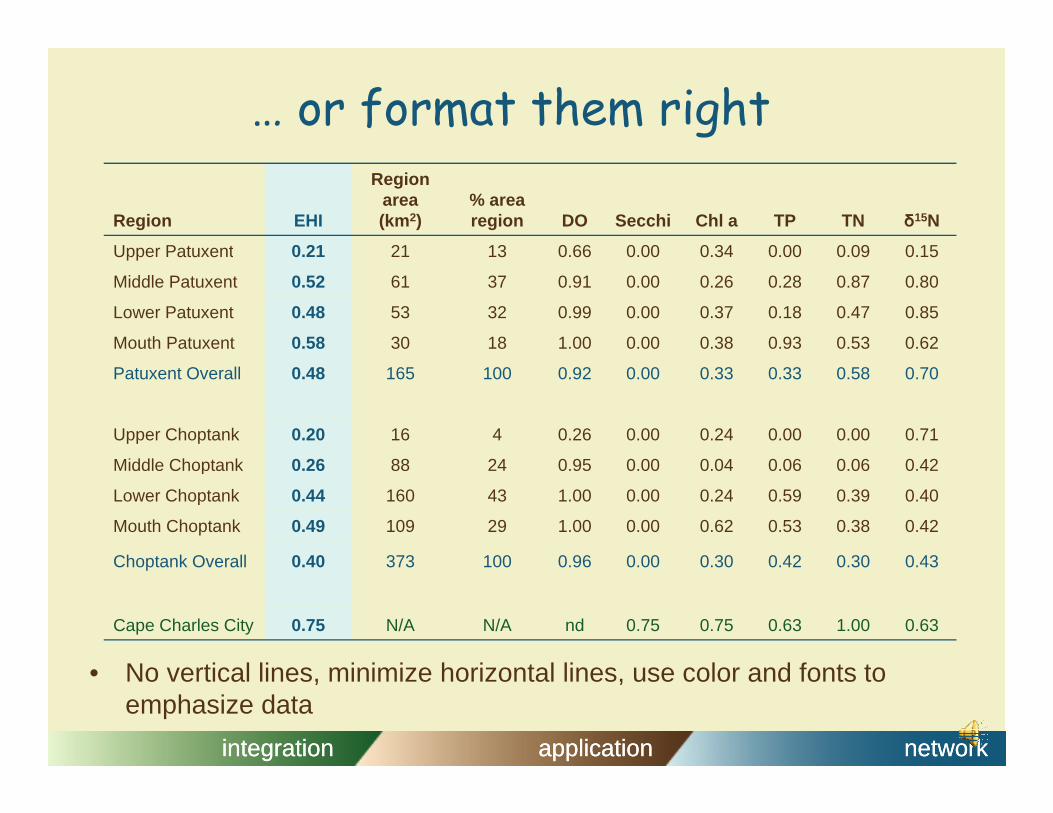
Image types and formats
Destination Resolution Color format Image format
Print 300 DPI CMYK EPS, TIFF, JPG
Screen 96 DPI RGB PNG, GIF, JPG
• It is worth the time and effort to create graphics for both printing and presentationsprinting and presentations– Optimize file size– Once you have the different formats, you can use
them over and over againthem over and over again
integrationintegration applicationapplication networknetwork

Graph formatting makes all the difference
40
Bad (or no) formatting Good formatting
20
30
0
10
20
0
-0.5 0 0.5 1 1.5 2
• Boxes, gridlines and white background are distracting – “chart junk”
• Axes not labelled, y-axis obscuring data
• Transparent background, no boxes or gridlines
• Large labelled axes with units at end
integrationintegration applicationapplication networknetwork
• Boring black and white • Contrasting colors

Graph formatting makes all the difference
Bad (or no) formatting Good formatting
• Boxes, gridlines and white background • Transparent background, no • Boxes, gridlines and white background distracting
• Axes label too technical, too many tick marks on y axis
• Transparent background, no boxes or gridlines
• Large, clearly-labeled axes, with units at end
integrationintegration applicationapplication networknetwork
marks on y axis
• Excel default colors
units at end
• Contrasting colors
Get them right in data software first
• Use colored background box to facilitate color matching
• Remove graph background
• Remove grid lines, borders & unnecessary legends (i.e. if only one data series)
• Clean up extra tick marks and • Clean up extra tick marks and increase intervals between marks
• Label axis with title and units• Label axis with title and units
• Select text and right click to format (subscript, etc)
• Delete colored background• Delete colored background
integrationintegration applicationapplication networknetwork

Try to avoid tables …
Region EHIRegion area
(km2)% area region DO Secchi Chl a TP TN δ15NRegion EHI (km2) region DO Secchi Chl a TP TN δ15N
Upper Patuxent 0.21 21 13 0.66 0.00 0.34 0.00 0.09 0.15
Middle Patuxent 0.52 61 37 0.91 0.00 0.26 0.28 0.87 0.80
Lower Patuxent 0.48 53 32 0.99 0.00 0.37 0.18 0.47 0.85
Mouth Patuxent 0.58 30 18 1.00 0.00 0.38 0.93 0.53 0.62
Patuxent Overall 0.48 165 100 0.92 0.00 0.33 0.33 0.58 0.70
Upper Choptank 0.20 16 4 0.26 0.00 0.24 0.00 0.00 0.71
Middle Choptank 0.26 88 24 0.95 0.00 0.04 0.06 0.06 0.42
Lower Choptank 0.44 160 43 1.00 0.00 0.24 0.59 0.39 0.40
Mouth Choptank 0.49 109 29 1.00 0.00 0.62 0.53 0.38 0.42
Choptank Overall 0.40 373 100 0.96 0.00 0.30 0.42 0.30 0.43Choptank Overall 0.40 373 100 0.96 0.00 0.30 0.42 0.30 0.43
Cape Charles City 0.75 N/A N/A nd 0.75 0.75 0.63 1.00 0.63
integrationintegration applicationapplication networknetwork
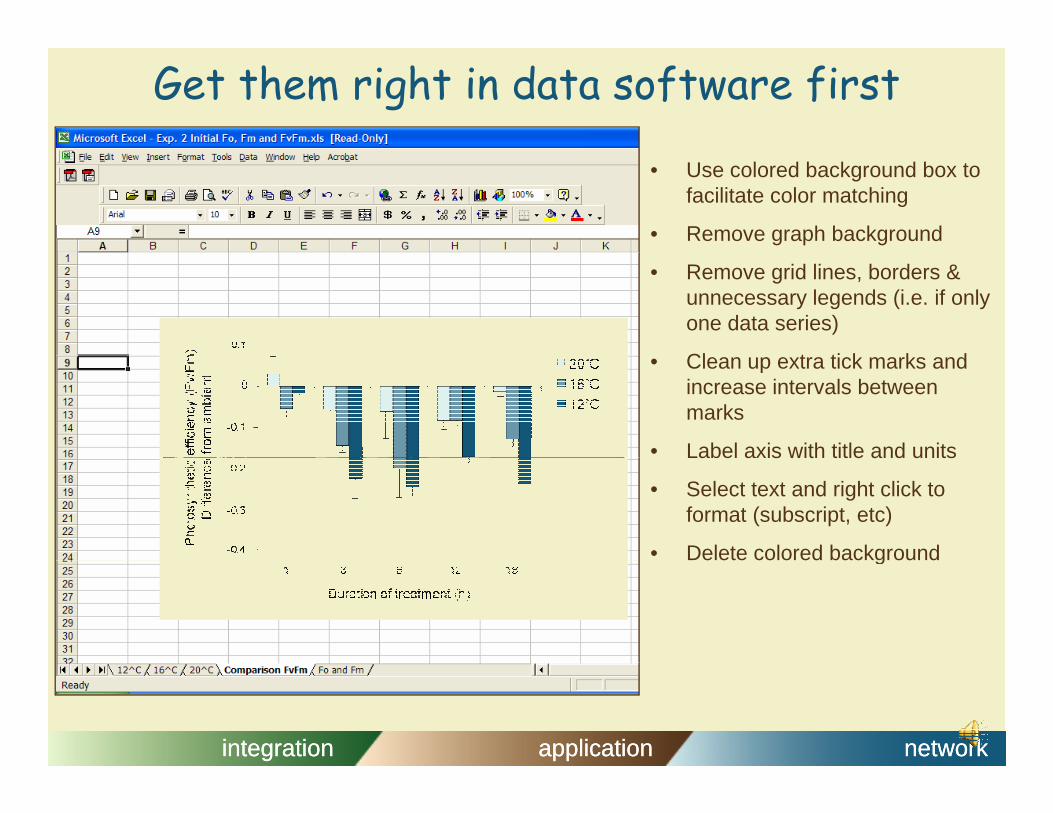
… or format them right
Region EHI
Region area (km2)
% area region DO Secchi Chl a TP TN δ15N
Upper Patuxent 0.21 21 13 0.66 0.00 0.34 0.00 0.09 0.15Upper Patuxent 0.21 21 13 0.66 0.00 0.34 0.00 0.09 0.15
Middle Patuxent 0.52 61 37 0.91 0.00 0.26 0.28 0.87 0.80
Lower Patuxent 0.48 53 32 0.99 0.00 0.37 0.18 0.47 0.85
Mouth Patuxent 0.58 30 18 1.00 0.00 0.38 0.93 0.53 0.62
Patuxent Overall 0.48 165 100 0.92 0.00 0.33 0.33 0.58 0.70
Upper Choptank 0.20 16 4 0.26 0.00 0.24 0.00 0.00 0.71
Middle Choptank 0.26 88 24 0.95 0.00 0.04 0.06 0.06 0.42Middle Choptank 0.26 88 24 0.95 0.00 0.04 0.06 0.06 0.42
Lower Choptank 0.44 160 43 1.00 0.00 0.24 0.59 0.39 0.40
Mouth Choptank 0.49 109 29 1.00 0.00 0.62 0.53 0.38 0.42
Choptank Overall 0.40 373 100 0.96 0.00 0.30 0.42 0.30 0.43Choptank Overall 0.40 373 100 0.96 0.00 0.30 0.42 0.30 0.43
Cape Charles City 0.75 N/A N/A nd 0.75 0.75 0.63 1.00 0.63
• No vertical lines, minimize horizontal lines, use color and fonts to
integrationintegration applicationapplication networknetwork
• No vertical lines, minimize horizontal lines, use color and fonts to emphasize data

Format maps to include more information
integrationintegration applicationapplication networknetwork

A map sequence can show temporal changes
• Improvements or degradation over time can be highlighted by a • Improvements or degradation over time can be highlighted by a series of maps
• Consistent layout allows comparisons• Maps should have scale and compass direction
integrationintegration applicationapplication networknetwork
• Maps should have scale and compass direction• Maps should have a legend that is self contained & legible

Hurricane Isabel surge height
Default Excel You + ExcelDefault Excel You + Excel
You + Illustrator
integrationintegration applicationapplication networknetwork
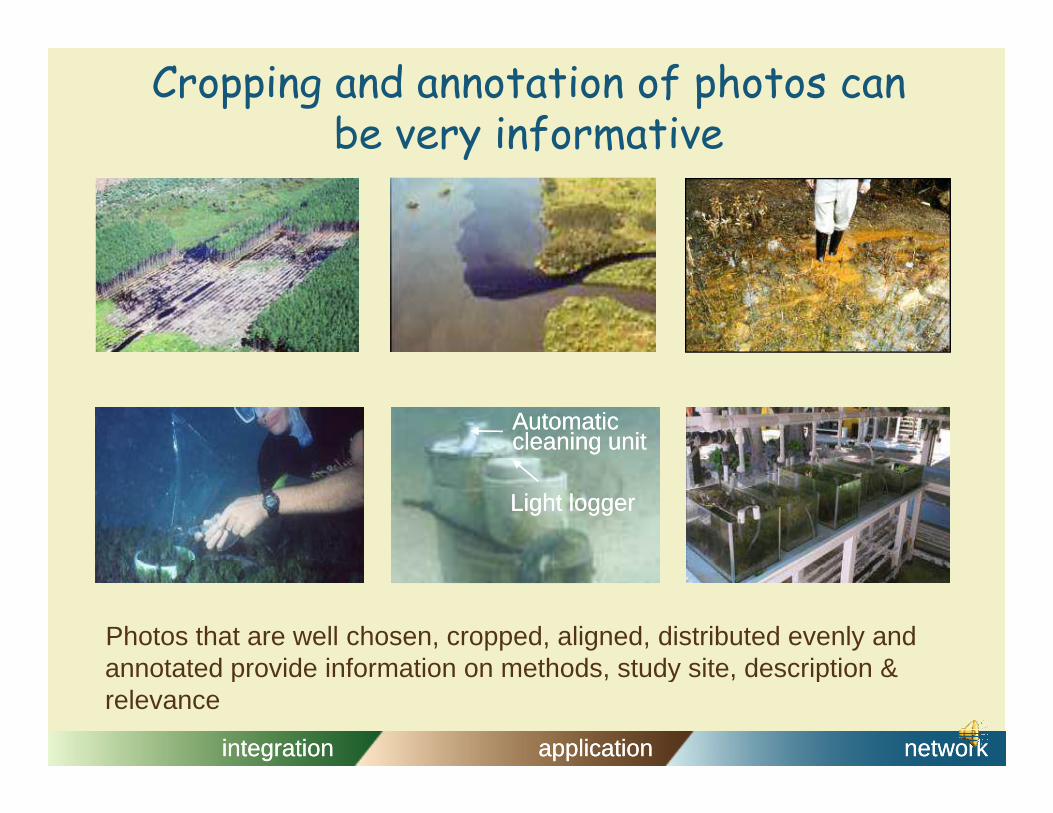
Cropping and annotation of photos can be very informativebe very informative
Automatic Automatic cleaning unitcleaning unit
Light loggerLight logger
Photos that are well chosen, cropped, aligned, distributed evenly and annotated provide information on methods, study site, description &
integrationintegration applicationapplication networknetwork
annotated provide information on methods, study site, description & relevance

Accurate cropping
X X
Crop, align, and label photos carefully
vs
cropping
Lyngbya
X �
Lyngbyainduced
dermatitisLyngbyaLyngbya inducedinduced
dermatitisdermatitis
Clear labeling of photosPhotos that are well chosen, cropped, aligned, distributed evenly and annotated provide information
LyngbyaLyngbyainducedinduced
� �
Clear labeling of photos
X
distributed evenly and annotated provide information on methods, study site, description & relevance
dermatitisdermatitis
Lyngbya induceddermatitis
�
Lesson: bad science communication =
integrationintegration applicationapplication networknetworkPay attention to alignment & overlapping
Lesson: bad science communication = skin lesions

Site selection Community composition & morphology
Combining all visual elements
Simulatedtrails Natural
Natural grazing trails
GRAZEDUNGRAZED
trails
gra
zer
bar
rier
Grazer exclusion
Naturalgrazing
Simulatedgrazing trailsg
raze
rb
arri
er
ungrazedWanga Wallen Banks Amity Banks
‘cultivation grazing’
grazing trails
Grazer exclusion
Nitrogen fixationNatural grazing trails
Nitrogen fixation per m2 Nitrogen fixation perplant biomass
90 2.5
d-1
)
2d
-1)
Nitrogen fixationSimulated grazing trails
30
350.80.9
Nitrogen fixation per m2 Nitrogen fixation perplant biomass
d-1
)
2d
-1)
1618 3
Nitrogen fixationGrazer exclusion
Nitrogen fixation per m2 Nitrogen fixation perplant biomass
d-1
)
2d
-1)
Site
0
30
60
GrazedUngrazedSite
0
0.5
1
1.5
2
GrazedUngrazed
N f
ixat
ion
(m
g N
m-2
N f
ixat
ion
(m
g N
m-2
0
5
10
15
20
25
30
00.10.20.30.40.50.60.70.8
SiteGrazedUngrazed
SiteGrazedUngrazed
N f
ixat
ion
(m
g N
m-2
N f
ixat
ion
(m
g N
m-2
02468
10121416
0
0.5
1
1.5
2
2.5
SiteGrazedUngrazed
SiteGrazedUngrazed
N f
ixat
ion
(m
g N
m-2
N f
ixat
ion
(m
g N
m-2
integrationintegration applicationapplication networknetwork
• Set up color pattern early on and train the audience
Aerobic Anaerobic Aerobic Anaerobic Aerobic Anaerobic
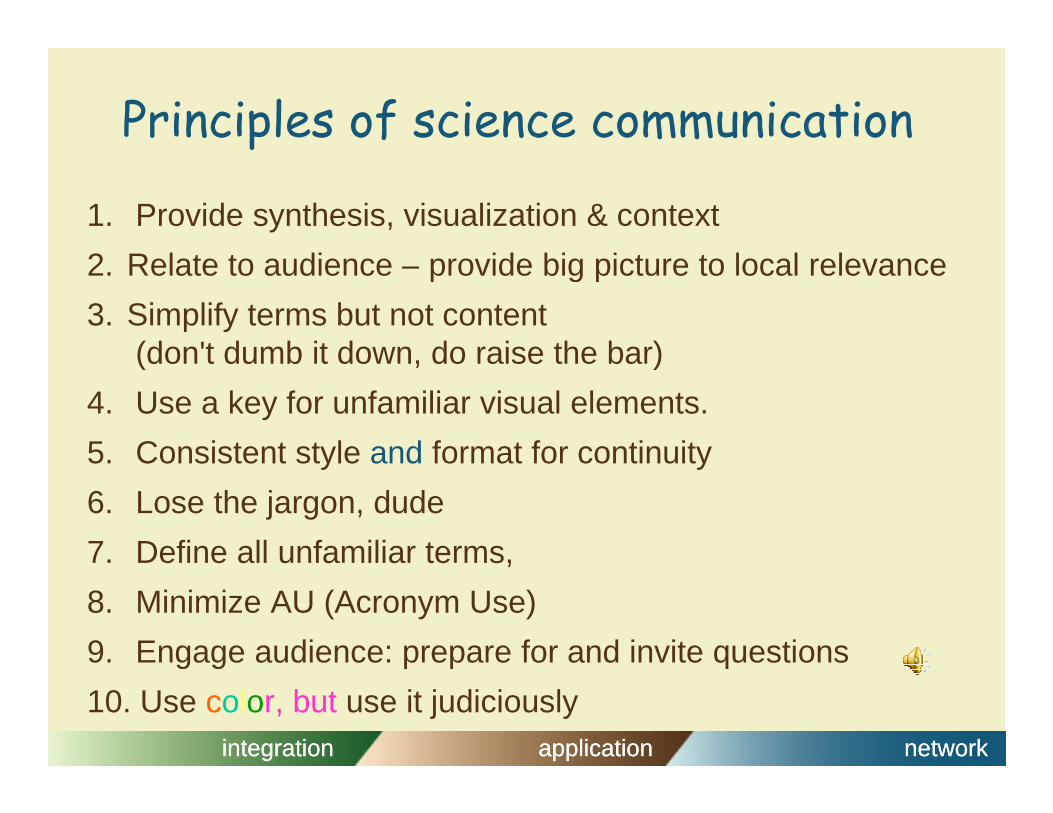
Principles of science communication
1. Provide synthesis, visualization & context
2. Relate to audience – provide big picture to local relevance2. Relate to audience – provide big picture to local relevance
3. Simplify terms but not content(don't dumb it down, do raise the bar)(don't dumb it down, do raise the bar)
4. Use a key for unfamiliar visual elements.
5. Consistent style and format for continuity5. Consistent style and format for continuity
6. Lose the jargon, dude
7. Define all unfamiliar terms, 7. Define all unfamiliar terms,
8. Minimize AU (Acronym Use)
9. Engage audience: prepare for and invite questions
integrationintegration applicationapplication networknetwork
9. Engage audience: prepare for and invite questions
10. Use color, but use it judiciously